21
Agriculture and food Agriculture and food security security Himanshu
| Date post: | 17-Dec-2015 |
| Category: |
Documents |
| Upload: | jonas-mckenzie |
| View: | 213 times |
| Download: | 0 times |

Agriculture and food Agriculture and food securitysecurity
Himanshu

Agrarian Revival since Agrarian Revival since 20052005Signs of revival since 2004-05 after
the worst agrarian crisis during 1997-2004
Agricultural growth rate picked up: more than 3% after 2004-5
Agricultural investment picked upAgricultural credit doubledGood monsoonTOT moving in favour of agriculture

Worrying trends since Worrying trends since 20092009Growth slowed down, less than 0.5%
during 2008-09 and 2009-10Partly drought but are there structural
issuesNot so clear at this stage due to lack of
dataCost of cultivation has gone up sharplyTerms of trade have started moving
against agriculturestagnation in agriculture credit off-takeEnvironmental factors
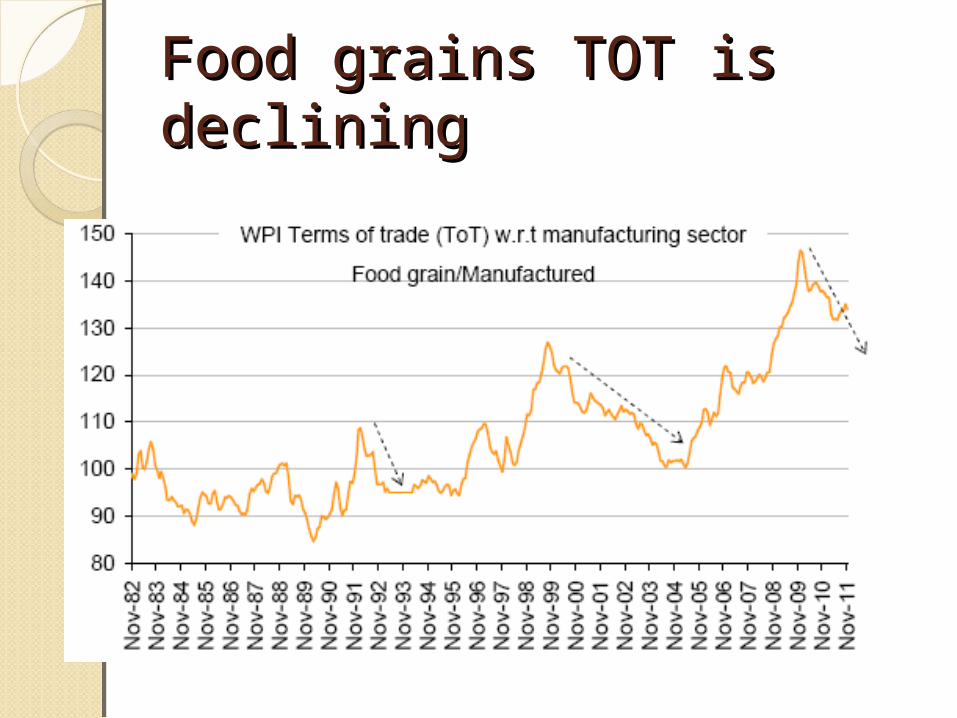
Food grains TOT is Food grains TOT is decliningdeclining

International food prices are International food prices are also decliningalso declining


Cost of cultivation has Cost of cultivation has gone up gone up

Cash cost is increasing since Cash cost is increasing since 2009, mainly labour, diesel 2009, mainly labour, diesel and fertiliserand fertiliser

Fertiliser capacity has Fertiliser capacity has remained stagnantremained stagnant

Imports have increased. Imports have increased. Introduction of NBSIntroduction of NBS

Impact of NBS: distortion in Impact of NBS: distortion in prices prices
Kharif 2010 Kharif 2011
Nitrogen 7.77 8.27
Phosphorous 4.5 3.78
Potassium 1.75 0.77
N:P:K Ratio 4.44:2.57:1 10.78:4.93:1

Was the revival real?Was the revival real?The movement in TOT was led by
increase in MSP and speculative activity
Not enough evidence of this being demand led
Rural demand growth due to NREGA etc appears to be exaggerated
Food price inflation: structural, speculation

What to expect in futureWhat to expect in futureUrea prices likely to be increasedDiesel prices likely to be increasingUnlikely that demand increases
domestically or internationallyInternational prices likely to stay
lowFear of high fiscal deficits likely to
put pressure on agricultural investments as well as food, fertiliser and other subsidies

Food securityFood securityMalnutrition situation is not showing
any signs of significant improvementsHungama report (2011) confirms the
severity of the malnutrition problemsome inference on the basis of calorie
intake dataThe decline in calorie intake between
2005-2010 has been the worstThe Myth of diet diversification

Calorie Intake from NSSOCalorie Intake from NSSO
Rural Urban
1972-73 2266 2107
1983 2221 2089
1993-94 2153 2071
1999-00 2149 2156
2004-05 2047 2020
2009-10 1958 1922


