cted cellulose supported silverphosphate nanostructures as a green photocatalystfor improved photodegradation of RhB dye andindustrial fertilizer effluents†
Neha Tavker,a Umesh K. Gaurb and Manu Sharma *a
The efficiency and reusability of photocatalysts are the dominant factors for their pragmatic use. The visible
light induced semiconductor silver phosphate is a superior photocatalyst effective under visible light but its
stability is still an undiscussed issue. To overcome this stability issue in this present manuscript, eco-friendly
agro-waste extracted cellulose supported silver phosphate nanostructures have been designed for the first
time through a simple chemical process. At first, silver phosphate nanostructures were synthesized by the
co-precipitation method. Then, different weights of cellulose were added to the silver nitrate solution to
form cellulose supported silver phosphate nanostructures. The photodegradation efficiency for each
weight ratio was examined in which the photocatalyst Ag-8 nanostructures showed a high rate
(0.024 min�1) for degradation of Rhodamine B (RhB) using a low intensity tungsten bulb. Real sample
analysis has also been carried out using this photocatalyst for the degradation of industrial fertilizer
effluents. The degradation rate of all the nanostructures was found to be high in comparison to pristine
silver phosphate as well as the extracted bare cellulose. The photocatalytic activity is enhanced because
of the participation of cellulose as a support which makes an interface for silver phosphate and assists it
in delaying the charge recombination period under visible light. To understand the photochemical
reaction of electrons and holes, scavenger studies were also performed.
1. Introduction
As industries have been a major source for the release ofhazardous chemicals or effluents such as drugs, dyes, fertilizers,pesticides, heavy metals, and nitro compounds and their deriv-atives, since then the polluted water has become a major globalissue for the modern society.1 Contamination found today ismainly due to the inaccurate methods of waste disposal whetherit may be medical, industrial or agricultural waste. Thereforethere is an urgent need for researchers to nd new techniques forcomplete removal of the pollutants or to make them non-toxic todischarge them into the groundwater.2 According to a survey,during manufacturing processes, 10–15% of environmentalwater gets polluted with dyes. Some dyes are highly stable andvery difficult to degrade which can cause health hazards tohumans, ora and fauna.3 Over the last couple of decades,research on the multidisciplinary eld of semiconductor photo-catalysts has grown tremendously due to their potential to solve
ity of Gujarat, Sector 30, Gandhinagar
c.in
f Technology, Jalandhar, Punjab, 144011,
tion (ESI) available. See DOI:
0–2884
two major issues related to shortage of renewable energyresources and that of the environmental deterioration and theirvarious applications like bactericidal coatings, photocatalysis,self-cleaning, new generation solar cells, environmental remedi-ation, and hydrogen production and sensing.4–7 However, forachieving success in this eld, it is desirable to develop highperformance semiconducting materials having a wide lightresponse range, efficient charge separation ability and sufficientenergy of charges which can photodegrade dyes and other toxicmolecules.8,9The most reported ones are TiO2 and ZnO, whichurges us to focus on generating novel active visible light semi-conductor photocatalysts.
There are many reports on synthesis of nanostructures viathermal decomposition, co-precipitation and hydrothermalmethods.10,11 PbS, NiO, CuS, Cu2S, Mn3O4 and MgO have beensynthesized by Niasari’s group.11–14 Nanodimensional pores ofzeolite-Y encapsulated with Mn(II), Co(II), Ni(II), Cu(II), and Zn(II)complexes have also been synthesized using Schiff's base.15
Among all other photoactive compounds, n-type semi-conducting silver orthophosphate with a band gap of 2.36 eV(ref. 16) is a promising visible light photocatalyst due to itssuperior capability for photooxidation by producing oxygen bywater splitting in the presence of visible light.17 Also it has beenproven that organic dyes can be degraded more efficiently in its
presence.18 Moreover, to achieve high photodegradation effi-ciency, quick recombination of charge carriers should be avoi-ded as it reduces the quantum efficiency of the photocatalyst. Inorder to enhance the photodegradation efficiency and overcomethe stability issue Ag3PO4-based composites were synthesized byresearchers which include SnO2/Ag3PO4,19TiO2/Ag3PO4,20 AgX/Ag3PO4,21 Fe3O4/Ag3PO4,22 Ag/Ag3PO4 (ref. 23) and so on.Currently, carbon material/Ag3PO4 nanocomposites (carbonquantum dots (CQDs)/Ag3PO4,24 graphene/Ag3PO4 (ref. 25) andCNT/Ag3PO4 (ref. 26)) are being used to improve the photo-degradation efficiency and stability of Ag3PO4. Due to theirexceptional structure and charge transfer ability, CNTs areknown to decrease the electron–hole recombination which inturn increases the photocatalytic activity under visible light.However, non-renewable resources have also been used for thesynthesis of CNTs and this remains a challenge for greensynthesis. Ternary composites with expensive supports are re-ported for the fabrication of versatile photocatalysts. So, therearises a need for fabricating a less toxic and renewable materialas a substitute for CNTs through an economical approach.
The polymeric cellulose, which is available excessively, hasthe potential to resolve the issues related to material biode-gradability, renewability, toxicity, and cost and it may also poseas a better replacement for CNTs. Cellulose is commonly foundin lignocellulosic biomass,27 derived from agricultural leoversand it may add one more feature in the green synthesis. Usingthis agro based waste by rening it with chemical treatments isone of the green routes and cost-effective routes for producingcellulose. Of all the bio-templates, cellulose is the most renew-able biomass which gives a skeletal structure and a possiblesupport for visible light photocatalysts. Moreover, its structurehas plenty of electron rich hydroxyl groups28 which assist theinteraction with the photocatalyst due to the electrostaticinteraction. It can be obtained from a variety of renewablebioresources such as wood, cotton, bacterial cellulose, agricul-tural crops, and agricultural cellulosic wastes.29 Wood andcotton have been considered as the most important source ofcellulosic bres; however, concerns for the environment andshrinking of forest caused by the increased use of woodresources led to growing curiosity in the exploitation of non-wooden cellulosic materials.30–32 Cellulose until now has beenused in the pharmaceutical industry,33 food industry,34 medicalindustry,35 paper industry36 and cosmetics.37 In pharmaceuticsit is used in osmotic drug delivery systems,38 extended andcontrolled release matrices,39 extended and delayed releasecoated dosage forms, bio adhesives, mucoadhesives,40 granulesand tablets as binders.41 Thus, the research on cellulose sup-ported photocatalysts is still inadequate. Hence, cellulosehybrid nanocomposites may be one of the suitable photo-catalysts not only from a green chemistry point of view but alsodue to their high efficiency and better stability.
The main purpose of the present work is to develop anadvanced cellulose/Ag3PO4 visible light photocatalyst byimproving the stability of Ag3PO4. This would include isolatingthe cellulose from waste fruit rinds by using a support, therebyreducing the cost of the material. To the best of our knowledge,a cellulose/Ag3PO4 composite with the cellulose isolated from
fruit rind waste having efficient visible light photocatalyticperformance has not yet been reported. Here we report a cellu-lose supported Ag3PO4 photocatalyst with increased photo-catalytic activity towards Rhodamine B (RhB) dye and industrialeffluents under visible light by improving the reaction rate. Thiswork provides advanced insights and basis of understandingphotocatalytic mechanisms of hybrid photocatalytic systems.Also, it would provide an alternative use of disposed domesticand commercial waste.
2. Materials and methods2.1 Chemicals
Sodium chlorite, potassium hydroxide, sodium hydroxide,glacial acetic acid, silver nitrate, rhodamine B, and p-benzo-quinone were obtained from Sigma Aldrich. Sodium phosphatedibasic, EDTA, 2-propanol and sulphuric acid were obtainedfrom SRL, India.
2.2 Methodology
2.2.1 Isolation of cellulose. 100 g peels, each of differentseasonal fruits (sweet lime, bananas, pomegranates andoranges) were taken and fruit bran was prepared from thesewaste peels by following steps like washing and drying. Thenthe dried sample was ground and sieved using a 60 mm meshsieve. All the further steps were followed as described in ourprevious reported method where 15 g of yellow colored bran wasused to extract cellulose with chemo-mechanical treatments.42,43
The rst step of isolation involved alkali hydrolysis with 5% w/vKOH with stirring for 12–14 h. The suspension was centrifugedand neutralised at each step. The second step involved bleach-ing with 1% NaClO2 at pH-5 at 70 �C. This step de-lignied thelignin present in bran used as the source. The last step was acidhydrolysis with 1% H2SO4 at 80 �C for 1 h. The steps wererepeated accordingly as per need. The nal suspension wascentrifuged, washed, neutralized and stored at 4 �C. Thesuspension was dried by lyophilisation and was utilized furtherfor characterization.44 The extracted cellulose was coded as Cel(steps followed are shown schematically in Fig. S1†).
2.2.2 Synthesis of cellulose supported silver phosphatenanostructures. Further, we synthesized nano-sized silver phos-phate and its cellulose supported silver phosphate nanostructuresby varying the weights of cellulose along with silver phosphate.Silver phosphate (SP) particles were synthesised via the co-precipitation method. For the synthesis of silver phosphatenanostructures, 0.06 M of silver nitrate and 0.02 M of sodiumphosphate were taken in 50 ml of double distilled water each.0.2 g of CTAB (cetyltrimethylammonium bromide) was added tocontrol the size of silver phosphate during the reaction whichaided in the formation of nano-sized particles. This sample wascoded as Ag-0. Cellulose supported silver phosphate nano-structures were prepared by an in situ approach by adding 0.2 g,0.5 g and 0.8 g of cellulose in silver nitrate solution followed by thedropwise addition of disodium hydrogen phosphate to the reac-tion mixture during the reaction along with CTAB. All the asprepared samples were coded as Ag-2, Ag-5 and Ag-8 for cellulose
supported silver phosphate nanostructures. For the ex situmethod a 1 : 1 weight ratio of cellulose and silver phosphate wasadded in 100ml of deionized water and kept in a sonicator for 1 h.The products were collected by repeated washing and centrifu-gation to remove the surfactant. This sample was coded as Ag-1for ex situ cellulose supported silver phosphate nanostructures.
2.3 Characterization methods
Powder X-ray diffraction patterns (PXRD) of all the samples wereobtained using a Panalytical's Xpert Pro with CuKa mono-chromatized incident radiation of wavelength 0.1540 nm oper-ated at a scanning speed of 10� min�1. Measurements werecarried out using an incidence detector at a glancing angle of 2�,in the 2q range from 10� to 60�. The % reectance and band gapof all the photocatalysts were calculated through DiffuseReectance Spectroscopy (DRS) (Jasco 670). Fourier TransformInfrared Spectroscopy (FTIR, Perkin Elmer Sp65) was performedin the range 400–4000 cm�1 to assign the functional group ofthe samples. For surface topography of bran and cellulosesuspensions, Bruker's Multimode 8 Atomic Force Microscope(AFM) was used under tapping mode. Samples used in AFMimaging were prepared on a 1 cm � 1 cm square glass cover slipand dried for 1 h in a vacuum oven. Surface morphology andelemental analysis was carried out on a JEOL JSM 6390LV eldemission scanning electron microscope (FESEM). Dry solidpowder was used for FESEM analysis and the samples were xedon carbon tape followed by gold coating. A Jeol/JEM 2100 wasused to record electron micrographs, selected area diffractionpatterns and HRTEM images. A minute amount of sample wasdispersed in isopropanol and 1 drop of this solution was loadedonto a carbon coated copper grid and allowed to dry beforeanalyzing. Lifetime measurements of the photocatalyst wereperformed using a JOBIN VYON Fluorocube with an excitationwavelength of 390 nm. An Omicron ESCA, Germany was usedfor obtaining XPS spectra. An aluminium anode was used forsamples with an approximate energy of 1486.7 eV. The anglebetween the source and analyzer was 85�. Monochromatic X-rays were used whose resolution was conrmed by an FWHMof 0.6 eV. The Brunauer–Emmett–Teller (BET) specic surfacearea, pore size distribution and pore diameter were obtainedusing adsorption–desorption nitrogen isotherms at a liquidnitrogen temperature of 77 �C using Quanta chrome Nova Winstation equipment. Fluorescence lifetime measurements wereperformed using a JOBIN VYON Fluorocube system with anexcitation wavelength of 390 nm. For these measurements20 mg of samples were dispersed in de-ionized water andanalyzed. A digital pH meter was used to measure the pH valueof samples. The photocatalytic activities of all the catalysts wereexamined by measuring the absorbance of the ltered mixtureusing a UV-Vis spectrophotometer (Shimadzu UV probe 2.52).Fertilizer effluents collected from Kalol, Gandhinagar wereanalyzed using a Waters Xevo G2S Qtof LCMS.
2.4 Photocatalytic measurements
For the photocatalytic degradation of the RhB dye, 25 mg of thecatalyst was added individually in 25 ml of 10 mM of RhB dye
2872 | Nanoscale Adv., 2020, 2, 2870–2884
solution and irradiated under visible light with a tungsten lamp(200 W) until it degraded completely. The light intensitycalculated theoretically was found to be 707 W m�2 witha distance of 15 cm from the light source. The wavelength of thelamp was found to be 301 nm. Aer adding the photocatalystthe dye solution was stirred in the dark for 30 min to ensureadsorption–desorption equilibrium. Then Ag-0 and cellulosewere tested for photodegradation efficiencies. All the othernanostructures were also used to photodegrade the RhB dyeuntil its optimal point.
Further, to understand the roles of photogenerated electronsand holes during the photochemical reaction, different scav-engers such as isopropyl alcohol, benzoquinone and EDTA wereused as hydroxyl, superoxide and hole radical scavengers. Thephotodegradation efficiency of the nest catalyst was analyzedby conducting the experiments individually with 1 mM of eachscavenger. Recyclability and photostability of this catalyst werealso checked for 5 cycles under visible light irradiation for60 min. All these experiments of photocatalysis were performedin triplicate and the kinetic parameters were obtained using anOrigin 8.5 by linear regression analysis.
For the real sample analysis, industrial fertilizer effluentswere collected from a fertilizer industry located at Kalol, Gan-dhinagar and analyzed individually as industrial fertilizer wasteand a mixture of fertilizer waste and the standard dye sample.These sets of samples were examined by using the best photo-catalyst in the presence of visible light. The photocatalyticstudies were performed for 3 sets:
(1) RhB dye + catalyst (Cat) as a standard sample(2) Fertilizer effluent (FE) + catalyst (Cat) as a real sample(3) RhB dye + fertilizer effluent (FE) + catalyst (Cat) as a real
sampleAll 3 sets of samples were kept under a visible light source in
the presence of a catalyst. The blank experiment was also per-formed to check the photodegradation efficiency of the catalyst.
3. Results and discussion3.1 XRD analysis
Powder XRD patterns of the fruit bran and isolated cellulose areshown in Fig. S2† as reported in our previous work also.45 Aconsiderable enhancement was observed in the crystallinity ofcellulose as compared to fruit bran. The diffraction peaks ofcellulose can be indexed to (110) (200) and (004) which are inaccordance with cellulose-I with a monoclinic structure.46 Asdescribed by Zhang and Lynd,47 cellulose possess a crystallinestructure due to van der Waals forces and H-bondingmaking aninterface in it. The XRD results were in accordance with thereports of recent years which conrmed the phase purity ofisolated cellulose.48–50 However, a reasonable amount of thecellulose structure is disordered and oen referred to asamorphous. The crystallinity Index (CI) was measured from theratio of the height of the intense crystalline peak (I002 � IAM) tototal intensity (I002) aer deduction of the background signalmeasured without cellulose. The CI for fruit bran was found tobe 46% which increased to 74% in isolated cellulose aerchemical treatments of hydrolysis and bleaching.
The XRD patterns of samples Ag-0, Ag-2, Ag-5 and Ag-8 areshown in Fig. 1a which conrm the formation of body centredcubic silver phosphate. The diffraction peaks of Ag-0 corre-spond to the planes (110), (200), (210), (211), (220), (321), (400)
and (411) respectively which are in accordance with JCPDS leno. 84-0512.51 All the samples exhibit the formation of a purephase without any impurities. The peaks of cellulose in thenanocomposites are depicted by *C and peaks of silver
ostructures [Ag-0–Ag-8]. (b) SEM-EDX mapping images of cellulose
phosphate as SP. Fig. 1b shows the elemental map of the Ag-8sample, where all the elements have been represented bydifferent colours. It is obvious that silver phosphate nano-particles are dispersed on the cellulose surface. The crystallitesize is the smallest, most likely a single crystal in a powder form.The crystallite size (D) was found using the Scherrers formula(0.9l/b cos q) via an Origin 8.5. The average crystallite size forAg-0, Ag-2, Ag-5 and Ag-8 was found to be 1.31, 9.66, 15.81, and6.39 nm respectively. The larger size of Ag-8 is due to attach-ment of the cellulose crystal.
3.2 FTIR spectroscopy
Fig. S3a in the ESI† displays the FTIR spectra of bran and iso-lated cellulose. The broad peak seen in the range of 3400–3420 cm�1 is attributed to O–H stretching, 2920–2922 cm�1
depicts the]C–H group, 1400–1600 cm�1 is attributed to C]Cstretching, 1050–1060 cm�1 is due to C–O stretching, and 400–700 cm�1 is attributed to C–H bending. Aer the alkali treat-ment a sharp peak at 1550 cm�1 appears due to removal oflignin and hemicellulose.52,53 Fig. S3b† shows the FTIR spectraof Ag-0 to Ag-8 in situ and ex situ cellulose supported Ag3PO4
nanostructures. The two strong bands at 1000 cm�1 and544 cm�1 are attributed to molecular vibration of phosphateions (P–O) which conrms the metal phosphate bonding of thecatalyst.
3.3 Diffuse reectance spectroscopy
The change in the optical properties was analyzed by DRSmeasurements (Fig. S4†). The band gaps of all the catalysts werecalculated using the Kubelka–Munk equation and plotted asa function of absorption co-efficient versus band gap energy ofall the samples. As cellulose has insulating properties it hasa band gap > 4.0 eV which is not clearly seen in the visibleregion. So, the band gap of Ag-0 which was found to be 2.48 eVstarted decreasing (from 2.485 to 2.464 eV) as the amount ofcellulose was increased. The band potentials for Ag-0 wascalculated theoretically which showed 0.21 eV for ECB and2.69 eV for EVB.
3.4 Thermal analysis
Thermal stability was analyzed by thermogravimetric analysis(TGA) for FB, Cel, Ag-0 and Ag-8. Fig. S5† shows TGA and DTA(Differential Thermal Analysis) curves for the above mentionedsamples. Heat was continuously given up to 860 �C which causedthe weight loss. Bleaching and alkali treatments increasesstability of the materials due to the presence of contents likelignin, hemicelluloses, pectin etc. They have lower decompositiontemperatures as compared to cellulose supported nano-structures. The rise in temperature of Ag-0 and Ag-8 is due to thepresence of the ash content. The purpose of the pre-treatment inthe isolation process is to eliminate a certain amount of lignin orminimize the quantity of the wax, hemicellulose, and oils thatcover the brillary outer surface of the wall of the cell. Thedepolymerisation of the native structure of cellulose debrillatesthe outer cellulose micro brils and exposes short length crys-tallites that can be found due to the alkali treatment. The
2874 | Nanoscale Adv., 2020, 2, 2870–2884
bleaching step is also crucial as it removes the cementingmaterial completely from the bre.54 Acid hydrolysis is performedat last which disseminates into the province of lignocellulosicbiomass and easily splits the nanowhiskers.55
3.5 Atomic force microscopy
The change in surface properties of FB and Cel has beenexamined by AFM studies aer isolation and purication steps.Fig. S6† shows AFM images of FB (Fig. S6a and b†) as well ascellulose (Fig. S6c and d†) which was used as a support. As it canbe seen in Fig. S5a,† roughness is more in the sample because ofagglomerated particles. When cellulose is isolated from fruitbran the particle shows less roughness as shown in Fig. S6c.†The average particle size of cellulose through AFM was found tobe �48.2 nm.
3.6 FESEM-EDAX and HRTEM analysis
Themorphology of FB, Cel, and Ag-0 to Ag-8 nanostructures wasanalyzed by FESEM. The FESEM image of fruit bran (FB)(Fig. S7a†) shows irregular shaped particles. Cellulose wasfound to have of a rod shaped morphology with an aspect ratioof �2.6 (Fig. S7b†). The FESEM image and EDAX pattern of Celare shown in Fig. S7c.† The EDAX spectrum also conrms thepresence of carbon and oxygen in the cellulose with a higheramount of oxygen.
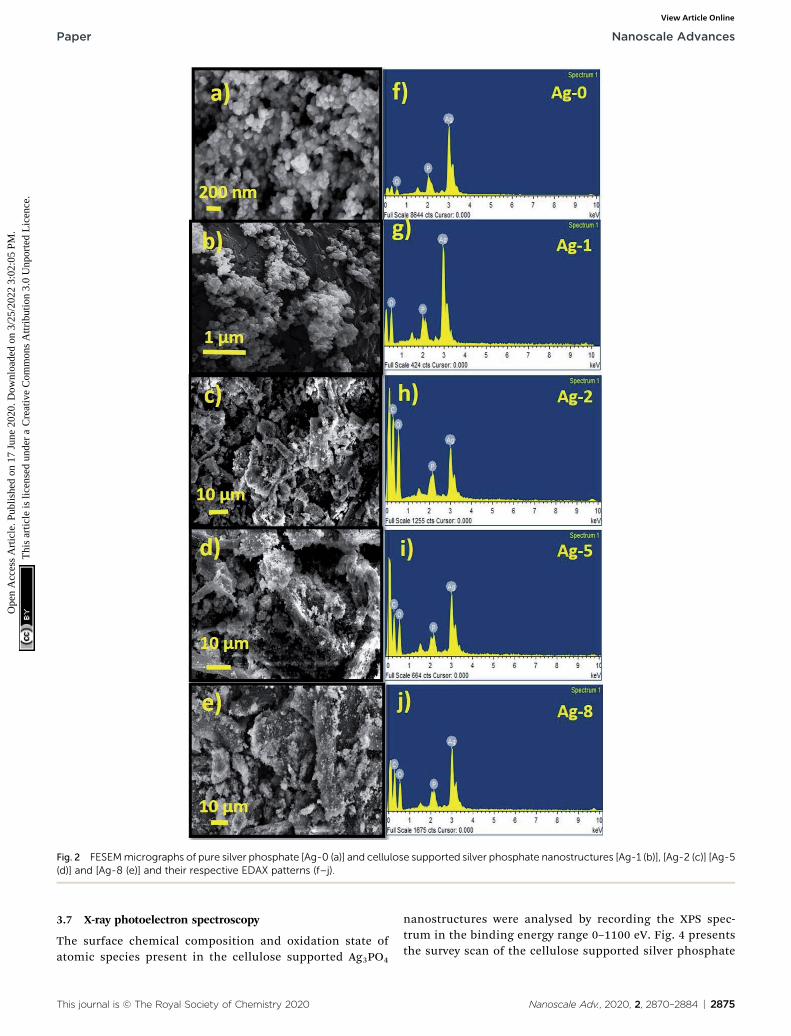
The FESEM image of pure silver phosphate nanoparticles(Ag-0) shows close to a spherical type morphology with anaverage size of 50 nm as shown below (Fig. 2a). Fig. 2f shows theEDAX spectra of Ag-0. In Fig. 2b, ex situ cellulose supportedsilver phosphate nanostructures (Ag-1) are shown. All the in situcellulose supported silver phosphate nanostructures (Ag-2, Ag-5and Ag-8) exhibit spherical shape particles over the surface ofthe rod shaped cellulose support (Fig. 2c–e). Silver phosphatenanoparticles present on the rod shaped cellulose have anaverage particle size of 25 nm. The EDAX pattern of all thecellulose supported nanostructures also assures the existence ofthe elements; mainly carbon, oxygen, phosphorous and silver inthe Ag-1, Ag-2, Ag-5, and Ag-8 nanostructures (Fig. 2f–j).
Fig. 3 shows TEM and HRTEM images of Cel, Ag-0 and Ag-8along with their respective SAED patterns. Cellulose particlesare micron sized and also undergoe electron collision. So, themorphology of particles is not very clear from TEM images atthis scale bar. But the HRTEM image shows a brous typestructure. Fig. 3b shows the size of cellulose which rangesbetween 88 and 95 nm in diameter. Fig. 3c shows diffused ringswhich conrm the polycrystalline nature of the cellulose. TheTEM image of the best photocatalyst (Ag-8) shows a sphericalparticle with a size range of �25–30 nm (Fig. 3d). Pure silverphosphate nanoparticles conrmed the specic planes alongwith the highly polycrystalline nature through HRTEM andSAED patterns with the (200) and (211) planes respectively(Fig. 3e and f). Fig. 3g shows spherical particles �25–30 nm onthe surface of cellulose. The HRTEM image shows the (211)plane of the silver phosphate and Fig. 3i shows the SAEDpattern due to the polycrystalline nature of the silver phosphatein the Ag-8 nanostructure.
Fig. 2 FESEMmicrographs of pure silver phosphate [Ag-0 (a)] and cellulose supported silver phosphate nanostructures [Ag-1 (b)], [Ag-2 (c)] [Ag-5(d)] and [Ag-8 (e)] and their respective EDAX patterns (f–j).
Paper Nanoscale Advances
Ope
n A
cces
s A
rtic
le. P
ublis
hed
on 1
7 Ju
ne 2
020.
Dow
nloa
ded
on 3
/25/
2022
3:0
2:05
PM
. T
his
artic
le is
lice
nsed
und
er a
Cre
ativ
e C
omm
ons
Attr
ibut
ion
3.0
Unp
orte
d L
icen
ce.
View Article Online
3.7 X-ray photoelectron spectroscopy
The surface chemical composition and oxidation state ofatomic species present in the cellulose supported Ag3PO4
nanostructures were analysed by recording the XPS spec-trum in the binding energy range 0–1100 eV. Fig. 4 presentsthe survey scan of the cellulose supported silver phosphate
Fig. 3 TEM image, and HRTEM and SAED patterns of cellulose (Cel) [a–c], silver phosphate (Ag-0) [d–f] and cellulose supported silver phosphatenanostructures (Ag-8) [g–i].
Nanoscale Advances Paper
Ope
n A
cces
s A
rtic
le. P
ublis
hed
on 1
7 Ju
ne 2
020.
Dow
nloa
ded
on 3
/25/
2022
3:0
2:05
PM
. T
his
artic
le is
lice
nsed
und
er a
Cre
ativ
e C
omm
ons
Attr
ibut
ion
3.0
Unp
orte
d L
icen
ce.
View Article Online
and it shows the peaks related to Ag, P, C and O withoutother impurity elements. The high-resolution spectra ofeach element i.e. Ag 3d, P 2p, C 1s and O 1s respectively, areshown in different panels of Fig. 4. Two peaks in the P 2pspectrum (panel (a)) the smaller one at 130.02 eV and theother larger one at 133.65 are associated with the P–C bonddue to the cellulose interaction56 and the presence of phos-phorus in the phosphate group of Ag3PO4 (ref. 57). Ascompared to the reported data for pure Ag3PO4, an addi-tional small peak (130.02 eV) attributed to the interaction ofcellulose with Ag3PO4 nanostructures can be observed. TheXPS spectra of C 1s (panel (b)) depict three peaks located at
2876 | Nanoscale Adv., 2020, 2, 2870–2884
284.8 eV, 286.2 and 286.4 eV. The peak at 284.8 eV is typicalof the C–H bond in cellulose58 while peaks at 286.2 and286.4 eV are associated with C–O bonding and ensure thecellulose–Ag3PO4 interaction.59 Panel (c) describes the XPSspectrum of the Ag 3d core level and reveals two peaks, one at367.9 (3d5/2) and the other at 373.9 eV (3d3/2) with a spinorbit separation of 6 eV which conrms the presence of silverin the Ag+ state.60 The O 1s spectrum (panel (d)) showsa sharp peak associated with one small shoulder peak ata lower binding energy and de-convoluted into two peaks bytting. The smaller peak at a binding energy 530.56 eV maybe due to the non-bridging (P]O) oxygen atoms. From the
Fig. 4 XPS spectra of the Ag-8 photocatalyst (a) P 2p (b) C 1s (c) Ag 3d (d) O 1s and (e) survey scan.
Paper Nanoscale Advances
Ope
n A
cces
s A
rtic
le. P
ublis
hed
on 1
7 Ju
ne 2
020.
Dow
nloa
ded
on 3
/25/
2022
3:0
2:05
PM
. T
his
artic
le is
lice
nsed
und
er a
Cre
ativ
e C
omm
ons
Attr
ibut
ion
3.0
Unp
orte
d L
icen
ce.
View Article Online
absence of a peak at a binding energy 528.6 eV it can beconcluded that there is no oxidation of Ag to Ag2O.61 Anotherpeak observed at a binding energy 532.34 eV can be assignedto P–O–Ag bonding in Ag3PO4.62
a process known as uorescence. The lifetime of a photocatalystin its lowest excited singlet state usually ranges from a fewpicoseconds up to nanoseconds. Here, for lifetime measure-ments, Time-Correlated Single Photon Counting (TCSPC) wasused for data acquisition. Fig. 5a shows the time resolvedspectra of Cel, Ag-0 and Ag-8. Aer tting lifetime data, decayparameters consisting of average lifetime and chi-square valuesof Cel, Ag-0, and Ag-8 are shown in Table 1. It is evident from thetable that the presence of cellulose in the Ag3PO4 photocatalystincreased the average lifetime from 24 to 92 ns due to increase
2878 | Nanoscale Adv., 2020, 2, 2870–2884
in the lifespan of electron and holes by development of aninterface between Ag3PO4 and cellulose by delaying the chargerecombination period to assist in efficient visible lightphotocatalysis.
BET theory aims to explain the physical adsorption of gasmolecules on a solid surface and serves as the basis for animportant analysis technique for the measurement of thespecic surface area of a material. Fig. 5b shows BJH pore sizedistributions of Cel, Ag-0 and Ag-8 nanostructures as a meso-porous behaviour of materials is observed. The surface areaanalysed by BET and BJH methods and pore size distributionsand the pore volumes of Cel, Ag-0 and Ag-8 photocatalysts aresummarized in Table 2. The average pore size of Cel, Ag-0 andAg-8 was found to be �1.6 nm, �1.9 nm and �1.7 nm respec-tively. Cellulose isolated from fruit bran showed a BJH surfacearea of �83 m2 g�1 while that of Ag-0 was found to be �22 m2
g�1. The best catalyst (Ag-8) had the highest surface area of�117 m2 g�1. The improvement in the surface area of Ag-8 isdue to the presence of the cellulose support. The pore volume ofAg-8 is also greater (0.168) as compared to that of Ag-0 and Cel.Thus, the time resolved spectra proved the fast decay of Ag-0 and Cel whereas the lifetime of Ag-8 was found to be greater.
3.9 Photocatalytic studies
To check the photoactivity of all the catalysts, a model RhB dyewas used under a visible light source of 200 W. 25 mg catalyst in25 ml of dye solution was taken to check the photodegradationof RhB. First, the absorption of the catalyst was examined bykeeping under dark conditions to maintain the equilibrium of
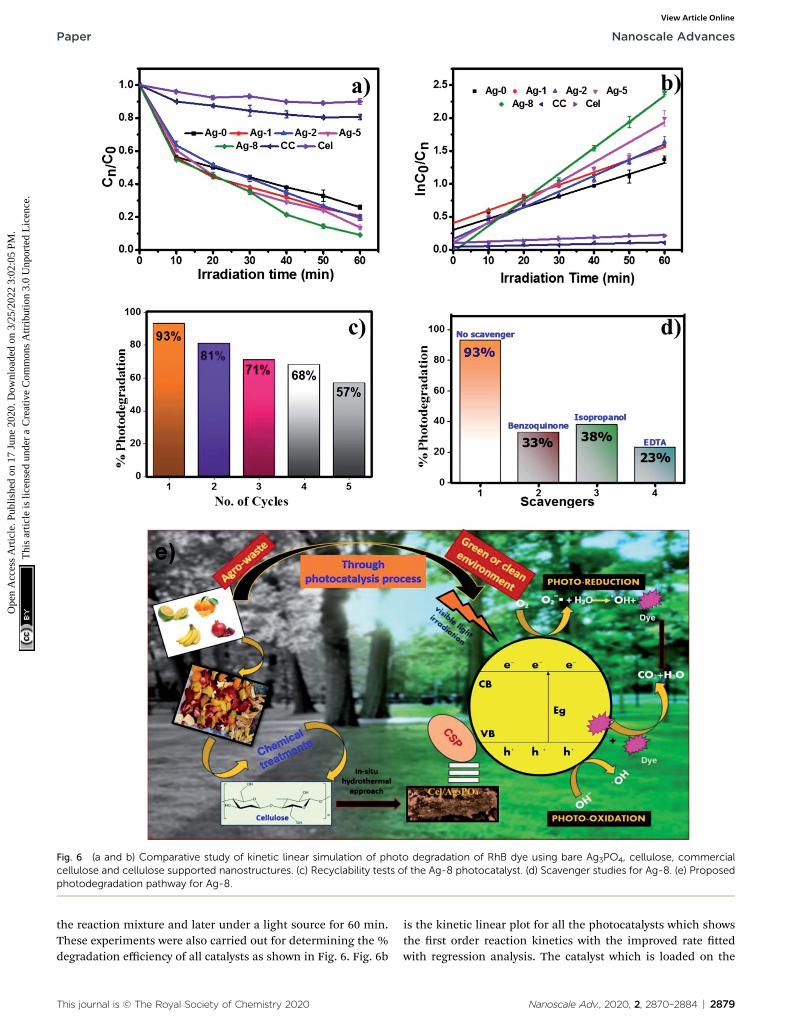
Fig. 6 (a and b) Comparative study of kinetic linear simulation of photo degradation of RhB dye using bare Ag3PO4, cellulose, commercialcellulose and cellulose supported nanostructures. (c) Recyclability tests of the Ag-8 photocatalyst. (d) Scavenger studies for Ag-8. (e) Proposedphotodegradation pathway for Ag-8.
Paper Nanoscale Advances
Ope
n A
cces
s A
rtic
le. P
ublis
hed
on 1
7 Ju
ne 2
020.
Dow
nloa
ded
on 3
/25/
2022
3:0
2:05
PM
. T
his
artic
le is
lice
nsed
und
er a
Cre
ativ
e C
omm
ons
Attr
ibut
ion
3.0
Unp
orte
d L
icen
ce.
View Article Online
the reaction mixture and later under a light source for 60 min.These experiments were also carried out for determining the %degradation efficiency of all catalysts as shown in Fig. 6. Fig. 6b
is the kinetic linear plot for all the photocatalysts which showsthe rst order reaction kinetics with the improved rate ttedwith regression analysis. The catalyst which is loaded on the
cellulose remains the same. Only cellulose weights have beenvaried. So the main factor increasing the rate with a highamount of cellulose is attributed to enhanced charge separationwhich makes an interface between silver phosphate and cellu-lose. Ag-8 is the optimal point where the maximum interfaceswere developed and the maximum photocatalytic rate wasobserved. The other higher amounts of cellulose were also usedfor photocatalysis which showed similar photocatalytic rates,but Ag-8 is the best observed catalyst amongst all.
3.9.1 Photocatalytic stability. Apart from the photo-degradation efficiency of the catalysts, stability is also consid-ered one of the important factors. Hence, the recyclability ofcatalysts was checked for 5 consecutive cycles same as the otherphotodegradation reaction sets (25 mg catalyst in 25 ml of RhBdye solution). Aer every cycle, the photocatalysts were sepa-rated, washed and dried for further use. The degradation effi-ciency of the Ag-8 catalyst decreased by only 36% aer 5repetitive cycles. This can be attributed to cellulose in thecatalyst being utilized in each photodegradation cycle. Theamount of catalyst also gets reduced by weight (�2–3 mg) ateach step in work-up activities which in turn reduces the %degradation efficiency. These results are also supported byscavenger studies and the inhibited photodegradation of RhB isshown as compared to that with a ‘no scavenger system’
(Fig. 6d).Ag-8 nanostructures showed 96% degradation in 60 min.
This result suggested that the photodegradation rate of the Ag-8catalyst was increased by twice that of Ag-0. Commercial cellu-lose (CC) was also tested to analyse the photodegradation effi-ciency for RhB dye. Ex situ (Ag-1) and in situ samples with a lowamount of cellulose [Ag-2 to Ag-5] did not show photocatalysisup to the mark, and hence Ag-8 was chosen as the best photo-catalyst. The rate constant value and half-life of the catalysts are
Table 4 Composites of cellulose used in the literature for photocatalyti
Composites PollutantDegtime
Cellulose–Ag@Agcl MO dye 180Nano TiO2/cellulose acetate MO dye 55 mAnatase titania/cellulose MB dye 35 mTiO2/cellulose Phenol 140Nano ZnO/GO/NC Ciprooxacin 120ZnO/cellulose nanobers RhB dye 24 h
2880 | Nanoscale Adv., 2020, 2, 2870–2884
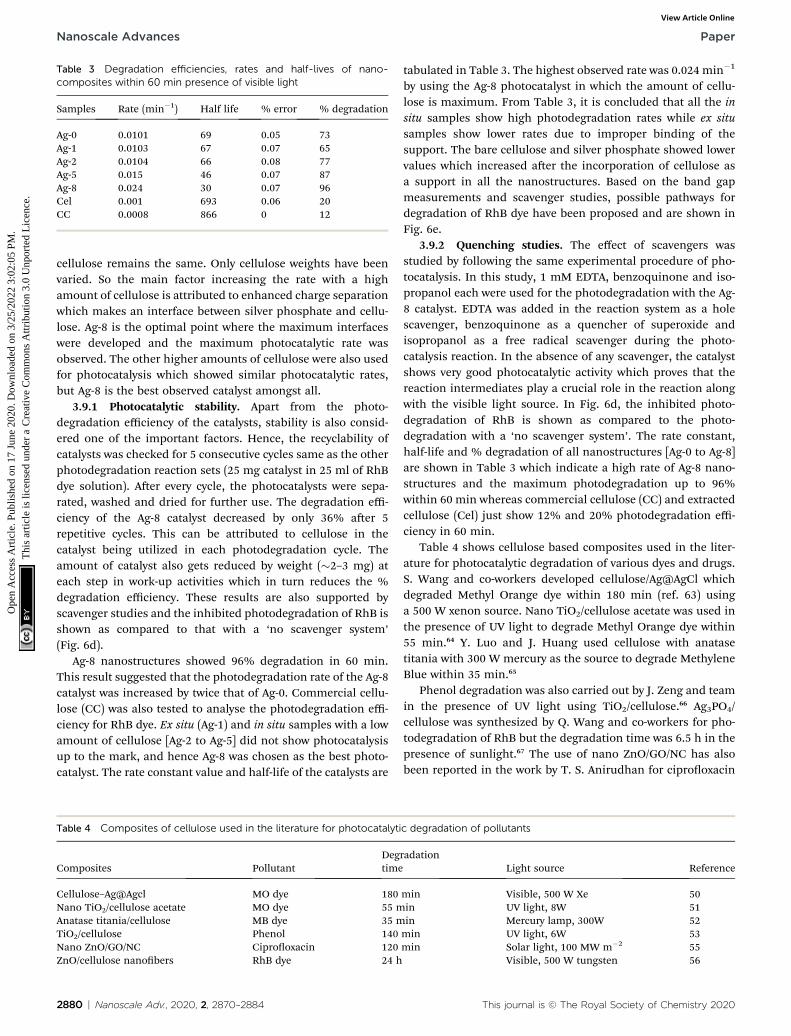
tabulated in Table 3. The highest observed rate was 0.024 min�1
by using the Ag-8 photocatalyst in which the amount of cellu-lose is maximum. From Table 3, it is concluded that all the insitu samples show high photodegradation rates while ex situsamples show lower rates due to improper binding of thesupport. The bare cellulose and silver phosphate showed lowervalues which increased aer the incorporation of cellulose asa support in all the nanostructures. Based on the band gapmeasurements and scavenger studies, possible pathways fordegradation of RhB dye have been proposed and are shown inFig. 6e.
3.9.2 Quenching studies. The effect of scavengers wasstudied by following the same experimental procedure of pho-tocatalysis. In this study, 1 mM EDTA, benzoquinone and iso-propanol each were used for the photodegradation with the Ag-8 catalyst. EDTA was added in the reaction system as a holescavenger, benzoquinone as a quencher of superoxide andisopropanol as a free radical scavenger during the photo-catalysis reaction. In the absence of any scavenger, the catalystshows very good photocatalytic activity which proves that thereaction intermediates play a crucial role in the reaction alongwith the visible light source. In Fig. 6d, the inhibited photo-degradation of RhB is shown as compared to the photo-degradation with a ‘no scavenger system’. The rate constant,half-life and % degradation of all nanostructures [Ag-0 to Ag-8]are shown in Table 3 which indicate a high rate of Ag-8 nano-structures and the maximum photodegradation up to 96%within 60 min whereas commercial cellulose (CC) and extractedcellulose (Cel) just show 12% and 20% photodegradation effi-ciency in 60 min.
Table 4 shows cellulose based composites used in the liter-ature for photocatalytic degradation of various dyes and drugs.S. Wang and co-workers developed cellulose/Ag@AgCl whichdegraded Methyl Orange dye within 180 min (ref. 63) usinga 500 W xenon source. Nano TiO2/cellulose acetate was used inthe presence of UV light to degrade Methyl Orange dye within55 min.64 Y. Luo and J. Huang used cellulose with anatasetitania with 300 W mercury as the source to degrade MethyleneBlue within 35 min.65
Phenol degradation was also carried out by J. Zeng and teamin the presence of UV light using TiO2/cellulose.66 Ag3PO4/cellulose was synthesized by Q. Wang and co-workers for pho-todegradation of RhB but the degradation time was 6.5 h in thepresence of sunlight.67 The use of nano ZnO/GO/NC has alsobeen reported in the work by T. S. Anirudhan for ciprooxacin
c degradation of pollutants
radationLight source Reference
min Visible, 500 W Xe 50in UV light, 8W 51in Mercury lamp, 300W 52min UV light, 6W 53min Solar light, 100 MW m�2 55
degradation.68 A tungsten 500 W visible light source was used todegrade RhB dye with ZnO/cellulose nanobers with a degra-dation time 24 h.69 Composites with Ag3PO4 with loading andembedding of various compounds including graphene oxide areshown in Table 5. Q. Wang and co-workers71 showed
Table 5 Composites of silver phosphate reported in the literature with
Composites Pollutant
Ag3PO4/GO TBBAAg3PO4/cellulose RhBAg–SnO2 QD on Ag3PO4 CarbamazepineGraphdiyne/Ag3PO4 MBAg3PO4/GO/chitosan RhB, bisphenol-ABiVO4/RGO/Ag3PO4 4-Nitrophenol, RhBAg3PO4/MWCNTs@PANI RhBAg3PO4/SBF/GO Phenol, bisphenol-AAg3PO4/GO MBOur work RhB, fertilizer effluent
Fig. 7 (a) Photodegradation of fertilizer effluents using Ag-8 nanostructu8 nanostructures. (c) Bar diagram of photocatalytic degradation of differ
photocatalytic degradation of RhB under sunlight with cellulosehydrogels, whereas our work focuses on isolation of cellulose byreusing waste. Zurui D. and team72 showed in situ growth of Ag–SnO2 quantum dots on Ag3PO4 for photocatalytic degradation ofcarbamazepine.
varied light sources
Light source Reference
35 W Xe 70Sunlight 71Sunlight 72500 W Xe 73210 W Xe arc 74300 W Xe 75300 W Xe 7635 W Xe 77350 W Xe 78200 W tungsten —
res. (b) Photodegradation of the fertilizer effluent and RhB dye with Ag-ent sets. (d) Colour change before and after photodegradation.
Thus, owing to economic and cost constraints, we havedeveloped a cellulose supported silver phosphate photocatalystvia a hydrothermal route. Also waste fruit peels were used forextracting cellulose which paved a green route for the synthesis.
Fig. 8 LCMS spectra of the FE, RhB and FE + RhB + Cat.
3.10 Real sample analysis using standard and industrialfertilizer effluents
Although fertilizers are useful for good crop production and inthe agriculture eld, the release of fertilizer effluents fromindustrial units directly or indirectly affects groundwater whichis considered fatal and toxic for ora, fauna and humans.Wastewater from fertilize plants comprises heavy metals, sus-pended solids, ammonia, nitrates, and many organics.79,80 Inthe presence of visible light, this type of fertilizer effluent can betreated efficiently by photocatalysts.
In this study, the best photocatalyst (Ag-8) was tested for thedegradation of fertilizer effluent as well as standard dye withfertilizer effluents. The photocatalyst showed efficiency up to52% for the fertilizer effluent (FE) in 60 min, whereas standarddye (RhB) with fertilizer effluents (FEs) showed up to 86%photodegradation. This shows that the fertilizer containsremnants of urea and ammonia which are removed up to 52%in the presence of this catalyst under visible light within 60min.The UV photodegradation plots are shown in Fig. 7a andb separately. Fig. 7a shows the UV absorption peak at 205 nmwhich can be attributed to urea and its derivatives.81,82 Fig. 7bshows a low intensity UV absorption peak at 565 due to RhB thatwas degraded up to �86%. Fig. 7c shows the bar diagram ofphotodegradation efficiency for all sets of samples. Dye in thepresence of catalyst shows 96% photodegradation, the FE in thepresence of catalyst shows 52% photodegradation and RhB + FE+ Cat showed 86% photodegradation. Fig. 7d shows the colourchange of the original effluent and dye aer the photo-degradation experiment. The fertilizer effluent was colourless asevident in the gure but had impurities along with the presenceof suspended solids. These executed experiments were thenanalysed by LCMS spectroscopy and it was inferred that in thestandard dye RhB, the concentration of the as prepared dye isvery high as shown in Fig. 8 which is close to 99%. This gives theintense broad peak at retention times (RTs) 5.87 and 6.60 min.The FE also had a peak at a RT of 6.83 which can be attributed totrace amounts of urea and ammonia. When these samples weretreated with the Cel/Ag3PO4 photocatalyst (Ag-8), the recordedLCMS spectra showed a decrease in the peak intensity whichwas found up to 5–10%. This clear evidence demonstrates thatthe Ag-8 photocatalyst is highly efficient not only for standarddye pollutant but also for the fertilizer effluent sample.
3.10.1 Photodegradation mechanism. Here, RhB was usedas a model pollutant to evaluate the degradation efficiencies ofcellulose supported silver phosphate nanostructures. Theadsorption equilibrium is evaluated up to 30 min in which Ag-0 showed less adsorption ability in the dark whereas, Ag-8showed higher adsorption ability. The fertilizer effluent mixedwith RhB dye also showed positive results for the successfulphotodegradation using the Ag-8 photocatalyst. When visiblelight is incident on Ag3PO4, electrons are generated at CB (0.21
2882 | Nanoscale Adv., 2020, 2, 2870–2884
eV) and at VB (2.69 eV). Due to the less band gap width andelectrical conductivity, cellulose would serve as an acceptor ofphotoexcited electrons. Hence electron transfer from Ag-8 tocellulose counterattacks it from combining with Ag-8. Thereduction of Ag+ to metallic Ag takes place during the photo-degradation leading to increased stability. Cel reacts with O2
adsorbed on its surface which continually oxidizes the adsorbeddyes by releasing compounds like H2O and CO2. Photo-generated holes with strong oxidizing power decompose RhB/effluents into inorganic molecules.
4. Conclusion
Isolation of cellulose from waste fruit peels was carried out andwas further used to design cellulose supported nanostructures.The obtained cellulose from the waste peels showed a 28%higher crystallinity index due to the acid treatment. Cellulosesupported silver phosphate nanostructures were successfullydeveloped by an in situ approach by altering the amounts ofcellulose. All photocatalysts followed pseudo rst order kineticswith the maximum observed rate of 0.024 min�1 within 60 minleading to 96% photodegradation. Also, the fertilizer effluent(FE) was tested to check the photodegradation efficiency. TheRhB dye with Cel/Ag3PO4 showed 96% degradation efficiency,while the FE and the mixture of FE + RhB showed 52% and 86%degradation efficiency respectively. Disadvantages related to thecompound Ag-8 can arise only in rare cases that are concernedwith obtaining yield of isolated cellulose. A huge quantity ofwaste is needed to obtain few grams of cellulose aer lyophili-sation. If the pre-treatment steps in extracting cellulose are notexecuted properly, it may create a hindrance in photo-degradation experiments which may result in insoluble pectin
and hemicelluloses resisting photoactivity. Thus, celluloseacted as an environmentally compatible, economical, and bestnatural support to be incorporated for improved photostablesemiconducting nanostructure formation. By varying the sour-ces of waste for isolating cellulose, one can obtain its differentmorphologies and sizes which can create composites withmultiple semiconducting materials for fabricating novel pho-tocatalysts and treating real samples from industries.
Conflicts of interest
There is no conict of interests to declare.
Acknowledgements
The authors would like to thank the UGC for fellowship, CUGfor infrastructure and STIC Kerala, INST Mohali, IIT-Roorkee,IIT-Madras, MNIT Jaipur, SAIF-AIMMS Delhi, and SAIF Punjabfor the characterization facilities throughout the work.
References
1 J. G. Mahy, L. Tasseroul, A. Zubiaur, J. Geens, M. Brisbois,M. Herlitschke, R. Hermann, B. Heinrichs andS. D. Lambert, Microporous Mesoporous Mater., 2014, 197,164–173.
2 A. B. RanguMagar, B. P. Chhetri, A. Parameswaran-Thankam, F. Watanabe, A. Sinha, J.-W. Kim, V. Saini,A. S. Biris and A. Ghosh, ACS Omega, 2018, 3, 8111–8121.
3 X. Guan, S. Lin, J. Lan, J. Shang, W. Li, Y. Zhan, H. Xiao andQ. Song, Cellulose, 2019, 26, 7437–7450.
4 H. Tong, S. Ouyang, Y. Bi, N. Umezawa, M. Oshikiri and J. Ye,Adv. Mater., 2011, 24, 229–251.
5 X. Chen, S. Shen, L. Guo and S. S. Mao, Chem. Rev., 2010, 110,6503–6570.
6 L. Zhang, R. Dillert, D. Bahnemann and M. Vormoor, EnergyEnviron. Sci., 2012, 5, 7491–7507.
7 J. A. Byrne, P. S. M. Dunlop, J. W. J. Hamilton, P. Fernandez-Ibanez, I. Polo-Lopez, P. K. Sharma and A. S. M. Vennard,Molecules, 2015, 20, 5574–5615.
8 H. J. Kim, D. H. K. Jackson, J. Lee, Y. Guan, T. F. Kuech andG. W. Huber, ACS Catal., 2015, 5, 3463–3469.
9 X. Fu, J. Wang, D. Huang, S. Meng, Z. Zhang, L. Li, T. Miaoand S. Chen, ACS Catal., 2016, 6, 957–968.
10 M. Sabet, M. Salavati-Niasari and O. Amiri, Electrochim. Acta,2014, 117, 504–520.
11 F. Mohandes, F. Davar andM. Salavati-Niasari, J. Phys. Chem.Solids, 2010, 71, 1623–1628.
12 M. Salavati-Niasari, D. Ghanbari and M. R. Loghman-Estarki, Polyhedron, 2012, 35, 149–153.
13 F. Motahari, M. R. Mozdianfard, F. Soovand andM. Salavati-Niasari, RSC Adv., 2014, 4, 27654–27660.
14 F. Davar, M. Salavati-Niasari, N. Mir, K. Saberyan,M. Monemzadeh and E. Ahmadi, Polyhedron, 2010, 29,1747–1753.
15 M. Salavati-Niasari, Chem. Lett., 2005, 34, 1444–1445.
43 J. I. Moran, V. A. Alvarez, V. P. Cyras and A. Vazquez,Cellulose, 2008, 15, 149–159.
44 N. Tavker, U. Gaur and M. Sharma, J. Environ. Chem. Eng.,2020, 104027.
45 N. Tavker and M. Sharma, J. Environ. Manage., 2020, 255,109906–109918.
46 P. Zugenmaier, Prog. Polym. Sci., 2001, 26, 1341–1417.47 Y.-H. P. Zhang and L. R. Lynd, Biotechnol. Bioeng., 2004, 88,
797–824.48 G. N. Juarez-Luna, E. Favela-Torres, I. R. Quevedo and
N. Batina, Carbohydr. Polym., 2019, 220, 110–117.49 R. M. Sheltami, I. Abdullah, I. Ahmad, A. Dufresne and
H. Kargarzadeh, Carbohydr. Polym., 2012, 88, 772–779.50 A. A. Oun and J. W. Rhim, Carbohydr. Polym., 2016, 150, 187–
200.51 M. Sharma, K. Ojha, A. Ganguly and A. K. Ganguli, New J.
Chem., 2015, 39, 9242–9248.52 C. Uma Maheswari, K. Obi Reddy, E. Muzenda, B. R. Guduri
and A. Varada Rajulu, Biomass Bioenergy, 2012, 46, 555–563.53 P. S. Saud, B. Pant, A. P. Twari, Z. K. Ghouri, M. Park and
H.-Y. Kim, J. Colloid Interface Sci., 2016, 465, 225–232.54 A. K. Kumar and S. Sharma, Bioresour. Bioprocess., 2017, 4, 7.55 J. Luo, R. Li, Y. Chen, X. Zhou, X. Ning, L. Zhan, L. Ma, X. Xu,
L. Xu and L. Zhang, Sep. Purif. Technol., 2019, 210, 417–430.56 F. Niu, L. M. Tao, Y. C. Deng, Q. H. Wang and W. G. Song,
New J. Chem., 2014, 38, 2269–2272.57 S. Mandal and R. Ananthakrishnan, ACS Sustainable Chem.
Eng., 2018, 6, 1091–1104.58 V. Kuzmenko, N. Wang, M. Haque, O. Naboka, M. Flygare,
K. Svensson, P. Gatenholm, J. Liu and P. Enoksson, RSCAdv., 2017, 7, 45968–45977.
59 T. Zhou, G. Zhang, H. Zhang, H. Yang, P. Ma, X. Li, X. Qiuand G. Liu, Catal. Sci. Technol., 2018, 8, 2402–2416.
60 Y. Bu and Z. Chen, ACS Appl. Mater. Interfaces, 2014, 6,17589–17598.
61 J. F. Weaver and G. B. Hound, Chem. Mater., 1994, 6, 1693–1699.
62 P. Dong, G. Hou, C. Liu, X. Zhang, H. Tian, F. Xu, X. Xi andR. Shao, Materials, 2016, 9, 1–17.
2884 | Nanoscale Adv., 2020, 2, 2870–2884
63 S. Wang, T. Luo, J. Zhu, X. Zhang and S. Su, Cellulose, 2016,23, 3737–3745.
64 F. Rahmawati, M. Mudjijono and I. Fadillah, J. Mater.Environ. Sci., 2017, 8, 287–297.
65 Y. Luo and J. Huang, Chem.–Eur. J., 2014, 21, 2568–2575.66 J. Zeng, S. Liu, J. Cai and L. Zhang, J. Phys. Chem. C, 2010,
114, 7806–7811.67 Q. Wang, J. Cai and L. Zhang, Cellulose, 2014, 21, 3371–3382.68 T. S. Anirudhan and J. R. Deepa, J. Colloid Interface Sci., 2017,
490, 343–356.69 H. Y. Yu, G. Y. Chen, Y. B. Wang and J. M. Yao, Cellulose,
2015, 22, 261–273.70 X. Zhang, H. Zhang, Y. Xiang, S. Hao, Y. Zhang, R. Guo,
X. Cheng, M. Xie, Q. Cheng and B. Li, J. Hazard. Mater.,2018, 342, 353–363.
71 Q. Wang, J. Cai and L. Zhang, Cellulose, 2014, 21, 3371–3382.72 Z. Duan, L. Deng, Z. Shi, H. Zhang, H. Zeng and
J. Crittenden, J. Colloid Interface Sci., 2019, 534, 270–278.73 S. Guo, Y. Jiang, F. Wu, P. Yu, H. Liu, Y. Li and L. Mao, ACS
Appl. Mater. Interfaces, 2019, 11, 2684–2691.74 Y. Liu, D. Yang, R. Yu, J. Qu, Y. Shi, H. Li and Z. Z. Yu, J. Phys.
Chem. C, 2017, 121, 25172–25179.75 Y. Li, X. Xiao and Z. Ye, Appl. Surf. Sci., 2019, 467–468, 902–
911.76 Y. Lin, S. Wu, C. Yang, M. Chen and X. Li, Appl. Catal., B,
2019, 245, 71–86.77 Y. Huang, X. Zhang, G. Zhu, Y. Gao, Q. Cheng and X. Cheng,
Sep. Purif. Technol., 2019, 215, 490–499.78 Y. Liu, D. Yang, Y. Shi, L. Song, R. Yu, J. Qu and Z. Z. Yu, ACS
Sustainable Chem. Eng., 2019, 7, 11228–11240.79 S. Singh, V. C. Srivastava and T. K. Mandal, J. Environ. Sci.
Health, Part A: Toxic/Hazard. Subst. Environ. Eng., 2015, 50,1468–1478.
80 V. M. Bhandari, L. G. Sorokhaibam and V. V. Ranade,Desalin. Water Treat., 2016, 57, 27934–27944.
81 M. K. Trivedi, A. Branton, D. Trivedi, G. Nayak, K. Bairwa andS. Jana, Mod. Chem. Appl., 2015, 3, 1000163–1000169.
82 G. Madhurambal, M. Mariappan and S. C. Mojumdar, J.Therm. Anal. Calorim., 2010, 100, 763–768.