57
AGROMETEOROLOGY IN MANITOBA 1967-2010

AGROMETEOROLOGY
IN MANITOBA
1967-2010

Agrometeorology in Manitoba – 1967 - 2010 Preface This project is presented as a brief history of agrometeorology in Manitoba in the period 1967 - 2010. It is a compilation of some of the research and applications of the science of agrometeorology over that period; it does not claim to be a complete account of those activities. It was coordinated by Carl Shaykewich, formerly of the Department of Soil Science of the University of Manitoba. In addition to activities in that facility, it describes some of the activities of the Canadian Wheat Board, Whiteshell Laboratories (Atomic Energy of Canada, Pinawa), Environment Canada and Manitoba Agriculture and Rural Initiatives. In most cases the activities in these institutions have been described by persons who at one time or another were associated with these institutions (see list of contributors below). The project would not have been possible without their input and the coordinator is most grateful for their participation. List of Contributors Brian Amiro Guy Ash John Benci Paul Bullock Bruce Burnett Philip Davis Ray Garnett Andrew Nadler Richard Raddatz Randall Renwick Carl Shaykewich (co-ordinator and main author)
1

Table of Contents
Page Preface 1 List of Figures 3 List of Tables 4 In The Beginning 5 Department of Soil Science, University of Manitoba 5
Characterization of Manitoba’s Climate for Agriculture 5 Research - Phenological development of crops. 14 Corn 14
Fababeans 17 Wheat 17 Soybeans 21 Canola 22 Potatoes 24
- Drought Research Initiative 25 - Monitoring Soil Moisture Levels 26 - Optical Sensors for Determining Nitrogen Status of Canola 28 - Greenhouse Gases in Agriculture 29 - Carbon in Forests: 29 - Water Balance in Forests: 30 - Northern Peatlands 30
Teaching Program 31 Canadian Wheat Board 32 Weather and Crop Surveillance Section 32
Typical Week at WCSD CWB 33 Atomic Energy of Canada Limited, Whiteshell Laboratories, Pinawa, Manitoba 36 Forest Microclimatology 37
Atmospheric Dispersion and Turbulence 37 Modelling and Measurements for Nuclear Fuel Waste Management 38 The End 38
Environment Canada 39 Agrometeorological bulletins and outlooks 39
Manitoba Agriculture, Food and Rural Initiatives (MAFRI) 43 References 46 Graduate Students in Agrometeorology, Department of Soil Science, University of Manitoba. 55
2

List of Figures page Figure 1. Average frost free days as reported in Publication No. 546, 6
“Climate of Southern Manitoba as it Relates to Agriculture”, 1974. Figure 2. Best fitting curve for 8 years of observed soil temperature 7
at the 150 cm soil depth at Morden, Manitoba. Figure 3. Days above 5ºC at the 20 cm depth. 8 Figure 4. 10% risk values for frost free days as reported in “Southern 9
Manitoba’s Climate and Agriculture, 1982”. Figure 5. 10% risk of frost free days in Manitoba and Eastern 10
Saskatchewan as reported in “Agricultural Climate of the Eastern Canadian Prairies, 1992”.
Figure 6. 25% risk for annual P-days accumulation on the Prairies. 11 Figure 7. 10% risk of frost free days on the Prairies (from Nadler, 2007). 12 Figure 8. 10% risk of the frost free period on the Great Plains of Canada 13
and northern USA. Figure 9. Relationship of kernel moisture to corn heat units at Hamiota 14
and Lyleton. Figure 10. Corn heat units as a function of duration (days) from emergence 15
to stem elongation. ● Pioneer 3995, x Northrup King 403, ∆ Pride 1108 Figure 11. Relationship of corn heat units (CHU) to daily minimum and 15
maximum temperature. Figure 12. Development rate during emergence to tassel initiation growth 16
stage as a function temperature for the hybrids ‘United 108’ (top) and ‘Guelph GX 122’ (bottom) Data points are those reported by Coligado and Brown (1975).
Figure 13. Development units accumulated by the iterative model during 17
the emergence to stem elongation (ESE) growth phase vs. the duration of ESE. Cultivars were Pioneer 3995 (∆), Northrup King 403 (□), and Pride 1108 (*).
Figure 14. Locations of fields where Canada Western Red Spring wheat 18
samples were collected that received grades of Canada Number 1 or Canada Number 2 and were not grown under irrigation in 2003 and 2004 (Jarvis et al. 2008).
3

page Figure 15. Average r2 for regression models based on (1) one variable 19
using observed weather parameters accumulated over the entire growing season, (2) one variable using observed weather parameters accumulated over specific growth phases, (3) one variable using both observed and modeled weather parameters accumulated over different wheat growth phases and (4) three variables using observed and modeled weather parameters accumulated over different wheat growth phases (Jarvis et al. 2008).
Figure 16. Probability (%) of maturing Maple Presto before the first killing 22
frost in autumn (Burnett 1984). Figure 17. Diurnal variation in net radiation observed at Pinawa, Manitoba 36
on selected days in 1975. (From de Jong et al. 1980b)
List of Tables Table 1. Contribution to variation for environment (E), genotype (G) and 21
G x E interaction for grain, flour, dough and bread quality of six wheat genotypes at seven locations (Finlay et al. 2007).
Table 2. Directors of the Weather and Crop Surveillance Section, 35
Canadian Wheat Board Table 3. Sample of an agrometeorological bulletin 41 Table 4. A sample of an agrometeorological outlook 42
4

In The Beginning Prior to 1967, Dr. Robert Hedlin, then head of the Department of Soil Science at the
University of Manitoba, served as the Manitoba representative on the Expert Committee on Agrometeorology. (Apparently, at some point Dr. Hedlin had written an article for a publication called “Agricultural Institute of Canada Review” expressing the view that agricultural professionals were not giving sufficient attention to the influence of weather and climate on agricultural production. As a response to his article, he was asked to serve on this committee.) This was a committee of Agriculture and Agri-Food Canada which met yearly. It had representatives from most of the provinces and the Agrometeorology section of the Central Experimental Farm of Agriculture and Agri-Food Canada in Ottawa. Also, represented was the University of Guelph which at the time was the only school in Canada with a teaching and research program in agrometeorology. The committee’s mandate was to review research and applications in agrometeorology throughout Canada and make recommendations to Agriculture and Agri-Food Canada and Environment Canada on issues relating to agrometeorology. A detailed description of the genesis and role of the committee has been compiled by Robertson (1998).
Department of Soil Science, University of Manitoba
Characterization of Manitoba’s Climate for Agriculture In September of 1967, Dr. Carl Shaykewich joined the Department of Soil Science at
the University of Manitoba. Initially, his mandate was teaching and research in Soil Physics. Dr. Shaykewich learned of Dr. Hedlin’s participation on the Expert Committee on Agrometeorology. Dr. Hedlin suggested that Dr. Shaykewich take over as the Manitoba representative on that committee. (The Expert Committee on Agrometeorology was disbanded in the early 1990s.) He also indicated that Dr. Wolfgang Baier of the Central Experimental Farm of Agriculture and Agri-Food Canada in Ottawa had begun an analysis of historical weather data collected at Agriculture and Agri-Food Canada’s research stations across the country. This analysis consisted of calculating parameters of interest to agriculture, e.g., dates of spring and fall frosts, frost free period, estimates of potential evapotranspiration, heat units, etc. However, at that time availability of data and the ‘state of the art’ in computers was such that the study had to be confined to Agriculture and Agri-Food Canada weather stations. Dr Hedlin suggested that Dr. Shaykewich do a similar analysis on some Manitoba weather stations which were not included in Dr. Baier’s study. Dr. Shaykewich welcomed the suggestion and later in the fall of 1967, data from Environment Canada’s weather stations at Russell and Waskada arrived. The data were on punched cards and contained daily maximum and minimum temperatures and precipitation, with one day’s observations on each card. For each station there was 25 years of weather data. The punched cards were contained in five boxes (7.5 cm x 15 cm x 60 cm) weighing about 10 kilos for each station.
Dr. Shaykewich had some experience with analysing data by computer during his Ph.D. studies at McGill University and composed “programs”, i.e., software, to analyze the weather data. The analysis was confined to the growing season, i.e., May 1 to September 30. The report on this weather analysis was given at the 1968 Manitoba Soil Science Meetings. For each of the Russell and Waskada stations, a graph of average weekly precipitation, probabilities of spring and fall frost, frost free period, average total growing season precipitation and potential evapotranspiration, and degree day accumulations above 42 and
5

50ºF were presented. Thus began the analysis of weather data from an agricultural perspective in Manitoba.
Over the next few years, analysis of an additional 22 Environment Canada weather stations in the agricultural region of Manitoba which had sufficient length of record was completed. In 1974, Manitoba Agriculture published those results in Publication No. 546, Climate of Southern Manitoba as it relates to Agriculture (Shaykewich 1974). A sample map from that publication is shown below (Figure 1). A part of these data was later incorporated into the publication “Heat Units for Corn in the Prairies” (Major et al. 1976) and a paper in a scientific journal (Major et al. 1978).
Figure 1. Average frost free days as reported in Publication No. 546, “Climate of Southern Manitoba as it Relates to Agriculture”, 1974.
In 1971, a soil temperature monitoring project was initiated. Eventually
measurements were made on about 200 sites throughout the province. In the southern portion of the province, most measurements were made on agricultural fields. At the time the only other soil temperature data available had been collected at Environment Canada weather stations under a grass cover. These are not representative of the soil temperature regime existing under agricultural fields. Measurements were made at 2.5, 5, 10, 20, 50, 100 and 150 cm depths. Most of the measurements were made in the spring, summer and fall, although a significant number of measurements were also made in the winter period. Data were collected for more than a decade at many sites. Since year to year variation in soil temperature data is not nearly as great as that in aerial temperatures, a much shorter record is adequate for climatic analysis. A “progress report” of the study was presented at the International Congress of Soil Science in 1978 (Mills et al. 1978).
6

In 1982 much of these data were analysed by John Krpan in his M. A. thesis (Krpan, 1982). At each depth, all available data were fitted to a sine wave depicting the annual soil temperature variation as a function of the day of the year:
Temp = A + B sin(δ + α) in which δ is the day angle = N/365 * 2π where N = day number (Jan 1 =1, Dec 31 = 365), and α was evaluated using trigonometric equalities (see Krpan 1982 for details). An example of an annual soil temperature curve is shown below in Figure 2.
Figure 2. Best fitting curve for 8 years of observed soil temperature at the 150 cm soil depth at Morden, Manitoba.
Based on the best-fitting sine waves, mean annual and mean summer soil
temperature, frost free days, days above 5 and 15ºC, and degree days above 5 and 15ºC, for each depth at each site were calculated. In addition to tables containing these data, the thesis contains maps showing the geographical distribution of these parameters. An example of these is shown below in Figure 3.
A paper copy of the entire record of soil temperature measurements is available in the Department of Soil Science.
7
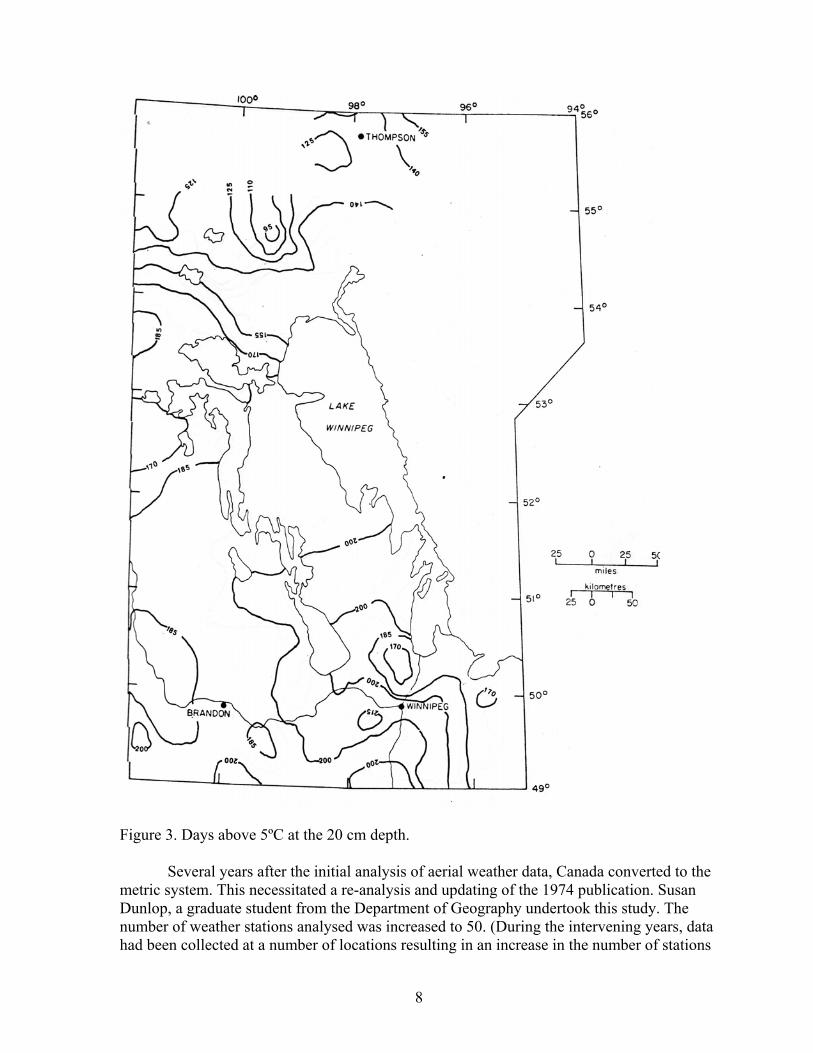
Figure 3. Days above 5ºC at the 20 cm depth.
Several years after the initial analysis of aerial weather data, Canada converted to the
metric system. This necessitated a re-analysis and updating of the 1974 publication. Susan Dunlop, a graduate student from the Department of Geography undertook this study. The number of weather stations analysed was increased to 50. (During the intervening years, data had been collected at a number of locations resulting in an increase in the number of stations
8

with a length of record sufficient for analysis.) In this study, there was an increased effort to express results in terms of risk, e.g. dates on which the probability of the last spring frost was 50, 25 and 10%. Parameters included dates of last spring and first fall frosts at 0 and -2.2 ºC, frost free period at both temperatures, growing degree days above 5 ºC, corn heat units, precipitation for the period May 1 to September 30, soil water status, i.e., water deficit, after the first and second cuts of alfalfa, soil water status at the soft dough stage of wheat, and soil water status at the silking stage of corn. This information was presented in an M.A. thesis (Dunlop 1981) and in the Manitoba Agriculture publication “Southern Manitoba’s Climate and Agriculture” (Dunlop and Shaykewich 1982). The 10% risk map for frost free days is shown below.
Figure 4. 10% risk values for frost free days as reported in “Southern Manitoba’s Climate and Agriculture, 1982”.
In the late 1980s, Guy Ash, a graduate student in the Department of Geography
undertook to update the climatic analysis. This time the work included the eastern half of Saskatchewan. Results were presented in an M.A. thesis (Ash 1991) and two journal papers (Ash et al. 1992a and 1993). In addition, this work was summarized in the publication “The Agricultural Climate of the Eastern Canadian Prairies” (Ash et al. 1992b). The Manitoba
9

portion of this information was also placed on the Manitoba Agriculture Food and Rural Initiatives web site. One of the maps resulting from that study is shown below (Figure 5).
Figure 5. 10% risk of frost free days in Manitoba and Eastern Saskatchewan as reported in “Agricultural Climate of the Eastern Canadian Prairies, 1992”.
In the mid 1990s, there was considerable interest and activity in potato production in Manitoba. David Blatta, who was a graduate student at the time, took on the project of assessing the potential for potato production on the Prairies by calculation the annual accumulation of heat units appropriate for potatoes, i.e., P-days. For this calculation Blatta used daily air temperatures from stations in Alberta, Manitoba, and Saskatchewan from the years 1961 through 1991. These data had to meet certain criteria: a) have all records for months from April through September (i.e., no missing months), and, b) missing no more than 4 records in any one month during the growing season (for a total of 25 per year). The data that met these criteria were then corrected using the previous day’s temperature. After this, any station which had at least 15 years of records was included in the calculations. In total, data from 205 stations across the prairies were used. Calculation was begun on the date after April 1 when available water content was less than 90% within the top 5 cm of soil, precipitation was less than 2.0 mm, and the daily average temperature had exceeded 10°C for 10 days, though not necessarily consecutively; i.e. conditions adequate for planting to occur. Calculations ended at the first fall -2.2°C frost. Some of the results of this project are shown below (Figure 6). The P-day requirement for full maturity of potatoes is thought to be about 850. Thus, the map shows that the most suitable areas for commercial potato production on the Prairies are in southern Manitoba, mostly to the east of the escarpment to the Canadian
10

Shield. In most other areas of the Prairies potatoes are not likely to consistently reach full maturity.
Figure 6. 25% risk for annual P-days accumulation on the Prairies. During this time, it was recognized that the climate of Manitoba was likely to warm somewhat in the future due to increasing CO2 in the atmosphere. Since the climate of most of the Prairies is marginal for potato production – presently only about 11,000 km2 is suitable for potato production in Manitoba – the implications of climate warming on potato production were investigated. In 1998, Randall Renwick assumed a 2ºC warming scenario, i.e., 2ºC was added to both the maximum and minimum daily temperature in the historical record. P-day accumulation was calculated for this “warming” scenario. It was concluded that the area suitable for potato production in Manitoba would increase by 5,000 – 6,000 km2, i.e., about 50%, under such a scenario. Shortly after 2000, Andrew Nadler began a climatic analysis of the entire Prairie region (Nadler, 2007). His study included 230 weather stations for the period 1971 - 2000. The region was characterized for frost dates and frost free duration, heat unit accumulations, growing season rainfall, crop water demand and crop water deficits. For each parameter, a map showing 50%, 25% and 10% risk as well as an associated coefficient of variation was created. The map of frost free days at a 10% risk is shown below (Figure 7).
Results of his analysis lead him to the following conclusions: 1. Only southern Manitoba and southern Alberta accumulate sufficient heat units to sustain grain corn production 2. Commercial potato production is limited to the southern Prairies because of an inadequate bulking period in other regions. 3. Production of canola, wheat and most forages has few thermal limitations. 4. Probability of moisture stress on all crops increases from east to west and south to
north.
11
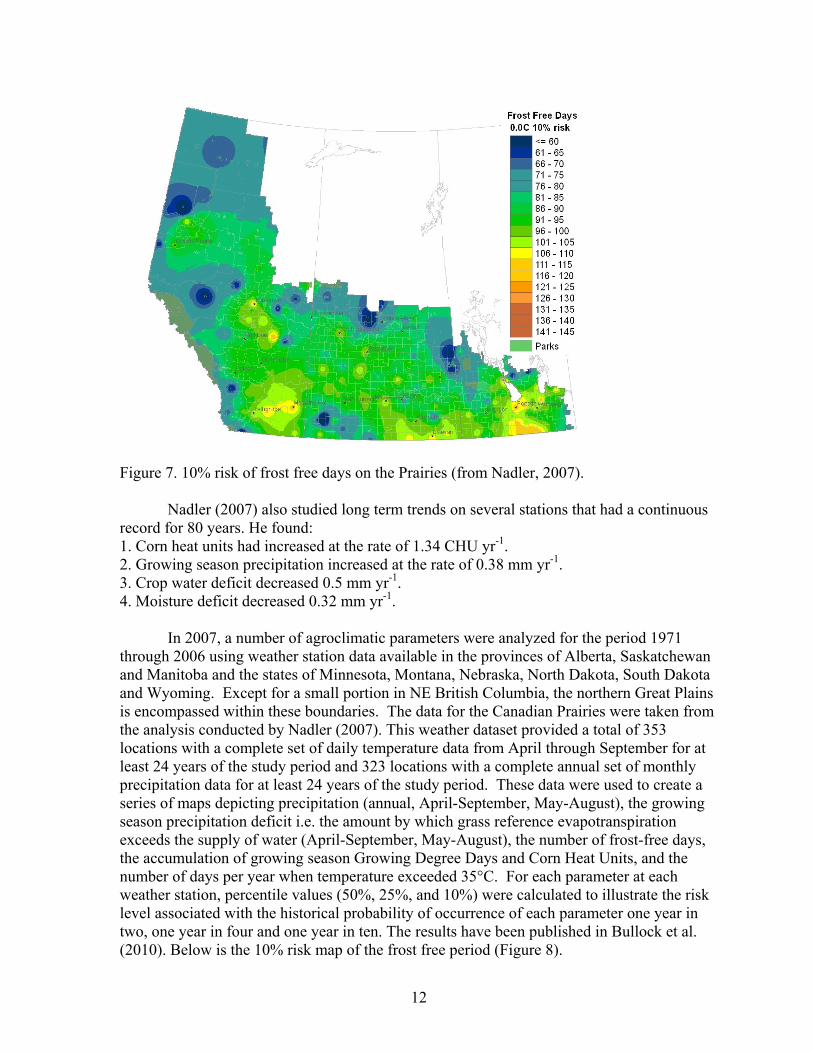
Figure 7. 10% risk of frost free days on the Prairies (from Nadler, 2007). Nadler (2007) also studied long term trends on several stations that had a continuous record for 80 years. He found: 1. Corn heat units had increased at the rate of 1.34 CHU yr-1. 2. Growing season precipitation increased at the rate of 0.38 mm yr-1. 3. Crop water deficit decreased 0.5 mm yr-1. 4. Moisture deficit decreased 0.32 mm yr-1.
In 2007, a number of agroclimatic parameters were analyzed for the period 1971
through 2006 using weather station data available in the provinces of Alberta, Saskatchewan and Manitoba and the states of Minnesota, Montana, Nebraska, North Dakota, South Dakota and Wyoming. Except for a small portion in NE British Columbia, the northern Great Plains is encompassed within these boundaries. The data for the Canadian Prairies were taken from the analysis conducted by Nadler (2007). This weather dataset provided a total of 353 locations with a complete set of daily temperature data from April through September for at least 24 years of the study period and 323 locations with a complete annual set of monthly precipitation data for at least 24 years of the study period. These data were used to create a series of maps depicting precipitation (annual, April-September, May-August), the growing season precipitation deficit i.e. the amount by which grass reference evapotranspiration exceeds the supply of water (April-September, May-August), the number of frost-free days, the accumulation of growing season Growing Degree Days and Corn Heat Units, and the number of days per year when temperature exceeded 35°C. For each parameter at each weather station, percentile values (50%, 25%, and 10%) were calculated to illustrate the risk level associated with the historical probability of occurrence of each parameter one year in two, one year in four and one year in ten. The results have been published in Bullock et al. (2010). Below is the 10% risk map of the frost free period (Figure 8).
12

Figure 8. 10% risk of the frost free period on the Great Plains of Canada and northern USA. Large amounts of fertilizer are used on the Prairies every year. It is recognized that after soil testing has assessed soil nutrient levels, recommendations for fertilizer should be made in accordance with the production potential of the climate. Fertility level should be high enough to obtain potential yield. At the same time, it should not exceed a level such that the producer no longer receives an economic benefit. From an environmental point of view, fertilizer application rate should be low enough that there is little danger of nutrients leaching to the groundwater, i.e. most of the nutrients applied should be consumed by the growth of the crop. For reasons such as these, Shaykewich et al. (2001) sought to develop a climate classification that could be used with soil testing as a basis for fertilizer recommendations. Because of limited data availability the index was rather approximate. It sought to characterize the degree to which crop water demand was met. Supply was approximated as the sum of average precipitation in May plus 2 times average precipitation in June plus 4 times average precipitation in July. The indicator of demand was the average temperature in the months of May, June and July. The index was calculated by dividing supply by demand. The reader is referred to the original publication (Shaykewich et al. 2001) for more details.
13

Research Phenological development of crops Corn
The first study, begun in 1971, was an evaluation of the corn heat unit for Manitoba conditions. At the time only about 6000 hectares of corn were grown in Manitoba but there was significant effort made in “promoting” the crop. The Canadian experience with corn was mainly in Ontario. There hybrids had been characterized as to their corn heat unit requirement and recommendations as to their suitability under Manitoba conditions made on that basis. The objective of the project was to “test” these recommendations. This was a co-operative project with Dr. R I. Hamilton of the Brandon Research Station of Agriculture and Agri-Food Canada. Plots were located in the western part of the province between Dauphin and the U.S. border. Degree of maturity was assessed mostly in the last part of the growing season by measuring grain kernel moisture, i.e. the lower the kernel moisture the more mature was the crop. The most striking result of this study was that as one moved north from the U.S. border it took more corn heat units to reduce kernel moisture to a given level (Figure 9). This was probably the first evidence showing that the corn heat unit is not a reliable predictor of phenological development of corn. These results were published in an M.Sc. thesis by John Tataryn (1974) and a journal paper by Baron et al. (1975).
30
40
50
60
70
80
90
1600 1700 1800 1900 2000 2100 2200 2300
CHU
% M
oist
ure
Hamiota
Lyleton
Figure 9. Relationship of kernel moisture to corn heat units at Hamiota (♦) and Lyleton (■).
Work on estimating phenological development of corn from weather data continued in 1980 with Herbert Cutforth as a graduate student. Twelve field sites located between 49º and 50º 40” N were operated during 1980-83. The usefulness of a number of methods of calculating thermal time to estimate phenological development was examined. Results showed that corn heat unit accumulation from emergence to stem elongation increased with
14

the time interval required for that phase to be completed (Figure 10, from Cutforth (1985) and Cutforth and Shaykewich (1989)). (Stem elongation is generally considered to have occurred when the growing point just extends above the soil surface. It was assumed to have occurred when the base of the growing point was approximately 2.5 cm above the soil surface.) A similar result was obtained when the phase from stem elongation to silking was considered. These results again cast doubt on the usefulness of the corn heat unit. If the corn heat unit were a reliable estimator of development, the heat unit requirement should have been constant regardless of the time interval.
500
550
600
650
700
750
800
20 25 30 35 40 45
Duration (days)
Corn
Hea
t uni
ts
Pioneer 3995NK 403Pride 1108
Figure 10. Corn heat units as a function of duration (days) from emergence to stem elongation. ♦ Pioneer 3995, ■ Northrup King 403, ▲ Pride 1108
The inability of the corn heat unit to accurately estimate phenological development lies in the unrealistic nature of the response of development rate to temperature. The equation is: CHU = 0.9(Tmin-4.4) + 1.665(Tmax-10.) - 0.042(Tmax-10)2 The “Tmax” portion shows an unrealistically rapid rise in development rate immediately above daily maximum temperature above 10°C (Figure 11)
0
5
10
15
20
0 10 20 30 40 50 60Temperature (C)
CH
U
Tmin Tmax
Figure 11. Relationship of corn heat units (CHU) to daily minimum and maximum temperature.
15

Cutforth and Shaykewich (1990) investigated the use of a temperature response function given by Landsberg (1977) which is quite similar to the beta function later proposed by Yin et al. (1995). The Landsberg function shows a gradual increase in response rate from the lower threshold temperature to the optimum temperature, and further increases in temperature result in a rapid decrease with temperature ending in zero at the upper threshold. An iterative procedure was used to estimate cardinal temperatures from field experiments. The model fit very well data for development rate as a function of temperature that had been observed in a field study at Guelph, ON (Figure 12).
United 108
0
0.02
0.04
0.06
0.08
0.1
0.12
0.14
5 10 15 20 25 30 35 40
Temperature (C)
Deve
lopm
ent R
ate
(1/d
ay)
ModelObserved
Guelph GX 122
0
0.02
0.04
0.06
0.08
0.1
0.12
5 10 15 20 25 30 35 40
Temperature (C)
Deve
lopm
ent R
ate
(1/d
ay)
ModelObserved
Figure 12. Development rate during emergence to tassel initiation growth stage as a function temperature for the hybrids ‘United 108’ (top) and ‘Guelph GX 122’ (bottom) Data points are those reported by Coligado and Brown (1975). The model constructed estimated corn development more accurately than corn heat units or growing degree days. Perhaps the most significant observation was that development units required for the emergence to stem elongation phase were the same regardless of the duration of the phase (Figure 13). This was true for all three cultivars used in the study.
16

10
12
14
16
18
20
24 26 28 30 32 34 36 38 40 42 44 46
Duration (days)
Dev
elop
men
t Uni
ts
P 3995NK 403
Pr 1108
Figure 13. Development units accumulated by the iterative model during the emergence to stem elongation (ESE) growth phase vs. the duration of ESE. Cultivars were Pioneer 3995 (♦), Northrup King 403 (■), and Pride 1108 (▲).
Fababeans
In the early 1970s, a significant effort was made to promote the production of fababeans in Manitoba. The interest in fababeans was in its potential as a protein source for animal production. In 1974, a project to evaluate the influence of the physical environmental factors on the productivity potential of fababeans was initiated with John Keatinge as a graduate student. Growth chamber studies resulted in the development of a ‘faba bean heat unit’ and showed that the maximum growth rate occurred at 20°C. In the field study, it was shown that 83% of the variation in total above ground yield could be explained by a relationship to accumulated soil degree days above 5°C, accumulated soil water stress and accumulated faba bean units. It was suggested that moisture stress can put severe limitations on the potential for faba bean production in Manitoba. An M.Sc. thesis (Keatinge 1975) and a journal paper (Keatinge and Shaykewich 1977) resulted from this work.
Wheat Cutforth (1980) tested a crop simulation model for the growth of spring wheat (van
Keulen 1975) under Manitoba environmental conditions. Simulated crop growth – dry matter production, seed yield, water use, development rate and leaf area index – was compared to field observations in the 1978 and 1979 growing seasons at Brandon and Glenlea. The spring wheat cultivar “Sinton” was used. Climate data – rainfall, solar radiation, daily maximum and minimum temperature, humidity, dew point temperature, windspeed, and water vapour pressure – were used as input for the model.
Rainfall from planting to maturity was about average in 1978 and much below average in 1979. The model slightly underestimated dry matter production, overestimated water use and greatly overestimated seed yield in 1978 - average rainfall. In 1979, the only year in which leaf area was measured, the simulated leaf area growth lagged behind that observed. In the ‘dry’ year – 1979 – the model greatly underestimated dry matter production and seed yield. As a whole, the model was assessed as needing significant improvement before it would be useful in estimating wheat growth and yield in Manitoba.
In 2003, Dr. Paul Bullock was co-PI with Dr. Harry Sapirstein (Food Science) and Dr. Martin Entz and Dr. Dilantha Fernando (Plant Science), Dr. Ron DePauw (Agriculture & Agri-Food Canada) and Dr. Jim Dexter (Canadian Grain Commission, CGC) on a study of
17

the impacts of growing season weather on spring wheat quality. This was funded by a NSERC Strategic grant which supported graduate students Gordon Finlay and Chad Jarvis (Soil Science) and Xiaowei Guo (Plant Science) as well as post-doctoral fellows and research associates including Dr. Mingwei Wang, Dr. Hamid Naeem and Dr. Aktar Hussain (Food Science), Dr. Ibrahim Saiyed and Dr. Sangu Angadi (Soil Science) and several summer students over the 2003 through 2006 growing seasons when the field data and samples were collected. The study considered dozens of different agrometeorological factors (air temperatures, precipitation, radiation, various estimates of evapotranspiration, thermal time indices, heat stress and moisture stress) over different phases of phenological development to determine where specific conditions exerted measurable and statistically significant impacts on nearly 30 different measures of bread-making quality. Although the wet summer of 2005 caused a serious flood in the basement of the Plant Science building and ruined the flour mill, the project still managed to complete enough analysis to provide some interesting results on relationships between growing season weather at different growth stages of wheat and the resultant final bread-making quality.
M.Sc. student, Chad Jarvis organized the collection of samples of two pre-determined CWRS varieties (hard red spring) and two pre-determined CWAD varieties (durum) over a three-year period from hundreds of fields belonging to producers who were collaborators on the project (see Figure 14). Chad provided them with both a rain gauge to keep track of local precipitation near their study field and a probe to determine the depth of soil moisture in their study field in the spring. At harvest, the producers collected the samples and sent them to the University of Manitoba to be catalogued, then graded by the CGC and extensively analyzed by the Department of Food Science (spring wheat) or the CGC (durum).
Figure 14. Locations of fields where Canada Western Red Spring wheat samples were
collected that received grades of Canada Number 1 or Canada Number 2 and were not grown under irrigation in 2003 and 2004 (Jarvis et al. 2008).
18

Three-variable multiple regression equations using a full range of observed and
modeled agrometeorological parameters accumulated over specific wheat growth phases explained between one-third and two-thirds of the variance for individual quality parameters of the samples from producer fields. Generally, correlations improved when weather parameters were accumulated over specific wheat growth phases rather than the entire growing season. Also correlations improved when derived weather parameters (potential and actual evapotranspiration, water balance) replaced observed parameters (precipitation, temperature, thermal time). However, the most significant improvement in correlation occurred when three independent variables were utilized instead of just one (see Figure15). For each of the different quality parameters investigated, there was a wide range of independent weather variables that provided the highest correlation coefficient, so no single independent variable could be identified as the most useful for wheat quality prediction.
Figure 15. Average r2 for regression models based on (1) one variable using observed weather parameters accumulated over the entire growing season, (2) one variable using observed weather parameters accumulated over specific growth phases, (3) one variable using both observed and modeled weather parameters accumulated over different wheat growth phases and (4) three variables using observed and modeled weather parameters accumulated over different wheat growth phases (Jarvis et al. 2008).
19

In addition, Gordon Finlay oversaw five replicated plot trial locations with six
different spring wheat cultivars established at AAFC research stations in Swift Current, Regina and Melfort and University of Manitoba stations at Carman and Winnipeg. AAFC and the Department of Plant Science seeded, maintained and harvested the plants, while Gordon conducted the weather and soil condition monitoring. Weather conditions were monitored intensively at each site for four growing seasons. The plots were double-sized to provide enough grain to do extensive bread-making quality testing including milling, dough and baking properties.
This study provided a comprehensive assessment of genotype and environment variation in bread-making characteristics for milling quality wheat grown in the Prairie region. For all of the wheat quality parameters tested, environment-related variation was generally much larger than genotype-related variation (see Table 1). This clearly demonstrated the importance of growing-season weather impact on wheat yield and technological quality characteristics. The challenge is for the grain industry to satisfactorily manage the effects of weather and the growing environment on wheat quality in order to deliver product of uniform and expected quality to customers of western Canadian wheat. The results also underscored the need to maintain or enhance regional blending of wheat to reduce the impact of environment on end-use quality, which can be significant even for wheat of similar grade and protein concentration.
Dr. Ibrahim Saiyed combined the data from both the field and plot components of the wheat quality study to test the accuracy of biometeorological time (BMT), growing degree days (GDD), and physiological days (Pdays) for prediction of wheat phenological stages and impacts of growing season weather during those stages on wheat bread-making quality (Saiyed et al. 2009). Observations gathered from the plot study revealed that biometeorological time was most consistent for predicting the length of the seeding to jointing and seeding to anthesis growth stages and second most consistent behind GDD for predicting seeding to soft dough and seeding to maturity. The ability of the BMT and GDD models to predict calendar days to anthesis and maturity were further tested using the field study data from 166 farms across western Canada. Both GDD and BMT models were effective for predicting time from seeding to anthesis (R2 = 0.84 and 0.90, respectively) and seeding to maturity (R2 = 0.62 and 0.66, respectively). BMT- and GDD-predicted wheat growth phases were used to calculate modeled crop water use by growth period for producer fields. Crop water use was significantly correlated to key bread-making quality parameters of flour protein, farinograph dough development time and farinograph stability. Biometeorological time predicted water use was more highly correlated to these quality parameters than GDD predictions. Accordingly, the BMT scale was recommended for estimation of wheat phenological development especially for modeling weather impacts on wheat end-use quality. However, GDD would also provide acceptable results.
20

Table 1. Contribution to variation for environment (E), genotype (G) and G x E interaction for grain, flour, dough and bread quality of six wheat genotypes at seven locations (Finlay et al. 2007).
Soybeans In the early 1980s, there was renewed interest in soybeans in Manitoba. Some
breeding work had been done and it was hoped that these new cultivars would be suitable for the Manitoba environment. Two graduate students – Gary Falk and Bruce Burnett -carried out field experiments over four growing seasons. The project consisted of weekly assessment of stage of phenological development and relating it weather conditions. Ultimately a biometeorological time scale predicting stage of development from temperature and photoperiod was developed for each of the three cultivars evaluated. This scale was then used with long term climate data to produce a map of the probability of maturing each cultivar over the long term, e.g. Figure 16. Results were presented in two M.Sc. theses (Falk 1981 and Burnett 1984), and a journal paper (Burnett et al. 1985).
21

Figure 16. Probability (%) of maturing Maple Presto before the first killing frost in autumn (Burnett 1984). Canola Over the years, several projects were initiated to establish the response of
phenological development of canola to temperature. Morrison et al. (1989) used a growth chamber study to establish that the baseline temperature, i.e. the minimum temperature required for phenological development, was approximately 5°C. Somewhat later, Wilson (2002) used a field study to determine how phenological development and fractional leaf area responded to temperature. Eight site-years, located at Brandon, Carman, Franklin, High Bluff and Roblin ranging from 49° 31’ to 51° 10’ N latitude and 266 to 555 m in elevation on clay loam or clay soils, were established in the agricultural region of Manitoba during the 1999 and 2000 growing seasons. Phenological stage of the crop was determined from weekly observations. Daily maximum and minimum temperatures were obtained from the nearest Environment Canada weather station. From these data, calendar days, growing degree days (GDD) above 0, 3, 5 and 7°C and a number
22

of heat units using the physiological days (P-days) model required to reach several stages of development were calculated. It was found that calendar days and GDD were not satisfactory estimators of crop phenology. A P-days formula utilizing base, optimal and upper temperature thresholds of 2, 20 and 30°C respectively, was the best overall estimator. It was calculated from temperature T (°C) as follows:
P = 0 When T < 2 P = k(1-(T-20)2 / (20-2)2) When 2 ≤ T ≤ 20 P = k(1-(T-20)2/ (30-20)2) When 20 ≤ T ≤ 30 (1) P = 0 When T>30
in which T = 2, 20 and 30°C are the lower, optimum and upper threshold temperatures, respectively. The constant k is a scale factor and has been set at 10. This is designated as Pdays(2,20,30).For a given day, P-days (∆P) accumulation is calculated from daily maximum (Tx) and minimum (Tn) temperatures:
∆P = 1/24 [5P(Tn) + 8P(2Tn + Tx)/3 + 8P(Tn + 2Tx)/3 + 3P(Tx)] This equation attempts to calculate the average temperature at four periods during the day and weights the calculation of P-days for the length of time during the day that each average temperature typically prevails. P-day requirements for seven stages of development were established.
In the same study, Wilson (2002) sought to estimate fractional leaf area from heat unit accumulation. Fractional leaf area has a great influence on sclerotinia stem rot infection in canola. It is particularly prevalent in dense, vigorous canola because the plant canopy helps create a microenvironment of high relative humidity suitable for sclerotinia germination. Thus, accurate estimation of degree of ground cover is an important component of assessing sclerotinia risk and could be used to determine the timing of remedial measures. Field measured fractional leaf area (FLA) was regressed on degree days above 5C (GDD>5) and Pdays(5,17,30) resulting in the following prediction equations: FLA = - 0.2269 + 0.00219 GDD>5 R2 = 0.75, RMSE = 0.12 for GDD>5 ≤ 500 And FLA = - 0.2508 + 0.00292 Pdays(5,17,30) R2 = 0.79, RMSE = 0.11 for Pdays(5,17,30) ≤ 400
Beginning in 2008, another study was undertaken to determine growing season weather impacts on canola quality. Taryn Dickson was the graduate student undertaking the research with much input and assistance from Dr. Veronique Barthet (Canadian Grain Commission) and encouragement from Dr. Jim Daun, retired and formerly with the Canadian Grain Commission. In this study, the canola samples were selected from among the thousands that are submitted by producers every year to the Canadian Grain Commission as part of their harvest survey. The results of these studies for both wheat and canola provide mechanisms for estimating crop quality as a result of specific weather conditions, thus providing the grain industry with a means to determine the overall and spatial variation in grain quality by location prior to its arrival through the grain marketing system. The challenge is for the grain industry to satisfactorily manage the effects of weather and the growing environment on grain quality in order to deliver product of uniform and expected quality to customers for western Canadian grain.
23

Potatoes In 1991, the Manitoba Crop Diversification Centre (MCDC) was established at
Carberry. It was associated with Agriculture and Agri-Food Canada and a significant part of its mandate was to provide research support to the potato industry in Manitoba. Several projects on the influence of weather and climate on potato production were conducted. These involved personnel from the Department of Soil Science at the University of Manitoba, staff at MCDC and staff at Manitoba Agriculture, Food and Rural Initiatives (MAFRI).
An important facility at MCDC was a sophisticated irrigation system. This permitted research on the influence of water use on yield of potatoes. During the summers of 1994-1998 a study consisting of growing potatoes under non-limiting soil fertility, sprayed to control blight, and irrigation added to maintain soil at pre-determined moisture levels was conducted at the Manitoba Crop Diversification Centre at Carberry. The main objectives of the study were 1) to track water use by potatoes over the growing season and determine if it could be accurately estimated by a model developed earlier by Environment Canada, and 2) to determine the effect of water supply on yield. Two varieties of potatoes, Shepody and Russet Burbank were used. Measurements of root growth, % of ground covered by leaves, and soil moisture were used to test and fine-tune the water use model. Results relating to the first objective were reported in a scientific journal paper (Shaykewich et al. 1998). The information presented provided the basis for a water use model for potatoes that could be used in irrigation scheduling.
One of the objectives of the Carberry studies was to evaluate the effect of water supply on yield. To that end, four treatments were used: A) Soil irrigated when root zone moisture dropped to 75% water holding capacity, B) Soil irrigated when root zone moisture dropped to 55% water holding capacity, C) Soil irrigated when root zone moisture dropped to 35% water holding capacity, and D) rainfall only. In each treatment, soil moisture was measured at weekly intervals. This aspect of the study showed that to grow a crop of potatoes in Manitoba, it takes 375-400 mm (15 – 16 inches) of water to completely avoid water stress. Analysis of long term weather data from the agricultural region of Manitoba suitable for growing potatoes shows that on average there is about 250 mm (10 inches) of precipitation during the growing season. Thus, on average about 125-150 mm (5-6 inches) of additional moisture is required to avoid water stress. For the one in four year risk for dry years, at least 150-200 mm (6-8 inches) additional moisture is required.
The studies produced the following yield prediction equations: Shepody Y = -0.0027 x2 + 2.2952 x – 114.49 Russet Burbank Y = -0.0025 x2 + 2.0674 x – 84.888
in which Y = yield (cwt/ac) and x = water use (mm), i.e. change in soil moisture (planting to harvest) + precipitation + irrigation.
Somewhat later, Randall Renwick (1999) tested a crop simulation model for growth and development of potatoes. This model had been developed by Hodges (1997) from work he conducted in a relatively arid area in southeastern Washington state. In Manitoba, a field study was conducted on irrigated and dryland sites at Carberry. Russet Burbank and Shepody cultivars were grown. Soil moisture data and crop variables such as top and tuber dry matter, leaf area index and gross yield were collected during the growing seasons of 1996, 1997 and 1998. These were compared to the same variables estimated by the crop simulation model.
Simulations of leaf area, top green biomass and tuber dry weights were underestimated in both the maximum values reached and seasonal growth rate for each irrigation treatment for all three growing seasons for Russet Burbank. Simulated total tuber yields were below
24

measured values in all years and all treatments. Modeled soil moisture and crop water use agreed well with measured values for the 1998 season, while 1997 and 1996 results showed the model to be underestimating soil moisture. Discrepancies between modeled and observed results were attributed to the fact that the model had been developed under vastly different weather conditions than those that exist in Manitoba.
Drought Research Initiative
A multi-disciplinary, multi-institutional research network was funded by the Canadian Foundation for Climate and Atmospheric Studies to address the issue of drought. The Network brought together the Universities of Manitoba, Saskatchewan, Calgary and McGill as well as federal/provincial government researchers to address this issue with expertise encompassing the atmospheric, hydrologic, land surface, and predictive aspects of droughts at a variety of spatial and temporal scales. The overall project objective was to better understand the physical characteristics of and processes influencing Canadian Prairie droughts, and to improve prediction capability, through a focus on the recent severe drought that began in 1999 in western Canada. Dr. Paul Bullock’s focus was the characterization of agricultural drought. Dr. Manasah Mkhabela analyzed fifteen site years of detailed weather and crop data from the wheat quality project to derive drought indices in three general categories: (i) water supply, (ii) water demand and (iii) water balance. The statistically significant indices explained between 27% and 74% of the variation in wheat yield and four different wheat bread-making quality parameters for two different wheat genotypes. The drought index category most frequently correlated to wheat characteristics was water demand, followed by water balance. These results suggest that drought indices focusing on evapotranspiration and water demand may be the most useful for accurately reflecting the impact of drought on spring wheat yield and quality in western Canada. Dr. Mkhabela also analyzed MODIS NDVI satellite images for 2000 through 2006 provided by Dr. Shusen Wang, Canada Centre for Remote Sensing. Mean 10-day composite values by census agriculture region (CAR) were significantly correlated to CAR yields for wheat, barley, canola and field peas in each of the sub-humid, semi-arid and sub-arid zones of western Canada with NDVI during the last dekad of June through the last dekad of July. Thus, MODIS NDVI during this time window can provide an estimate of crop yield potential (Mkhabela et al 2011).
Mark Gervais, an M.Sc. student, evaluated the accuracy of the second-generation Prairie Agrometeorological Model (PAM2nd) for spring wheat on the Canadian Prairies using data from the plot study component of the wheat quality research project over the growing seasons from 2003 through 2006 (Gervais et al. 2010). The objective of this study was to validate, and if necessary modify, the soil water component of PAMII. Comparison of modelled and measured soil water values yielded a RMSE of 62 mm. For most site-years, PAMII overestimated soil water during the second half of the growing season, which was caused by an increase in modelled canopy resistance (rc) before the crop experienced water stress. The rc function was thus modified so that rc would not increase until the soil water content was <0.5 of plant available water. Overall this modification reduced the RMSE from 62 to 56 mm. In addition, modelled soil water was underestimated during periods that experienced consecutive days of precipitation. This was because the model stopped infiltration when the top-zone reached saturation. When modified to allow infiltration to continue independent of the top-zone’s water content, the RMSE was further reduced to 53 mm. Overall, both modifications reduced the RMSE of modelled soil water by 9 mm, and
25

this reduction was highly significant (P<0.01). Mark also assessed the evapotranspiration routine of PAMII (Gervais et al. in press). PAMII estimates standard evapotranspiration (ETc) by simulating crop development and the soil water balance using daily minimum and maximum surface air temperature, rainfall and upper air conditions to simulate the depth of the planetary boundary layer. This maximises the number of weather stations that can be utilised, and as a result, maximises the spatial resolution of ETc estimates. The FAO56 Penman-Monteith (FAO56 P-M) method uses a reference surface/combination approach to calculate reference ET (ETo) and then multiply it by a crop coefficient (Kc) to derive ETc. Comparison of daily ET rates between PAMII and the FAO56 P-M method indicated significant differences in the ETc (RMSD = 1.88 mm d-1, r2 = 0.45) and ETa (RMSD = 1.65 mm d-1, r2 = 0.45). Both models produced overall ETa rates that fell within the range of the measurement error associated with water balance estimates. Since PAMII produced similar ETc and ETa rates compared to the FAO56 P-M method, the model can be used to derive crop ET estimates in parts of the Canadian Prairie where weather data to run the FAO56 P-M model are not available.
Monitoring Soil Moisture Levels Measurement of the water content of soil profiles both within and below the root zone
is necessary in many fields of agricultural, hydrological, environmental, and engineering science. In agriculture, soil moisture affects field access (the ability to perform field operations), crop yield, crop quality, insect risk, disease risk and overland flooding. These factors determine the volume and condition of grain harvested every year worth billions of dollars. Current soil moisture information also facilitates informed decisions related to critical aspects of water management. For example, Manitoba Water Stewardship (MWS) provides a number of critical functions related to the hydrological conditions in the province including both drought and flood warnings. These have significant value for disaster preparedness including the protection of infrastructure worth billions of dollars and even human life. Field studies have also demonstrated the importance of low level water vapor for convective initiation (CI), which is the spark behind the development of severe weather such as hailstorms and tornadoes. The intermittent and spatially-variable precipitation regime of the continental interior of North America creates very dry regions with low soil moisture and stressed vegetation in close proximity (100-200 km) to wetter regions with adequate soil moisture and more lush vegetation. The wet-dry boundaries can impact where and when CI takes place and even the resulting intensity of storms. Thus, soil moisture also affects the development of severe weather.
Effort has been given to the measurement and estimation of soil moisture. Huang et al. (2004) evaluated five soil water sensors in the laboratory to determine if laboratory calibration is appropriate for the field. In this study, the performances of five sensors, including the Profile Probe™ (PP), ThetaProbe™, Watermark™, Aqua-Tel™, and Aquaterr™ were compared in the laboratory. The PP and ThetaProbe™ were more accurate than the other soil water sensors, however, when PP was installed on a loamy sand in the field, the same soil that was used for the laboratory evaluation, it overestimated field soil water, especially at depth. Another laboratory experiment showed that soil water content readings from the PP were strongly influenced by soil bulk density. The higher the soil bulk density, the greater was the overestimation of soil water content. Two regression parameters, a0 and a1, which are used to convert the apparent dielectric constant to volumetric water content, were found to increase linearly with the soil bulk density in the range of 1.2 to1.6
26
Mg m–3. Finally, the PP was calibrated in the field and a good calibration function was obtained with an r2 of 0.87 and RMSE of 2.7%. The values of a0 and a1 obtained in the field were different from factory recommended parameters (a0 = 2.4 versus 1.6 while a1 = 12.5 versus 8.4) and were independent of soil depth, bulk density, and texture. As such, individual field calibration will be necessary to obtain precise and accurate measurement of soil water content with this instrument.
Bullied et al. (2007) conducted an experiment investigating the seedbed to 75-mm depth across a field topography with variable soil properties to determine which soil properties affected the calibration of the ThetaProbe, and if soil-specific calibration was required to derive suitable estimates of the water status in the experiment. Experimental factors examined included hillslope aspect, hillslope position, crop residue and soil depth. Soil properties, other than volumetric water content, significantly affecting the probe measurements were bulk density, electrical conductivity and temperature. The probe underestimated soil water at very low water contents, and overestimated soil water at contents greater than 0.11 m3 m-3, compared with gravimetric measurements. A single calibration, not corrected for hillslope position at a water content of 0.20 m3 m-3, overestimated water content by 0.02 m3 m-3 in the summit hillslope position and underestimated water content by 0.04 m3 m-3 in the toeslope position. A single calibration, not corrected for soil depth at a water content of 0.20 m3 m-3, overestimated water content by 0.02 m3 m-3 in the 0- to 25-mm soil layer and underestimated water content by 0.03 m3 m-3 in the 50- to 75-mm layer. The complexity of microsites in a shallow seedbed requires soil-specific calibration in field experiments containing heterogeneous soil properties.
Bullock et al. (2004) tested near-infrared (NIR) spectroscopy for soil water content determination. Five soil horizons with a range in soil texture, soil organic carbon, carbonates, pH and horizon depth, were tested at air-dry, field capacity and 0.1 MPa tension water content. Volumetric soil water content, determined using the standard method of oven-drying and soil bulk density, was compared to NIR absorbance in various combinations and wavelengths. The NIR spectra obtained with the probe in direct contact with the soil gave better results than when the probe was separated from the soil with a glass slide. The most reliable validation results were obtained using a multivariate partial least squares regression of the full spectrum with an r2 of 0.95 and RMSE of prediction of 6.4%. The relationships for absorbance at single wavelength segments, ratios, differences and area under the curve around the 1940 nm peak were good (r2 values near 0.85) but poorer than the results using the full spectra. The high correlation coefficients obtained with the wide variety of soils utilized in this study suggest that NIR absorbance is a practical method for determining volumetric soil water content for small soil volumes.
The soil-water retention characteristic (SWRC) was investigated for at three hillslope positions on two hillslope aspects across cultivated field topography (Bullied et al. 2011). Volumetric water content was determined at matric potentials from saturation to -1.5 MPa for the 25-50 cm soil increment. Three local pedotransfer functions (PTF) were developed using basic soil physical properties and detailed particle size distribution to estimate the parameters of the van Genuchten model for the middle soil increment. The local PTF were compared with Rosetta, HYPRES, and SOILPROP regional PTF. The local PTF generally predicted water retention better than the regional PTF. Rosetta H4 and H5 models predicted water retention as well as one of the local PTF. The SWRC in the 0-25 and 50-75 cm depth were estimated by local PTF using soil properties from the upper and lower increments coupled with the estimated SWRC from the middle increment. Soil properties used to parameterize
27

local PTF varied with soil depth; however, SWRC did not differ with depth. Where direct measurement of soil hydraulic properties is resource limiting, accurate estimation of local SWRC by regional PTF is possible; however, input of partial water retention information was necessary to achieve accuracy. Using local PTF to estimate the SWRC in the upper and lower profile increments of the seedling recruitment zone indicates that a single SWRC was sufficient to describe the profile in this study.
In 2009, a study was initiated to develop the capacity to monitor soil moisture levels in western Canada with real-time weather data. The overall objective of this project was to develop an accurate soil moisture model and a prototype system that generates frequent updates of profile soil moisture content from real-time weather data. M.Sc. student Rotimi Ojo established a network of soil moisture monitoring sites in Manitoba in 2009 and 2010, each adjacent to a weather station that reported data in real-time and with hourly measurements of soil moisture at 5, 20, 50 and 100 cm depth. The sites included representative vegetation types for the agricultural region of Manitoba including cereal, canola and permanent grass. The Versatile Soil Moisture Budget (VSMB) was evaluated to determine how accurately it can simulate daily and hourly changes in soil moisture using real-time weather data sources that are readily available across western Canada. Early results affirmed the importance of undertaking careful field calibration of the soil moisture sensors. Factory calibration settings were not reliable, especially in heavier-textured soils. Modification of the VSMB to include the FAO-56 evapotranspiration routine did not make significant differences to modelled soil moisture values compared to using the Priestley-Taylor approach. Additional analysis will determine how readily the VSMB could be deployed to use weather data from multiple sites and the sensitivity of the model to soil input parameters.
Optical Sensors for Determining Nitrogen Status of Canola
Crop nitrogen requirements depend on its yield potential and the soil’s capacity to supply N, both of which are often variable and difficult to predict. Discounting residual soil NO3-N from crop N requirements is a commonly recommended practice that can improve fertilizer recommendations based on yield goals. However, traditional composite soil NO3-N tests do not account for either within-field spatial variability or potential mineralization of organic N during the growing season. The potential for various fractions of organic N to be used as indicators of potentially mineralizable N is limited by the fact that mineralization is affected soil temperature and moisture as well as soil wetting and drying cycles. Grid- or landscape-directed soil sampling techniques characterize spatial soil N fertility but the costs can be prohibitive. Consequently, while yield goals and composite soil tests provide a starting point for determining a crop’s N requirements, their limitations prevent them from being fully reliable indicators of optimal N rates. Optical sensors can estimate the yield potential of a crop and its potential responsiveness to further N inputs using a normalized difference vegetation index or NDVI (Holzapfel et al. 2009a). Thus, optical sensors have potential to reduce spatial variability by greatly increasing the sampling frequency and accounting for organic N mineralized up to the time of sensing. Empirical data are required to utilize the sensors for this purpose. Holzapfel et al. (2009b) compiled N fertilizer trial data from five Canadian locations (2004-2007) to determine the feasibility of using optical sensors during the growing season to estimate the seed yield potential of canola. The NDVI between the six-leaf stage and the beginning of flowering was divided by one of several different heat unit summations to normalize the measurements. When data from all locations
28

were combined, NDVI was significantly correlated with canola seed yield (R2 = 0.35; P<0.001) and normalizing NDVI did not improve the correlation. Categorizing the locations by soil zone (Brown, Dark Brown and thin-Black, Black) and completing separate regression analyses for each group increased the correlation coefficients for NDVI and seed yield (R2 = 0.36 - 0.43). Furthermore, dividing NDVI by the heat unit summations generally improved the correlation when the data were categorized by soil zone. The largest correlation coefficient occurred when NDVI was divided by growing degree days with a base temperature of 5 C (R2 =0.53 - 0.67). Thus, optical sensors can be used to estimate canola yield potential early enough in the growing season to have potential as an N management tool.
Greenhouse Gases in Agriculture
Dr. Mario Tenuta (Canada Research Chair in Soil Ecology) acquired substantial infrastructure in 2005 to measure the exchange of nitrous oxide and carbon dioxide from cropping systems using a flux-gradient technique. A tunable diode laser analyser that allowed for comparisons among four plots, where different treatments could be imposed was installed at the Glenlea Research Station. Graduate students Aaron Glenn, Siobhan Stewart and Tek Sapkota all worked on different aspects of the greenhouse gas consequences of crop management at this site. Syd Jones, Jenna Rapai, Brad Sparling and Jolene Rutter provided technical support. The work was funded by an NSERC Strategic Grant in collaboration with the University of Guelph, and also involved the use of a 13C/12C isotope laser to measure the relative soil respiration components from recent crop residues (Glenn 2010; Glenn et al. 2010, 2011). Annual and perennial crops were compared (Stewart 2010). Additional experiments funded by the Canadian Fertilizer Institute studied the effect of the timing of fertilizer application.
The measurement of greenhouse gases from agriculture expanded in 2009 with the study of the carbon consequences of converting perennial forage lands to annual crops, led by Dr. Brian Amiro. Three eddy covariance towers were installed near Woodlands Manitoba to compare this land conversion practice by a local producer. Graduate students Trevor Fraser and Amanda Taylor worked on this project along with technician Jenna Rapai.
The greenhouse gas flux measurements at Glenlea and Woodlands using micrometeorological techniques created a more representative spatial measurement than the extensive soil chamber measurements that Dr. Tenuta had been employing at various sites in agricultural Manitoba. These new whole-field measurements formed the basis for a larger cooperative project on beneficial management practices for greenhouse gas mitigation in agroecosystems which began with Agriculture and Agri-food Canada funding in 2011. Carbon in Forests:
This program started when Dr. Brian Amiro arrived at the University of Manitoba in 2004 and continued as part of his previous program at the Canadian Forest Service and the University of Alberta (adjunct faculty in the Department of Renewal Resources). The program was funded by the Fluxnet Canada Research Network (2002-2007), a large collaboration among Canadian university and government researchers. A major focus was on the measurements of carbon dioxide exchange between forests and the atmosphere following fire in the boreal forest. The measurement program was centred on eddy-covariance flux towers in a post-fire chronosequence in the BERMS (Boreal Ecosystem Research and Monitoring Sites) area in central Saskatchewan (Amiro, Barr et al. 2006;
29

Amiro, Orchansky et al. 2006; Chen et al. 2006; Coursolle et al. 2006; Schwalm et al. 2006; Drolet et al. 2008; Amiro 2010). Graduate students Alison Sass (Manitoba) and Sarabpreet Singh (Alberta) worked at these sites for their theses (Sass 2007, Singh et al. 2008). Post-doctoral Fellow Dr. Manasah Mkhabela also published data analyses from these sites (Mkhabela et al. 2009). As part of the North American Carbon Program, data from these sites were analysed with other forest chronosequences following fire, harvesting, insect infestation, and a hurricane as a synthesis of our knowledge of the carbon dynamics measured using flux towers following disturbance (Amiro et al. 2010). Data from these sites continue to contribute to the global knowledge base of disturbance effects on carbon cycling and potential climate change caused.
The Canadian Carbon Program (2007-2011) followed the Fluxnet Canada Research Network and the research program at the University of Manitoba concentrated on a group of study sites in northern Manitoba near Thompson. The Northern Old Black Spruce (NOBS) site was taken over by the University of Manitoba in 2005 as the longest running boreal forest flux tower, started by Harvard University in 1994. Post-doctoral fellows Alison Dunn and Manasah Mkhabela, plus technicians Syd Jones and Jenna Rapai worked on this key site until it was decommissioned in 2009. The data legacy from 1994 to 2008 at the NOBS site is being used by the global flux community to better understand the Earth’s carbon balance and to verify models and remote-sensing algorithms (e.g., Chen et al. 2011). Water Balance in Forests:
One goal of the Canadian Carbon Program was to obtain more data on intermediate-aged forests and to understand their functioning. A measurement program began on a post-fire chronosequence in the Thompson area to measure the effect of forest age and topography (lowland compared to upland) on evapotranspiration. Some of these sites were identical to locations used previously by Agriculture and Agri-Food Canada for long-term soil temperature measurements where Pascal Cyr, a graduate student with Dr. David Lobb (Soil Science), had worked. An energy-balance residual technique was developed (Amiro 2009) and used at these sites. It was shown that upland sites and older forests have higher evapotranspiration. The project was co-funded through a U.S. National Sciences Foundation grant to the University of Wyoming, University of Wisconsin and the University of Manitoba. The University of Wyoming measurements concentrated on tree physiology related to age and site location. Graduate student Corinne Barker (Manitoba) worked on the project as well as students from the other partner universities (Barker 2009, Barker et al. 2009, Bond-Lamberty et al. 2011). These measurements were terminated in 2008 and the sites were decommissioned in 2009. Northern Peatlands
Dr. Mario Tenuta and colleagues began measurements of methane and carbon dioxide fluxes from northern peatlands in 2008 using an eddy covariance flux tower. This built on previous measurements using soil chambers. Graduate student Krista Hanis collected data for the 2008-2011 period investigating the effects of temperature and water-table height on methane fluxes at a fen near Churchill Manitoba (Hanis 2010). She demonstrated that near-surface temperature was the most important factor determining methane emissions, but that water table height had a secondary control. .
30

Teaching Program In 1975, Dr. Shaykewich introduced the first course in agrometeorology in the
Faculty of Agricultural and Food Sciences at the University of Manitoba. This course was offered at the third year level and there were no prerequisites. It was intended for all students in the Faculty. Topics covered were general circulation of the atmosphere, radiation, temperature, temperature and plant growth, weather and insect development (given by the Entomology Department), and weather and animal production (given by the Animal Science Department). The final chapter was a review of basic meteorology and an introduction to the services available from Environment Canada (given by a member of the Winnipeg Weather Office).
In 2000, Dr. Bullock assumed responsibility for teaching the undergraduate Introductory Agrometeorology course. The content of the course has remained similar to that provided by Dr. Shaykewich. It covers fundamentals about temperature, pressure, density, composition and general circulation in the atmosphere, radiation and energy transfer, moisture exchange, meteorological impacts on plants, animals and insects as well as climate fundamentals and climate change. Every year, the content of the course has been enriched by guest lecturers, usually people with practical experience in agrometeorology. This has included Rick Raddatz, formerly of Environment Canada, Guy Ash and Bruce Burnett of the Canadian Wheat Board and Andy Nadler, formerly agrometeorologist with Manitoba Agriculture, Food and Rural Initiatives. Most recently, Dr. Manasah Mkhabela, who is a micrometeorologist and research associate in the Department of Soil Science, University of Manitoba, has provided a series of lectures on the FAO Soil Water Index and its application for crop condition assessment in southern Africa. The course has remained very popular with more than 300 students completing the course over the 11 year period from 2000 through 2010.
About 1985 a graduate level course was developed. Some of the topics included in the course were: momentum, heat and mass transfer in the boundary layer, evapotranspiration, radiant energy in plant canopies, carbon dioxide, and modeling crop phenology. Like most other graduate level courses in the Department of Soil Science this course was offered every second year.
In the winter term of 2002, Dr. Bullock introduced his version of the Agricultural Micrometeorology graduate course. The content built upon the material in the undergraduate course and included energy, mass and momentum flux, soil heat and water flux and the micrometeorological methods of mass flux determination. This course was taught in 2002, 2004 and 2005. In 2007, Dr. Brian Amiro, an international expert in micrometeorology and Head of the Department of Soil Science, started teaching the section on eddy covariance and net energy exchange. In the past 2 offerings in 2009 and 2011, the course has three teaching sections, the first two on energy, mass and momentum flux and soil heat and water flux being taught by Dr. Bullock and the micrometeorological methods section taught by Dr. Amiro. The final section of the course is taught by the students themselves, with each student providing a 30 minute presentation on a micrometeorological aspect of their research followed by discussion with other class members. Thus, the final section of the course changes from class to class and varies with the research focus of the students in each. Over the time period from 2002 through 2011, there have been 29 graduate students who have completed the course.
31

Canadian Wheat Board Quoting the Canadian Wheat Board website “The history of the Canadian Wheat Board (CWB) is grounded in the experience of farmers prior to World War I. Many farmers at the time felt captive to the railways, the line elevator companies, and the Winnipeg Grain Exchange for the delivery, weighing, grading, and pricing of their grain. They wanted greater power and protection for themselves in the grain marketing system. They developed a strong confidence in cooperative strategies and government intervention for addressing their needs.” Many developments took place over the next decades and on July 5, 1935, The Canadian Wheat Board Act was signed into law. The mandate and authority of the CWB has varied over the years. (The reader is referred to its website for details.) Very briefly, its mandate is to purchase wheat and barley from producers across the Prairies, pool the grains, and then sell them on the producers’ behalf on domestic and international markets. Weather and Crop Surveillance Section
The CWB had a culture of recognizing the need for better information on the world supply of wheat as well as other cereals with similar uses. In 1972, Drs Larry Kristjanson and James Leibfried of CWB along with George Robertson visited Dr. Reid Bryson of the University of Wisconsin. The purpose of their visit was to seek advice as to if and how weather information and forecasts could be used by CWB. The following summer Ray Garnett visited with Dr. Lorne Crosson of the University of Saskatchewan to investigate the potential value of remote sensing to CWB. In 1973, George Robertson and Ray Garnett prepared a proposal for an in-house weather and crop condition surveillance program for CWB (Robertson and Garnett 1973). They noted that “Adverse weather in the U.S.S.R. during the winter of 1971-72 and the summer of 1972 led to a serious reduction of about 25% in the 1972 Russian wheat crop. This, together with floods and droughts in other food producing areas of the world, put a serious strain on world reserves of grain. Purchases of wheat by U.S.S.R. from USA, Canada and Australia early in 1972 emphasized the need for early and continuous surveillance of weather in potential importing countries.” Accordingly CWB established the Weather and Crop Surveillance Department (WCSD) to supplement its crop information being collected from its ongoing sales and market analysis activities. They were likely the first in the world to put major resources into such a targeted weather and crop effort for the purpose of grain marketing. The role of the Department was to provide CWB’s decision makers with the best possible information on world supply. Since weather is a primary determinant of crop yield and quality, gathering and analyzing weather data from all over the world would be its most important activity. To this end, large amounts of data were obtained from the World Meteorological Organization via a dedicated telecommunications line from the Atmospheric Environment Service in Downsview, Ontario. Adrian Measner and Ray Garnett made up the section until March 1975, when Terry Martin was appointed director. In October of 1977, John Benci, who had recently completed his Ph.D. in agrometeorology, was recruited to head the recently formed section. The corn model, which had been Dr. Benci’s Ph.D. project, was useful in monitoring the US corn crop situation.
Over the next 20 years, the WCSD assimilated knowledge from many of the analysts and directors as it attempted to make better use of weather and remote sensing data to enhance its capability to monitor crop yield potential and quality. In the 1980’s, Dr Graham Walker introduced the western Canada crop production model (Walker, 1989). Crop modelling rarely progressed beyond model development to successful model implementation and operational use. At the time, drought had been the most frequent yield-limiting factor,
32

therefore a physiologically based drought index, calculated from temperature and precipitation data, was developed to integrate crop conditions over the growing season. Drought indices for each weather station were weighted according to location and then averaged to give a regional mean index upon which regional mean yield was regressed. Yields and drought indices for 1976-86 were strongly correlated (r= 0.96) with a low standard error of estimate (3% of the mean yield). Results were stable with respect to station weighting and "technology trend" assumptions. In real-time during the 1987 growing season, the model accurately forecast the yield towards the end of the growing season, but early season yield forecasts were impeded by the uncertainty over future weather. The success of the model in estimating regional mean yield was due to combining simulation and regression approaches in the modelling scheme. Recognition at the outset of the constraints and demands of the operational environment had much to do with successful implementation in real-time.
In the 1990’s, more effort was directed towards the development of remote sensing techniques for crop monitoring. Dr. Paul Bullock was hired as an analyst in 1990. He, along with M.Sc. students Klaus Hochheim (now Dr. Klaus Hochheim) from the University of Manitoba and Chris Weiss from the University of Trier, Germany, did the initial assessments of the NOAA satellite’s capability for wheat yield estimation (Bullock, 1992; Hochheim and Barber, 1998). The CWB was part of a multi-institutional effort focused on the use of remote sensing data which included the Canada Centre for Remote Sensing, the Manitoba Remote Sensing Centre and Statistics Canada (Brown et al. 1993). After 2000, Dr. Bullock published a comparison of weather versus remote sensing-based crop yield assessment (Bullock, 2004). Guy Ash further refined remote sensing capability for crop condition assessment using SPOT IV satellite data after he began working as an analyst at the CWB WCSD.
Typical Week at WCSD CWB The Weather and Crop Surveillance Department (WCSD) at the Canadian Wheat
Board (CWB) was a very interesting place to work. Although there was a certain routine weekly cycle to the job, every day brought the potential for something different and unexpected.
Basically, the WCSD was responsible for keeping current estimates of crop area, yield and production for nearly 300 different crops in different countries or regions of the world. On a routine basis, a set of weather maps (dozens on a Monday morning) were updated. Until about 1995, these maps were printed on a mainframe line printer, delivered as a stack of paper to Marion Delaronde, who then meticulously ripped them apart then hung them up in their assigned locations. The room was walled on two sides, and the walls were literally covered with maps. A person could sit in the middle of the room and see the weekly precipitation, monthly precipitation and temperature anomalies and dig down for daily information for any day of the previous week for each separate crop growing region. There were maps for the prairies, the USA, Europe, USSR, North and South Africa, SE Asia, South America and Australia. Each day, daily precipitation and temperature maps for every region were updated. Eventually these maps were generated online and could be reviewed by each analyst on their computer screens. This saved tons of paper. However, without all the maps hanging on the wall, the room never had the same “weather strategy” appearance again. Once the maps were updated on Monday morning, WCSD analysts would meet and review what had happened in the previous week and discuss what changes might be needed to make estimates of seeded or harvested crop area, crop yield and production. The changes would be
33

entered into the crop production database and the new WCSD Crop Production Forecast sheet (8 legal size pages) would be produced. It would show the most recent crop area, yield and production estimates for every crop in every region being monitored as well as a comparison showing the previous year’s values and an average for the previous 5 years. It was a challenge to keep all the information correct since the northern hemisphere crop for the next year (such as winter wheat, winter barley, etc.) was being seeded before the southern hemisphere crops for the current year in Australia, Argentina and South Africa were even mature. The table was circulated to other departments such as Sales and Marketing, Market Analysis and Transportation as well as the Commissioners who headed the CWB by Tuesday morning. In the spring and summer, when the northern hemisphere crops were being determined by the weather, there was a formal 30 minute briefing to everyone at 2:00 P.M. on every Tuesday. The analysts would provide a rapid overview of production estimates and weather conditions for their assigned areas. After that, the written summaries would be produced. A brief Weather and Crop Highlights was generated by Wednesday and usually by Thursday morning the written Weather and Crop Summary was prepared and circulated. Scattered amongst these regular duties were all the unexpected queries and requests for information and analysis surrounding anything weather and crop-related of importance to the marketing of western Canada’s wheat and barley. How much will the 1997 flood of the century reduce wheat production in western Canada? (Not much) What impact did last night’s frost have on cereal quality in western Canada? (sometimes not much, sometimes it was terrible) How much has the heat wave in southern Europe reduced the durum crop in Spain? (depends upon how soon it hit, how dry it was and the stage of development)
Dr. Paul Bullock particularly remembers the summer of 1992. The previous fall, there had been a major volcanic eruption (Mount Pinatubo) and we had observed significantly colder than normal temperatures across western Canada and many of the northern hemisphere growing regions. By the end of July, our assessment of the delay in crop development, led us to predict that even in the event of a “normal” frost date (first week of September for most areas), there would be many areas in Western Canada where the wheat would not be mature and would be of poor quality due to frost damage. The prospects were that an early frost was likely and thus, the quality of the wheat in western Canada would be even worse than the dismal estimate in the event of a “normal” frost date. This stirred up a great deal of activity at the CWB in anticipation of having to move larger volumes of feed quality wheat. By about August 21, three-quarters of the crop production area in western Canada had experienced at least one night of significant frost and many areas had experienced multiple frost events. The quality of the wheat was indeed dismal. However, in the three weeks previous to that occurrence, the initiatives undertaken to book additional sales of feed wheat and to create an interim wheat grade category to segregate slightly frost-damaged wheat, which still had some value for milling, all helped to deal with a very difficult marketing year. That was the job of WCSD. The CWB wanted as much warning as possible to be able to anticipate and mitigate the effects of weather on grain quality by taking remedial action to help maintain the best market value possible under all possible circumstances. Unfortunately, it was almost impossible to determine the value of the WCSD to the CWB. However, it would take only a handful of significant events to create enough revenue to more than justify the investment in this small department.
34

Table 2. Directors of the Weather and Crop Surveillance Section, Canadian Wheat Board Director Date of Appointment ---------- --------------------------- John Benci October, 1977 Harvey Glick July 1983 Graham Walker April 1985 Paul Bullock August 1991 Bruce Burnett November 1998 The position was morphed into the Director of Weather and Market Analysis in 2007, when the Market Analysis and Weather Departments were combined.
35
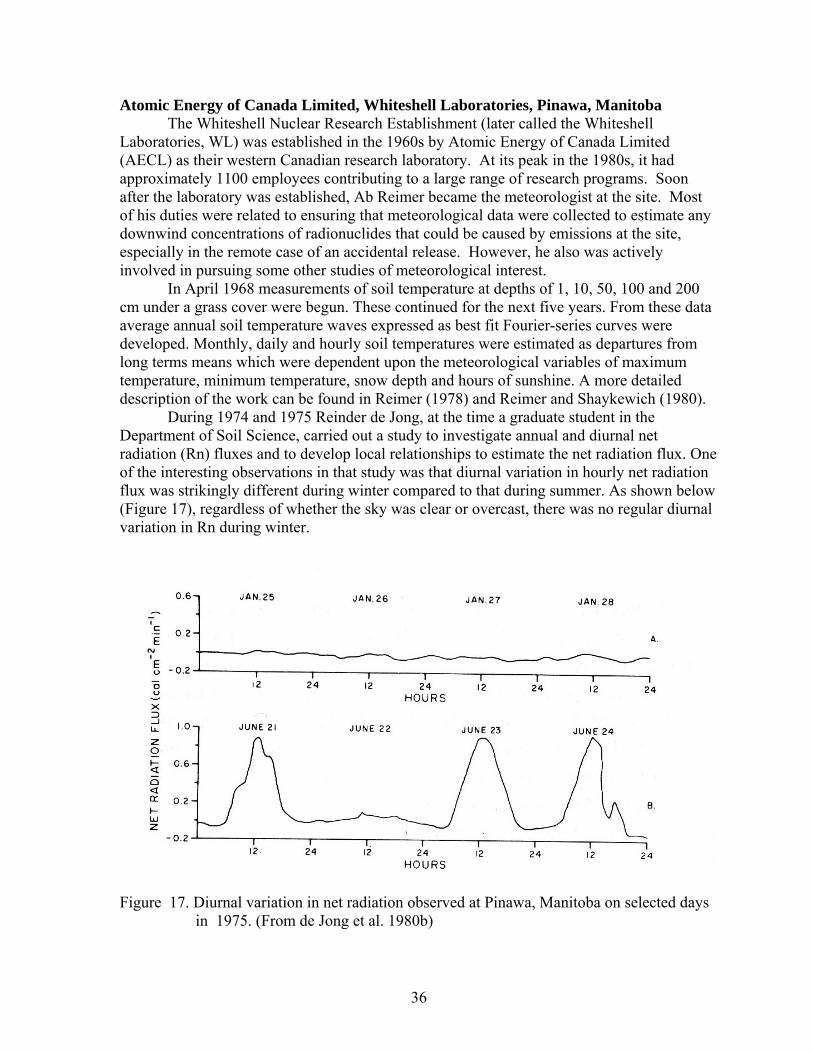
Atomic Energy of Canada Limited, Whiteshell Laboratories, Pinawa, Manitoba The Whiteshell Nuclear Research Establishment (later called the Whiteshell Laboratories, WL) was established in the 1960s by Atomic Energy of Canada Limited (AECL) as their western Canadian research laboratory. At its peak in the 1980s, it had approximately 1100 employees contributing to a large range of research programs. Soon after the laboratory was established, Ab Reimer became the meteorologist at the site. Most of his duties were related to ensuring that meteorological data were collected to estimate any downwind concentrations of radionuclides that could be caused by emissions at the site, especially in the remote case of an accidental release. However, he also was actively involved in pursuing some other studies of meteorological interest. In April 1968 measurements of soil temperature at depths of 1, 10, 50, 100 and 200 cm under a grass cover were begun. These continued for the next five years. From these data average annual soil temperature waves expressed as best fit Fourier-series curves were developed. Monthly, daily and hourly soil temperatures were estimated as departures from long terms means which were dependent upon the meteorological variables of maximum temperature, minimum temperature, snow depth and hours of sunshine. A more detailed description of the work can be found in Reimer (1978) and Reimer and Shaykewich (1980). During 1974 and 1975 Reinder de Jong, at the time a graduate student in the Department of Soil Science, carried out a study to investigate annual and diurnal net radiation (Rn) fluxes and to develop local relationships to estimate the net radiation flux. One of the interesting observations in that study was that diurnal variation in hourly net radiation flux was strikingly different during winter compared to that during summer. As shown below (Figure 17), regardless of whether the sky was clear or overcast, there was no regular diurnal variation in Rn during winter.
Figure 17. Diurnal variation in net radiation observed at Pinawa, Manitoba on selected days in 1975. (From de Jong et al. 1980b)
36

During summer diurnal Rn flux showed the typical radiation wave pattern on relatively sunny days – June 21, 23 and 24. During the night Rn was negative but shortly after sunrise Rn increased rapidly. On the other hand, June 22 was a completely overcast day and diurnal variation in Rn was hardly noticeable. For a more detailed description of the results, the reader is referred to de Jong (1978), and de Jong et al. (1980a and 1980b).
Forest Microclimatology Ab Reimer also established a long-term forest microclimatology tower in a jackpine
forest at the site. Data included temperature, humidity and wind speed at several heights within the forest, as well as soil temperatures. The data set continued for more than a decade and was documented by Amiro et al. (1985). The original establishment of the tower was intended to document forest changes as a result of tree canopy death because of a nearby field irradiator. However, the zone of influence by the irradiator was much more local and no changes in forest canopy occurred around the tower. Hence the data set forms a continuous record for an undisturbed forest. The importance of this was that it peaked interest in the micrometeorology of forest canopies, which became a theme of some programs at WL. In particular, micrometeorological techniques were used to measure evapotranspiration from forested catchments to support local hydrology studies (Amiro and Wuschke 1997, Amiro 1998). Atmospheric Dispersion and Turbulence
In the late 1970s, Dr. Phil Davis joined WL and brought direct meteorology experience to build a program on atmospheric dispersion and turbulence (Davis 1983, Davis et al., 1986, Sakiyama and Davis 1988). One of Dr. Davis’s main responsibilities was to improve the modeling and emergency response capability at WL. His experimental program included a series of 60 atmospheric diffusion trials conducted between 1979 and 1983 at WL. Each trial involved the continuous release of a tracer gas, sulphur hexafluoride (SF6), for about 1 hour from a stack 45.7 m high. Cross wind and vertical tracer concentration profiles were sampled downwind at distances up to 13 km from the source, and supporting meteorological information was collected near the source. The study was given the acronym AERAD (Atmospheric Environment, Radioactivity And Dose; Zhuang et al. 1993).
The AERAD trials helped to understand the behaviour of radionuclides released to the atmosphere from the experimental facilities at WL. This in turn led to the development of a model to predict downwind concentrations of contaminants released routinely or accidentally to the atmosphere from a source on the Canadian Shield. The results were found to be general enough that they could be applied to other heterogeneous surfaces. The results also provided some insight into specific problems such as diffusion over and within a forest, and diffusion over a snow-covered surface. The data were ultimately used to examine the role of the atmosphere in the migration of radionuclides from an underground nuclear waste disposal vault to man, as part of the environmental assessment of the Canadian nuclear fuel waste management facility proposed for the Canadian Shield.
The AERAD trials and modeling took place in the free atmosphere. However, it was recognized that the surface vegetation cover was important in altering the turbulence regime and atmospheric dispersion of particles and gases. In the early 1980s, Dr. Brian Amiro joined WL as a biometeorologist and worked with Dr. Davis making measurements of the atmospheric turbulence regime within the boreal forest. These studies used new ultrasonic anemometer technology, and because of budget limitations, they even built their own
37

anemometers through the ingenuity of Ed Wuschke, who was a supporting electronic engineer. Their forest turbulence sites were also on the short-list to be selected as the southern study area for the BOREAS experiment in the 1990s, but Prince Albert, Saskatchewan was chosen instead. However, the forest turbulence data are still widely used as the only boreal forest profile measurements (Amiro and Davis 1988, Amiro 1990a, b).
In the early 1990s, Drs. Davis and Amiro were also involved with research related to tritium transport from reactors and from sites with contaminated groundwater. One particularly novel experiment was conducted at the Chalk River Ontario laboratory where they created a free-air tritium release system that attracted researchers from Canada, the U.S., Germany and Japan, to study the pathways of uptake and release of tritium by soil and plants (Amiro and Corbett 1993; Davis et al. 1995a, b; Davis et al. 1996; Amiro et al. 1997).
Dr. Davis moved to the Chalk River Laboratories in 1990, and Dr. Yahui Zhuang joined WL with additional expertise in atmospheric dispersion and turbulence. Dr. Zhuang expanded the theoretical basis of our knowledge (Zhuang and Amiro 1994, Zhuang et al. 1996) but left in the early 1990s to work on reactor physics issues in Ontario.
Modelling and Measurements for Nuclear Fuel Waste Management By the early 1980s, the Canadian Nuclear Fuel Waste Management Program was well
established and was developing the science for permanent disposal of spent nuclear fuel waste from Canadian reactors (Zach et al. 1987). The concept involved disposing of the spent fuel in deep hard-rock formations on the Canadian Shield, with no specific site selected. Although the goal was for radionuclides to never reach the biosphere, environmental scientists were needed to assess the potential effects and transport processes if there was movement to the surface. In addition to Drs. Davis and Amiro working on the atmospheric model (Amiro and Davis 1991), Drs. Marsha and Steve Sheppard worked on soil and plant dynamics related to element transport. They developed a soil model that used agrometeorological inputs as the driving forces to predict vertical transport of radionuclides (Sheppard and Hawkins 1991, Sheppard et al. 1994). In support of these modeling efforts, other experiments were conducted to better understand the dynamics of radionuclide movement between soils, plants and the atmosphere, such as iodine (Amiro and Johnston 1989, Amiro et al. 1996) and carbon (Amiro et al. 1991). The final product of the work was a set of large reports documenting the biosphere models (Davis et al. 1993, Zach et al. 1994), which were presented at public hearings across the country.
The End Environmental research at WL evolved over three decades. It started as a basic safety
need that focused on protecting the public and understanding the effects of radiation on biota. It evolved to support the nuclear fuel waste management program from the late 1970s to the mid 1990s. From the mid 1980s to 1990s, government support decreased for research at WL, and many of the researchers contributed to contract research. As an example, this included studies on atmospheric dispersion from a potential submarine accident, establishing atmospheric sampling protocols for the Manitoba Hazardous Waste Management Corporation, radon in the atmosphere, and the fate of PCBs in soils. However, the result of the public hearings into the disposal options for Canadian nuclear fuel waste essentially recommended a hold on further work. With this major project terminated, funding ceased and environmental research halted at the site followed by dispersal of the scientists to other opportunities.
38

Environment Canada In 1980, Richard Raddatz joined the Winnipeg Climate Centre. Over the next 20 years, he would make an enormous contribution to agrometeorological work in Manitoba. Initially, his contribution was in teaching; he taught a section of the introductory agrometeorology course at the University of Manitoba. Recognizing his expertise, the Department of Soil Science appointed him as an Adjunct Professor. He assisted in obtaining data for climatological studies and served on the committees of numerous graduate students involved in climatological and phenological modeling projects. In fact, a number of students, including Guy Ash, Randall Renwick, Jana Wilson, Mark Gervais and Julian Brimelow, used his work in their research projects. Many of the projects developed in the Department of Soil Science would not have been possible without his participation. He assisted Manitoba Agriculture by establishing guidelines and regulations for straw burning by Manitoba farmers. The "stubble" (crop residue) control program used predicted ventilation coefficients based on a model that Raddatz developed to assess whether or not a day should be opened for burning.
Agrometeorological bulletins and outlooks Subsequent to the 1982 publication of “Southern Manitoba’s Climate and
Agriculture”, Richard Raddatz of Environment Canada in Winnipeg initiated the production of agrometeorological bulletins and outlooks (Raddatz, 1989). These were for the entire Prairie region as well as northwestern Ontario and used data from all the Environment Canada weather stations that reported weekly. For the bulletins, real time data were used to evaluate season-to- date growing conditions for several crops, namely wheat, barley, canola, corn, and alfalfa. Early in each growing season, planting dates for each crop in each crop district were obtained from provincial departments of Agriculture and used as a starting point for calculations. For perennial forage crops, growth was assumed to have started when the average of daily maximum and minimum exceeded 5°C for five consecutive days.
Growing degree days above 5ºC (GDD>5) were used to estimate growth stages of canola (Morrison et al. 1989) and alfalfa (Selirio and Brown 1970). Growth stage of corn was estimated from accumulated corn heat units (Brown 1969). For wheat a biometeorological time scale involving both temperature and photoperiod was used (Robertson 1968). A similar biometeorological time scale developed by Williams (1974) was used for barley. For each crop, rooting depth was calculated from the heat unit accumulation appropriate to that crop.
Site specific available soil water holding capacity data were abstracted from maps generated by de Jong and Shields (1988) and measurements conducted by Manitoba Soil Survey (Haluschak, 1987). Daily changes were modeled starting with an estimate of the previous fall’s soil moisture. The water equivalent of precipitation from November 1 to January 31 was accumulated as snow. During late winter and early spring precipitation occurring on days with mean temperatures lower than -1ºC was assumed to be snow while at higher temperatures it was classified as rain. The snow-to-water ratio was assumed to be 10:1 for ordinary climate stations while actual values were obtained at synoptic stations. From the previous fall’s estimate of soil moisture and moisture conserved from snow and spring precipitation, soil moisture status under each crop at planting at each weather station was estimated. Changes in soil moisture status were calculated from estimated actual evapotranspiration and precipitation by daily budgeting. When precipitation plus the existing soil water content exceeded the water holding capacity, the excess was designated as runoff, i.e., soil water status was never allowed to exceed capacity.
39
Potential evapotranspiration was estimated using equations employing daily maximum and minimum temperature and the daily receipt of solar radiation at the top of the atmosphere as input (Baier and Robertson 1965). Phenological stage, and an estimate of the fraction of the ground covered by actively transpiring leaf area, was estimated using models predicting growth stage. For each crop, a relationship between growth stage and fractional leaf area was assumed and defined the consumptive use factor, i.e., the ratio of plant water demand to potential evapotranspiration. Potential evapotranspiration multiplied by this consumptive use factor provided estimated daily crop water demand. This demand was met as long as the available soil moisture in the root zone was above 60% of capacity. Below 60% plant uptake was assumed to decrease linearly to zero at 0% capacity. In cases when the demand was not met, the amount of the shortfall, designated as stress, was calculated and accumulated over the growing season. A sample agrometeorological bulletin is shown in Table 3.
Agrometeorological outlooks were a forecast for the rest of the growing season. Starting with current conditions, it was assumed that weather to the end of the growing season would be average, i.e., average precipitation and temperature. With this assumption, the maturity date of each crop was forecast. Also, soil moisture status at harvest was predicted. This in turn would be an indicator of crop yield. For example, if soil moisture status were high (no moisture stress), a good yield was expected; if it were low (significant moisture stress), yield would likely be limited. A sample agrometeorological outlook is shown in Table 4. Bulletins and outlooks were produced weekly and were usually available by the Wednesday of the following week. In addition, maps were issued for many of the parameters in the Bulletins and Outlooks, The usefulness of bulletin was illustrated by a study by Raddatz et al. (1994). Five years of output from bulletins (1988-1992) at harvest date was related to yield of wheat, barley and canola on a crop district basis (obtained from Statistics Canada). Time to maturity, total crop water demand and water-use for the season explained 69%, 67% and 64% of the yield variation for spring wheat, barley and canola, respectively. Average error in estimating yield of wheat was 400 kg ha-1, for barley it was 400 kg ha-1, and for canola 240 kg ha-1. Bulletins and outlooks were based on a “first generation” model. In 1993, the second generation model was introduced (Raddatz 1993; Raddatz et al. 1996). This was a coupled atmosphere-crop-soil model. Estimates of phenological stage, root growth and fractional leaf were the same as in the first generation model. However, the crop water use portion was based on physically driven dynamics in the planetary boundary layer rather than the empirical “best fit” estimate of potential evapotranspiration of Baier and Robertson (1965). The soil was divided into a top zone of 10 cm, a growing root zone and a sub zone. Estimates of the top zone soil moisture together with estimates of fractional leaf area were used for the prediction of sclerotinia infection in canola. Resistances to evaporation from the top zone and transpiration from the plant canopy were used in estimating crop water use. Bulletins and outlooks included potatoes in addition to crops used in the first generation model. The reader is referred to Raddatz (1993) for a more detailed description of the model.
In the early 2000’s, Environment Canada decided to effectively get out of the Ag-Met business, at least that portion that involved the near real-time monitoring of the climate. The Bulletins and Outlooks were terminated in 2004 after their life-span had been extended a few years with funded from Manitoba government agencies.
40

Table 3. Sample of an agrometeorological bulletin.
41

Table 3. A sample of an agrometeorological outlook.
42

Manitoba Agriculture, Food and Rural Initiatives (MAFRI)
In May of 1994, Guy Ash was appointed the first agrometeorologist to MAFRI. He was to work out of the Soils and Crops Branch located at Carman. At the time of his appointment his duties were: - Develop and provide expertise in the area of agrometeorology with emphasis on the impact of realtime conditions and long term climatic changes (trends) on agriculture, particularly crop production, as well as long term land use activities. - To meet a range of specific client driven needs, integrate agrometeorological and other relevant land base information in the development and provision of programs and projects associated with crop production (e.g. disease forecasting) and development/assessment of strategies or proposals involving the use of agrometeorological information for specific agriculture purposes. - Provide timely information on realtime meteorological conditions and occurrences along with an assessment of the potential impact on agriculture including any appropriate management recommendations. - Provide expertise, training, leadership, and co-ordination in the integration of realtime information and its application to crop production/management and related activities. - Liaise with appropriate professionals and clients including municipal, provincial, and federal governments, universities, and agricultural producers to promote the use, application and development of realtime agrometeorological technology and information products and packages for specific applications (e.g. late blight forecasts). - Provide leadership in the development and provision of extension programs and activities to assist agricultural producers understanding and using realtime weather technology and information. - Participate in operating the annual Crop Residue Burning Authorization Program and develop expertise and protocol for applying Environment Canada weather forecast information to determine daily residue burning authorizations. - Provide branch/department input into appropriate departmental/provincial and federal committees and working groups (e.g. Manitoba Climate Advisory Committee).
Some of the accomplishments were:
- Creation of the canola sclerotinia risk forecasting program in 1996. This program was created to provide forecast risk maps to canola producers on a regional basis. The forecast maps identify regions where the environmental conditions are favourable for the development of sclerotinia. In 1999 the risk forecasting was expanded to include all of Saskatchewan and Alberta. - Establishment of a realtime weather network in 1997 for late blight forecasting in potatoes. By 1999 there were 40 weather stations providing real-time weather information. The program was designed to predict when the environmental conditions were favourable for late blight development. As result, the program provided biweekly disease severity index maps for five potato growing regions in Manitoba. - Establishment of a realtime weather network in 1998 for the Vegetable Growers Association of Manitoba (VGAM). The goal of this network was to provide growers and industry with weekly assessments of diseases/pests pressure as they related to environmental conditions in the field. A number of models and raw data were analyzed, e.g. growing degree-days and their relation to onion maggots, European corn borer, cabbage maggot. Also,
43

disease models were used to predict disease pressure, e.g. Wisdom/tomcast for the development of alternaria blight, early and late blight. - Implementation of an operational irrigation scheduling model for potatoes in 1998. This model provided growers with field level recommendations of when to apply water to maintain soil moisture levels at predefined levels, e.g., 75% of field capacity. The model was accepted and used by growers as a management tool for irrigation scheduling. - Establishment of the Agro meteorological Centre of Excellence (ACE) in May 1999. It was the goal of ACE to provide producers and related industries with recommendations through the provision of timely crop and pest advisories based on weather monitoring, agrometeorological modeling and field surveys. During the 1999 growing season ACE was producing nearly 150 maps and interpretations per week on a number of production issues. - Development and implementation of the first near real-time fusarium head blight forecasting program for wheat in Western Canada (June, 1999). The goal of this program was to provide bi-weekly risk maps and interpretations to growers and industry representatives. These products were intended to be regional in nature. With the implementation of field level real-time networks, these models became applicable to growers. - Implementation of a real-time weather network for Agro-Manitoba, September, 1999. The goal of the real-time network was to provide producers, industry and government departments with timely weather information for a number of management decisions, e.g. disease forecasting, and water management. Ultimately the total network consisted of 250 weather stations for Agro-Manitoba providing weather information every 15 minutes. - December 2000 - Development, modification, and evaluation of field level models for sclerotinia, fusarium head blight, late blight, estimation of relative feed values and irrigation scheduling. These models were implemented on the real-time weather network for Agro-Manitoba and were capable of supplying field level recommendations, for a number of agronomic problems, to producers, industry and government representatives.
In 2000, Andrew Nadler graduated from University of Winnipeg with a B.Sc. in
Geography and began working at the Agrometeorological Centre of Excellence (ACE) in Carman as a GIS and Data Management Specialist. In 2002 he accepted a position with Manitoba Agriculture and Food (MAF) as Ag Resource/GIS Specialist in the Ag Resource Section of Soils and Crops Branch. In 2003 he began part-time Masters Program in the Department of Soil Science at University of Manitoba while continuing to work for the Province. In 2004 he became Agricultural Meteorologist in the newly formed Crops Knowledge Centre (of the previous Soils and Crops Branch) of Manitoba Agriculture, Food and Rural Initiatives (MAFRI) directed by Don Dixon. In 2005 he began the Manitoba Ag-Weather Program, an initiative to enhance the amount of weather monitoring in Ag-Manitoba, funded through the Agricultural Policy Framework. In 2007 he completed MSc. in Department of Soil Science, supervised by Dr. Paul Bullock (Nadler 2007).
At that time some specific initiatives of the MAFRI Ag-Met Program were: − Potato weather network: Beginning in1998, 20-30 weather stations with real-time
communications were installed in potato fields to monitor conditions and provide the modelled late blight risk. In 2008, estimated crop water demand was added to the output to assist growers with irrigation management.
44

− By early 2010, the Manitoba Ag-Weather Program consisted of about 35 research-grade weather stations, monitoring rainfall, air temperature, relative humidity, wind speed/direction, and soil temperature. Station observations were updated hourly and available online (http://tgs.gov.mb.ca/climate). By fall of 2010, weighing gauges to measure snowfall were added to a number of stations. Soil moisture sensors were also being added to some stations.
− Manitoba Crop Residue Burning Program: Since 1993, burning of crop residue has been regulated. Between August 1 and November 15 of each year, the Ag-Meteorologist was responsible for authorizing when and where burning was permitted within the province. The decision was based on forecasted winds, atmospheric boundary layer height, and atmospheric stability.
− Manitoba Fall Soil Moisture Survey: Soil moisture is of huge importance for agriculture, being an early sign of drought, excess moisture, and an indicator of yield potential. To provide an estimate of the provincial soil moisture status in fall, just prior to winter freeze-up, an annual survey was done during the last week of October.
45

References Amiro, B.D. 1990. Drag coefficients and turbulence spectra within three boreal forest
canopies. Boundary-Layer Meteorol. 52: 227-246. Amiro, B.D. 1990. Comparison of turbulence statistics within three boreal forest canopies.
Boundary-Layer Meteorol. 51: 99-121. Amiro, B.D. 1998. Footprint climatologies for evapotranspiration in a boreal catchment. Agric. For. Meteorol. 90: 195-201. Amiro, B.D. 2009. Measuring boreal forest evapotranspiration using the energy balance
residual. J. Hydrol. 366: 112-118. Amiro, B.D. 2010. Estimating annual carbon dioxide eddy fluxes using open-path analysers
for cold forest sites. Agric. For. Meteorol. 150:1366-1372. Amiro, B.D., A.G. Barr, T.A. Black, H. Iwashita, N. Kljun, J.H. McCaughey, K.
Morgenstern, S. Murayama, Z. Nesic, A.L. Orchansky, and N. Saigusa. 2006. Carbon, energy and water fluxes at mature and disturbed forest sites, Saskatchewan, Canada. Agric. For. Meteorol. 136: 237-251.
Amiro, B.D., A.G. Barr, J.G. Barr, T.A. Black, R. Bracho, M. Brown, J. Chen, K.L. Clark, K.J. Davis, A.R. Desai, S. Dore, V. Engel, J.D. Fuentes, A.H. Goldstein, M.L. Goulden, T.E. Kolb, M.B. Lavigne, B.E. Law, H.A. Margolis, T. Martin, J.H. McCaughey, L. Misson, M. Montes-Helu, A. Noormets, J.T. Randerson, G. Starr, and J. Xiao. 2010. Ecosystem carbon dioxide fluxes after disturbance in forests of North America. J. Geophys. Res. 115, G00K02, doi: 10.1029/2010JG001390.
Amiro, B.D. and P.A. Davis. 1988. Statistics of atmospheric turbulence within a natural black spruce forest canopy. Boundary-Layer Meteorol. 44: 267-283.
Amiro, B.D. and P.A. Davis. 1991. A pathways model to assess transport of radionuclides from terrestrial and aquatic surfaces to the atmosphere. Waste Manage. 11: 41-57.
Amiro, B.D., P.A. Davis, F.L. Johnston and W.J.G. Workman. 1997. Theoretical and practical aspects of a free-atmosphere tritium exposure system. J. Environ. Radioactivity 36:141-156.
Amiro, B.D. and F.L. Johnston. 1989. Volatilization of iodine from vegetation. Atmos. Environ. 23: 533-538.
Amiro, B.D., A.L. Orchansky, A.G. Barr, T.A. Black, S.D. Chambers, F.S. Chapin III, M.L. Goulden, M. Litvak, H.P. Liu, J.H. McCaughey, A. McMillan and J.T. Randerson. 2006. The effect of post-fire stand age on the boreal forest energy balance. Agric. For. Meteorol. 140: 41-50.
Amiro, B.D., S.C. Sheppard, F.L. Johnston, W.G. Evenden and D.R. Harris. 1996. Burning radionuclide question: what happens to iodine, cesium and chlorine in biomass fires? Sci. Total Environ. 187: 93-103. Amiro, B.D. and E.E. Wuschke. 1987. Evapotranspiration from a boreal forest drainage
basin using an energy balance/eddy correlation technique. Boundary-Layer Meteorol. 38: 125-139.
Amiro, B.D., Y. Zhuang, and S.C. Sheppard. 1991. Relative importance of atmospheric and root uptake pathways for 14CO2 transfer from contaminated soil to plants. Health Physics 61(6): 825-829. Ash, G.H.B. 1991. M.A. An agroclimatic risk assessment of southern Manitoba and southeastern Saskatchewan. M.A. Thesis, Department of Geography, University of Manitoba.
46

Ash, G.H.B., Shaykewich, C.F. and Raddatz, R.L. 1992a. Moisture risk assessment for spring wheat on the eastern Prairies: a water use simulation model. Climatol. Bull. 26:65-78. Ash, G.H.B., Shaykewich, C.F. and Raddatz, R.L. 1992b. Agricultural Climate of the Eastern Canadian Prairies. Province of Manitoba Publication. Ash, G.H.B., Shaykewich, C.F. and Raddatz, R.L. 1993. The biologically important thermal character of the eastern Prairie climate. Climatol, Bull. 27:3-20. Ash, G.H.B., Blatta, D.A., Shaykewich, C.F., Wilson, J.L., and Raddatz, R.L. 1998. Agricultural Climate of Manitoba. Province of Manitoba Publication. Baier, W. 1971. Evaluation of latent evaporation estimates and their conversion to potential evaporation, Can. J. Plant Sci. 51: 255–266. Baier, W., and Robertson, G.W. 1965. Estimation of latent evaporation from simple weather observations. Can. J. Plant Sci. 45:276-284. Baier, W., Dyer, J. A. and Sharp, W. R. 1979. The versatile soil moisture budget. Tech. Bull. No. 87. Agriculture Canada, Ottawa, ON. 52 pp. Barker, Corinne A. 2009. Effects of Forest Age and Topography on Boreal Forest Evaporation and Water Balance. M.Sc. Thesis. Department of Soil Science, University of Manitoba Barker, C.A., B.D. Amiro, H. Kwon, B.E. Ewers, and J.L. Angstmann. 2009. Evapotranspiration in intermediate-aged and mature boreal fens and upland forests. Ecohydrology 2: 462-471. Baron, V., Shaykewich, C.F. and Hamilton, R.I. 1975. Relation of corn maturity to climatic parameters. Can. J. Soil Sci. 55:343-347. Blackman, P. G. and Davis, W. J. 1985. Root to shoot communication in maize plants of the effects of soil drying. J. Exp. Bot. 36: 39–48. Blatta, D.A., Shaykewich, C .F., and Ash, G.H.B. 1997. Heat units for potato production in Manitoba. Canada-Manitoba Agreement of Agricultural Sustainability Factsheet. Boken, V.K., and Shaykewich, C.F. 2002. Improving an operational wheat yield model for the Canadian Prairies using phenological stage-based normalized difference vegetation index. Int. J. Remote Sens. 23:4155-4168. Bond-Lamberty, B., S.T. Gower, B. Amiro and B.E. Ewers. 2011. Measurement and
modeling of bryophyte evaporation in a boreal forest chronosequence. Ecohydrology. 4: 26-35.
Brown, D.M. 1969. Heat units for corn in southern Ontario. Leaflet 111/31. Ontario Department of Agriculture and Food. Brown, R.J., Brisco, B., Leconte, R., Major, D.J., Fischer, J.A., Reichert, G., Korporal, K.D.,
Bullock, P.R., Pokrant, H. and Culley, J. 1993. Potential applications of Radarsat data to agriculture and hydrology. Can. J. Remote Sens. 19: 317-337.
Bullied, W.J., Van Acker, R.C. and Bullock, P.R. 2007. Field calibration of an impedance soil water probe for the shallow seedling recruitment zone across a field landscape with heterogeneous soil properties. Soil Use Manage. 23: 262-268.
Bullied, W.J., Bullock, P.R., and Van Acker, R.C. 2011. Modeling the soil water retention characteristic with pedotransfer functions for shallow seedling recruitment. Soil Sci. 176(2): 57-72
Bullock, P.R. 1992. Operational estimates of Western Canadian grain production using NOAA AVHRR LAC data. Can. J. Remote Sens. 18: 23-28.
47

Bullock, P.R. 2004. A comparison of growing season agrometeorological stress and single date Landsat NDVI for wheat yield estimation in west central Saskatchewan. Can. J. Remote Sens. 30(1): 101-108. Bullock, P. R., Li, X. and Leonardi, L. 2004. Near-infrared spectroscopy for soil water
determination in small soil volumes. Can. J. Soil Sci. 84: 333–338. Bullock, P.R., Shaykewich, C.F., Nadler, A.J., Padbury, G.A., Cutforth, H.W. and Malhi, S.
2010. Soil-climatic conditions in agro-ecological regions of the Northern Great Plains of North America. In Recent Trends in Soil Science and Agronomy Research in the Northern Great Plains of North America (Malhi, S., Gan. Y., Schoenau, J.J., Lemke, R.H. and Liebig, M.A., eds.), Research Signpost, Kerala, India pp 1-31. Burnett, R. B. 1984. Determination of climatically suitable areas for soybean production in Manitoba. M.Sc. Thesis, Department of Soil Science, University of Manitoba Burnett, R.B., Falk, G.W. and Shaykewich, C.F. 1985. Determination of climatically suitable areas for soybean (Glycine max (L.) Merr.) production in Manitoba. Can. J. Plant Sci. 65:511-522. Chen, J.M., A. Govind, O. Sonnentag, Y. Zhang, A. Barr and B.D. Amiro. 2006. Leaf area measurements at Fluxnet Canada forest sites. Agric. For. Meteorol. 140: 257-268 Chen, B., N.C. Coops, D. Fu, H.A. Margolis, B.D. Amiro, A.G. Barr, T.A. Black, M.A.
Arain, C.P.-A. Bourque, L.B. Flanagan, P.M. Lafleur, J.H. McCaughey, and S.C. Wofsy. 2011. Assessing eddy-covariance flux tower location bias across the Fluxnet-Canada, Research Network based on remote sensing and footprint climatology modeling. Agric. For. Meteorol. 151:87-100.
Churchill, Jacqueline A. 2007 Spatial Variation of Soil Methane and Nitrous Oxide Emissions in Subarctic Environments of Churchill, Manitoba. M.Sc. Thesis. Department of Soil Science, University of Manitoba
Coligado, M.C., and Brown, D.M. 1975. Response of corn in pre-tassel initiation period to temperature and photoperiod. Agric. Meteorol. 14:357-367. Connor, A.J. 1939. The Climate of Manitoba. Manitoba Economic Survey Board. 163 p Cosby, B. J., Hornberger, G. M., Clapp, R. B. and Ginn, T. R. 1984. A statistical exploration of the relationship of soil moisture characteristics to the physical properties of soils. Water Resour. Res. 20: 682–690 Coursolle, C., H.A. Margolis, A.G. Barr, T. A. Black, B.D. Amiro, J.H. McCaughey, L.B. Flanagan, P.M. Lafleur, N.T. Roulet, C. P.-A. Bourque, M.A. Arain, S.C. Wofsy, A. Dunn, K. Morgenstern, A.L. Orchansky, P.Y. Bernier, J.M. Chen, J. Kidston, N. Saigusa, and N. Hedstrom. 2006. Late-summer carbon fluxes from Canadian forests and peatlands along an east-west continental transect. Can. J For. Res. 36:783-800. Cutforth, H.W. 1980. Evaluation of a crop simulation model. M.Sc. thesis, Department of Soil Science, University of Manitoba Cutforth, H.W. 1985. Dependence of corn development from germination to silking on physical environment. Ph.D. thesis, Department of Soil Science, University of Manitoba. Cutforth, H.W. and Shaykewich, C.F. 1989. Relationship of development rates of corn from planting to silking to air and soil temperature and to accumulated thermal units in the Prairie environment. Can J. Plant Sci. 69:121-132. Cutforth, H.W. and Shaykewich, C.F. 1990. A temperature response function for corn development. Agric. For. Meteorol. 50:159-171.
48

Davis, P.A. 1983. Markov-chain simulations of vertical dispersion from elevated sources into the neutral planetary boundary-layer. Boundary-Layer Meterol. 26: 355-376. Davis, P.A., A. Reimer, S.K. Sakiyama and P.R. Slawson. 1986. Short-range atmospheric dispersion over a heterogeneous surface – 1. Lateral dispersion. Atmos.
Environ. 20: 41-50 Davis, P.A., R. Zach, M.E. Stephens, B.D. Amiro, G.A. Bird, J.A.K. Reid, M.I. Sheppard,
S.C. Sheppard, and M. Stephenson. 1993. The disposal of Canada's nuclear fuel waste: The biosphere model, BIOTRAC, for postclosure assessment. Atomic Energy of Canada Limited Report, AECL-10720, COG-93-10. 531 pp.
Davis, P.A., W.J.G. Workman, B.D. Amiro, F.S. Spencer, H. Noguchi, H. Amano, Y. Ichimasa and M. Ichimasa. 1995. Overview of the 1994 chronic HT release experiment
at Chalk River. Fusion Technol. 28: 840-845. Davis, P.A., D.C. Galeriu, F.S. Spencer and B.D. Amiro. 1995. Evolution of HTO concentration in soil, vegetation and air during an experimental chronic HT release.
Fusion Technol, 28: 833-839. Davis, P.A., B.D. Amiro, W.J.G. Workman and B.J. Corbett. 1996. HTO transfer from
contaminated surfaces to the atmosphere: a database for model validation. Atomic Energy of Canada Limited Report, AECL-11222, COG-93-316-I, 47 pp.
Deardorff, J. W. 1977. A parameterization of ground-surface moisture content for use in atmospheric prediction models. J. Appl. Meteorol. 16: 1182–1185. de Jong, R. P. 1978. Energy exchange at the soil surface and the soil temperature regime. Ph.D. thesis, Department of Soil Science, University of Manitoba. de Jong, R.P., and Shields, J. A. 1988. Available water-holding capacity maps of Alberta, Saskatchewan and Manitoba. Can. J Soil Sci. 68:157-163. de Jong, R.P., Shaykewich, C.F., and Reimer, A. 1980a. The calculation of the net radiation flux. Arch. Met. Geoph. Biokl., Ser B, 28:353-363. de Jong, R.P., Shaykewich, C.F., and Reimer, A. 1980b. The net radiation flux and its prediction at Pinawa, Manitoba. Agric. Meterol. 22:217-225. DePauw, R.M., Malhi, S.S., Bullock, P.R., Gan, Y.T., McKenzie, R.H., Larney, F., Janzen, H.H., Cutforth, H.W. and Wang, H. 2011. Wheat production in northern high latitudes – Canadian example. In World Wheat Book, Volume 2 (Bonjean, A., Angus, W.J. and Van Ginkel, M. eds.) (In press, Lavoisier Publishing, Paris) Drolet, G.G., E.M. Middleton, K.F. Huemmrich, F.G. Hall, B.D. Amiro, A.G. Barr, T.A. Black, H.J. McCaughey, H.A. Margolis. 2008. Regional mapping of gross light-use efficiency using MODIS spectral indices. Remote Sens. Environ. 112: 3064-3078. Dunlop, S. 1981. An agroclimatology of southern Manitoba. M.A. Thesis, Department of Geography, University of Manitoba. Dunlop, S. and Shaykewich, C.F. 1982. Southern Manitoba's Climate and Agriculture. Manitoba Department of Agriculture Publication. Dunmola, Adedeji S. 2007 Greenhouse Gas Emission from a Prairie Pothole Landscape in Western Canada. M.Sc. Thesis, Department of Soil Science, University of Manitoba. Falk, G. 1981. Environmental factors affecting soybean growth in Manitoba. M.Sc. Thesis, Department of Soil Science, University of Manitoba Finlay, G.J., Bullock, P.R., Sapirstein, H.D., Naeem, H.A., Hussain, A., Angadi, S.V. and DePauw, R.M. 2007. Genotypic and environmental variation in grain, flour, dough and bread making characteristics of western Canadian spring wheat. Can. J Plant Sci. 87: 679-690.
49

Gervais, M.D., Bullock, P.R., Mkhabela, M., Finlay, G.J. and Raddatz, R. 2010. Improvements to the accuracy of modelled soil water content from the 2nd generation Prairie agrometeorological model. Can. J Soil Sci. 90: 527-542. Gervais, M.D., Mkhabela, M., Bullock, P.R., Raddatz, R. and Finlay, G.J. Comparison of
standard and actual crop evapotranspiration estimates derived from different methods on the Canadian Prairie. Hydrol. Proc. (in press, DOI: 10.1002/hyp.8279)
Glenn, A. J. 2010. Greenhouse gas fluxes and budget for an annual cropping system in the Red River Valley, Manitoba, Canada. Ph.D. Thesis. Department of Soil Science, University of Manitoba
Glenn, A.J., B.D. Amiro, M. Tenuta, S.E. Stewart, and C. Wagner-Riddle. 2010. Carbon dioxide exchange in a northern prairie cropping system over three years. Agric. For. Meteorol. 150: 908-918.
Glenn, A.J., B.D. Amiro, M. Tenuta, C. Wagner-Riddle, G. Drewitt, and J. Warland. 2011. Contribution of crop residue carbon to total soil respiration at a northern Prairie site using stable isotope flux measurements. Agric. For. Meteorol. 151: 1045-1054.
Haluschak, P. 1987. Soil water holding capacities of selected Manitoba soils. Proceedings the 30th annual Manitoba Soil Science Society Meetings, Jan 6 & 7, 1987. pp 32-43.
Hanis, Krista. 2010. Eddy covariance measurements of methane flux in a subarctic fen with emphasis on spring-melt period. M.Sc. Thesis, Department of Soil Science, University of Manitoba Hobbs, E. H and Krogman, K. K. 1963. Observed and estimated evapotranspiration in Southern Alberta. Trans. ASAE. 6: 502–507. Hochheim, K.P. and Barber, D.G., 1998. Spring wheat yield estimation for Western Canada
using NOAA NDVI data. Can. J. Remote Sens. 24, 17–27. Hodges, T. 1997. The SIMPOTATO growth simulation model version 1.60 for Windows 95 programmers manual. USDA-ARS, Prosser, Wa 99350 Holzapfel, C. B., Lafond, G. P., Brandt, S. A., Bullock, P. R., Irvine, R. B., James, D. C.,
Morrison, M. J. and May, W. E. 2009a. Optical sensors have potential for determining nitrogen fertilizer topdressing requirements of canola in Saskatchewan. Can. J. Plant. Sci. 89: 411-425.
Holzapfel, C. B., Lafond, G. P., Brandt, S. A., Bullock, P. R., Irvine, R. B., Morrison, M. J., May, W. E and James, D. C. 2009b. Estimating canola (Brassica napus L.) yield potential using an active optical sensor. Can. J. Plant. Sci. 89: 1-12.
Huang, Q., Akinremi, O. O., Sri Rajan, R. and Bullock, P. 2004. Laboratory and field evaluation of five soil water sensors. Can. J. Soil Sci. 84: 431–438.
Jarvis, Chad K. 2006 .Growing Season Weather Impacts on Canada Western Red Spring Wheat Grown in Producer Fields across Western Canada. M.Sc. Thesis, Department of Soil Science, University of Manitoba Jarvis, C.K., Sapirstein, H.D., Bullock, P.R., Naeem, H.A., Angadi, S.V. and Hussain, A. 2008. Models of Growing Season Weather Impacts on Breadmaking Quality of Spring Wheat from Producer Fields in Western Canada. J Sci. Food Agric. 88(13): 2357–2370. Johnston, F.L. and B.D. Amiro. 1994. Household humidifiers as a radiological dose
pathway. Health Phys. 67(3):276-279. Johnston, K.J. and Louie, P.Y.T. 1984. An operational water budget for climate monitoring. Canadian Climate Centre Report No. 84-3. 52 pp.
50

Keatinge, J.D.H. 1975. The influence of the physical environmental factors on the productivity potential of fababeans. M.Sc. Thesis, Department of Soil Science, University of Manitoba. Keatinge, J.D.H. and Shaykewich, C.F. 1977. Effects of the physical environment on the growth and yield of field beans (Vicia faba minor) in the Canadian Prairies. J. Agric. Sci. 89:349-353. Knapp, H. V. 1985. Evaporation and transpiration. Pages 537–554 in Handbook of meteorology. D. D. Houghton, ed. John Wiley and Sons, New York, NY Krpan, J.R.B. 1982. The Characterization and Estimation of Soil Temperature in Manitoba. M. A. Thesis, Department of Geography, University of Manitoba. Landsberg, J.J. 1977. Some useful equations for biological studies. Exp. Agric. 13:273-286. Mahfouf, J. 1991. Analysis of soil moisture from near-surface parameters: a feasibility study. J. Appl. Meteorol. 30: 1534–1547. Major, D. J., W.L. Pelton, C.F. Shaykewich, S.H. Gage and D.G. Green. 1976. Heat units for corn in the Prairies. Canadex 111.070. Major, D. J., Gage, S.H., Shaykewich, C.F., and Pelton, W.L. 1978. Variability and trends of corn heat units on the Canadian Prairies. Int. J. Biometeorol. 22:235-241. McKay, G.A. 1964. Relationships between snow survey and climatological measurements for the Canadian Great Plains. Proceedings of Western Snow Conference. pp. 9-19. Mills, G.F, Tarnocai, C. and Shaykewich, C.F. 1978. Characteristics and distribution of soil temperature regimes in Manitoba, Canada. 11th Congress of the International Society of Soil Science, Edmonton, Alta., June 1978. Vol 1, p 5. Mkhabela, M.S., B.D. Amiro, A.G. Barr, T.A. Black, I. Hawthorne, J. Kidston, J.H. McCaughey, A.L. Orchansky, Z. Nesic, A. Sass, A. Shashkov and T. Zha. 2009. Comparison of carbon dynamics and water use efficiency following fire and harvesting
in Canadian boreal forests. Agric. For. Meteorol. 149: 783-794. Mkhabela, M.S., Bullock, P.R., Raj, S., Wang, S. and Yang, Y. 2011. Crop yield forecasting
in the Canadian prairies using MODIS NDVI data. Agric. For. Meteorol. 151: 385-393. Mkhabela, M.S., Bullock, P.R., Gervais, M.D., Finlay, G.J. and Sapirstein, H.D. 2010. Assessing indicators of agricultural drought impacts on spring wheat yield and quality on the Canadian prairies. Agric. For. Meteorol. 150: 399-410. Morrison, M.J., McVetty, P.B.E., and Shaykewich, C.F. 1989. The determination and verification of a baseline temperature for the growth of Westar summer rape. Can J. Plant Sci. 69:455-464. Nadler, A.J. 2007. An agroclimatic risk assessment of crop production on the Canadian Prairies. M.Sc. thesis, Department of Soil Science, University of Manitoba, [online] http://hdl.handle.net/1993/2829 Nadler, A.J. and Bullock, P.R. 2011. Long-term changes in heat and moisture related to corn production on the Canadian Prairies. Climatic Change 104(2): 339-352. Noilhan, J. and Planton, S. 1989. A simple parameterization of land surface processes for meteorological models. Mon. Weather. Rev. 17: 536–549. Oke, T. R. 1987. Boundary layer climate, Second ed. Methuen, New York, NY. 435 pp. Philip, J. R. 1957. Evaporation and moisture and heat field in the soil. J. App. Meteorol. 14: 354 – 366. Priestly, C. H. B. 1959. Turbulent transfer in the lower atmosphere. The University of Chicago Press, Chicago, IL. 116 pp.
51

Raddatz, R.L. 1989. An operational agrometeorological information system for the Canadian Prairies. Climatol. Bull. 23:83-97. Raddatz, R.L. 1993. Prairie agroclimate boundary-layer model: a simulation of the atmosphere/crop-soil interface. Atmos-Ocean 31:399-419. Raddatz, R. L. and Khandekar, M. L. 1977. Numerical simulation of cold easterly circulations over the Canadian western plains using a mesoscale boundary layer model. Bound. Layer Meteorol. 11: 307–327. Raddatz, R. L. and Khandekar, M. L. 1979. Upslope enhanced extreme rainfall events over the Canadian western plains: a mesoscale numerical simulation. Mon. Weather. Rev. 107: 650–661. Raddatz, R.L., Shaykewich, C.F., and Bullock, P. 1994. Prairie crop yield estimates from modeled phenological development and water use. Can. J. Plant Sci. 74:429-436. Raddatz, R.L., Ash, G.H.B., Shaykewich, C.F. and Roberge, K.A. 1996. First and second generation operational agrometeorological models for the Prairies and simulated water demand for potatoes. Can. J. Soil Sci. 76:297-305. Rasmussen, V. P. and Hanks, R. J. 1978. Spring wheat yield model for limited moisture conditions. Agron. J. 70: 940–944. Reimer, A. 1978. Soil temperature estimation from meteorological measurements. M.Sc. thesis, Department of Soil Science, University of Manitoba. Reimer, A., and Shaykewich, C.F. 1980. Estimation of Manitoba soil temperatures from atmospheric meteorological measurements. Can. J Soil Sci. 60:299-309. Renwick, R. 1999. Evaluation of a simulation model for potato growth. M.A. Thesis, Department of Geography, University of Manitoba. Robertson, G.W. 1968. A biometeorological time scale for a cereal crop involving day and night temperatures and photoperiod. Int. J. Biomet. 12-191-223. Robertson, G.W. 1998. A history of agrometeorology in Canada. Unpublished report, Atmospheric Environment Program, Environment Canada. Robertson, G.W., and Garnett, E.R. 1973. Proposal for a Weather and Crop – Condition Surveillance Program. Canadian Wheat Board. 1973. Saiyed, I., Bullock, P.R., Sapirstein, H.D., Finlay, G.J., and Jarvis, C.K. 2009 Thermal time models for estimating wheat phenological development and weather-based relationships to wheat quality. Can. J Plant Sci. 89: 429-439 Sakiyama, S.K. and P.A. Davis. 1988. Additional field verification of convective scaling for the lateral dispersion parameter. J. Appl. Meteorol. 27: 882-884. Sands, P. J., Hacket, C. and Nix, H. A. 1979. A model of the development and bulking of potatoes (Solanum tuberosum L.). I. Derivation from well-managed field crops. Field Crops Res. 2: 309–331. Sass, A. P. 2007. Energy, Water, and Carbon Budgets of Young Post-Fire Boreal Forests in Central Saskatchewan. M.Sc. thesis. Department of Soil Science, University of
Manitoba. Schwalm, C.R., T.A Black, B. Amiro, A. Arain, A. Barr, C. P.-A. Bourque, A. Dunn, L. Flanagan, M.-A. Giasson, P. Lafleur, H. Margolis, H. McCaughey, A. Orchansky, and S. Wofsy. 2006. Photosynthetic light use efficiency across an east-west transect in
Canada. Agric. For. Meteorol. 140: 269-286. Selirio, I.S. and Brown, D.M. 1979. Soil moisture based simulations of forage yield. Agric. Meteorol. 20:99-114.
52

Shaykewich, C. F. 1974. Climate of Southern Manitoba as it relates to Agriculture Publication No. 546, Manitoba Department of Agriculture. Shaykewich, C.F., Ash, G.H.B., Raddatz, R.L., and Tomasiewicz, D.J. 1998. Field evaluation of a water use model for potatoes. Can. J Soil Sci. 78:441-448. Shaykewich, C.F., Karamanos, R., and Henry, L. 2001. Derivation of Growing Season Climate Zones. Proceedings of the 44th Annual Meeting of the Manitoba Society of Soil Science. Jan 23&24, 2001. pp 107-111. Sheppard, M.I. and J.L. Hawkins. 1991. A linear sorption dynamic water-flow model applied to the results of a 4-year soil core study. Ecol. Modelling 55:175-201. Sheppard, S.C., B.D. Amiro, M.I. Sheppard, M. Stephenson, R. Zach and G.A. Bird. 1994.
Carbon-14 in the biosphere: Modelling and supporting research for the Canadian nuclear fuel waste management program. Waste Manage. 14: 445-456. Singh, S., B.D. Amiro and S. Quideau. 2008. Effects of forest floor organic layer and root biomass on soil respiration following boreal forest fire. Can. J For. Res. 38: 647-655. Steppuhn, H. 1981. Snow and Agriculture, Handbook of Snow. D.M. Gray and D.H. Male eds. Pergamon Press, Toronto. pp. 60-125. Stewart, S. 2010. Perennial legume phase and annual crop rotation influences on CO2 and N2O fluxes over two years on the Red River Valley, Manitoba, Canada. M.Sc. thesis, Department of Soil Science, University of Manitoba. Tataryn, J. H. 1974. Evaluation of the corn heat unit for southwestern Manitoba. M.Sc. thesis, Department of Plant Science, University of Manitoba. Thom, A. S. 1975. Momentum, mass and heat exchange of plant communities. Pages 57–109 In Vegetation and the atmosphere. Vol. 4. Principles. J. L. Monteith, ed. Academic Press, Inc., New York, NY. Tremorin, Denis. 2009. Greenhouse gas emissions from grassland pasture fertilized with liquid hog manure. M.Sc. Thesis. Department of Soil Science, University of Manitoba. van Keulen, H. 1975. Simulation of water use and herbage growth in arid regions. Centre for Agriculture Publishing and Documentation. Wageningen, the Netherlands. Walker, G.K., 1989. Model for operational forecasting of Western Canada wheat yield. Agric. For. Meteorol. 44: 339-351 Williams, G.D.V. 1974. Deriving a photothermal time scale for barley. Int. J. Biometeorol. 18:57-69 Wilson, J.L. 2002. Estimation of phenological development and fractional leaf area of canola (Brassica napus L.) from temperature. M.A. Thesis, Department of Geography, University of Manitoba. Yin, X., Kropff, M.J., McLaren, G., and Visperas, R.M. 1995. A nonlinear model for crop development as a function of temperature. Agric. For Meteorol. 77:1-6. Zach, R., B.D. Amiro, P.A. Davis, S.C. Sheppard and J.G. Szekely. 1994. Biosphere model
for assessing doses from nuclear waste disposal. Sci. Total Environ.156: 217-234. Zach, R., B.D. Amiro, D.R. Champ, R.J. Cornett, P.A. Davis, R.W.D. Killey, D.R. Lee, G.L. Moltyaner, R.V. Osborne, M.I. Sheppard and S.C. Sheppard. 1987. Environmental
Research for Canada's nuclear fuel waste management program. Radioactive Waste Manage. Nucl. Fuel Cycle 8: 197-217.
Zhuang, Y., B.D. Amiro, P.A. Davis and L.L. Ewing. 1993. AERAD, the atmospheric dispersion model for emergency response at Whiteshell Laboratories. Atomic Energy of Canada Limited Report, AECL-10817, 32 pp
53

Zhuang, Y. and B.D. Amiro. 1994. Pressure fluctuations during coherent motions and their effects on the budgets of turbulent kinetic energy and momentum flux within a forest
canopy. J Appl. Meteorol. 33: 704-711. Zhuang, Y., B.D. Amiro and L.L. Ewing. 1996. A long-term atmospheric transport model
for dispersion over meso-scale areas and implications for individual and collective doses from the disposal of Canada's nuclear fuel waste. Atomic Energy of Canada Limited Technical Record TR-760, COG-96-514-I. 33 pp.
54

Graduate Students in Agrometeorology (and related topics), Department of Soil Science, University of Manitoba. Tataryn, J. H. 1974. M.Sc. Evaluation of the corn heat unit for southwestern Manitoba. Keatinge, J.D.H. 1975. M.Sc. The influence of the physical environmental factors on the productivity potential of fababeans. Jong, R. P. de 1978. Ph.D. Energy exchange at the soil surface and the soil temperature regime. Reimer, A. 1978. M.Sc. Soil temperature estimation from meteorological measurements. Cutforth, H. 1980. M.Sc. Evaluation of a crop simulation model. Dunlop, S. 1981. M.A. An agroclimatology of southern Manitoba. Falk, G. 1981. M. Sc. Environmental factors affecting soybean growth in Manitoba. Krpan, J.R.B. 1982. M.A. The Characterization and Estimation of Soil Temperature in Manitoba. Burnett, R. B. 1984. M.Sc. Determination of climatically suitable areas for soybean production in Manitoba. Cutforth, H.W. 1985. Ph.D. Dependence of corn development from germination to silking on physical environment. Ash, G.H.B. 1991. M.A. An agroclimatic risk assessment of southern Manitoba and southeastern Saskatchewan. Busch, S. 1996. Diplomarbeit. Forage crop prediction using agro-climatic data - A regional study of southern Manitoba. Renwick, R. 1999. M.A. Evaluation of a simulation model for potato growth. Wilson, J.L. 2001. M.A. Estimation of phenological development and fractional leaf area of canola (Brassica napus L.) from temperature. Pelcat, Y.S. 2006 M.Sc. Soil landscape characterization of crop stubble covered fields using IKONOS high resolution panchromatic images. Jarvis, C.K. 2006 M.Sc. Growing season weather impacts on breadmaking quality of Canada Western Red Spring wheat grown in producer fields across western Canada Finlay, G.J. 2006 M.Sc. Genotype and environment impacts on Canada Western Spring wheat bread-making quality and development of weather-based prediction models. Sass, A.P. 2007 M.Sc. Energy, water and carbon budgets of young post-fire boreal forests in Central Saskatchewan. Wang, R. 2007 M.Sc. Impacts of soil accumulation from erosion on greenhouse gas production and emission from soil within a complex and cultivated landscape Churchill, J.A. 2007 M.Sc. Spatial variation of soil methane and nitrous oxide emissions in subarctic environments of Churchill, Manitoba. Holzapfel, C.B. 2007 M.Sc. Estimating nitrogen fertilizer requirements of canola (Brassica Napus L.) using sensor-based estimates of yield potential and crop response to nitrogen. Nadler, A.J. 2007 M.Sc. An agroclimatic risk assessment of crop production on the Canadian Prairies. Koiter, A.J. 2008 M.Sc. Short-term carbon dioxide and nitrous oxide flux following tillage of the clay soil in the Red River Valley in Southern Manitoba. Barker, C.A. 2008 M.Sc. Effects of forest age and topography on boreal forest evaporation and water balance. Gervais, M.D. 2008 M.Sc. Assessment of the Second-generation Prairie Agrometeorological model’s performance for spring wheat on the Canadian Prairies.
55
Tremorin, D. 2009 M. Sc. Green house gas emissions from grassland pasture fertilized with liquid hog manure Rajendran, N. 2009 M. Sc. Dynamics of profiles of soil greenhouse gases in a topographically variable landscape in Western Canada. Stewart, S. 2010 M. Sc. Perennial legume phase and annual crop rotation influences on CO2 and N2O fluxes over two years on the Red River Valley, Manitoba, Canada. Donohoe, G. R. 2010 M.Sc. Nutrient excretion and soil greenhouse gas emission from excreta of overwintering beef cows fed forage-based diets supplemented with dried distillers' grains with solubles. Glenn, A. J. 2010 Ph.D Greenhouse gas fluxes and budget for an annual cropping system in the Red River Valley, Manitoba, Canada.
56


