Reference may be made to the Advanced Higher Engineering Science Data Booklet.
SECTION 1 — 30 marks
Attempt ALL questions.
SECTION 2 — 30 marks
Attempt ALL questions.
Write your answers clearly in the answer booklet provided. In the answer booklet, you must clearly identify the question number you are attempting.
For questions 2 (a), 5 (a) and 7 (a), write your answers clearly in the worksheets provided in booklet X723/77/21.
Show all working and units where appropriate.
The number of significant figures expressed in a final answer should be equivalent to the least significant data value given in the question. Answers that have two more figures or one less figure than this will be accepted.
Use blue or black ink. Sketches, diagrams and graphs may be drawn in pencil.
Before leaving the examination room you must give your answer booklet and worksheets to the Invigilator; if you do not, you may lose all the marks for this paper.
X723/77/11 Engineering Science
FRIDAY, 17 MAY
1:00 PM – 3:00 PM
A/PB
page 02
MARKSSECTION 1 — 30 marks
Attempt ALL questions
1. A shaft within a gearbox is shown. The forces that act on the two spur gears when running at constant speed are 210 N and 420 N. The pressure angle for both gears is 20°.
bearing A
bearing B
A
B
52
53
45
20°
210 N
420 N20°
all dimensions in mmgear pressure angle is accurate to 0∙1°
Calculate the magnitude and the direction of the reaction at bearing A. 5
page 03
MARKS 2. A project manager divided a short project into eight stages, A – H, identified the
precedents for each stage and the planned duration of each stage. The information is detailed in the precedence table below.
Stage Precedents Duration (weeks)
A – 2
B – 4
C A 3
D B,C 4
E B 5
F A,B 6
G E 2
H D,F,G 7
(a) Use the precedence table and worksheet for question 2 (a) to
(i) complete a Gantt chart for stages D – H of the project, showing the timing of each stage without floats
(ii) determine the float available for project stage F
(iii) identify the critical path for the project.
(b) Describe the difference between a direct cost and an indirect cost for a large‑scale engineering project you are familiar with. Make reference to an example of each type of cost in relation to the project.
[Turn over
1
1
1
2
page 04
MARKS 3. The wooden body of a pencil has a cross‑section of dimensions shown, with a
centrally located circular hole of diameter 1·5 mm.
3∙9
6∙8
7∙7 all dimensions in mm
X X
The second moment of area of a right‑angled triangle about its base is given by the formula
where b and h are base and height dimensions respectively.
Calculate the second moment of area of the cross‑section about axis X – X, as shown above. 4
page 05
[Turn over for next question
DO NOT WRITE ON THIS PAGE
page 06
4. The circuit below represents a 3‑bit flash analogue to digital (A – D) converter. The input voltage, Vin, can vary between 0 V and 6 V.
A comparator output is a logic HIGH value when the input voltage is greater than the voltage on its inverting input terminal.
6 V
0 V
10 kΩ
10 kΩ
10 kΩ
10 kΩ
10 kΩ
10 kΩ
10 kΩ
10 kΩ
input voltage (Vin)
D2
D1
D0
6 V
0 V
6 V
0 V
6 V
0 V
6 V
0 V
6 V
0 V
6 V
0 V
6 V
0 V
Note: D0 is the least significant bit
page 07
MARKS 4. (continued)
Input voltage signals processed by the A – D converter are shown in the graph below.
5
4
3
2
1
00 10 20 30
time (ms)
inpu
t vo
ltag
e (
V in)
40 50 60
(a) Calculate the 3‑bit digital output just after the voltage step change at 40 ms.
(b) Calculate the range of analogue input voltages which would produce the 3‑bit digital output 101.
[Turn over
3
2
page 08
5. A MOSFET amplifier circuit is being designed based on the circuit diagram below.
0 V
VDD = 10 V
Vin
Vout
R2
R1
RL = 1∙25 kΩ
For component calculations, ignore the greyed-out capacitors.
The performance characteristic curves for the MOSFET are shown below and on worksheet for question 5 (a). The MOSFET threshold voltage is 1·5 V.
linear10∙0
10∙0
VGS = 4∙5 V
VGS = 4.25 V
VGS = 4∙0 V
VGS = 3∙75 V
VGS = 3∙5 V
VGS = 3∙25 V
VGS = 3∙0 V
VGS = 2∙75 VVGS = 2∙5 V
VDS (V)
I DS (
mA)
9∙0
8∙0
7∙0
6∙0
5∙0
4∙0
3∙0
2∙0
1∙0
9∙08∙07∙06∙05∙04∙03∙02∙01∙00∙0
0∙0
saturation
The MOSFET must be biased in the saturation region.
page 09
MARKS 5. (continued)
(a) Draw the load line on worksheet for question 5 (a).
The MOSFET is biased so that VGS = 3·25 V at the operating point. A design rule is also used: when R1 and R2 are connected in parallel, their effective resistance is 525 kΩ.
(b) Calculate suitable values for R1 and R2.
[Turn over
2
3
page 10
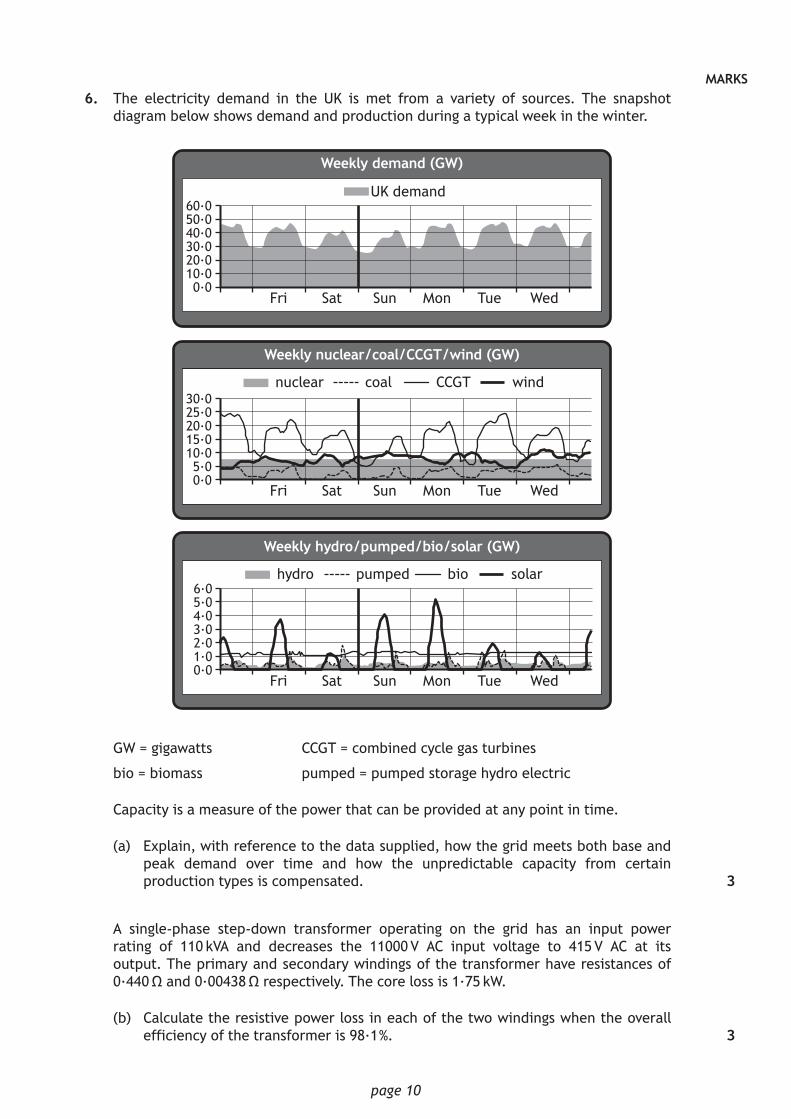
MARKS 6. The electricity demand in the UK is met from a variety of sources. The snapshot
diagram below shows demand and production during a typical week in the winter.
60∙050∙040∙030∙020∙010∙00∙0
Fri
Weekly nuclear/coal/CCGT/wind (GW)
UK demand
Sat Sun Mon Tue Wed
30∙025∙020∙015∙010∙05∙00∙0
Fri
Weekly demand (GW)
nuclear coal CCGT wind
Sat Sun Mon Tue Wed
Weekly hydro/pumped/bio/solar (GW)
6∙05∙04∙03∙02∙01∙00∙0
Fri
hydro pumped bio solar
Sat Sun Mon Tue Wed
GW = gigawatts CCGT = combined cycle gas turbines
bio = biomass pumped = pumped storage hydro electric
Capacity is a measure of the power that can be provided at any point in time.
(a) Explain, with reference to the data supplied, how the grid meets both base and peak demand over time and how the unpredictable capacity from certain production types is compensated.
A single‑phase step‑down transformer operating on the grid has an input power rating of 110 kVA and decreases the 11000 V AC input voltage to 415 V AC at its output. The primary and secondary windings of the transformer have resistances of 0·440 Ω and 0·00438 Ω respectively. The core loss is 1·75 kW.
(b) Calculate the resistive power loss in each of the two windings when the overall efficiency of the transformer is 98·1 %.
3
3
page 11
[Turn over for SECTION 2
DO NOT WRITE ON THIS PAGE
page 12
SECTION 2 — 30 marks
Attempt ALL questions
7. The Forth Road Bridge and its replacement, the Queensferry Crossing, are both suspension bridges. The main deck of each bridge is supported by cables suspended from towers. However, the bridges differ in that the cables attached to the main deck are in different locations with respect to the width of the deck.
To investigate the effect of the different suspension points, a student creates a simple model of each of the arrangements. The model of the Queensferry Crossing is shown below.
ω = 10 kN m−1ω = 10 kN m−1
1616
10 102
1 1
2
R1 R2
model of Queensferry Crossing
all dimensions are in metres (m)
The student then draws a bending moment diagram from the left‑hand end to the centreline of the model, as shown below.
0
–100
–200
–300
–400
–500
0 1 2 3 4 5 6 7 8 9 10 11 12 13 14 15 16
bend
ing
mom
ent
(kN
m)
distance (m)
(10,–80)
(12,–180)
(14,–320)
(15,–400)
page 13
MARKS 7. (continued)
The student also creates a model of the Forth Road Bridge, as shown below.
ω = 10 kN m−1ω = 10 kN m−1
1616
11 11
10 102 2
R1 R2
model of Forth Road Bridge
all dimensions are in metres (m)
(a) Draw the bending moment diagram for the left‑hand half of the model of the Forth Road Bridge on worksheet for question 7 (a). Indicate the value of the bending moment at key points from the left‑hand end, similar to those on the bending moment diagram for the Queensferry Crossing.
(b) Explain how the information from these bending moment diagrams would inform a bridge designer as to the selection of a suitable structural beam for the deck.
T cross‑sections are used to minimise material use in structural beams when the material is stronger in compression than in tension. They are used in the orientation shown below.
y1 > y2
y 2y 1
T cross-section beam
neutral axis
deck
(c) State which of the two bridge models would be better supported by a T cross‑section beam and justify your selection.
[Turn over
6
2
2
page 14
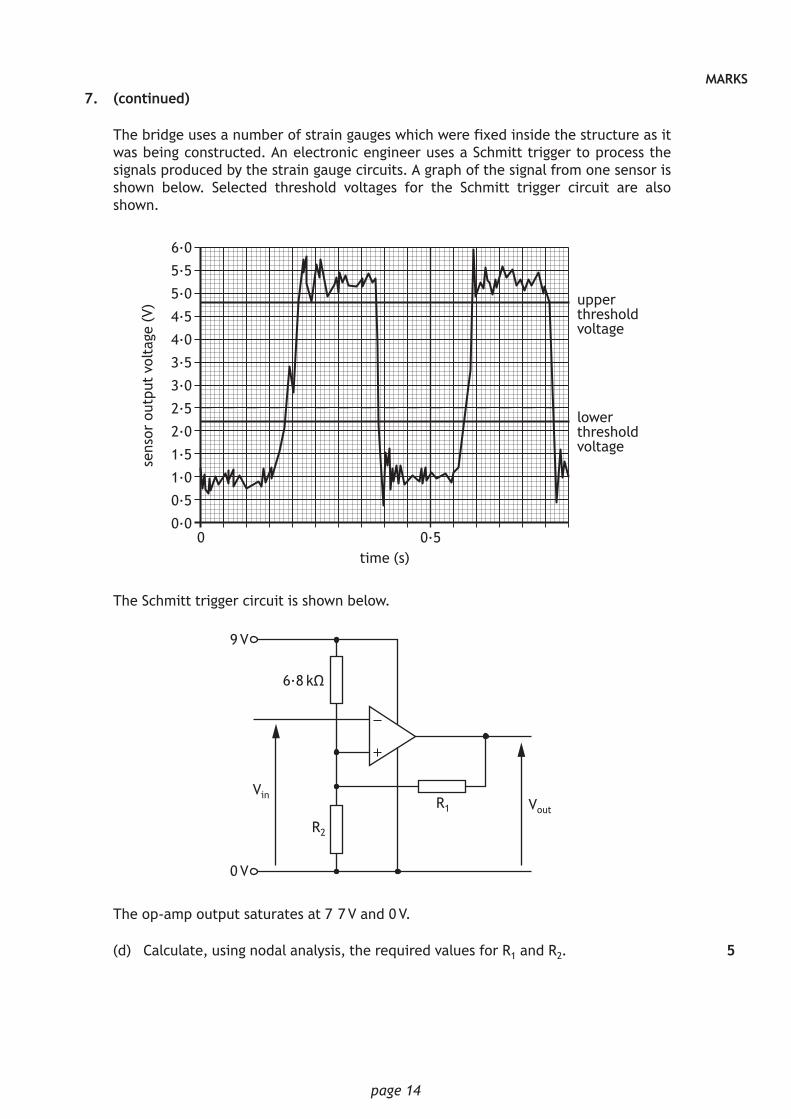
MARKS 7. (continued)
The bridge uses a number of strain gauges which were fixed inside the structure as it was being constructed. An electronic engineer uses a Schmitt trigger to process the signals produced by the strain gauge circuits. A graph of the signal from one sensor is shown below. Selected threshold voltages for the Schmitt trigger circuit are also shown.
6∙0
5∙5
5∙0
4∙5
4∙0
3∙5
3∙0
2∙5
2∙0
1∙5
1∙0
0∙5
0∙0
sens
or o
utpu
t vo
ltag
e (V
) upperthresholdvoltage
lowerthresholdvoltage
time (s)0∙50
The Schmitt trigger circuit is shown below.
R2
VinVoutR1
0 V
9 V
6∙8 kΩ
The op‑amp output saturates at 7·7 V and 0 V.
(d) Calculate, using nodal analysis, the required values for R1 and R2. 5
page 15
[Turn over for next question
DO NOT WRITE ON THIS PAGE
page 16
MARKS 8. The drum of a washing machine is driven by an electric motor using a pulley and belt
arrangement as shown. Under load, the tension in the part of the belt denoted as F1 is greater than the tension in the part of the belt denoted as F2.
The maximum ratio of the tensions F1 and F2 is governed by the equation shown where there is a dependency on the coefficient of friction, μ, and the angle of contact, θ, between a belt and a pulley. The angle θ is measured in radians.
motor pulleydiameter 60 mm
drum pulleydiameter 280 mm
diagram notdrawn to scale
F2
F1 45°
θD
θM
(a) Calculate the maximum power that can be transmitted for a coefficient of friction, μ, of 0·8 if F1 is 470 N and the angular input velocity is 1200 rpm at the motor.
Note, 360° is equal to 2π radians.
4
page 17
MARKS 8. (continued)
The washing machine motor is controlled using sinusoidal pulse‑width modulation (PWM) signals. A block diagram of the system is shown below.
MOSFETmotordriver
S1, S4
S3, S6
S5, S2
ACmotor
sinusoidalPWM
generator
A triangular wave generator is a required part of the sinusoidal PWM generator. A circuit diagram for a triangular wave generator is shown below.
The op‑amps used in the design saturate at ±5·2 V.
Vin Vout
0 V
1 kΩ
1∙5 µF
10 kΩ
18 kΩ
-6 V
+6 V
-6 Vop-amp 2
op-amp 1
+6 V
Typical output waveforms are shown below (not to scale).
time
period, T
volt
age
+VT
-VT
(b) Calculate +VT, −VT and the period of the triangular wave. 5
[Turn over
page 18
8. (continued)
The PWM signal is processed by a MOSFET‑based driver circuit as shown below.
S1 S3 S5AC motor windings
S4 S6 S2
The graph below shows the input voltage to a MOSFET over one cycle.
time (ms)
−Vs (V)
+Vs (V)
0105
The MOSFET dissipates power when conducting and when switching on and off.
The graphs below show a magnified view of the VDS and IDS when a MOSFET switches on and off.
current
voltage
time (ns)
Ton
Ton = 30 ns
IDS (on) = 7.0 A
current
voltage
time (ns)
Toff
Toff = 25 ns
VDS (off) = 12 V
page 19
MARKS 8. (continued)
When each MOSFET switches on and off it experiences a switching energy loss given by the formula below.
The switching power is calculated using the formula
where
n = number of switches per cycle, and
f = cycle frequency.
(c) Calculate the MOSFET switching power loss for one MOSFET.
[Turn over
4
page 20
8. (continued)
A student builds a model of the washing machine using a DC motor. A microcontroller is used to generate a PWM signal to control the motor speed. The speed of the motor is measured using the following system.
5 V
0 V
DC motorM
microcontroller
PWM outputpin B.3 PBASICpin 7 Arduino
back emfanalogue inputto ADC pin 0
Back emf is proportional to the angular velocity of the motor.
A voltage of 5 V at the ADC input would give a reading of 1023.
page 21
MARKS 8. (continued)
The following sub‑procedure was written to calculate the back emf.
ARDUINOvoid speed_bemf() sum_of_bemf = 0; //reset sum_of_bemf analogWrite(7, duty); //PWM to motor delay(10); digitalWrite(7, LOW); //stop PWM
(d) Describe, making reference to the back emf, the function of the shaded section of the program. The following information is provided for reference.
ARDUINO PBASIC
CommandanalogWrite()
DescriptionWrites a PWM signal to a pin until the next call to analogueWrite() or digitalWrite() on the same pin.
SyntaxanalogWrite(pin, value)
Parameterspin: a variable/constant which is the pin to write tovalue: the duty cycle between 0 (off) and 255 (fully on)
Commandpwmout
DescriptionWrites a continuous PWM signal to a pin until another pwmout command is sent to the pin.
Syntaxpwmout pin, period, mark
Parameterspin: a variable/constant which is the pin to write toperiod: set to 255 for this applicationmark: the duty cycle between 0 (off) and 255 (fully on)
Variableduty: integer with value between 0 – 255, used to set desired speed. Assigned in another part of the program.
inst_bemf : integer with value −32,768 to 32,767sum_of_bemf : integer with value −32,768 to 32,767bemf : integer with value −32,768 to 32,767
Variableduty: value between 0 – 255, used to set desired speed. Assigned in another part of the program.
inst_bemf : word integer with value 0 – 65535sum_of_bemf : word integer with value 0 – 65535bemf : word integer with value 0 – 65535
[END OF QUESTION PAPER]
2
page 22
[BLANK PAGE]
DO NOT WRITE ON THIS PAGE
page 23
[BLANK PAGE]
DO NOT WRITE ON THIS PAGE
page 24
[BLANK PAGE]
DO NOT WRITE ON THIS PAGE
*X723772101*
*X7237721*
AHFOR OFFICIAL USE
Fill in these boxes and read what is printed below.
Write your answers clearly in the spaces provided in this booklet.
Use blue or black ink. Sketches, diagrams and graphs may be drawn in pencil.
Before leaving the examination room you must give your answer booklet and worksheets to the Invigilator; if you do not, you may lose all the marks for this paper.


![15 Watt Interchangeable Plug Series PSA15R Wall Plug ... · [Type text] PSA15R Characteristics Input: AC Input Voltage Rating 100 to 240V AC FCC Part 15 Class B AC Input Voltage Range](https://static.documents.pub/doc/80x56/5ae023107f8b9a1c248cd1f8/15-watt-interchangeable-plug-series-psa15r-wall-plug-type-text-psa15r-characteristics.jpg)


