49
AHELO: The Ontario Experience Mary Catharine Lennon and Linda Jonker, Higher Education Quality Council of Ontario

AHELO: The Ontario Experience Mary Catharine Lennon and Linda Jonker, Higher Education Quality Council of Ontario

Published by
The Higher Education Quality Council of Ontario
1 Yonge Street, Suite 2402
Toronto, ON Canada, M5E 1E5
Phone: (416) 212-3893
Fax: (416) 212-3899
Web: www.heqco.ca
E-mail: [email protected]
Cite this publication in the following format:
Lennon, M. C., & Jonker, L. (2014). AHELO: The Ontario Experience.
Toronto: Higher Education Quality Council of Ontario.
The opinions expressed in this research document are those of the authors and do not necessarily represent the views or official policies of the
Higher Education Quality Council of Ontario or other agencies or organizations that may have provided support, financial or otherwise, for this project.
© Queens Printer for Ontario, 2014

AHELO: The Ontario Experience
Higher Education Quality Council of Ontario 1
Table of Contents
Introduction........................................................................................................................................................... 3
Background and Rationale for the AHELO Feasibility Study........................................................................3
The Feasibility Study Framework .................................................................................................................4
The AHELO Civil Engineering Framework ...................................................................................................8
AHELO in Ontario ................................................................................................................................................ 9
Institution Recruitment and Participation ................................................................................................... 10
Adapting, Vetting and Validating the Documents ...................................................................................... 11
Institutional Activities.................................................................................................................................. 11
Operationalizing AHELO within Institutions ......................................................................................... 12
Implementing Field Work ..................................................................................................................... 12
Scoring ....................................................................................................................................................... 14
Successes and Challenges of Administration ........................................................................................... 14
Discussion .......................................................................................................................................................... 15
Analysis of Ontario’s Results ..................................................................................................................... 15
Joint Analysis with Australia and Japan..................................................................................................... 16
What Does AHELO Contribute to our Understanding? ............................................................................. 16
Jurisdictions ......................................................................................................................................... 16
Institutional and Program-Level Data ................................................................................................... 17
Student-Level Data .............................................................................................................................. 18
Conclusion.......................................................................................................................................................... 18
References ......................................................................................................................................................... 20
Appendix A: Example of Civil Engineering Multiple Choice Questions ............................................................. 22
Appendix B: Example of Civil Engineering Constructed Response Task .......................................................... 23
Appendix C: Canadian (Ontario) AHELO Team ................................................................................................ 26
Members of the Group of National Experts ............................................................................................... 26
National Project Manager .......................................................................................................................... 26
Lead Scorer ............................................................................................................................................... 26
Institutional Coordinators ........................................................................................................................... 26
Scoring Team ............................................................................................................................................. 27
Appendix D: Institutional Recruitment and Incentive Structures ........................................................................ 28
Appendix E: Data Analysis and Regression Results ......................................................................................... 30
Caveats to Data Analysis and Interpretation ............................................................................................. 30
AHELO: The Ontario Experience
Higher Education Quality Council of Ontario 2
Test Validity and Reliability ........................................................................................................................ 30
Analysis ...................................................................................................................................................... 31
AHELO: The Ontario Experience
Higher Education Quality Council of Ontario 3
Introduction In 2011 Ontario joined the Organisation for Economic Co-operation and Development’s (OECD) Assessment of Higher Education Learning Outcomes (AHELO) feasibility study. The Higher Education Quality Council of Ontario (HEQCO) led the project on behalf of the Ministry of Training, Colleges and Universities (MTCU) and in cooperation with the Council of Ministers of Education, Canada (CMEC). Initiated in 2006, AHELO was a feasibility study to determine if standard generic and discipline-specific tests could be used in different countries to measure what university students know and are able to do. Intending to contribute to the international conversation on establishing better indications of learning quality, the study aimed to develop common learning outcomes and assess student performance at the end of a bachelor’s degree (first cycle) in a variety of educational cultures, languages and institutions through standard tests. The feasibility study developed three assessments: one for generic skills and two for discipline-specific skills in economics and civil engineering. Seventeen countries
1 were represented in this global project and Canada was one of nine jurisdictions
participating in the engineering strand. Nine out of ten Ontario universities with civil engineering programs participated in the study, representing approximately 61% of all Canadian civil engineering graduating students. The following report reviews the experience of Ontario’s participation in the feasibility study, focusing primarily on the implementation and administration activities and the value to institutions. While the institutions did not gain specific insight into their programming, AHELO generated considerable interest in international assessments and comparative understanding and provided significant experience in the administration of large-scale assessments.
Background and Rationale for the AHELO Feasibility Study The late 20
th century saw significant changes to higher education worldwide.
2 The massification of higher
education produced a diverse profile of institutions, programs and students unlike the small elite systems of previous times (OECD, 2012a). This expansion was aided by a number of elements. Higher education is no longer contained by either bricks and mortar or national/jurisdictional boundaries. The proliferation of technology-enhanced learning allows programs to operate whenever and wherever the student chooses, and international student and faculty mobility have opened institutions to the world. Furthermore, student demand for education has supported the creation of new and alternative providers, such as private institutions or those with specialized programming. The now complex and global “market” for postsecondary education (PSE) demands new forms of governance, accountability and signaling mechanisms. In line with traditional forms of accountability and governance, measures of inputs (funding, library holdings, etc.) and outputs (retention rate, graduation rate, publications) have been the yardstick of performance both within systems and internationally up until now. International rankings based on these performance indicators play a significant role in weighing the research capacities of institutions.
1 Participants were primarily countries, though in some cases political jurisdictions, such as a province or emirate, chose to participate
without full national involvement. The remainder of this document uses the term “jurisdiction” and “country” interchangeably when referring to a participating nation, state, province, emirate, etc. 2 Information contained in this section is largely based on OECD documentation. For further information, please see Tremblay, Lalancette
and Roseveare (2012) and OECD (2013a).
AHELO: The Ontario Experience
Higher Education Quality Council of Ontario 4
What these traditional measures fail to capture is the quality of education: the teaching and learning that is at the heart of most institutions. Recognition of this gap led to the inclusion of another set of indicators that can be called “proxies”. These “proxies” of quality include student evaluations, surveys of student satisfaction and engagement, labour market outcomes, etc. These indicators suggest that if the student is satisfied and has fared well after PSE, the institution must have provided high-quality education. More recently, and considered by some to be a paradigm shift (OECD, 2012a, p. 35), there has been a focus on learning outcomes as a means to understand, demonstrate and assess educational quality. Defined learning outcomes – clear statements of what a learner knows and can do – along with appropriate assessment measures, provide a transparent means to measure student learning. It is thus possible to gain an objective picture of the quality of teaching and learning, and ultimately the quality of education provided. Clear indications of teaching and learning quality are beneficial in a number of ways. They support a better understanding of educational value to students, employers and the public at large. They also enhance institutional and programmatic improvement in coordination, curriculum development and teaching practices. Furthermore, they can provide measures of what has been considered intangible until now in the world of quality assurance and accountability – educational quality. They also provide transparency of programming, which allows for greater international and comparative understanding for institutions and programs. Hence, learning outcomes demystify education to the benefit of the program, institution, and wider public and international community, but ultimately they put students at the centre of it all. The purpose of the feasibility study was to provide “proof of concept” (OECD, 2009a, p. 15) to determine whether it is possible to measure what undergraduates know and can do at the international level, to provide relevant information to higher education institutions (HEIs), governments and other stakeholders, including students and employers (OECD, 2009b, p. 2). The primary questions that emerged from the work included:
Is it possible to have international agreement on expected learning outcomes?
Is it possible to implement the same test across cultures and languages?
Are the assessments valid and reliable?
The Feasibility Study Framework Three primary areas of work made up the feasibility study: the development of student assessments, research into “value-add” and the development of contextual surveys. The first area of work addressed student performance, where three separate strands were developed. One sought to assess generic skills, such as capacities in critical thinking, analytical reasoning, problem solving, etc.
3 The other two assessments
concentrated on discipline-specific skills in economics4 and engineering.
5 Rather than assessing content
knowledge, both discipline-specific assessments focused on the application of knowledge (i.e., can a student “think like an engineer”). The “value-add” strand of work was intended to explore the contribution of higher education to student learning. While all students will be expected to gain new skills and competencies from the time they enter PSE to the time they graduate, it is also understood that those gains may be smaller for students who enter PSE already operating at a high level and, similarly, that those institutions which admit a greater number of
3 For more information, see Tremblay et al. (2012), p. 112-114.
4 For more information, see OECD (2011a); Tremblay et al. (2012), p. 116-118.
5 For more information, see OECD (2011b); Tremblay et al. (2012), p. 121-123; OECD (2012a); OECD (2012b).
AHELO: The Ontario Experience
Higher Education Quality Council of Ontario 5
high-achieving students may in turn show smaller institutional levels of student improvement. The “value-add” strand was designed to compensate for these differences. By controlling for the capacities of incoming students, it is possible to estimate the gains in competencies at graduation. With that benchmark level, it is then possible to determine whether or not the institution has succeeded or surpassed the expectation, thus indicating the amount of learning that can be attributed directly to the higher education institute. The third volume of the AHELO report explores issues of “value-add”.
6
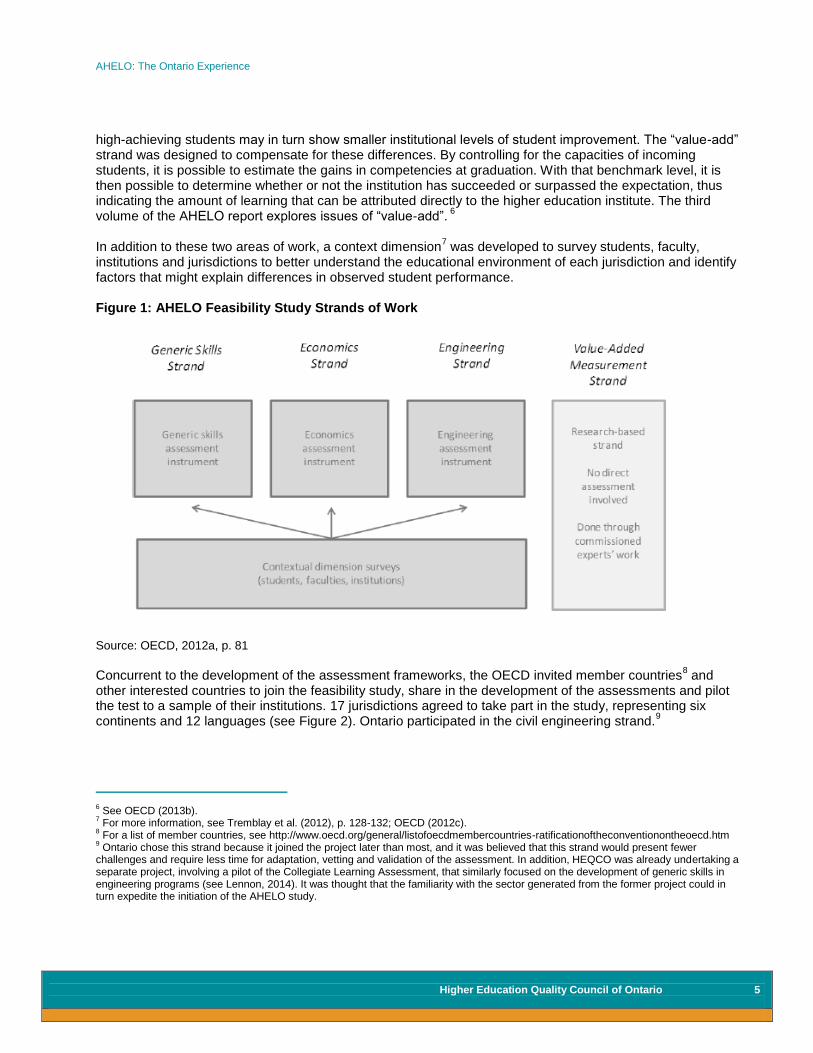
In addition to these two areas of work, a context dimension
7 was developed to survey students, faculty,
institutions and jurisdictions to better understand the educational environment of each jurisdiction and identify factors that might explain differences in observed student performance. Figure 1: AHELO Feasibility Study Strands of Work
Source: OECD, 2012a, p. 81
Concurrent to the development of the assessment frameworks, the OECD invited member countries
8 and
other interested countries to join the feasibility study, share in the development of the assessments and pilot the test to a sample of their institutions. 17 jurisdictions agreed to take part in the study, representing six continents and 12 languages (see Figure 2). Ontario participated in the civil engineering strand.
9
6 See OECD (2013b).
7 For more information, see Tremblay et al. (2012), p. 128-132; OECD (2012c).
8 For a list of member countries, see http://www.oecd.org/general/listofoecdmembercountries-ratificationoftheconventionontheoecd.htm
9 Ontario chose this strand because it joined the project later than most, and it was believed that this strand would present fewer
challenges and require less time for adaptation, vetting and validation of the assessment. In addition, HEQCO was already undertaking a separate project, involving a pilot of the Collegiate Learning Assessment, that similarly focused on the development of generic skills in engineering programs (see Lennon, 2014). It was thought that the familiarity with the sector generated from the former project could in turn expedite the initiation of the AHELO study.

AHELO: The Ontario Experience
Higher Education Quality Council of Ontario 7
Figure 2: Map of Jurisdictional Strand Activity
AHELO: The Ontario Experience
Higher Education Quality Council of Ontario 8
The AHELO Civil Engineering Framework Each of the three assessment frameworks was developed independently, under the overall guidance of a consortium led by the Australian Council for Educational Research (ACER) as primary contractor to the OECD. The AHELO Generic Skills Assessment was based largely on the Collegiate Learning Assessment and was led by the Council for Aid to Education.
10 The economics strand was led by the Education Testing
Service. The engineering strand was led by ACER in collaboration with the National Institute for Educational Policy Research (NIER) in Japan and the University of Florence in Italy. Each of the three strands had similar tasks of developing, adapting, vetting and piloting the assessments.
11
The Engineering Assessment Framework was built upon the Tuning-AHELO documents (Tuning, 2009; OECD, 2011b), which brought international experts together to define learning outcomes across engineering, and specifically for the fields of mechanical, electrical and civil engineering. Following this work, an Engineering Expert Group was drawn together from participating jurisdictions to support the development of the framework and assessment (OECD, 2011b).
12 It was determined that the feasibility study assessment
would focus specifically on civil engineering rather than the broader discipline of engineering given the considerable variety of knowledge base required in the different fields (i.e., mechanical, computer, environmental, chemical engineering, etc.). The assessment framework set out 5 key areas of student competencies (OECD, 2012a):
Basic and engineering science: Knowledge and understanding of underlying scientific and mathematical principles – general sciences; materials and construction; structural engineering; geotechnical engineering; hydraulic engineering and urban and rural planning
Engineering analysis: Using analytical methods to identify, formulate and solve problems
Engineering design: Understanding and application of design methodologies to meet requirements
Engineering practice: Practical competencies required to solve problems, conducting investigations and designing engineering devices and processes. Covers non-technical elements of civil engineering practice like professional ethics, responsibilities and the impact of engineering solutions in a global economic, societal and environmental context
Engineering generic skills: Effective communication and awareness of the wider civil engineering context
13
The engineering assessment was developed as a 90-minute test incorporating both multiple choice questions (MCQ) and constructed response tasks (CRT). The tests were provided online and rotated the 30 MCQ questions and 3 CRT questions so that there were 18 possible tests a student might write. As noted earlier, the questions were designed to determine if the student could “think like an engineer” rather than to test content knowledge (see Appendix A and B for examples of MCQ and CRT).
10
For information on the Council for Aid to Education and the CLA, see http://cae.org/. 11
See Tremblay et al. (2012), chapter 4, for a full description of all strand development activities. 12
Experts included faculty members from participating countries and key international organizations, such as the Engineering Council in the UK (see OECD, 2011a, p. 19 for a complete list of members). 13
Generic skills were also considered to be part of engineering competencies but were not included in the assessment framework as they were the explicit focus of the Generic Skills strand.

AHELO: The Ontario Experience
Higher Education Quality Council of Ontario 9
AHELO in Ontario In July 2011, the Ministry of Training, Colleges and Universities in Ontario decided to join the study independent of other Canadian provinces.
14 The Higher Education Quality Council of Ontario, an arms’-length
agency of the Ontario government, was asked to lead the project. As part of a broad research agenda to understand and demonstrate the value of postsecondary education, Ontario, through HEQCO, has engaged in a number of research projects to explore learning outcomes. HEQCO has been engaged in a multitude of activities in the area, including establishing learning outcomes across sectors of disciplines (the Tuning project; see Lennon, Frank, Humphreys, Lenton, Madsen, Omri & Turner, forthcoming); measuring generic learning outcomes through piloting the Collegiate Learning Assessment (see Lennon, 2014); as well as supporting the incorporation and demonstration of learning outcomes through a variety of institutional activities. Thus, participating in the international study supported the research base by providing comparative information on systems and programming. Acting as the National Project Centre, HEQCO was responsible for liaising with the OECD and AHELO Consortium in order to administer and implement the assessment. This entailed acting as national experts to the OECD AHELO conversation, providing a national project manager (NPM), implementing and administering the study with participating institutions, and providing analysis [see Appendix C for a list of Canadian (Ontario) AHELO team members and their roles]. There were a number of activities involved in setting up and administering the study in Ontario (see Figure 3). The feasibility study, operationalized by the Consortium, provided guidance and protocols for implementation in order to ensure that comparable activities took place in all jurisdictions. The following sections review the primary areas of field work and implementation, documenting both OECD protocols and Ontario’s actions.
14
As Canada does not have a federal body responsible for education, the Council of Ministers of Education, Canada (CMEC) is the voice of Canadian higher education at the OECD table and, with agreement from all of the provinces, engages in various OECD projects. Despite general interest, CMEC was unable to build consensus from the provinces to join the feasibility study.

AHELO: The Ontario Experience
Higher Education Quality Council of Ontario 10
Figure 3: Basic Timeline for Ontario’s Implementation Activities
Institution Recruitment and Participation The OECD recommended that each jurisdiction have a convenience sample of ten institutions to represent a range of types of institutions providing bachelor’s-level (or first cycle) civil engineering degrees. It was desirable to have public and private universities/polytechnics/colleges, institutions of different sizes and with different mandates (teaching or research), and those in rural and urban settings, etc. The goal was to ensure that all types of institutions and of students were adequately represented in order to have a valid and reliable understanding of each of the systems. In Ontario, ten institutions provide bachelor’s-level civil engineering programs. Hence, each institution was invited to participate via a letter to the vice-presidents academic and the deans of engineering. To support participation in the project, each institution was offered a nominal sum to cover the costs of administration. Responses from the institutions were immediate and extremely favourable: nine out of ten institutions agreed to participate, noting their interest in taking part in this international assessment as a way of understanding their own students and program, as well as those participating internationally. Approximately 90% of all of Ontario’s civil engineering students were represented in these programs. Ontario engineering programs were already familiar with notions of learning outcomes and strategies to assess them. As part of the Washington Accord agreement
15, and for accreditation purposes, engineering
programs across Canada are moving to outcomes-based programming, assessment and accreditation for 2016 (EGADS, 2013). Hence there was considerable interest in exploring this large-scale assessment as a tool to demonstrate the achievement of learning outcomes. The participating institutions were all public institutions offering a broad range of arts and science programs up to the doctoral level. Located primarily in urban areas, they ranged in size from 14,595 to 75,941 full-time equivalent (FTE) students. Participating institutions included:
15
The Washington Accord is an international agreement to support mutual recognition and mobility in Engineering. For more information, see http://www.washingtonaccord.org/.
July 2011
Ontario joined study
October
Recruited institutions
December
Documents and
assessments vetted and
adapted
January 2012
IC training and ethics
February
Recruitment, IT
preparations and TA training
March
Student testing
April
Faculty and institutional
survey collection
May
Scoring

AHELO: The Ontario Experience
Higher Education Quality Council of Ontario 11
Carleton University McMaster University
University of Ottawa Queen’s University
Ryerson University University of Toronto
University of Waterloo Western University
University of Windsor
The civil engineering programs were housed in faculties of engineering and were occasionally partnered with environmental engineering. The programs had between 17 and 40 faculty members. The full-time equivalent (FTE) student populations in the programs ranged from 231 to 573. The number of undergraduate degrees awarded annually ranged from 20 to 101 in the 2010 academic year.
Adapting, Vetting and Validating the Documents A lead scorer was identified in each country to provide discipline/content expertise in the development of the assessments. The individual, a recognized expert in his or her field, was required to review all test documentation, adapt the assessments and translations to ensure appropriateness for their jurisdiction, and vet the assessment documents through pilot tests of students and faculty. The lead scorers from each country worked together to determine appropriate grading of test items and were responsible for training an in-country scoring team. Ontario’s lead scorer, in collaboration with the national project manager, organized various activities to vet the test in the Ontario context, including piloting the test to students
16 and seeking feedback on the test from
faculty members and senior graduate students. The feedback commented on the suitability of the content, the difficulty level of the questions and their appropriateness for the Ontario context (including issues of language nuances and technical jargon). This information was presented to the OECD and incorporated into the assessment. Ontario recommended few significant changes. Indeed there were very few items of contention within the entire international scoring team and jurisdictional lead scorers came to agreement rather quickly.
Institutional Activities Each institution participating in the study identified an institutional coordinator. This individual was responsible for administering the study within their institution and liaising with HEQCO as the National Centre. Playing a vital role in the AHELO study, institutional coordinators were responsible for operationalizing AHELO within their institutions. Standardizing field activities was critical to ensure that any resulting information would be reliable. Regardless of how well designed the assessment might have been, administration and implementation issues could have impacted the validity and reliability of the data. Thus an important part of the feasibility study involved securing common field activities.
16
Five third-year students wrote the test and provided feedback. Third-year students were selected so that the population of fourth-year students would not be compromised.

AHELO: The Ontario Experience
Higher Education Quality Council of Ontario 12
Operationalizing AHELO within Institutions Each institution was in close contact with its National Centre to ensure consistency of implementation across a jurisdiction and to receive any support required. In Ontario, institutional coordinators (ICs), many of whom were the chairs of civil engineering, were identified within their institutions (see Appendix C for list of ICs). The nine individuals attended a one-day training session at HEQCO to gain context and background on AHELO and a roadmap for activities. Following the face-to-face meeting, the ICs and the NPM had weekly teleconferences to provide support and advice on activities. There were a number of tasks involved in operationalizing the field work, and each institutional coordinator developed a team to assist them in the tasks. Recommended team members included an IT specialist and test administrators. The majority of Ontario institutions followed this recommendation, some with larger teams than others. One of the ICs’ first tasks was to apply for institutional ethics approval to implement the test. Unlike other jurisdictions, Ontario institutions require permission to perform research on human subjects, including students. Based on the short timelines and the need to implement the test quickly, Ontario institutions were required to modify the parameters of the research in order to obtain ethics approval. For example, whereas AHELO had requested that the ICs have access to students’ administrative information
17 (to ensure that the sample was representative of the general population and to better
understand the assessment results based on GPA, high school average, etc.), Ontario institutions were not given permission to link the AHELO test results to student files. This resulted in less reliable information on the student sample writing the test and reduced institutions’ ability to examine the data. For example, had institutions had access to administrative files, they would have been able to examine individual AHELO test scores with other indicators of student ability, such as GPA. Institutional information of this nature would have supported a better understanding of the validity of the AHELO scores in Ontario.
18
Implementing Field Work
Student and Faulty Recruitment Student recruitment was a critical aspect of the AHELO feasibility study. Each institution was requested to identify a sample of 200 students to write the test and aim for a 75% recruitment rate. For those institutions with more than 200 students in the designated area (engineering or economics, or the entire institution in the case of Generic Skills), ICs were required to provide a sampling frame indicating which students were identified as potential participants.
19 This purposeful sampling frame was intended to ensure that a
representative sample of the population wrote the test. In cases where institutions had less than 200 potential test writers, the goal was to have all students participate as a census. All Ontario civil engineering programs had less than 200 final-year students
20, so all eligible students
21 were identified as potential candidates for the
assessment at each institution.
17
Only ICs were to have access to the student administrative data. The National Centre, Consortium and OECD would not. 18
Despite the challenges of gaining ethics approval for this feasibility study, any subsequent assessment of this nature would likely be accepted without significant modification given additional time to develop ethics applications and to communicate the goals of the study effectively. 19
This sampling framework was conducted under the guidance of the Consortium. 20
Participating programs had between 34 and 137 final year-students. 21
Student were excluded if they were out of the country or had disabilities requiring special arrangements.

AHELO: The Ontario Experience
Higher Education Quality Council of Ontario 13
Jurisdictions determined their own student recruitment strategies independently. While some made student participation mandatory, others made it voluntary. Those with voluntary participation did not always incentivize students, though the majority did (OECD, 2013a, p. 169). Student participation in Ontario was entirely voluntary. ICs recruited students in any way they felt was appropriate, as long as it was within the guidelines of their ethics protocol. A range of promotional activities and incentives were offered to students to entice participation, such as posters and information sessions, offers of gift certificates, prize draws and donations to civil engineering class societies (see Appendix D for a list of student recruitment activities and incentive structures). Recognizing that it was imperative to have sufficient numbers of participants to conduct any type of analysis, student recruitment was by far the most time-consuming and anxiety-provoking activity for ICs. As student participation was voluntary, all Ontario institutions ended up with a non-random, voluntary sample. Faculty participation in the short context survey was conducted in a similar way. If a faculty (or institution in the case of generic skills) had more than 40 members, a sampling frame was conducted to ensure that a representative sample was recruited. If there were fewer than 40 faculty members, as was the case in all participating Ontario institutions, a census of all faculty members was attempted. Unable to mandate or entice all faculty members to participate in the survey, Ontario institutions ended up with a voluntary sample.
Test Administration The AHELO test system was operational between February and June 2012 and institutions could test their students at any time during this window. Each institution was required to run a test of the computer platform to ensure that there were no technical difficulties. The times and dates of planned test sessions were reported in advance to the NPM (in case support was required for technical or emergency issues), who reported this information in turn to the consortium to ensure that the online system was prepared to handle the influx of activity. Institutional coordinators were responsible for organizing the AHELO test session and ensuring that the test administrator (invigilator) was suitably trained (based on AHELO training guidelines). In Ontario, the timing of the test window posed a challenge. The academic calendars schedule a one-week break in mid-February, followed by mid-term exams and the close of the academic year in April, preceded by final projects and exams. As a result, a very short period of time remained for test administration. Most institutions ran their tests in early to mid-March. Institutions offered the test at a variety of times and days, often taking into consideration student class schedules. Despite testing the system, one Ontario institution ran into technical difficulties and students were unable to submit their tests. While the Consortium rectified the technical issue, all but 8% of student responses were lost at that institution.
AHELO: The Ontario Experience
Higher Education Quality Council of Ontario 14
Scoring While the multiple choice questions on student assessments were scored automatically using a computerized system, each jurisdiction was responsible for the manual scoring of the constructed responses of its own students. The lead scorers attended two training sessions with fellow lead scorers to finalize the assessment questions and determine appropriate scoring matrices. This activity ensured the consistency of marking around the world. The lead scorer, in collaboration with the NPM, was responsible for recruiting a small team of scorers and training them in both the test system and the scoring matrix. In Ontario, a team of six engineers made up the scoring team (see Appendix C for a list of Canadian (Ontario) AHELO team members). The majority of scorers were ICs interested in reviewing the assessments and the work of Ontario students. Scoring took place over two days in June 2012 at the National Centre. As part of a memorandum of understanding (MOU) with Australia, Ontario scored some Australian answers and vice versa. This was conducted as an experiment in inter-rater reliability between scoring jurisdictions and as a point of interest for the scoring teams (which would not otherwise have seen other jurisdictions’ student responses).
Successes and Challenges of Administration A primary objective of the AHELO feasibility study was to understand if it was possible administratively to implement a standard assessment, online, in a common way, to students around the world. Indeed it was proven to be possible: experts and faculty members agreed on the common learning outcomes and the assessment questions, and project management and execution of tasks followed a common protocol around the world. There were minor administrative issues in various countries – some institutions dropped out, others had very low response rates or technical issues – but overall the administration of the international assessment was proven successful. The first volume of the AHELO report lays out a number of international lessons learned from the administration phase of the study (OECD, 2012a, ch. 6). There were considerable differences in administrative successes and challenges between participating jurisdictions, as well differences between the three strands. For example, one country recognized that the institutions did not have enough computers for the number of students completing the assessments, and thus required a travelling van to deliver computers to the institutions. Incredibly, Egypt was scheduled to implement the test during the Arab Spring, which created significant – though not insurmountable – challenges. These implementation issues are critical to understanding the practicality of administering the test – a primary goal of the study. Hence, a great deal of work has been done in collecting and sharing international experiences (see OECD, 2013a; ch. 8 for a description of each nations’ experience). Within Ontario, challenges and successes were both generic to all large-scale testing and specific to the AHELO context. Generally, student recruitment for low-stakes testing is extremely challenging. It is time-consuming in both the advertising (posters, emails, class visits, etc.) and in the organizing of test sessions. Furthermore, it can become expensive when students are provided with material incentives, financial or otherwise. Despite the challenges of student recruitment, the institutions were very creative in their strategies and found it to be quite rewarding to see their students participate. As one would expect in a feasibility study, there were a few hiccups in Ontario. The need to obtain ethics approval required institutions to quickly modify the assessment framework to reduce the institutional capacity to link the AHELO results to individual student level data. This reduced the potential value of the results for the institutions; at the time of writing, no institution has yet analyzed its own institutional data, but many have expressed interest in examining it.
AHELO: The Ontario Experience
Higher Education Quality Council of Ontario 15
In follow-up interviews and surveys, student and faculty participants indicated appreciation in participating in an international exercise, thereby validating their decision to participate in the study. This suggests that rather than being fearful of benchmarks or comparisons, there was true interest, from all levels, in understanding programmatic characteristics, strengths and weaknesses compared to those within the jurisdiction and around the world.
Discussion
Analysis of Ontario’s Results Nine jurisdictions and more than 70 institutions participated in the engineering strand of the feasibility study. In Ontario, out of the ten institutions that currently offer a civil engineering program, nine of them participated in the engineering strand of AHELO. Contextual information was collected from institutions. Across the nine participating institutions in Ontario, there were 155 faculty members and 443 final-year students who participated in the engineering strand of AHELO. Ontario had a response rate of 72% for faculty and 61%
22
for students. The data resulting from AHELO must be regarded with caution: they are not indicative of student, institution or system success or failure. Two primary factors, and a multitude of smaller issues, compromised the results.
1. The data are not representative of the jurisdictions or the institutions.
Institutional participation across countries was conducted as a sample of convenience and therefore was not representative of the jurisdiction.
Differences in institutional population samples and recruitment make the results unrepresentative at both the institutional and jurisdictional level.
2. As a feasibility study of “proof of concept”, the actual assessments were being trialed. The tests
themselves were not found to be accurate, thus any resulting information is unreliable.
Despite noting the unreliability of data, we felt that it was appropriate to analyze it nonetheless. The intention was to better understand the types of information that could be gathered by this type of large-scale international assessment activity. At best, the information gleaned can be considered as a point of interest, but also as an indication of the possibilities of this type of work and a contribution to the conversation on the value of participating in international assessments. Please see Appendix E for an exploratory analysis on how the data could be used to demonstrate institutional, faculty and student characteristics of the participating institutions in Ontario and how they could be compared to Australia and all nine participating jurisdictions.
22
Out of the 36 students who participated in the assessment at institution 9, 33 of the responses were not recorded as a result of a technological difficulty with the online system. The response rate for Ontario was determine using the number of students who participated in the assessment rather than the number of actual recorded responses.
AHELO: The Ontario Experience
Higher Education Quality Council of Ontario 16
Joint Analysis with Australia and Japan Because the AHELO study framework clearly stated that this was not a ranking exercise, it was understood from the outset that there would be no comparative country or institutional analysis. Yet one of the more interesting aspects of participating in this international project was working with, and understanding, the systems and students in various countries. This was a motivating factor for both Ontario and individual institutions to join the project. As a result, Australia and Canada entered into an MOU in order to share data.
23 The intention was not to draw
any conclusions on ranking the institutions or the jurisdictions but rather to better understand the characteristics of the institutions, programs and students within the two English-speaking countries participating in the engineering strand. As noted, the reliability and validity of the data is questionable and should not be considered an accurate portrait of student achievement. However, Australian information is provided in order to gain a deeper insight into the activities in Ontario. The sharing of data also makes it possible to create a larger sample size and analyze characteristics that may impact student success regardless of jurisdictional boundaries. This analysis was of significant interest to Japan as well, and thus the three countries agreed to pool data for a comparative analysis. This work
(currently underway) will present de‐identified country information highlighting the similarities and differences between the nations.
What Does AHELO Contribute to our Understanding? Recall that this feasibility study was not intended to provide any comparative ranking data but rather to explore the potential for this type of work in both field work and in trialing the assessment tools. Thus, the potential for digging into to the data was either a) not agreed to in the framework, or b) impossible due to data limitations discovered later. Acknowledging that the data gathered must be interpreted with caution, it is impossible to comment on the results and value they provide to stakeholders (i.e., jurisdictions, institutions, faculty members and students). Thus the feasibility study revealed that the tools need to be refined before we can determine the potential contribution of the information flowing from them. It also became apparent that any reworking of the frameworks or assessments would further beg the question of who this information should be valuable to, in order to tailor it appropriately to their needs. Let us now consider the value of the feasibility results in two ways:
1. What did the various stakeholder groups hope to gain from participating in AHELO?
2. How could the assessments be tailored to suit the needs of the various groups?
Jurisdictions At the outset of AHELO it was made clear that the purpose was not for international rankings of countries or institutions either internationally or within a jurisdiction. However, the potential for comparing and contrasting across and within countries/jurisdictions was a significant draw. For governments, the ability to know how their institutions and programs are organized and examine their impact on student learning presents valuable
23
All data provided were de-identified, so there was no possibility of identifying individual institutions.
AHELO: The Ontario Experience
Higher Education Quality Council of Ontario 17
information, which has the potential to lead to better understanding of policy and to improve the way systems interact with their institutions. For a variety of reasons, this was not possible in the AHELO feasibility study, but the potential for system-level learning exists. For example, if the information was to be presented in a way that did not permit for rankings on simple data points, but instead provided comparable information to peer countries or an international average, the potential for international comparisons would become possible.
Institution- and Program-Level Data The primary goal of the AHELO feasibility study was to provide information to institutions on how their students performed compared to others in various capacities. Similarly, information collected in the context surveys was intended to provide insight into the characteristics of the educational environments in which students work. The assessments used in AHELO were not sensitive enough to provide institution-level information on student capacities by specific competency areas.
24 Thus, it was not possible to compare institutions on
anything other than the aggregate score of their students. While this was disappointing to institutions participating in the feasibility study, a refined tool could make such comparisons possible. This information would be very useful in providing an understanding of the strengths and weaknesses of each group of students. For example, an institution might discover that its students are very strong in design and practice, but weaker in basic engineering skills. This type of detailed information could provide significant information to program and faculty members when considering curriculum design.
25 The ability to develop these sorts of
comparisons both in the jurisdiction and internationally was the primary reason Ontario institutions chose to participate in the study. The contextual data collected at the institutional and program level also has the potential to hold valuable information. Ontario institutions already collect administrative information on faculty and students. Thus much of this information is readily available in other sources, and the information on their own learning environments was not particularly new information to institutions or programs, nor is the within-jurisdiction comparison. Yet the point of interest could come from seeing the institutions and programs in comparison to others, together with the international averages. It could be possible to compare institutions and programs around the world and determine how commonalities and differences in learning environment impact student capacities. Similarly, a pooled analysis of the international trends in program design and environmental characteristics could provide information on the characteristics of successful programs or in providing benchmarking through common structural traits. Thus while there is value in the institutional information and comparisons currently provided, greater insight would be gained from international contrasts, as well as pooled information on global trends.
24
Engineering Design, Practice, and Analysis, and Generic and Basic engineering skills. 25
It has been suggested that proper assessment of competency levels would require a re-design of the assessment and would likely necessitate a longer test for students.
AHELO: The Ontario Experience
Higher Education Quality Council of Ontario 18
Student-Level Data Student-level data collected in AHELO had the possibility to provide information on observable trends in student demographics and characteristics, and assessment scores. Within the feasibility study framework, it was expected that institutions would be provided a comparison of their students’ situations to those in local institutions, and that with that information they might be better able to support student success. For example, discovering that older students are less likely to be successful – perhaps due to outside employment – institutions could choose to develop different student support strategies. Providing comparative information might also encourage collaborations between programs grappling with similar issues. While not provided in the current AHELO framework, it would be interesting to identify international trends in habits of student success, thus supporting cooperation and collaboration regardless of jurisdictional boundaries. One aspect that was discussed at length by participating AHELO jurisdictions, the Consortium and the OECD was the possibility of providing students with feedback on their assessment scores. The assessment frameworks were not designed in a way to provide reliable scores at the individual level. However, if students received their scores relative to others (either in the institution, jurisdiction, or internationally), they might become interested in a global and objective documentation of their abilities. This in turn could improve student recruitment and student effort in writing the test (to create more reliable information). This was not the intention of the AHELO feasibility study, but was of significant interest to many participating jurisdictions. This is one of many possible outputs of this type of assessment, but implementing it would necessitate a different assessment framework.
Conclusion The AHELO feasibility study was successful in building international relationships, aiding comparative system-level understanding, supporting institutional/programmatic understanding and exploring the potential of international student-level assessments. A great deal was learned from this research, both within jurisdictions and at the international level. We know now, for example, that is it is possible to administer a standard test to students around the world, and there seems to be interest from a variety of stakeholders, particularly the engineering programs, to do so. Within Ontario, we benefited from participating in the international conversation on the broader value of establishing and measuring learning outcomes. As Ontario is grappling with how to develop a system that incorporates learning outcomes, understanding how other systems are engaging with them has been appreciated. It was particularly interesting to see the tension between how various jurisdictions desire to use international learning outcomes assessments as either system-level benchmarks or for institutional and program-level improvement. As a feasibility study, the AHELO work produced many lessons learned and raised even more questions. It was found that there is interest in international assessments from governments, institutions, programs, faculty members and students. It was also determined that it is possible to have agreement on expected learning outcomes and appropriate assessments from around the world. Furthermore, it was found that it is possible to test students around the world in compatible ways. These were the primary questions of the AHELO study.

AHELO: The Ontario Experience
Higher Education Quality Council of Ontario 19
The remaining issues surround identifying the primary goal of a large-scale international assessment that supports stakeholder needs, and creating a framework that is fit-for-purpose in order to contribute to our understanding of student learning outcomes and quality education provision.
AHELO: The Ontario Experience
Higher Education Quality Council of Ontario 20
References
DeSimone, J. (2008). The Impact of Employment during School on College Student Academic Performance. National Bureau of Economic Research (NBER) Working Paper No. 14006.
Furr, S. R., & Elling, T. W. (2000). The influence of work on college student development. NASPA Journal, 37(2), 454-470.
Lennon, M. C. (2010). Signalling Abilities and Achievement: Measuring and Reporting on Skill and Competency Development. Toronto: Higher Education Quality Council of Ontario.
Lennon, M. C. (forthcoming). Tuning: Identifying and Measuring Sector-Based Learning Outcomes in Postsecondary Education. Toronto: Higher Education Quality Council of Ontario.
Lennon, M. C. (2014). Piloting the Collegiate Learning Assessment in Ontario: Lessons Learned. Toronto: Higher Education Quality Council of Ontario.
OECD. (2009a). Roadmap for the OECD Assessment of Higher Education Learning Outcomes (AHELO) Feasibility Study. Paris: OECD
OECD. (2009b). AHELO Terms of Reference. Paris: OECD.
OECD. (2011a). Tuning-AHELO Conceptual Framework of Expected and Desired Learning Outcomes in Economics. Paris: OECD.
OECD. (2011b). A Tuning-AHELO Conceptual Framework of Expected/Desired Learning Outcomes in Engineering. Paris: OECD.
OECD. (2012a). Engineering Assessment Framework. Paris: OECD.
OECD. (2012b). Final Engineering Assessment Development Report. Paris: OECD.
OECD. (2012c). Contextual Dimension Framework. Paris: OECD.
OECD. (2013a). AHELO: Feasibility Study Report: Volume 2: Data Analysis and National Experiences. Paris: OECD.
OECD. (2013b). AHELO: Feasibility Study Report: Volume 3: Further Insights. Paris: OECD.
PIAAC. (2013). OECD Skills Survey. Retrieved from http://www.oecd.org/site/piaac/
PISA. (2013). OECD Programme for International Student Assessment (PISA). Retrieved from http://www.oecd.org/pisa/
Steinberg, L., Fegley, S., & Dornbusch, S. M. (1993). Negative impact of part-time work on adolescent adjustment: Evidence from a longitudinal study. Development Psychology, 29(2), 171-180.

AHELO: The Ontario Experience
Higher Education Quality Council of Ontario 21
Stinebrickner, T., & Stinebrickner, R. (2003). Working during School and Academic Performance. Journal of Labor Economics, 21(2), 449-472.
Tremblay, K., Lalancette, D., & Roseveare, D. (2012). AHELO: Feasibility Study Report: Volume 1: Design and Implementation. Paris: OECD.
Tuning Association. (2009). A Tuning-AHELO Conceptual Framework of Expected/Desired Learning Outcomes in Engineering. Netherlands: Tuning Association.
von Davier, M., Gonzalez, E., & Mislevy, R. (2009). What are plausible values and why are they useful? In M.
von Davier and D. Hastedt (eds.), Issues and methodologies in large scale assessments (vol. 2, pp. 9-36). New Jersey: IEA-ETS Research Institute.

AHELO: The Ontario Experience
Higher Education Quality Council of Ontario 22
Appendix A: Example of Civil Engineering Multiple Choice Questions Source: Tremblay, Lalancette and Roseveare (2012), pp. 265-266 A load P is applied to a Warren truss as shown below.
If the self-weight of the members is ignored, which of the following statements is correct?
A. Compressive force exists in both the upper-chord member (p-q) and the lower-chord member (r-s). B. Tensile force exists in both the upper-chord member (p-q) and the lower-chord member (r-s). C. Compressive force exists in the upper-chord member (p-q), while tensile force is applied to the lower-
chord member (r-s). D. Tensile force exists in the upper-chord member (p-q), while compressive force is applied to the lower-
chord member (r-s).

AHELO: The Ontario Experience
Higher Education Quality Council of Ontario 23
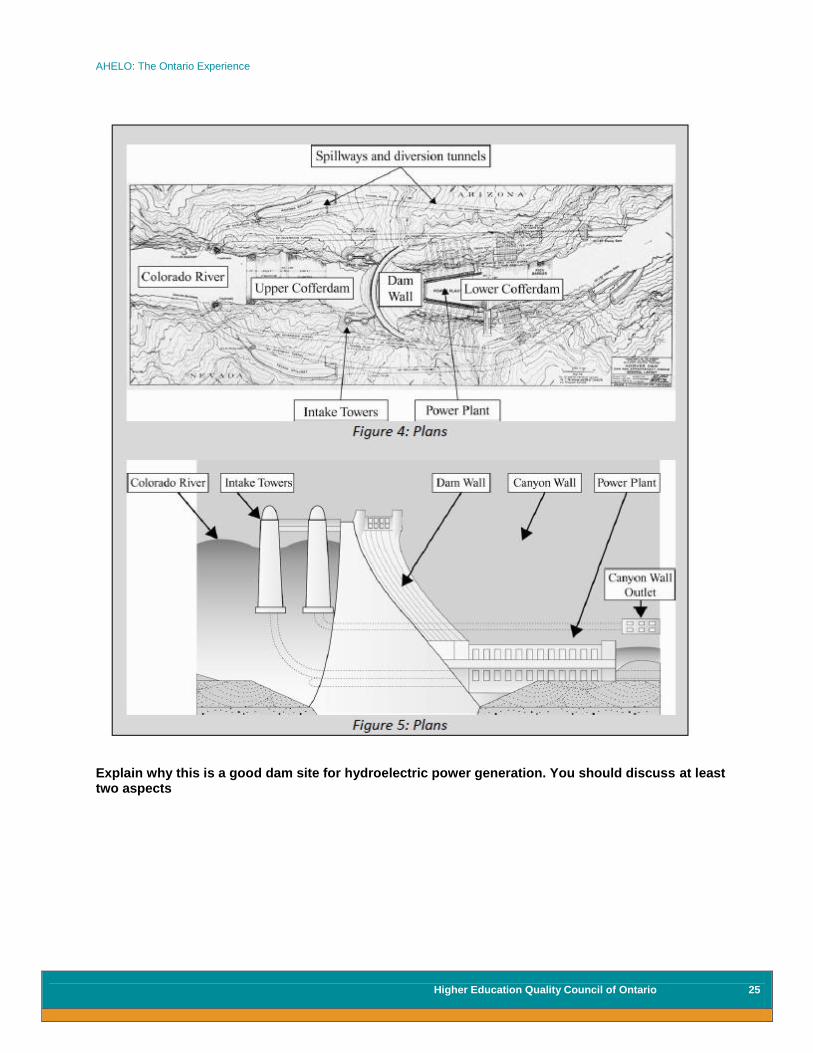
Appendix B: Example of Civil Engineering Constructed Response Task Source: Tremblay, Lalancette and Roseveare (2012), pp. 252-264
AHELO: The Ontario Experience
Higher Education Quality Council of Ontario 24
AHELO: The Ontario Experience
Higher Education Quality Council of Ontario 25
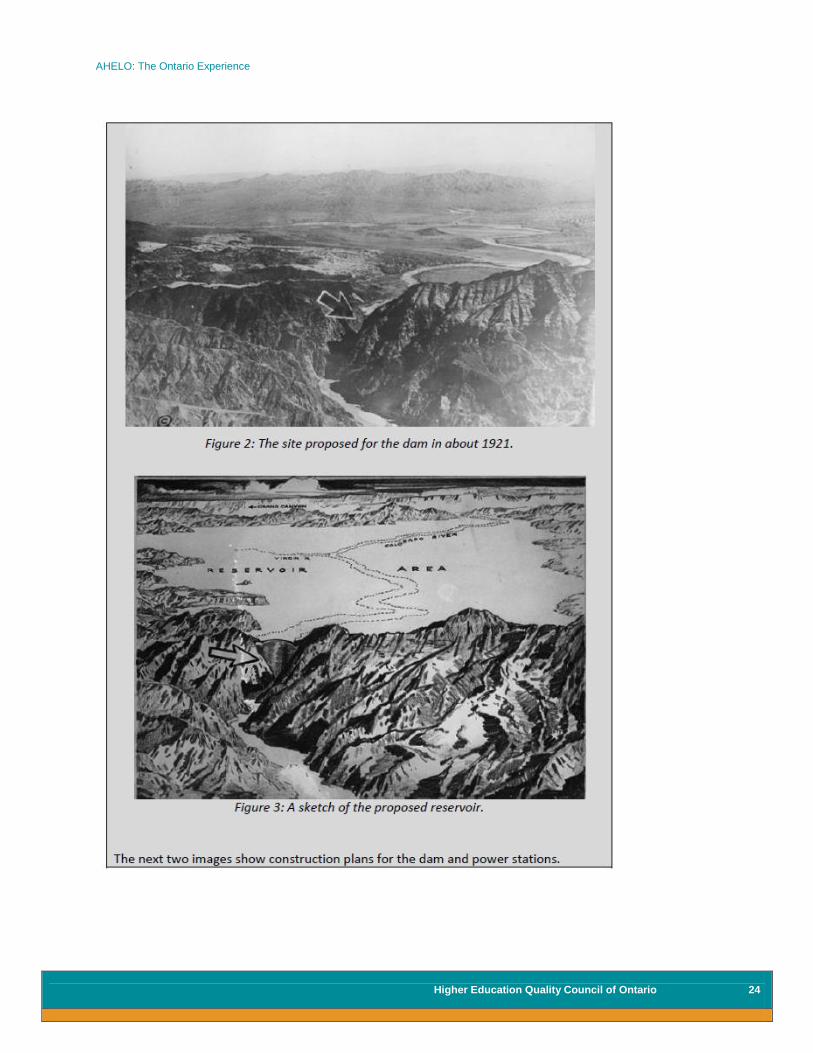
Explain why this is a good dam site for hydroelectric power generation. You should discuss at least two aspects
AHELO: The Ontario Experience
Higher Education Quality Council of Ontario 26
Appendix C: Canadian (Ontario) AHELO Team Members of the Group of National Experts Harvey Weingarten President and CEO Higher Education Quality Council of Ontario Mary Catharine Lennon Senior Research Analyst Higher Education Quality Council of Ontario Council of Ministers of Education, Canada National Project Manager Mary Catharine Lennon Senior Research Analyst Higher Education Quality Council of Ontario Lead Scorer Ernest Yanful Western University Institutional Coordinators Carleton University Yasser Hassan, Ph.D., P.Eng. Professor and Associate Chair – Graduate Studies Department of Civil and Environmental Engineering McMaster University Cameron Churchill Program Chair Civil Engineering Infrastructure Technology University of Ottawa Dan Palermo, Ph.D., P.Eng. Associate Professor Associate Chair Undergraduate Studies Department of Civil Engineering Queen's University Dr. Kent S. Novakowski, P.Geo., LEL Professor and Head Department of Civil Engineering Ryerson University Dr. Khaled Sennah, P.Eng., P.E., FCSCE Chair and Professor Civil Engineering Department
AHELO: The Ontario Experience
Higher Education Quality Council of Ontario 27
University of Toronto Robert C. Andrews, Ph.D., P.Eng. Professor Department of Civil Engineering University of Waterloo David J. Brush, Ph.D. Lecturer Department of Civil and Environmental Engineering University of Windsor Faouzi Ghrib, Ph.D., P.Eng. Acting Head Department of Civil and Environmental Engineering Western University Dr. Ernest K. Yanful, FCSCE, P.Eng. Chair and Professor Department of Civil and Environmental Engineering Scoring Team Faouzi Ghrib, Ph.D., P.Eng. Acting Head Department of Civil and Environmental Engineering University of Windsor Yasser Hassan, Ph.D., P.Eng. Professor and Associate Chair – Graduate Studies Department of Civil and Environmental Engineering Carleton University Dan Palermo, Ph.D., P.Eng., Associate Professor Department of Civil Engineering University of Ottawa Sai Vanapalli, Ph.D., P.Eng. Department Chair and Professor Department of Civil Engineering University of Ottawa A. H. M. Anwar Sadmani, PhD. candidate NSERC Chair in Drinking Water Research Department of Civil Engineering University of Toronto Dr. Ernest K. Yanful, FCSCE, P.Eng. Chair and Professor Department of Civil and Environmental Engineering Western University
AHELO: The Ontario Experience
Higher Education Quality Council of Ontario 28
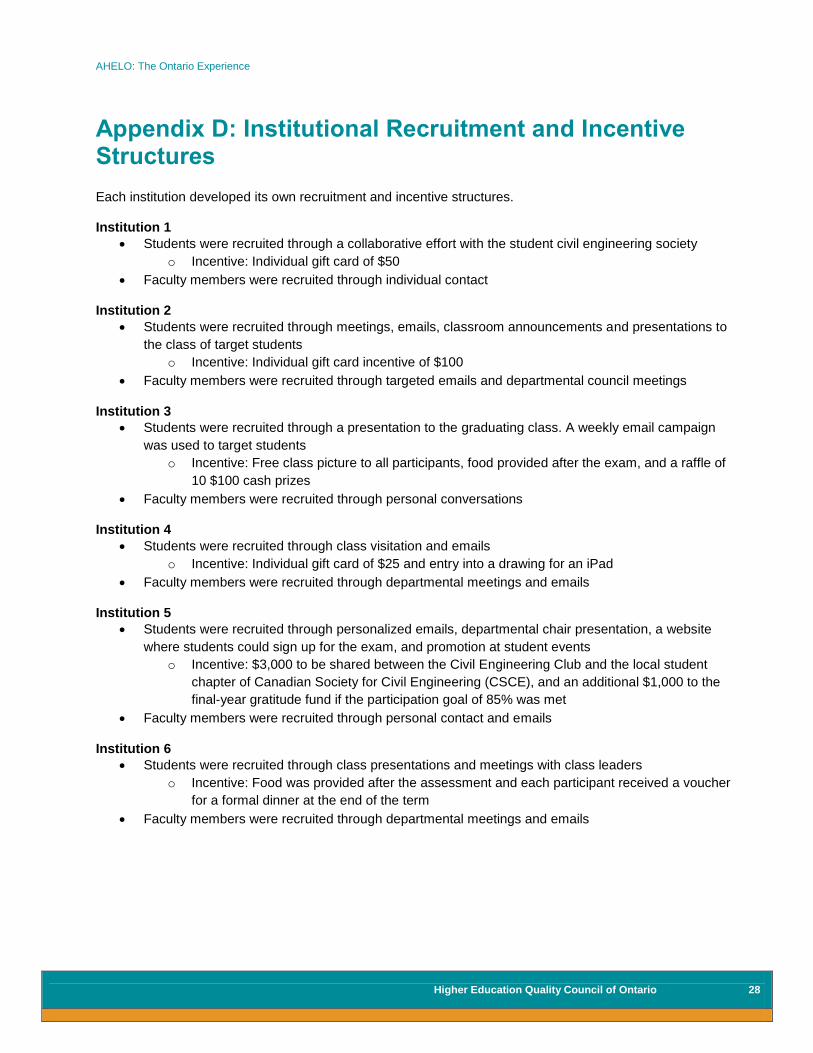
Appendix D: Institutional Recruitment and Incentive Structures Each institution developed its own recruitment and incentive structures. Institution 1
Students were recruited through a collaborative effort with the student civil engineering society
o Incentive: Individual gift card of $50
Faculty members were recruited through individual contact
Institution 2
Students were recruited through meetings, emails, classroom announcements and presentations to
the class of target students
o Incentive: Individual gift card incentive of $100
Faculty members were recruited through targeted emails and departmental council meetings
Institution 3
Students were recruited through a presentation to the graduating class. A weekly email campaign
was used to target students
o Incentive: Free class picture to all participants, food provided after the exam, and a raffle of
10 $100 cash prizes
Faculty members were recruited through personal conversations
Institution 4
Students were recruited through class visitation and emails
o Incentive: Individual gift card of $25 and entry into a drawing for an iPad
Faculty members were recruited through departmental meetings and emails
Institution 5
Students were recruited through personalized emails, departmental chair presentation, a website
where students could sign up for the exam, and promotion at student events
o Incentive: $3,000 to be shared between the Civil Engineering Club and the local student
chapter of Canadian Society for Civil Engineering (CSCE), and an additional $1,000 to the
final-year gratitude fund if the participation goal of 85% was met
Faculty members were recruited through personal contact and emails
Institution 6
Students were recruited through class presentations and meetings with class leaders
o Incentive: Food was provided after the assessment and each participant received a voucher
for a formal dinner at the end of the term
Faculty members were recruited through departmental meetings and emails
AHELO: The Ontario Experience
Higher Education Quality Council of Ontario 29
Institution 7
Students were recruited through faculty and student presentations to classes
o Incentive: Provided the civil engineering club $2,500
Faculty members were recruited through personal conversations and email
Institution 8
Students were recruited through personal meetings with faculty members
o Incentive: $25 per student (promise of $50 per student if the participation rate of 80% was
attained) and a raffle for an iPad
Faculty members were recruited through personal conversations and email
Institution 9
Students were recruited through a website for students to indicate their time and incentive
preferences, discussions during class time, departmental chair presentation, and consultation with
student leaders
o Incentive: Food was provided after each assessment and each student was guaranteed a
$40 gift card (this amount would have increased to $60 if they had reached their 85%
participation rate target)
Faculty members were recruited through department chair presentations and frequent updates on
project advancements
AHELO: The Ontario Experience
Higher Education Quality Council of Ontario 30
Appendix E: Data Analysis and Regression Results A secondary aspect of the AHELO feasibility study was to determine whether the assessment tools themselves were valid and reliable and would yield useful and usable data. As noted, each strand of the feasibility study incorporated a survey of institutions, faculty and students, in addition to the student assessment. The following section reviews the results from the study. It notes the international outcomes [as compiled by the OECD (2013)] and examines the Ontario data. It is imperative for readers to understand that the Ontario data is largely unreliable (particularly when reporting student scores) and should only be taken as an indication of what type of information could be gleaned from this type of assessment.
Caveats to Data Analysis and Interpretation It has been noted repeatedly in this report that the data resulting from AHELO must be regarded with caution: they are not indicative of student, institution or system success or failure. Two primary factors, and a multitude of smaller issues, compromised the validity of the results.
1. The results are not representative of the jurisdictions or the institutions.
Institutional participation across countries was conducted as a sample of convenience and therefore was not representative of the jurisdiction.
Differences in institutional population samples and recruitment make the results unrepresentative at both the institutional and jurisdictional level.
2. As a feasibility study of “proof of concept”, the actual assessments were being trialled. The tests themselves were not accurate, thus any resulting information is unreliable.
Despite noting the unreliability of the following analysis, we felt that it was appropriate to provide it nonetheless. The intention of the analysis presented here is to better understand the types of information that can be gathered by this type of large-scale international assessment activity – whether it be AHELO or another. At best, the information provided here can be considered as a point of interest, but also as an indication of the possibilities of this type of work and a contribution to the conversation on the value of participating in international assessments.
Test Validity and Reliability The international analysis of the data provided by the OECD reviewed the overall reliability and validity of each of the strand assessments. The results produced were intended to demonstrate that instruments such as the ones developed could provide viable measures of student learning.
26
Validity refers to the degree to which the instruments for the generic skills, economics and engineering strand measure what they were intended to measure. Four different validity tests were examined: construct validity, content validity, face validity and concurrent validity, using both qualitative and quantitative measures. Factors such as the time students spent on the assessment, the level of self-reported effort, the share of non-response questions, student feedback, and the small number of items removed due to unmet psychometric
26
For a full description of the concepts of validity and reliability and the evaluations of the assessments, see OECD, 2013, ch. 7.

AHELO: The Ontario Experience
Higher Education Quality Council of Ontario 31
standards27
provide evidence that the three instruments have achieved reasonable levels of construct, content and face validity. For concurrent validity, which was measured through the correlation between assessment scores and self-reported academic performance and the correlation between scores and student satisfaction, the evidence was less conclusive. Reliability refers to whether the three instruments are consistent. Reliability does not imply validity and instead measures the reliability of assessment scores by determining how much of each student’s test score is due to true ability and how much is due to errors of measurement. Using a ratio ranging from 0 to 1 between true ability and measurement error, according to the AHELO Technical Standards, an instrument is considered reliable if the reliability index is 0.80 or higher (which represents a higher level of consistency). The generic skills and economics instruments were found to have a good level of reliability, whereas the engineering instrument was found to have only an acceptable level of reliability and fell below the AHELO Technical Standards.
28 Focusing on the country level, and even data aggregated at the institutional level, results were
even less reliable for all three instruments. The engineering test was deemed to be generally valid and reliable, but there were issues that made analysis challenging. The questions were found to be too challenging for students around the world, which resulted in a higher than expected number of incorrect answers or “0” scores. The prevalence of 0’s made it difficult to properly examine student capabilities within specific competency areas. An additional issue for the engineering strand was that the small numbers of students responding to each of the questions made it virtually impossible to garner valid information on the competency areas of Basic and Engineering Science, Engineering Analysis Engineering Design Engineering Practice and Engineering Generic skills. Hence, while the original hope had been for institutions and jurisdictions to be able to conduct an analysis in specific areas of competencies, this is not statistically possible from the AHELO data.
Analysis Similar to the Programme for International Student Assessment (PISA), assessment scores for AHELO were derived from imputed values based on student assessment scores and background information. The imputed values, known as plausible values, “are a representation of the range of abilities that a student might reasonably have” (Wu & Adams, 2002). In large-scale surveys where participants only answer a subset of the questions, it is common to use plausible values as a way of achieving a higher level of accuracy in order to minimize the amount of measurement error (von Davier, Gonzalez & Mislevy, 2009). For AHELO, five plausible values were calculated for each student based on random draws from their posterior distribution, which is a distribution of a student’s proficiency. Final assessment scores are then obtained by averaging across the five plausible values. Since the AHELO feasibility study was not intended to rank countries or even institutions, plausible values are useful when constructing group-level estimates as they are unbiased. AHELO data are composed of three main sections:
Institution- and program-level data, which contain detailed information on the student population for all bachelor’s-level programs and for the civil engineering program;
27
During the analysis stage there was the recognition that some of the test items did not perform as expected, so these were removed from the analysis as a result. Items were removed by looking at the degree of difficulty, item discrimination, correlations between item-to-test and the response rate for each item (OECD, 2013). There were a small number of items removed from both the generic skills and economics strand and no items removed from the engineering strand. 28
The final reliability using plausible values was 0.83 for the general skills instrument, 0.84 for the economics instrument and 0.75 for the engineering instrument.
AHELO: The Ontario Experience
Higher Education Quality Council of Ontario 32
Faculty-level data, which include an overview of the faculty members from the civil engineering program of their employment status, qualifications and workload; and
Student-level data, which contain the engineering assessment scores as well as demographic characteristics and how students spend their time.
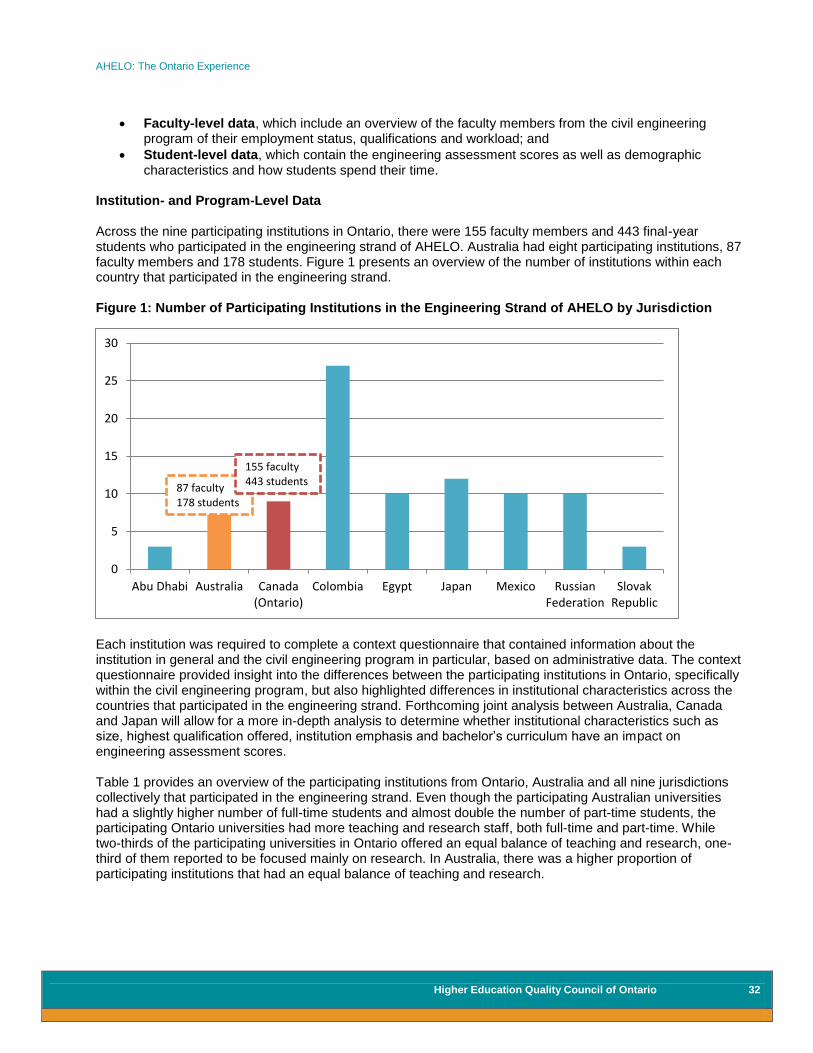
Institution- and Program-Level Data Across the nine participating institutions in Ontario, there were 155 faculty members and 443 final-year students who participated in the engineering strand of AHELO. Australia had eight participating institutions, 87 faculty members and 178 students. Figure 1 presents an overview of the number of institutions within each country that participated in the engineering strand. Figure 1: Number of Participating Institutions in the Engineering Strand of AHELO by Jurisdiction
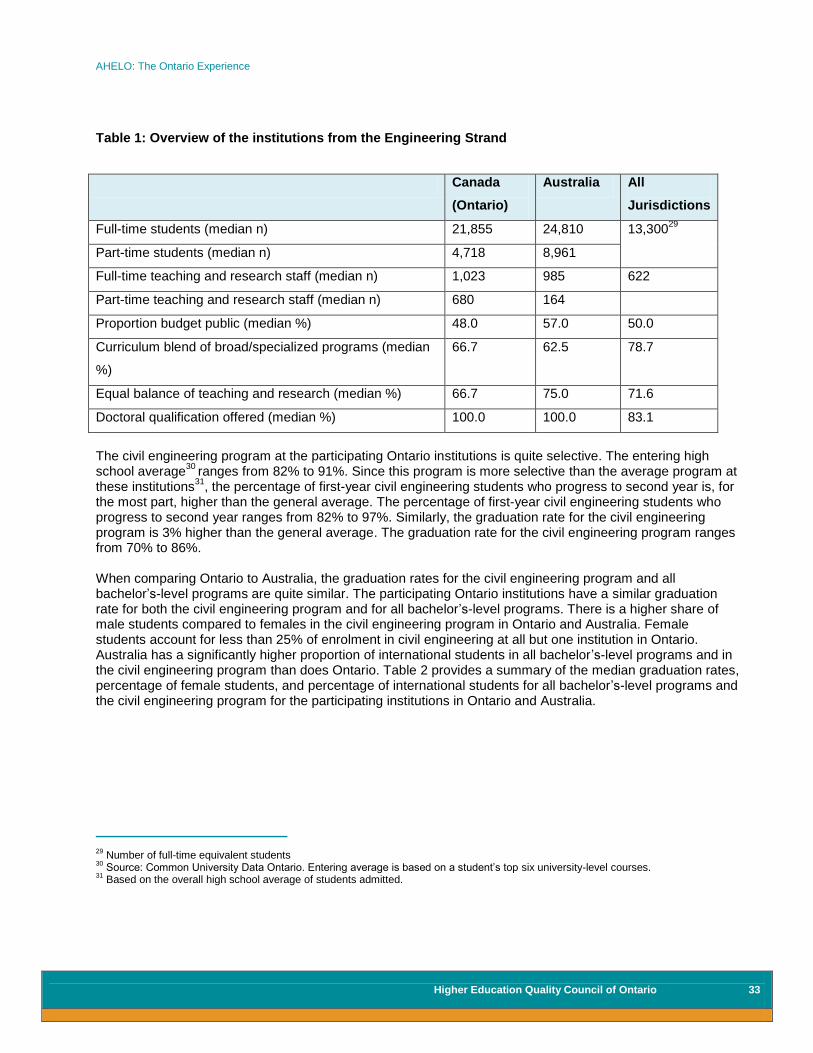
Each institution was required to complete a context questionnaire that contained information about the institution in general and the civil engineering program in particular, based on administrative data. The context questionnaire provided insight into the differences between the participating institutions in Ontario, specifically within the civil engineering program, but also highlighted differences in institutional characteristics across the countries that participated in the engineering strand. Forthcoming joint analysis between Australia, Canada and Japan will allow for a more in-depth analysis to determine whether institutional characteristics such as size, highest qualification offered, institution emphasis and bachelor’s curriculum have an impact on engineering assessment scores. Table 1 provides an overview of the participating institutions from Ontario, Australia and all nine jurisdictions collectively that participated in the engineering strand. Even though the participating Australian universities had a slightly higher number of full-time students and almost double the number of part-time students, the participating Ontario universities had more teaching and research staff, both full-time and part-time. While two-thirds of the participating universities in Ontario offered an equal balance of teaching and research, one-third of them reported to be focused mainly on research. In Australia, there was a higher proportion of participating institutions that had an equal balance of teaching and research.
0
5
10
15
20
25
30
Abu Dhabi Australia Canada(Ontario)
Colombia Egypt Japan Mexico RussianFederation
SlovakRepublic
87 faculty 178 students
155 faculty 443 students
AHELO: The Ontario Experience
Higher Education Quality Council of Ontario 33
Table 1: Overview of the institutions from the Engineering Strand
Canada
(Ontario)
Australia All
Jurisdictions
Full-time students (median n) 21,855 24,810 13,30029
Part-time students (median n) 4,718 8,961
Full-time teaching and research staff (median n) 1,023 985 622
Part-time teaching and research staff (median n) 680 164
Proportion budget public (median %) 48.0 57.0 50.0
Curriculum blend of broad/specialized programs (median
%)
66.7 62.5 78.7
Equal balance of teaching and research (median %) 66.7 75.0 71.6
Doctoral qualification offered (median %) 100.0 100.0 83.1
The civil engineering program at the participating Ontario institutions is quite selective. The entering high school average
30 ranges from 82% to 91%. Since this program is more selective than the average program at
these institutions31
, the percentage of first-year civil engineering students who progress to second year is, for the most part, higher than the general average. The percentage of first-year civil engineering students who progress to second year ranges from 82% to 97%. Similarly, the graduation rate for the civil engineering program is 3% higher than the general average. The graduation rate for the civil engineering program ranges from 70% to 86%. When comparing Ontario to Australia, the graduation rates for the civil engineering program and all bachelor’s-level programs are quite similar. The participating Ontario institutions have a similar graduation rate for both the civil engineering program and for all bachelor’s-level programs. There is a higher share of male students compared to females in the civil engineering program in Ontario and Australia. Female students account for less than 25% of enrolment in civil engineering at all but one institution in Ontario. Australia has a significantly higher proportion of international students in all bachelor’s-level programs and in the civil engineering program than does Ontario. Table 2 provides a summary of the median graduation rates, percentage of female students, and percentage of international students for all bachelor’s-level programs and the civil engineering program for the participating institutions in Ontario and Australia.
29
Number of full-time equivalent students 30
Source: Common University Data Ontario. Entering average is based on a student’s top six university-level courses. 31
Based on the overall high school average of students admitted.
AHELO: The Ontario Experience
Higher Education Quality Council of Ontario 34
Table 2: Comparison of the Student Population from the Participating Institutions in Canada (Ontario) and Australia
Canada
(Ontario)
Australia
Bachelor’s
Level
Civil
Engineering
Bachelor’s
Level
Civil
Engineering
Graduation rate 75.4% 78.5% 77.0% 77.5%
Percentage of female students 54.4% 21.3% 54.7% 14.7%
Percentage of international students 8.0% 13.3% 25.6% 23.4%
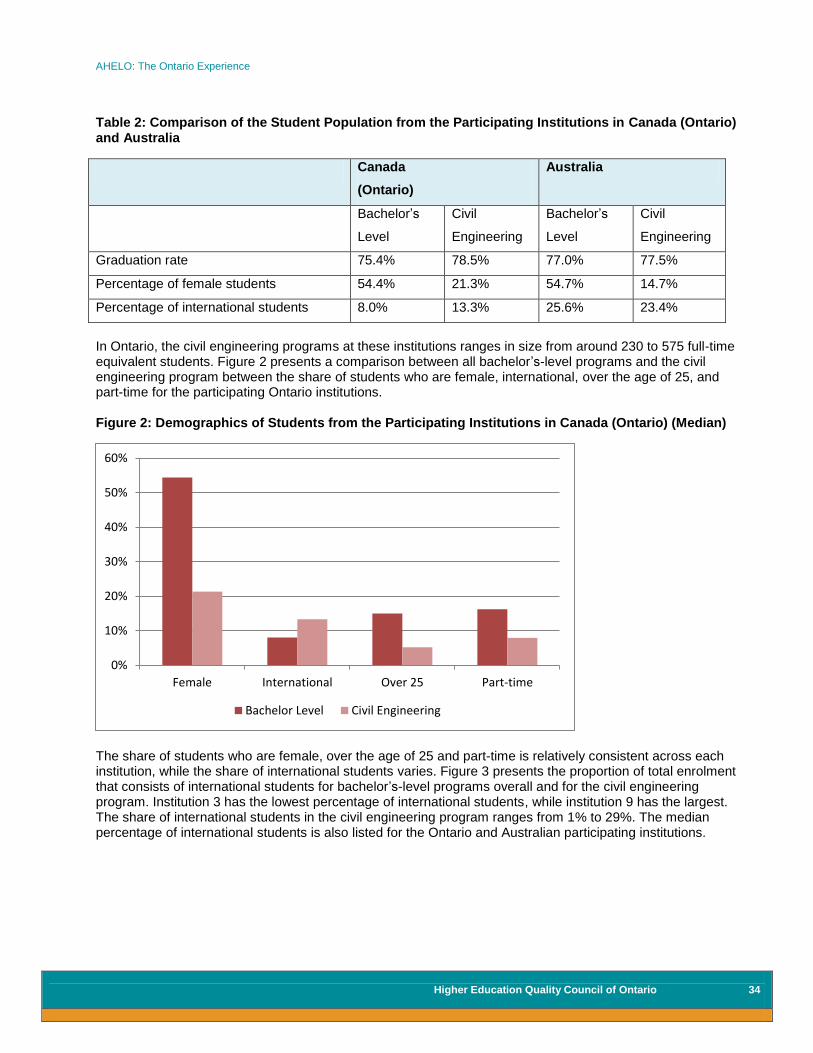
In Ontario, the civil engineering programs at these institutions ranges in size from around 230 to 575 full-time equivalent students. Figure 2 presents a comparison between all bachelor’s-level programs and the civil engineering program between the share of students who are female, international, over the age of 25, and part-time for the participating Ontario institutions. Figure 2: Demographics of Students from the Participating Institutions in Canada (Ontario) (Median)
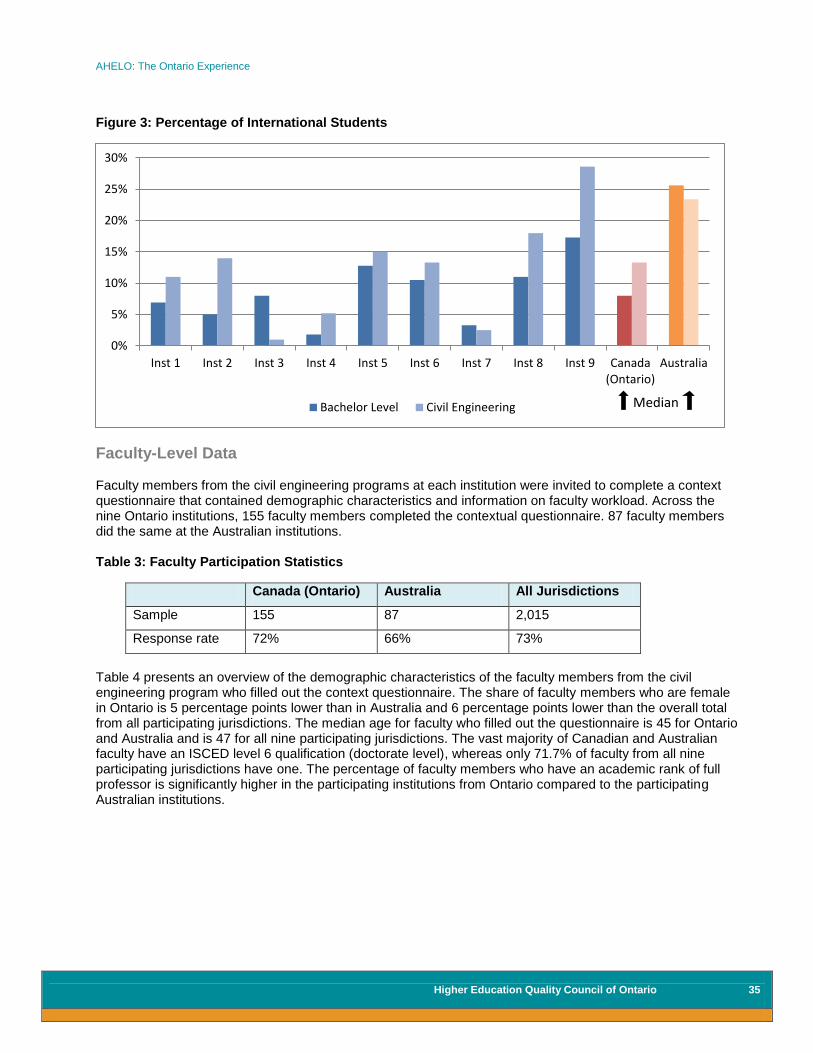
The share of students who are female, over the age of 25 and part-time is relatively consistent across each institution, while the share of international students varies. Figure 3 presents the proportion of total enrolment that consists of international students for bachelor’s-level programs overall and for the civil engineering program. Institution 3 has the lowest percentage of international students, while institution 9 has the largest. The share of international students in the civil engineering program ranges from 1% to 29%. The median percentage of international students is also listed for the Ontario and Australian participating institutions.
0%
10%
20%
30%
40%
50%
60%
Female International Over 25 Part-time
Bachelor Level Civil Engineering
AHELO: The Ontario Experience
Higher Education Quality Council of Ontario 35
Figure 3: Percentage of International Students
Faculty-Level Data Faculty members from the civil engineering programs at each institution were invited to complete a context questionnaire that contained demographic characteristics and information on faculty workload. Across the nine Ontario institutions, 155 faculty members completed the contextual questionnaire. 87 faculty members did the same at the Australian institutions. Table 3: Faculty Participation Statistics
Canada (Ontario) Australia All Jurisdictions
Sample 155 87 2,015
Response rate 72% 66% 73%
Table 4 presents an overview of the demographic characteristics of the faculty members from the civil engineering program who filled out the context questionnaire. The share of faculty members who are female in Ontario is 5 percentage points lower than in Australia and 6 percentage points lower than the overall total from all participating jurisdictions. The median age for faculty who filled out the questionnaire is 45 for Ontario and Australia and is 47 for all nine participating jurisdictions. The vast majority of Canadian and Australian faculty have an ISCED level 6 qualification (doctorate level), whereas only 71.7% of faculty from all nine participating jurisdictions have one. The percentage of faculty members who have an academic rank of full professor is significantly higher in the participating institutions from Ontario compared to the participating Australian institutions.
0%
5%
10%
15%
20%
25%
30%
Inst 1 Inst 2 Inst 3 Inst 4 Inst 5 Inst 6 Inst 7 Inst 8 Inst 9 Canada(Ontario)
Australia
Bachelor Level Civil Engineering Median

AHELO: The Ontario Experience
Higher Education Quality Council of Ontario 36
Table 4: Faculty Demographics, Employment Status and Qualifications
Canada (Ontario) Australia All Jurisdictions
Percentage female (%) 11.8 16.7 17.5
Years of age (median) 45 45 47
ISCED 6 qualification (%) 98.7 90.5 71.7
Permanent employment contract (%) 92.2 81.0 75.1
Professorial academic rank (%) 38.8 10.7 34.5
Figure 4 shows the percentage of faculty members who spend over 16 hours per week teaching and doing research for each institution in Ontario and the overall share for Ontario and Australia. Institution 1 is not included due to small sample size. On average, faculty members typically spend more hours focused on research than teaching. This gap is less pronounced in Australia than in Ontario.
Figure 4: Percentage of Faculty Time on Teaching and Research
Student-Level Data In addition to completing the AHELO engineering assessment, students were required to fill out a student context questionnaire that surveyed demographic characteristics, student engagement and involvement characteristics. Across the nine institutions in Ontario, 443 students participated in the study. The majority of student responses from Institution 9 were not recorded due to technological difficulties with the online system.
32 While the results that were recorded for this institution are reflected in the Canadian total, they
cannot be broken down at the institution level. For Ontario overall, results were only recorded for 410 of the 443 participating students due to this failure with the test system at institution 9. The student response rate for
32
For institution 9, out of the 36 students that participated in the assessment, 33 of the responses were not recorded as a result of this technological difficulty with the test system.
0%
10%
20%
30%
40%
50%
60%
70%
80%
90%
Inst 2 Inst 3 Inst 4 Inst 5 Inst 6 Inst 7 Inst 8 Inst 9 Canada(Ontario)
Australia
Teaching Research

AHELO: The Ontario Experience
Higher Education Quality Council of Ontario 37
Ontario was 61%33
, which is 13% lower than the overall response rate for all nine participating jurisdictions and 19% higher than the response rate in Australia.
34 Table 5 presents the student participation rate
35, the
response rate and the sample for Ontario, Australia and all nine participating jurisdictions. Table 5: Student Participation Statistics
Canada (Ontario) Australia All Jurisdictions
Participation rate 100% 100% 76%
Response rate 61% 42% 74%
# of responses 443 178 6,078
Figure 5 presents the mean engineering assessment scores across each participating Ontario institution and overall for Ontario, Australia and all nine participating jurisdictions. The scores from the assessment were standardized using a metric across all participating institutions that has a mean of 500 and a standard deviation of 100. Standard deviation bars are shown for each of the participating institutions from Ontario to indicate the dispersion from the mean. As discussed, these score are only presented to provide an indication of what might be gained from this type of assessment work. The actual scores do not accurately reflect institutional or student capacities. Figure 5: Mean Engineering Assessment Scores
33
The response rate for Ontario was determined using the number of students who participated in the assessment rather than the number of actual recorded responses. 34
The method by which students were selected to participate in the assessments seemed to have a significant impact: while those institutions conducting a census had an average response rate of 89%, those with a non-random sample had a rate of 68%, and those that recruited a random sample of the student population had a rate of 51% (OECD, 2012a, p. 162). 35
As mentioned earlier, since there were less than 200 students in the civil engineering program at the participating institutions in Ontario, Ontario has a participation rate of 100% as all of these students were included. For institutions with more than 200 students, a sampling frame was used to identify a sample of participants.
0
100
200
300
400
500
600
700
800
Inst 1 Inst 2 Inst 3 Inst 4 Inst 5 Inst 6 Inst 7 Inst 8 Canada(Ontario)
Australia Allcountries

AHELO: The Ontario Experience
Higher Education Quality Council of Ontario 38
The amount of self-reported student effort put into the engineering assessment was consistent across the Ontario institutions. On average, students from Ontario reported putting slightly less effort put into the assessment relative to students from Australia and students from the nine participating jurisdictions. When examining the assessment scores by level of effort, students from Ontario who self-reported putting more effort into the assessment performed better on average than students who reported putting in little or no effort. The correlation coefficient between effort put into the assessment and assessment scores is 0.15, which indicates a weak relationship between the two measures. Figure 6 shows the distribution of assessment scores by level of effort for the participating institutions in Ontario. Figure 6: Mean Scores in Ontario by Self-Reported Effort Put into the Engineering Assessment
Most students indicated that the assessment was more relevant to their current degree than to their future profession. Students from Australia reported a higher level of relevance for both their current degree and their future profession to the assessment. While students from Ontario reported that the assessment was more relevant to their current degree than did students in the nine participating jurisdictions, the relevance they reported for a future profession was slightly lower than the overall average. Figure 7 presents the student perceptions of relevance of the engineering assessment for each institution in Ontario and the overall average for Ontario, Australia and all nine participating jurisdictions.
520
530
540
550
560
570
580
590
600
my best close to my best some little or no
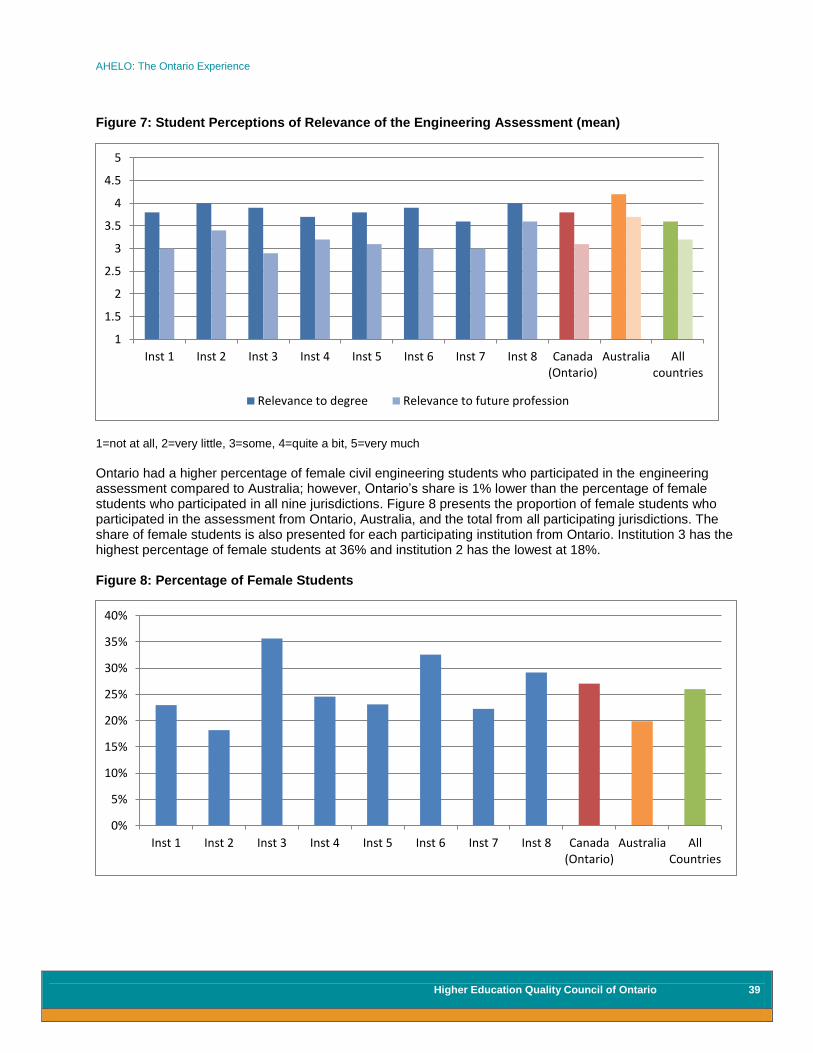
AHELO: The Ontario Experience
Higher Education Quality Council of Ontario 39
Figure 7: Student Perceptions of Relevance of the Engineering Assessment (mean)
1=not at all, 2=very little, 3=some, 4=quite a bit, 5=very much Ontario had a higher percentage of female civil engineering students who participated in the engineering assessment compared to Australia; however, Ontario’s share is 1% lower than the percentage of female students who participated in all nine jurisdictions. Figure 8 presents the proportion of female students who participated in the assessment from Ontario, Australia, and the total from all participating jurisdictions. The share of female students is also presented for each participating institution from Ontario. Institution 3 has the highest percentage of female students at 36% and institution 2 has the lowest at 18%. Figure 8: Percentage of Female Students
1
1.5
2
2.5
3
3.5
4
4.5
5
Inst 1 Inst 2 Inst 3 Inst 4 Inst 5 Inst 6 Inst 7 Inst 8 Canada(Ontario)
Australia Allcountries
Relevance to degree Relevance to future profession
0%
5%
10%
15%
20%
25%
30%
35%
40%
Inst 1 Inst 2 Inst 3 Inst 4 Inst 5 Inst 6 Inst 7 Inst 8 Canada(Ontario)
Australia AllCountries

AHELO: The Ontario Experience
Higher Education Quality Council of Ontario 40
The following figure shows the breakdown of scores by gender. Overall, male students outperformed females; however, the gap in scores is smaller for the Ontario institutions than for Australia and for all participating jurisdictions. The correlation coefficient between gender and assessment scores in Ontario is -0.07, which indicates a very weak relationship between gender and assessment scores. Figure 9: Mean Scores by Gender
The median age for students in Ontario and Australia who participated in the assessment is 22, which is the same as the median age across the nine jurisdictions. Figure 10 presents the mean test scores by age. Due to small sample size for students who were 20 and younger, mean scores are not presented for this age bracket for Ontario and Australia. For Ontario, students who were 22 had the highest test scores, whereas students who were 21 had the highest test scores for Australia and the nine jurisdictions. Figure 10: Mean Scores by Age
350
400
450
500
550
600
650
700
Canada (Ontario) Australia All Countries
Male Female
300
350
400
450
500
550
600
650
700
Canada (Ontario) Australia All Countries
20 and younger 21 22 23 24 and older
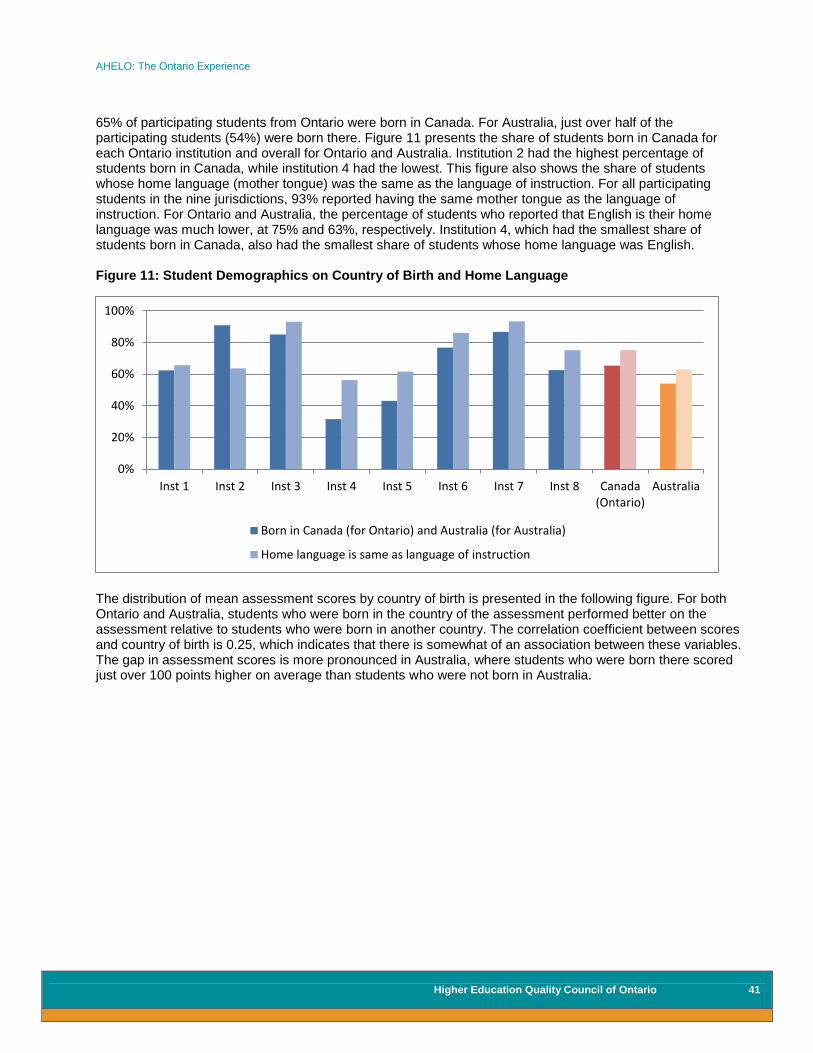
AHELO: The Ontario Experience
Higher Education Quality Council of Ontario 41
65% of participating students from Ontario were born in Canada. For Australia, just over half of the participating students (54%) were born there. Figure 11 presents the share of students born in Canada for each Ontario institution and overall for Ontario and Australia. Institution 2 had the highest percentage of students born in Canada, while institution 4 had the lowest. This figure also shows the share of students whose home language (mother tongue) was the same as the language of instruction. For all participating students in the nine jurisdictions, 93% reported having the same mother tongue as the language of instruction. For Ontario and Australia, the percentage of students who reported that English is their home language was much lower, at 75% and 63%, respectively. Institution 4, which had the smallest share of students born in Canada, also had the smallest share of students whose home language was English. Figure 11: Student Demographics on Country of Birth and Home Language
The distribution of mean assessment scores by country of birth is presented in the following figure. For both Ontario and Australia, students who were born in the country of the assessment performed better on the assessment relative to students who were born in another country. The correlation coefficient between scores and country of birth is 0.25, which indicates that there is somewhat of an association between these variables. The gap in assessment scores is more pronounced in Australia, where students who were born there scored just over 100 points higher on average than students who were not born in Australia.
0%
20%
40%
60%
80%
100%
Inst 1 Inst 2 Inst 3 Inst 4 Inst 5 Inst 6 Inst 7 Inst 8 Canada(Ontario)
Australia
Born in Canada (for Ontario) and Australia (for Australia)
Home language is same as language of instruction
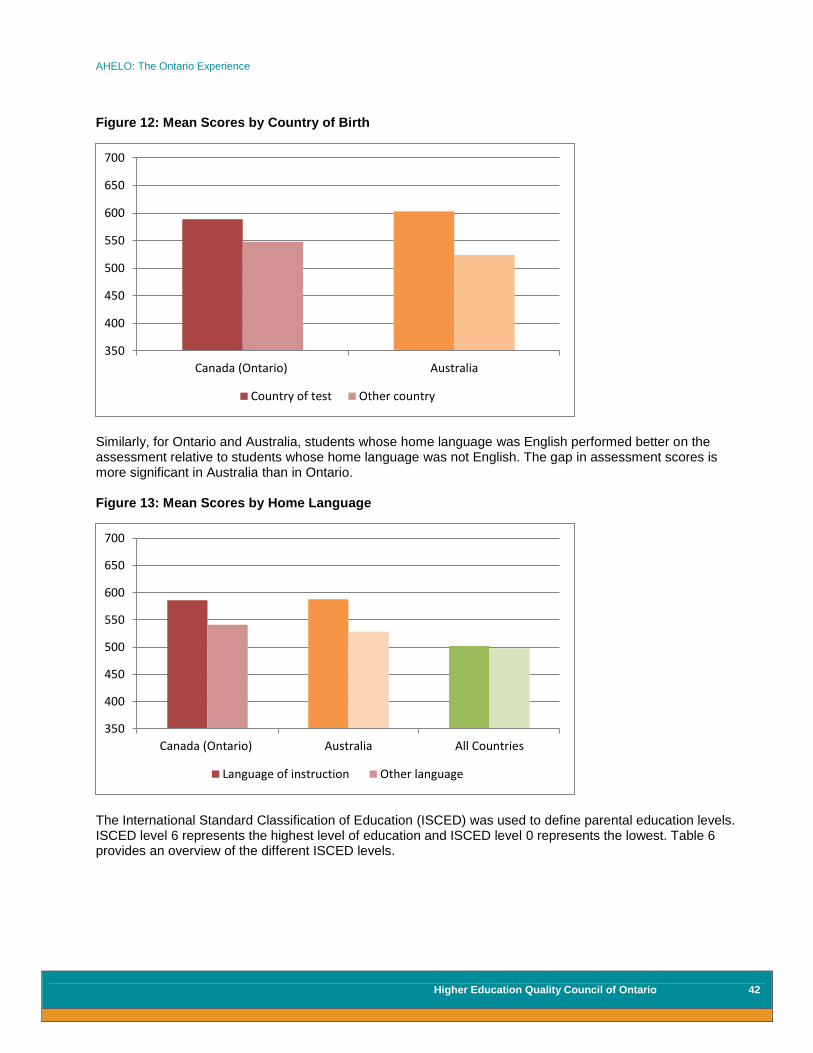
AHELO: The Ontario Experience
Higher Education Quality Council of Ontario 42
Figure 12: Mean Scores by Country of Birth
Similarly, for Ontario and Australia, students whose home language was English performed better on the assessment relative to students whose home language was not English. The gap in assessment scores is more significant in Australia than in Ontario. Figure 13: Mean Scores by Home Language
The International Standard Classification of Education (ISCED) was used to define parental education levels. ISCED level 6 represents the highest level of education and ISCED level 0 represents the lowest. Table 6 provides an overview of the different ISCED levels.
350
400
450
500
550
600
650
700
Canada (Ontario) Australia
Country of test Other country
350
400
450
500
550
600
650
700
Canada (Ontario) Australia All Countries
Language of instruction Other language

AHELO: The Ontario Experience
Higher Education Quality Council of Ontario 43
Table 6: ISCED Levels
ISCED Level Description Examples
0 Pre-primary education Junior and senior kindergarten
1 Primary education Elementary school
2 Lower secondary education Some high school
3 Upper secondary education High school
4 Postsecondary non-tertiary education Vocational programs
5 Tertiary education (first stage) Bachelor’s, master’s, first professional degree
6 Tertiary education (second stage) PhD or doctorate
The percentage of students whose parental level of education was ISCED level 5 or 6 (bachelor’s degree or higher) is presented below for each participating institution in Ontario and overall for Ontario, Australia, and all participating jurisdictions. Australia had a larger proportion of students whose father’s education is ISCED level 5 or 6 compared to the participating Ontario institutions. Figure 14: Percentage of Students Whose Parental Education is ISCED Level 5 or 6 (Bachelor’s degree or higher)
Figure 15 presents the mean assessment scores by level of parental education for Ontario and Australia. Due to small sample sizes, mean scores are not shown for ISCED level 6 for both father and mother for Australia, and mother only for Ontario. Mean scores are relatively similar across levels of parental education with the exception of Australia where students whose father had a qualification of ISCED level 3 (high school) had significantly higher scores in comparison to the other levels of education.
0%
10%
20%
30%
40%
50%
60%
70%
Inst 1 Inst 2 Inst 3 Inst 4 Inst 5 Inst 6 Inst 7 Inst 8 Canada(Ontario)
Australia AllCountries
Father education Mother education
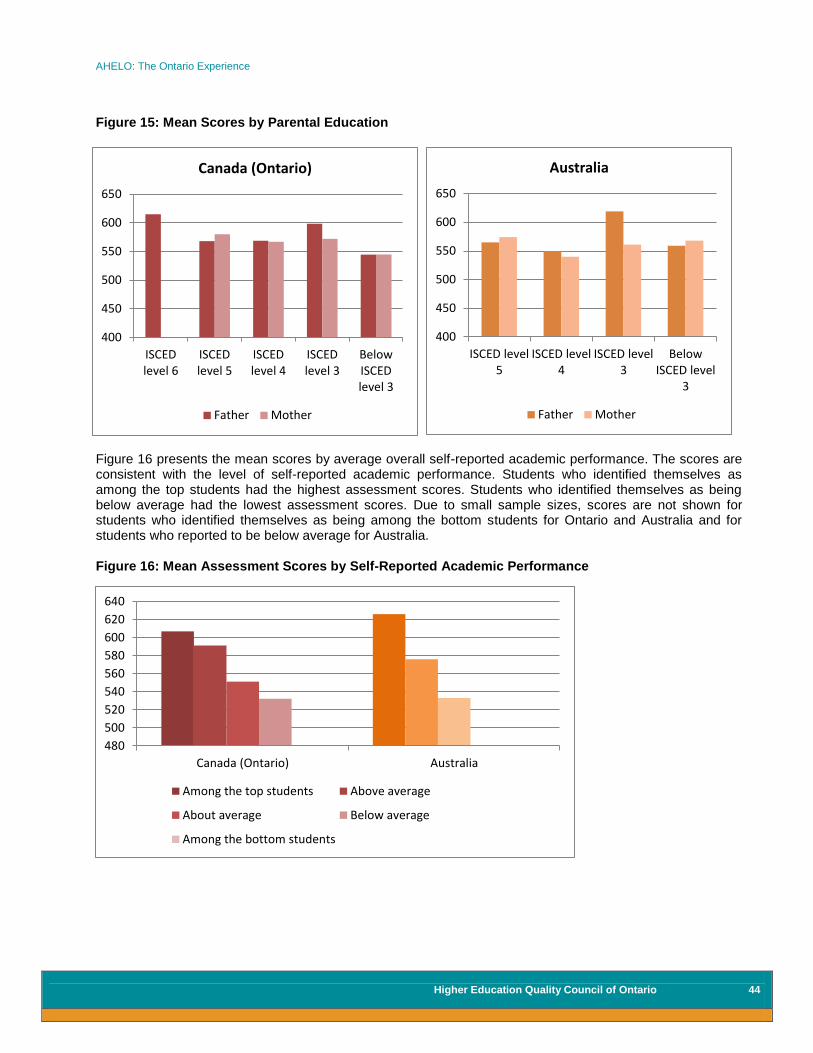
AHELO: The Ontario Experience
Higher Education Quality Council of Ontario 44
400
450
500
550
600
650
ISCEDlevel 6
ISCEDlevel 5
ISCEDlevel 4
ISCEDlevel 3
BelowISCEDlevel 3
Canada (Ontario)
Father Mother
400
450
500
550
600
650
ISCED level5
ISCED level4
ISCED level3
BelowISCED level
3
Australia
Father Mother
Figure 15: Mean Scores by Parental Education
Figure 16 presents the mean scores by average overall self-reported academic performance. The scores are consistent with the level of self-reported academic performance. Students who identified themselves as among the top students had the highest assessment scores. Students who identified themselves as being below average had the lowest assessment scores. Due to small sample sizes, scores are not shown for students who identified themselves as being among the bottom students for Ontario and Australia and for students who reported to be below average for Australia. Figure 16: Mean Assessment Scores by Self-Reported Academic Performance
480
500
520
540
560
580
600
620
640
Canada (Ontario) Australia
Among the top students Above average
About average Below average
Among the bottom students

AHELO: The Ontario Experience
Higher Education Quality Council of Ontario 45
When examining the distribution of mean scores by level of satisfaction with entire undergraduate experience, students who reported a higher level of satisfaction had higher scores on the assessment, with the exception of Australia. Students from Australia who reported a good level of satisfaction scored slightly higher than students who reported an excellent level of satisfaction. Scores for students who reported a poor level of satisfaction are not included in the Canadian and Australian total due to small sample size. Figure 17: Mean Scores by Level of Satisfaction with Entire Undergraduate Experience
In addition to demographic information, the student context questionnaire also included questions related to involvement characteristics. Figure 18 shows the percentage of students who spent over 16 hours attending class and preparing for class per week. In Ontario, around 80% of students spent over 16 hours attending class compared to 45% for Australia and 72% for all nine participating jurisdictions. Students from institution 7 reported spending the most amount of time attending formal class and the least amount of time preparing for class. Students from Ontario reported spending more time preparing for class on average relative to Australia and all nine participating jurisdictions. 45% of students from Ontario reported spending over 16 hours preparing for class, while only 9% of students in all nine participating jurisdictions reported spending over 16 hours preparing for class.
400
425
450
475
500
525
550
575
600
625
Canada (Ontario) Australia All Countries
Excellent Good Fair Poor

AHELO: The Ontario Experience
Higher Education Quality Council of Ontario 46
Figure 18: Percentage of Students Who Spent over 16 Hours Attending Formal Class and Preparing for Class
Figure 19 presents the mean scores by hours in a typical seven-day week spent attending formal classes. Scores are not shown for students who spent 1-5 hours attending formal classes due to low sample size for Ontario and Australia. Students who typically spent 16-20 hours attending formal classes had the highest assessment scores for Ontario. For Australia, students who spent between 11 to 20 hours outperformed both their peers who reported spending fewer than 10 hours and those who reported spending more than 20 hours attending class. Figure 19: Mean Scores by Hours Spent Attending Formal Classes
The majority of students in all nine participating jurisdictions spent time working in a job either related or unrelated to their main field of study. While 66% of students in Australia and in all nine participating
0%
20%
40%
60%
80%
100%
Inst 1 Inst 2 Inst 3 Inst 4 Inst 5 Inst 6 Inst 7 Inst 8 Canada(Ontario)
Australia AllCountries
Attending formal classes Preparing for class
510
520
530
540
550
560
570
580
590
Canada (Ontario) Australia
1 to 10 hours 11 to 15 hours 16 to 20 hours More than 20 hours

AHELO: The Ontario Experience
Higher Education Quality Council of Ontario 47
400
450
500
550
600
650
Canada (Ontario) Australia
Unrelated to field of study
No Yes
400
450
500
550
600
650
Canada (Ontario) Australia
Related to field of study
No Yes
jurisdictions spent time working in a paid job unrelated to their field of study, only 40% of students from Ontario worked in an unrelated job. Within Ontario, there was a higher percentage of students in institutions 2, 4 and 8 who were working at a job unrelated to their field of study. Figure 20 presents the share of students who spent time working while studying. Figure 20: Percentage of Students Who Spent Time in Paid Work
Figure 21 shows the mean assessment scores for students who spent time working in either a job related to their field of study or in a job unrelated to their field of study. There is little difference in assessment scores for students who worked in a related or unrelated job. However, students who did not work at all typically performed slightly better on the assessment, with the exception of students who worked in a job related to field of study in Australia. Figure 21: Mean Assessment Scores by Whether Students Spent Time Working in a Job
0%
10%
20%
30%
40%
50%
60%
70%
Inst 1 Inst 2 Inst 3 Inst 4 Inst 5 Inst 6 Inst 7 Inst 8 Canada(Ontario)
Australia AllCountries
Related to field of study Unrelated to field of study