52

Contents
Introduction to the most common ocean sensors in physical/biological oceanography
– Temperature
– Salinity
– Ocean Currents
– Tides
Platforms
Ocean Observing systems
Mooring logistics
Ocean Remote Sensing

Temperature
How to measure it (most common methods used in physical oceanography):
Expansion of a liquid or metal
Change in electric resistance Infrared radiation from the ocean surface
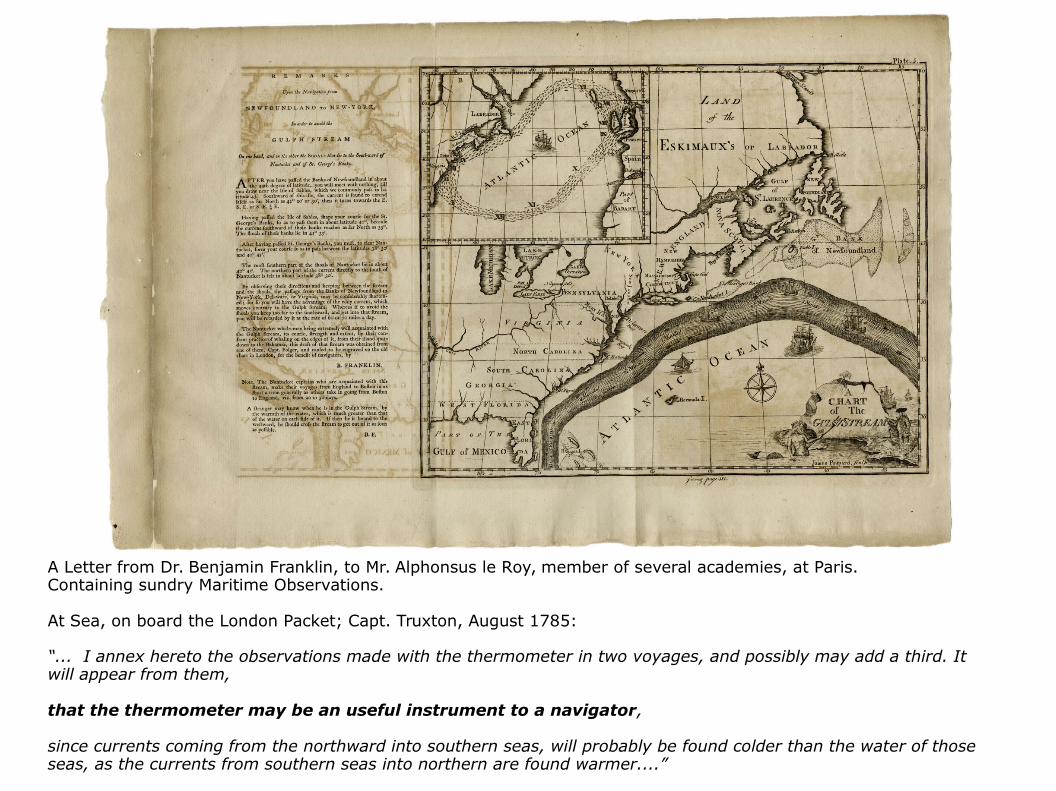
“... I annex hereto the observations made with the thermometer in two voyages, and possibly may add a third. It will appear from them,
that the thermometer may be an useful instrument to a navigator,
since currents coming from the northward into southern seas, will probably be found colder than the water of those seas, as the currents from southern seas into northern are found warmer....”
A Letter from Dr. Benjamin Franklin, to Mr. Alphonsus le Roy, member of several academies, at Paris. Containing sundry Maritime Observations.
At Sea, on board the London Packet; Capt. Truxton, August 1785:

Reversing thermometer
Widely used during 1900 – 1970
Precision: ±0.1 °C
- constriction in the mercury capillary
- the thread of mercury breaks when thermometer is turned upside down
- usually deployed in pairs (protected/unprotected against pressure)

Bathythermograph
Measures changes in T and pressure
Allows for profile records
Thin copper tube (17m) filled with toluene + mechanical stylus
Limitations and sources of errors
Depths up to ~300 m
Ship must move slowly
Permanent deformation of metal
Records written by hand
Theoretical precision ±0.06 °C
BT grid for reading recording and typical recording

XBT deployed from an aircraft
Expendable Bathythermograph (XBT)
- Change in resistance of metals provides T
- XBTs are thermistors (semi-conductors)
- Depth is determined by elapsed time (free-falling probe)
- Data transfer wire
- Depths up to 800 m
- Ship does not need to slow down
- Sensor is lost
- Accuracy ±0.1°C
Widely used since 1960s
Easily deployed from Ships of Opportunity

XBT bias problem
Depth calculated with free-fall equation:
z(t) = a t2 + b t
With:
t: time z(t): deptha, b: empirically-determined constants
Accuracy:±2% or 4.6m in depth±0.2°C in temperature
However, XBTs fall faster than specified by manufacturer:
– Weight change with depth– Denser waters at depth
Depth and temperature biases change with time, zone and manufacturer
Result: warm bias in upper ocean heat content estimates
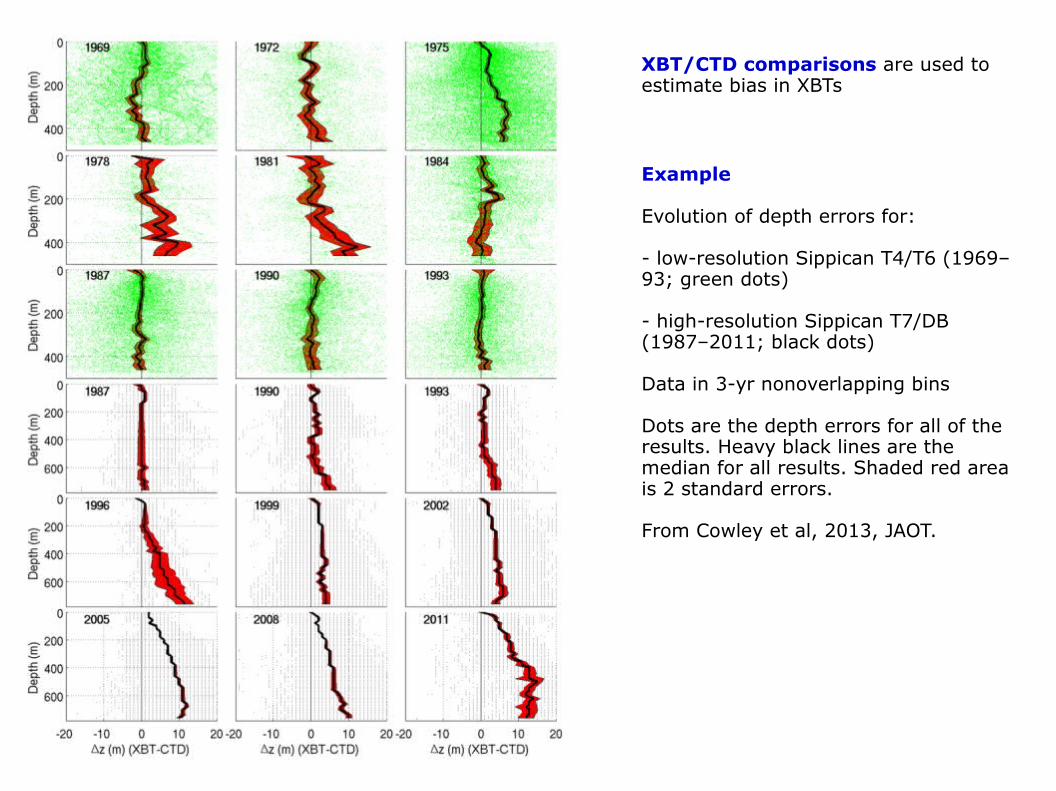
Example
Evolution of depth errors for:
- low-resolution Sippican T4/T6 (1969–93; green dots)
- high-resolution Sippican T7/DB (1987–2011; black dots)
Data in 3-yr nonoverlapping bins
Dots are the depth errors for all of the results. Heavy black lines are the median for all results. Shaded red area is 2 standard errors.
From Cowley et al, 2013, JAOT.
XBT/CTD comparisons are used to estimate bias in XBTs

XBT bias correction: some recent studies
Cowley, R., Wijffels, S., Cheng, L., Boyer, T., & Kizu, S. (2013). Biases in historical Expendable BathyThermograph data: a new view based on side-by-side comparisons. J. Atmos. Oceanic Technol., 30, 1195–1225, (2013)
Goes, M., G.J. Goni, and K. Keller (2013), Reducing Biases in XBT Measurements by Including Discrete Information from Pressure Switches. J. Atmos. Ocean. Techn., 30(4), pp.810-824, 10.1175/JTECH-D-12-00126.1
Gouretski, V. (2012), Using GEBCO digital bathymetry to infer depth biases in the XBT data, Deep Sea Research-I, 62,40-52.
Hamon, M., Reverdin, G., and Le Traon, P. Y. (2012). Empirical correction of XBT data. Journal of Atmospheric and Oceanic Technology, 29(7), 960-973.
Di Nezio, P.N., and G. Goni (2011), Direct Evidence of Changes in the XBT Fall-rate Bias During 1986-2008. J. Atmos. Ocean. Techn., 28(11), 1569-1578,doi:10.1175/JTECH-D-11-00017.1.
Good, S.A (2011), Depth biases in XBT data diagnosed using Bathymetry data ,Journal of Atmospheric and Oceanic Technology, 28, 287-300, doi: 10.1175/2010JTECHO773.
Di Nezio, P.N., and G. Goni (2010), Identifying and Estimating Biases between XBT and Argo Observations Using Satellite Altimetry. J. Atmos. Ocean. Techn., 27(1):226-240.
Gouretski, V. and F. Reseghetti (2010), On depth and temperature biases in bathythermograph data: Development of a new correction scheme based on analysis of a global ocean database. Deep-Sea Research I, Vol. 57(6), pp. 812-834, doi:10.1016/j.dsr.2010.03.011.
Ishii, M. and M. Kimoto (2009), Reevaluation of Historical Ocean Heat Content Variations With An XBT depth bias Correction. J. Oceanogr. 65, 287299, doi:10.1007/s10872-009-0027-7.
Levitus, S., Antonov, J. I., Boyer, T. P., Locarnini, R. A., Garcia, H. E., and Mishonov, A. V. (2009). Global ocean heat content 1955–2008 in light of recently revealed instrumentation problems. Geophysical Research Letters, 36(7).
Wijffels, Susan E., Josh Willis, Catia M. Domingues, Paul Barker, Neil J. White, Ann Gronell, Ken Ridgway, John A. Church (2008), Changing Expendable Bathythermograph Fall Rates and Their Impact on Estimates of Thermosteric Sea Level Rise. J. Climate, 21, 56575672. doi: http://dx.doi.org/10.1175/2008JCLI2290.
Gouretski, V. V., and K. P. Koltermann (2007), How much is the ocean really warming? Geophysical Research Letters, L01610, doi:10.1029/2006GL027834.
See more at http://www.nodc.noaa.gov/OC5/XBT_BIAS/xbt_bibliography.html

Thermistor chains
- Similar sensor to XBTs
- For fixed-point moorings or strings
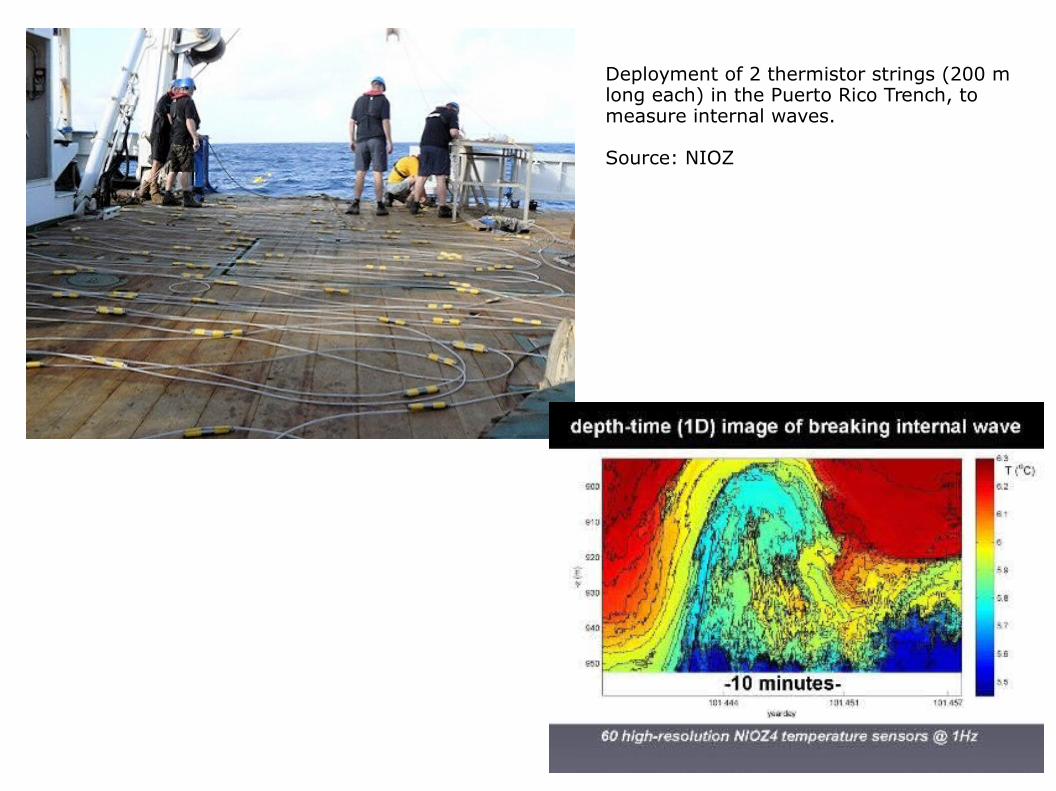
Deployment of 2 thermistor strings (200 m long each) in the Puerto Rico Trench, to measure internal waves.
Source: NIOZ

Conductivity-temperature-depth profiler (CTD)
Measures:Electrical resistance of platinum Temperature→Pressure Depth→Conductivity Salinity→
Can be attached to a variety of platformsLightweightCan be lowered up to several thousand meters
The ship needs to stop to launch a CTDCalibration needed

Response time of the CTD sensors
Typically (for a fall rate of 1 m/s):
Platinum thermometer: 250 msConductivity cell: 25 ms
Result: spikes in density estimated from T and S
Some CTDs include also a thermistor to provide accurate and fast measures by combining both

World Ocean Database: most used sensor types for temperature measurements

APB Autonomous Pinniped Bathythermograph dataCTD High resolution CTD dataDRB Drifting buoy dataGLD Glider dataMBT mechanical bathythermographMRB Moored buoy dataOSD Bottle, low resolution CTDPFL Profiling float dataUOR Undulating Oceanographic Recorder data XBT Expendable bathythermograph data
WOD data: detail
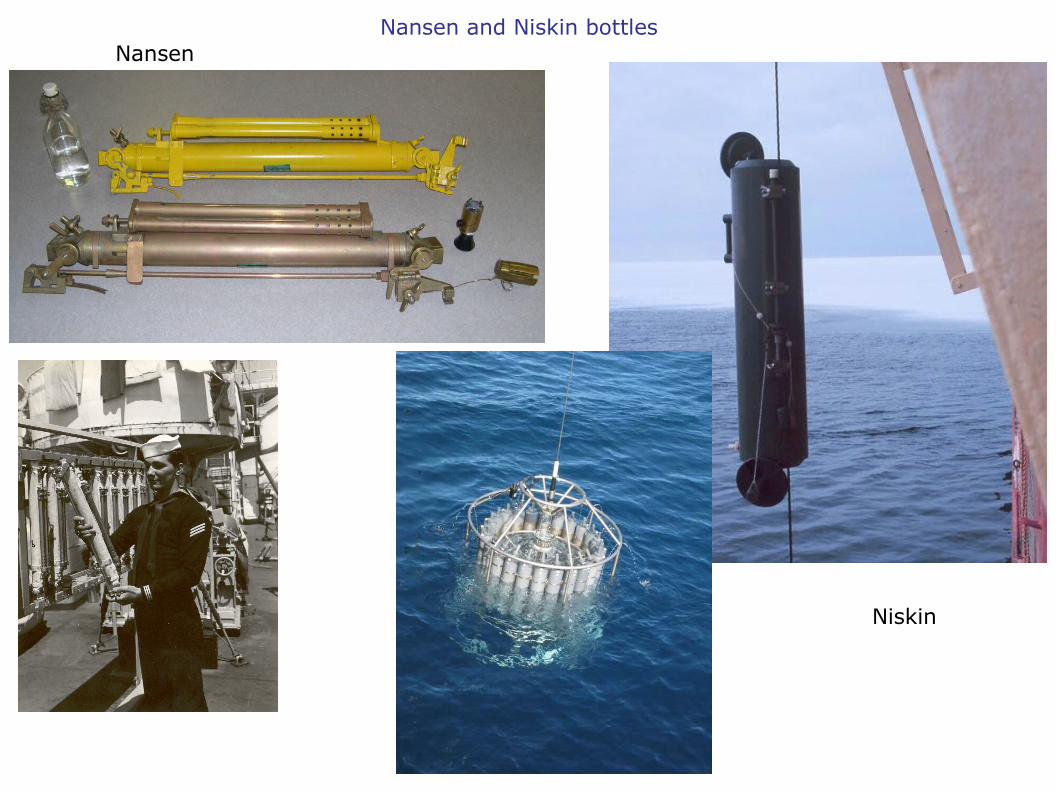
Nansen and Niskin bottlesNansen
Niskin

Argo Profilers
Autonomous profilers that measure in the first 2000m of the water column.
First proposed at OceanObs99 conference: development of an international ocean observing array
Goal: at least 3000 profilers actively measuring (one float per 3º x 3º global grid)(~50% US) about 800 new profilers each year→
More maps at:
http://w3.jcommops.org/cgi-bin/WebObjects/Argo.woa/wa/mapshttp://www.argo.ucsd.edu/
Most common measures: T and S (and currents), also bio-profilers
For open ocean monitoring

How Argo profilers work
http://www.argo.ucsd.edu/
Argo floats rise and descend by changing its density
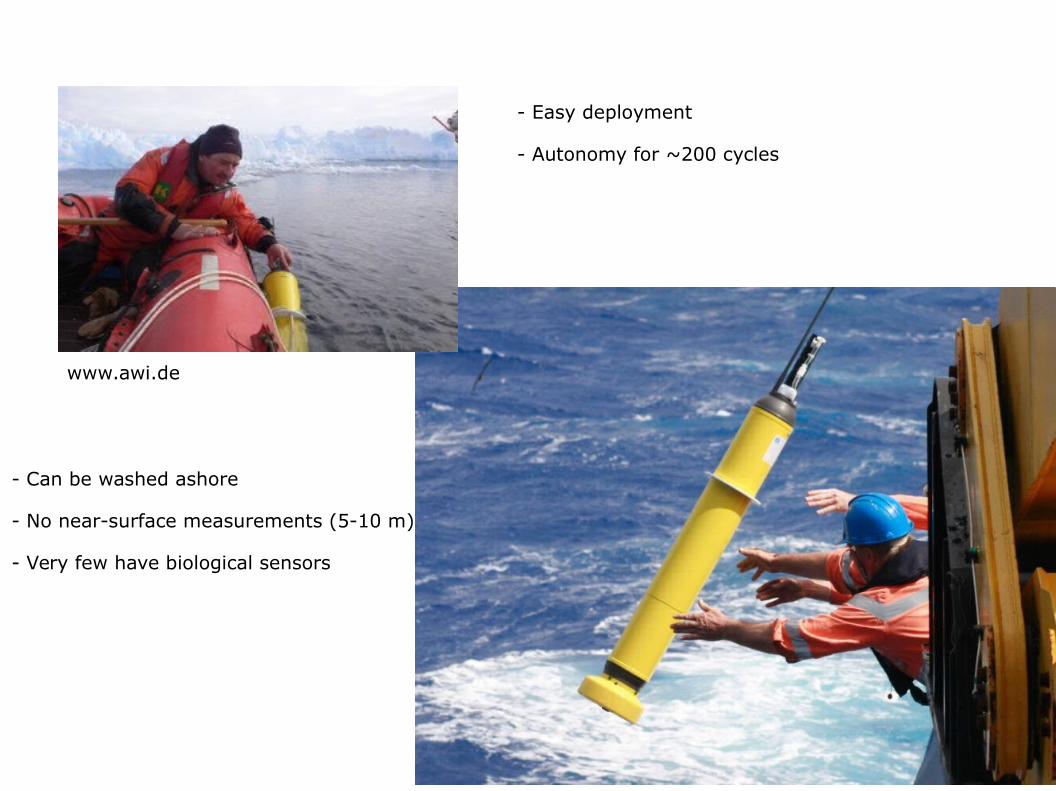
www.awi.de
- Easy deployment
- Autonomy for ~200 cycles
- Can be washed ashore
- No near-surface measurements (5-10 m)
- Very few have biological sensors

Gliders
www.whoi.edu
Autonomous underwater vehicle (AUV)
Changes in buoyancy + wings vertical + horizontal motion→
Pre-defined trajectories
Measures T, S, depth [currents, chlorophyll]
http://www.economist.com
- Speeds of ~0.25 m/s
- Very cost efficient

Example of glider data, from www.socib.es

A transatlantic challenge
April 2009
Scarlet Knight glider (Rutgers University)
Atlantic Ocean crossing with 1 battery charge
221 days at sea, 7400 km
22000 climbs and dives (~300m each)

Measure of salinity
First definition of salinity:
“The total amount of solid material in grams contained in one kilogram of seawater when all the carbonate has been converted to oxide, all the bromine and iodine replaced by chlorine and all the organic material oxidized” Forch et al, 1902.
Approach non practical for modern oceanography
In ~1950s: measurement of electrical conductivity (related to ion content of water, directly proportional to salt content) of seawater become standard
Conductivity measures also refer to an empirical definition of salinity, the practical salinity scale, which establishes the salinity with respect to a standard water of salinity 35.
Salinity does not have units.

Measuring ocean currents
Current meter
1. Eulerian currents
Currents measured at a fixed point in the ocean
Direction and speed
Mechanical current meters like here →
Major problem: moving parts, subject to malfunction

ADCP
Non-mechanical current meters →
Acoustic Doppler Current profiler
Transmission of high frequency sound waves
+ determination of Doppler frequency shift of the return signal
Reflectors: “ clouds” of planktonic organisms, changes in density...
ADCP provide measures of flow over several depth-averaged bins
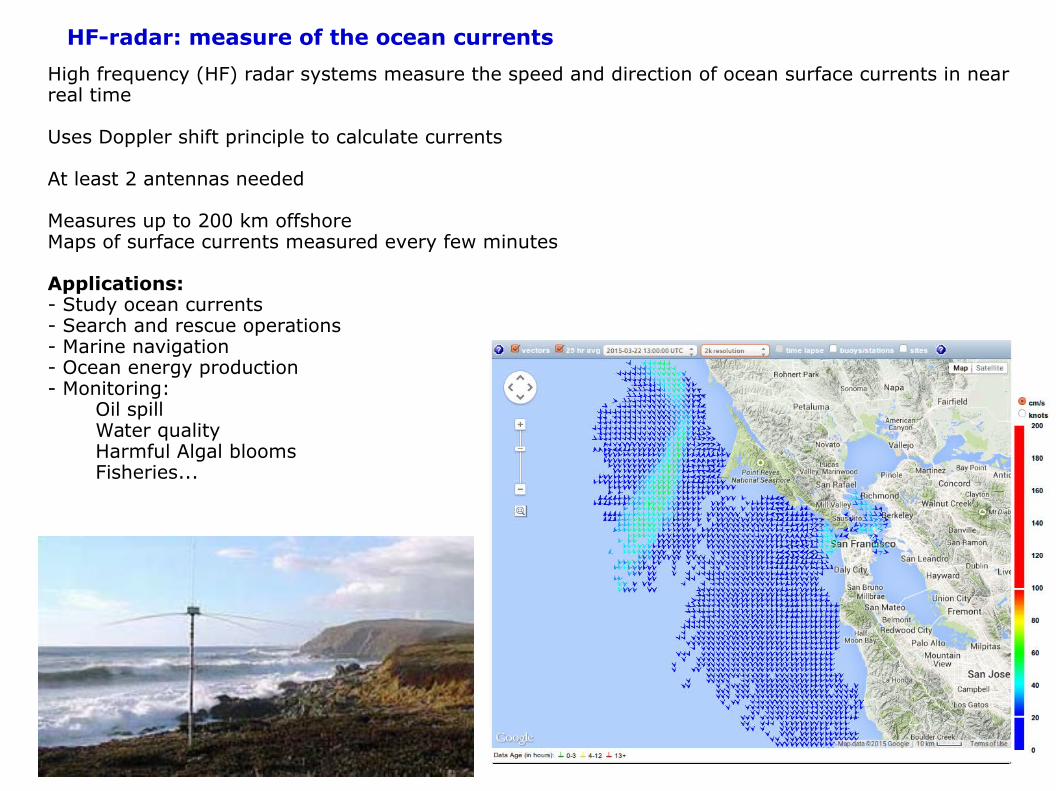
HF-radar: measure of the ocean currents
High frequency (HF) radar systems measure the speed and direction of ocean surface currents in near real time
Uses Doppler shift principle to calculate currents
At least 2 antennas needed
Measures up to 200 km offshoreMaps of surface currents measured every few minutes
Applications:- Study ocean currents- Search and rescue operations- Marine navigation- Ocean energy production- Monitoring:
Oil spillWater qualityHarmful Algal bloomsFisheries...

2. Lagrangian currents
Measuring ocean currents
Following a parcel of fluid as it moves
“Surface drifter”: satellite tracked, with specific size and subsurface drogue
Speed of drifter determined by 15-m surface currents, + wind currents
Problems: rogue can fall off

Global Drifter Program

Measuring tides
Older tidal measuring stationsMechanical floats and recorders →
New generation of monitoring stations:advanced acoustics and electronics.
Audio signal sent down a 12 mm wide sounding tubeTime it takes for the reflected signal to travel back from the water's surface.
Data is directly transmitted to headquarters
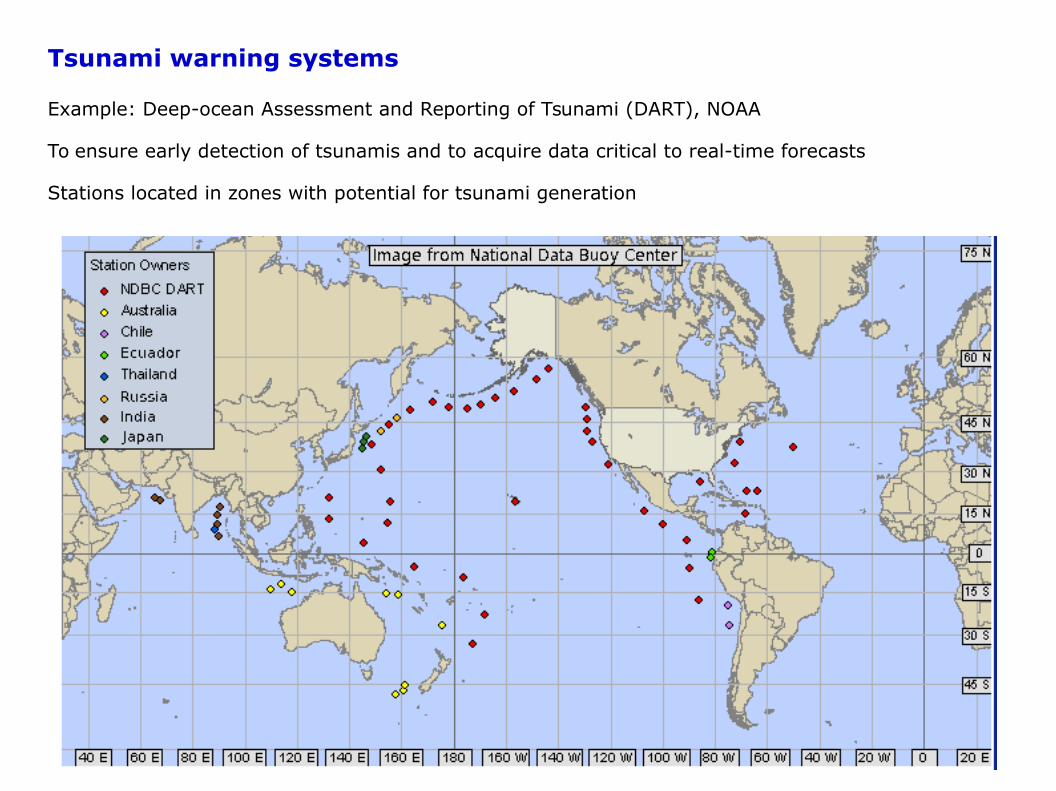
Tsunami warning systems
Example: Deep-ocean Assessment and Reporting of Tsunami (DART), NOAA
To ensure early detection of tsunamis and to acquire data critical to real-time forecasts
Stations located in zones with potential for tsunami generation

How do they work?
- An anchored seafloor bottom pressure recorder (BPR)
- A companion moored surface buoy for real-time communications (acoustic link)
- Temperature and pressure at 15-second intervals sea surface height→
- Two way communication between buoy and tsunami warning center: buoys can be set up in “event” mode preventively

Mooring logistics
Mooring type depending of depth, instrument load
Battery life
Zone of deployment: mean currents, marine traffic, ice presence...
Fishing activity
Vandalism, theft (subsurface mooring less prone to it)
Bio-fouling
Acoustic release of moorings: remotely-controlled linkage connecting the anchor (weight) to the recoverable parts (instruments/sensors)

Observing systems
Concerted efforts to perform a multivariate, multi-platform observation of the ocean
Examples:
http://www.cencoos.org/data
http://hfradar.ndbc.noaa.gov/
http://www.socib.eu/
http://www.argo.ucsd.edu/

Satellite measures
Satellites allow to measure the surface of the Earth with an unprecedented frequency and resolution
Many oceanic variables are measured from satellite:
Temperature, colour-related variables (chlorophyll-a, turbidity, total suspended matter...), sea level height, sea ice, winds, salinity...
Since ~1980 (temperature)
Gulf Stream viewed by MODIS

Satellite measures1) Sea Surface Temperature, SST
Passive measure of the thermal radiation form the ocean surface: the ocean and most other objects emit radiation in the infrared and the microwave wavelengths.
The amplitude of these wavelengths vary with the temperature of the ocean and therefore can be used to measure it.
Measure of the ocean surface SST (skin temperature):
Infrared radiation of the ocean comes from the top 10 microns of the surface.
Microwave radiation results from the topmost 1-millimeter layer.
(attention must be given when comparing SST from satellite and in situ sources!)
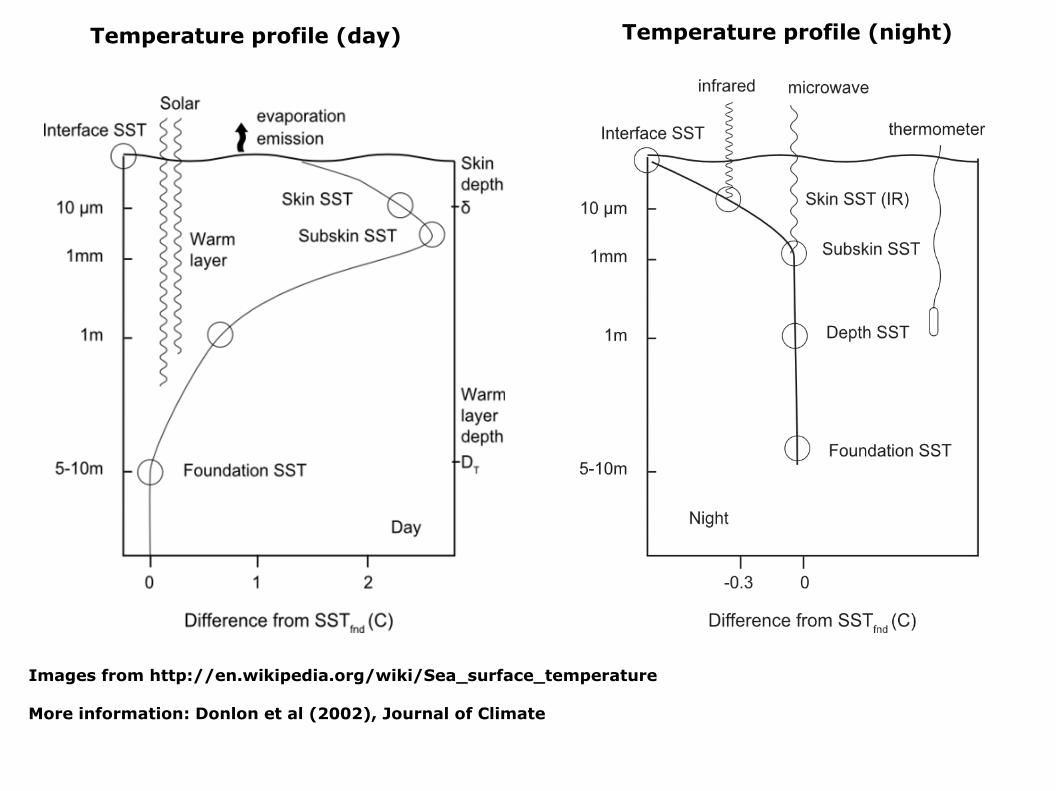
Temperature profile (day) Temperature profile (night)
Images from http://en.wikipedia.org/wiki/Sea_surface_temperature
More information: Donlon et al (2002), Journal of Climate
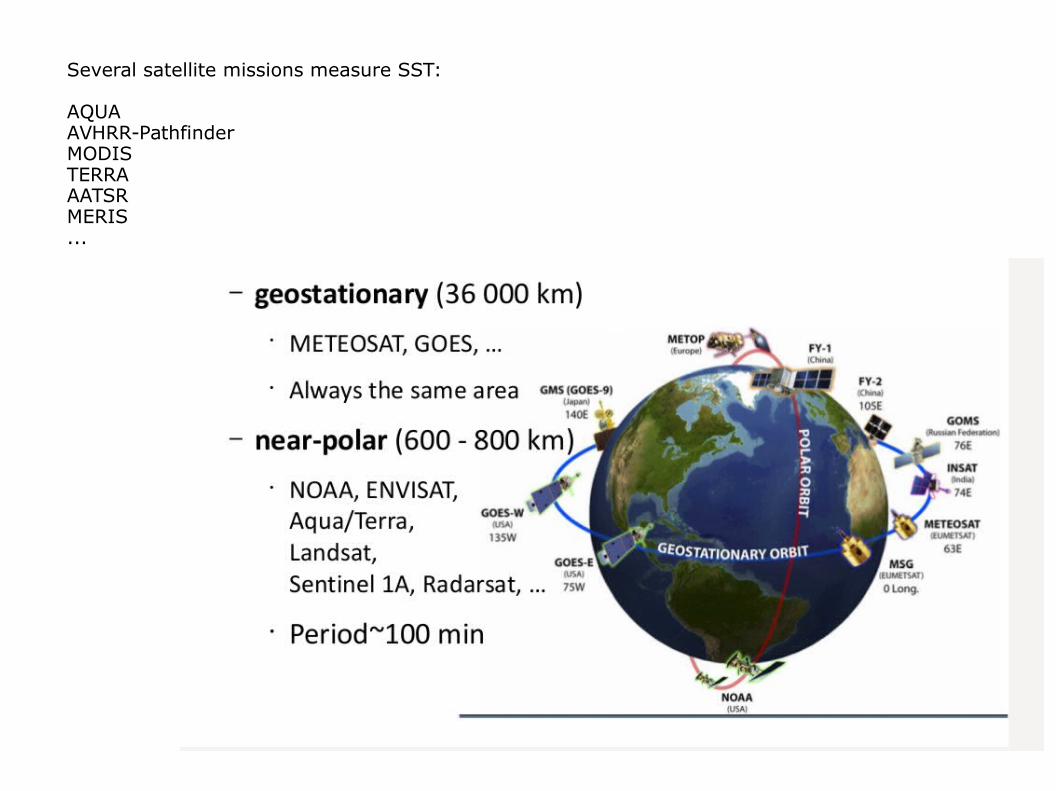
Several satellite missions measure SST:
AQUAAVHRR-PathfinderMODISTERRAAATSRMERIS...
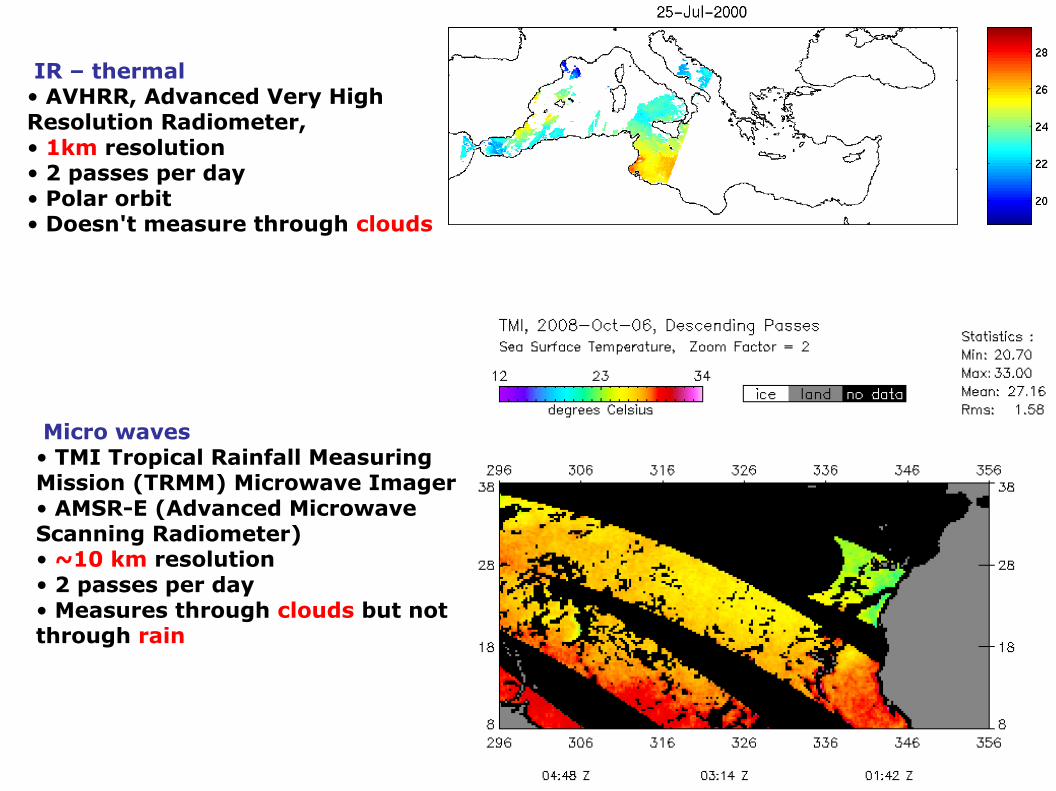
IR – thermal• AVHRR, Advanced Very High Resolution Radiometer,• 1km resolution• 2 passes per day• Polar orbit• Doesn't measure through clouds
Micro waves• TMI Tropical Rainfall Measuring Mission (TRMM) Microwave Imager • AMSR-E (Advanced Microwave Scanning Radiometer)• ~10 km resolution• 2 passes per day• Measures through clouds but not through rain

Ascending pass (daytime)
Descending pass (nighttime)
TMI latitudinal limit
40˚N-S

TMI vs. AMSR-E
Sun-synchronous (measures taken at the same time of the day every day)
Non sun synchronous
-Min Temperature: 15 ˚C
Angle 55˚Angle 35˚: 40˚N-S
near-polar orbitsemi-equatorial orbit
All TMI/AMSR-E figures from http://www.remss.com
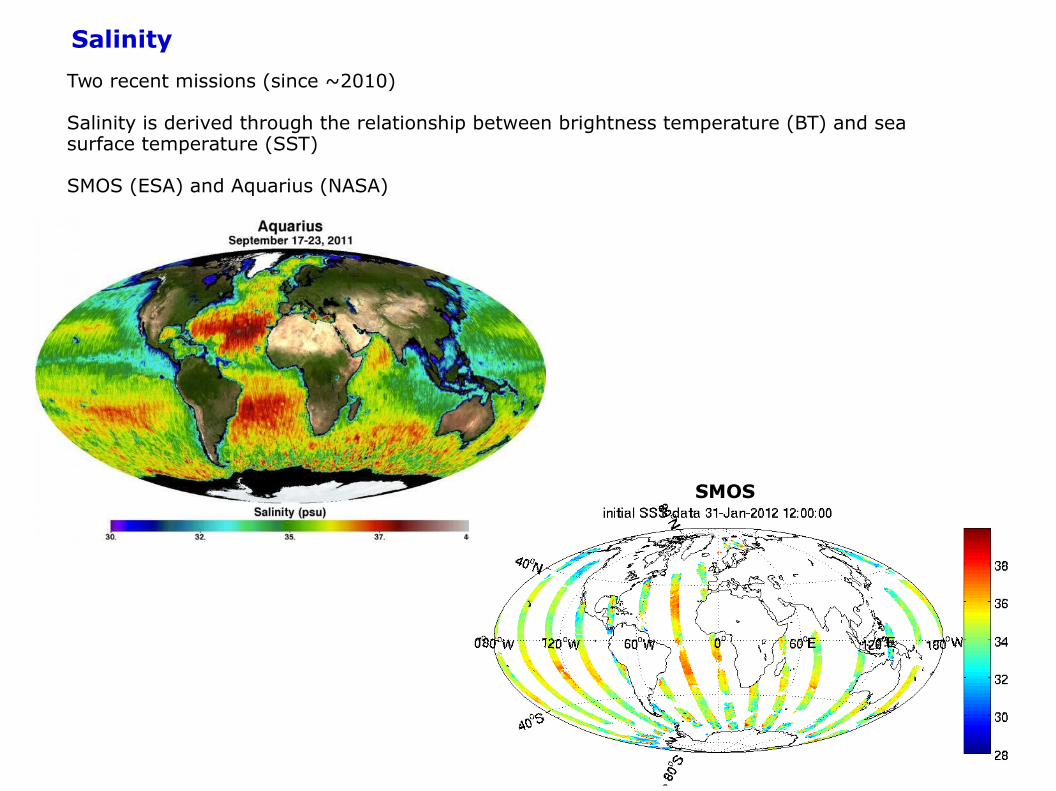
Salinity
Two recent missions (since ~2010)
Salinity is derived through the relationship between brightness temperature (BT) and sea surface temperature (SST)
SMOS (ESA) and Aquarius (NASA)
SMOS

• Sea ice (concentration, extent)
Images from http://nsidc.org/data/seaice_index/
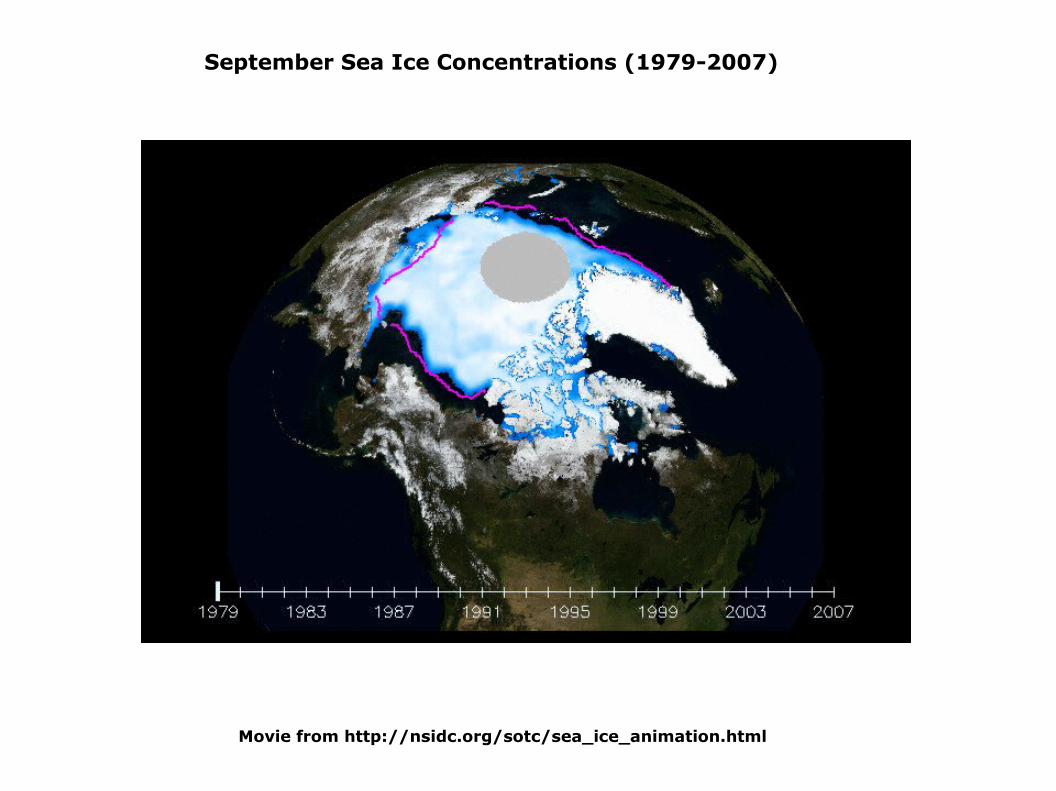
Movie from http://nsidc.org/sotc/sea_ice_animation.html
September Sea Ice Concentrations (1979-2007)

2) Chlorophylle, Total Suspended Matter, k-490, CDOM...
• Mesure dans le visible et proche-IR
• Mesure des premières mètres de la surface de l’océan
• Plusieurs variables sont dérivées des mesures su visible-proche IR
Concentration de chlorophyll-a
K-490

3) Mesures par radar (senseurs actives par micro-ondes)
Pictures from Robinson (2004)

AMSR-E wind in polar regions (movie)
• Vents (direction et vitesse)• Scattometer (diffusomètre)
• Senseur actif
• Multiples vues pour calculer le vents, à partir de la rugosité de la surface de la mer
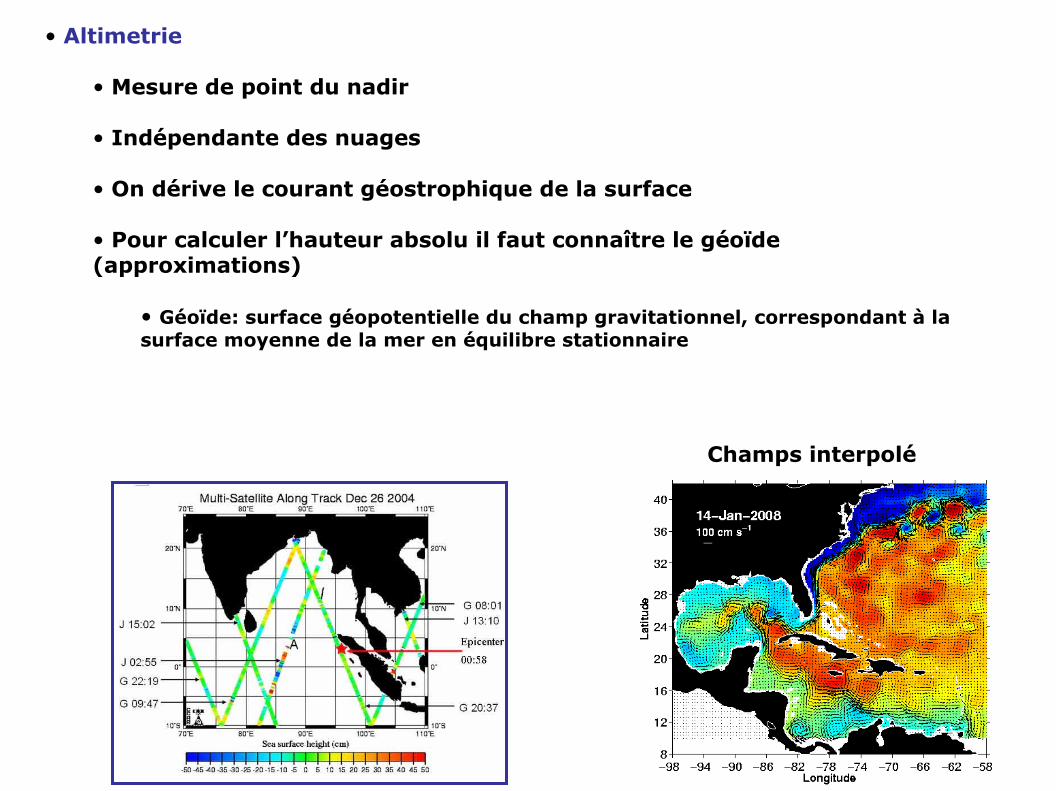
• Altimetrie
• Mesure de point du nadir
• Indépendante des nuages
• On dérive le courant géostrophique de la surface
• Pour calculer l’hauteur absolu il faut connaître le géoïde (approximations)
• Géoïde: surface géopotentielle du champ gravitationnel, correspondant à la surface moyenne de la mer en équilibre stationnaire
Champs interpolé

Ondes internes
• Synthetic Aperture Radar (SAR)
• Mésure de la rugosité de la surface de la mer à petite échelle (i.e. quelques dizaines de mètres
Wilkins Ice Shelf hanging by its last thread (lien)(Envisat’s Advanced Synthetic Aperture Radar, ASAR)
Lien Envisat
Lien images ESA

Red Sea between Egypt and Saudi Arabia (lien)True-color Terra MODIS image acquired on July 26, 2003.
Encore des ondes internes…


