Aiding Compliance Governance in Service-Based Business Processes Patrícia Silveira, Carlos Rodríguez, Aliaksandr Birukou, Fabio Casati, Florian Daniel, Vincenzo D’Andrea University of Trento, Italy Claire Worledge Deloitte Conseil, Paris, France Zouhair Taheri PricewaterhouseCoopers Accountants, Rotterdam, Netherlands ABSTRACT Assessing whether a company’s business practices conform to laws and regulations and follow standards and SLAs, i.e., compliance management, is a complex and costly task. Few software tools aiding compli- ance management exist; yet, they typically do not address the needs of who is actually in charge of assess- ing and understanding compliance. We advocate the use of a compliance governance dashboard and suit- able root cause analysis techniques that are specifically tailored to the needs of compliance experts and auditors. The design and implementation of these instruments are challenging for at least three reasons: (i) it is fundamental to identify the right level of abstraction for the information to be shown; (ii) it is not trivial to visualize different analysis perspectives; and (iii) it is difficult to manage and analyze the large amount of involved concepts, instruments, and data. This chapter shows how to address these issues, which concepts and models underlie the problem, and, eventually, how IT can effectively support compli- ance analysis in Service-Oriented Architectures (SOAs). INTRODUCTION Compliance generally refers to the conformance to a set of laws, regulations, policies, best practices, or service-level agreements. Compliance governance refers to the set of procedures, methodologies, and technologies put in place by a corporation to carry out, monitor, and manage compliance. Compliance governance is an important, expensive, and complex problem to deal with: It is important because there is increasing regulatory pressure on companies to meet a variety of poli- cies and laws (e.g., Basel II, MiFID, SOX). This increase has been to a large extent fueled by high-profile bankruptcy cases (Parmalat, Enron, WorldCom, the recent crisis) or safety mishaps (the April 2009 earth- quake in Italy has already led to stricter rules and certification procedures for buildings and construction companies). Failing to meet these regulations means safety risks, hefty penalties, loss of reputation, or even bankruptcy (Trent 2008). Managing and auditing/certifying compliance is a very expensive endeavor. A report by AMR Re- search (Hagerty et al. 2008) estimated that companies would have spent US$32B only on governance, compliance, and risk in 2008 and more than US$33B in 2009. Audits are themselves expensive and inva- sive activities, costly not only in terms of auditors’ salaries but also in terms of internal costs for prepar- ing for and assisting the audit – not to mention the cost of non-compliance in terms of penalties and repu- tation.
Transcript
Aiding Compliance Governance in Service-Based Business Processes
Patrícia Silveira, Carlos Rodríguez, Aliaksandr Birukou, Fabio Casati, Florian Daniel, Vincenzo D’Andrea University of Trento, Italy Claire Worledge Deloitte Conseil, Paris, France Zouhair Taheri PricewaterhouseCoopers Accountants, Rotterdam, Netherlands ABSTRACT Assessing whether a company’s business practices conform to laws and regulations and follow standards and SLAs, i.e., compliance management, is a complex and costly task. Few software tools aiding compli-ance management exist; yet, they typically do not address the needs of who is actually in charge of assess-ing and understanding compliance. We advocate the use of a compliance governance dashboard and suit-able root cause analysis techniques that are specifically tailored to the needs of compliance experts and auditors. The design and implementation of these instruments are challenging for at least three reasons: (i) it is fundamental to identify the right level of abstraction for the information to be shown; (ii) it is not trivial to visualize different analysis perspectives; and (iii) it is difficult to manage and analyze the large amount of involved concepts, instruments, and data. This chapter shows how to address these issues, which concepts and models underlie the problem, and, eventually, how IT can effectively support compli-ance analysis in Service-Oriented Architectures (SOAs). INTRODUCTION Compliance generally refers to the conformance to a set of laws, regulations, policies, best practices, or service-level agreements. Compliance governance refers to the set of procedures, methodologies, and technologies put in place by a corporation to carry out, monitor, and manage compliance. Compliance governance is an important, expensive, and complex problem to deal with:
It is important because there is increasing regulatory pressure on companies to meet a variety of poli-cies and laws (e.g., Basel II, MiFID, SOX). This increase has been to a large extent fueled by high-profile bankruptcy cases (Parmalat, Enron, WorldCom, the recent crisis) or safety mishaps (the April 2009 earth-quake in Italy has already led to stricter rules and certification procedures for buildings and construction companies). Failing to meet these regulations means safety risks, hefty penalties, loss of reputation, or even bankruptcy (Trent 2008).
Managing and auditing/certifying compliance is a very expensive endeavor. A report by AMR Re-search (Hagerty et al. 2008) estimated that companies would have spent US$32B only on governance, compliance, and risk in 2008 and more than US$33B in 2009. Audits are themselves expensive and inva-sive activities, costly not only in terms of auditors’ salaries but also in terms of internal costs for prepar-ing for and assisting the audit – not to mention the cost of non-compliance in terms of penalties and repu-tation.
2
Finally, the problem is complex because each corporation has to face a large set of compliance re-quirements in the various business segments, from how internal IT is managed to how personnel is trained, how product safety is ensured, or how (and how promptly) information is communicated to shareholders. Furthermore, rules are sometimes vague and informally specified. As a result, compliance governance requires understanding/interpreting requirements and implementing and managing a large number of control actions on a variety of procedures across the business units of a company. Each com-pliance regulation and procedure may require its own control mechanism and its own set of indicators to assess the compliance status of the procedure (Bellamy et al. 2007).
If we look at how every-day business is being conducted at an operative level, we note that technolo-gies like web services and business process management systems have largely proved their viability for organizing work and assisting and orchestrating also human actors involved in business processes. The adoption of the so-called service-oriented architecture (SOA) to conduct business (eased by technologies such as SOAP, WSDL, and HTTP) has further affirmed the analogy between web service technologies and common business practices, turning the traditional, heavyweight and monolithic software approach into flexible and reconfigurable service ecosystems. One of the advantages of this kind of ecosystem is that they suddenly allow one to obtain fine-grained insights into runtime aspects, e.g., message ex-changes, events, and process progress states, which can only hardly be accessed in traditional legacy sys-tems. As we will see in this chapter, in our work we specifically leverage on this potential in order to check compliance of service-based business processes.
Interestingly, despite these novel opportunities, compliance is to a large extent still managed by the various business units in rather ad-hoc ways (each unit, line of business, or even each business process has its own methodology, policy, controls, and technology for managing compliance) and without lever-aging on the new transparency of electronic business (Sloane et al. 2006). As a result, nowadays it is very hard for any CFO or CIO to answer questions such as: Which rules does my company have to comply with? Which processes should obey which rules? Which processes are following regulations? Where do violations occur? Which processes do we have under control? (Cannon and Byers 2006). Even more, it is hard to do so from a perspective that not only satisfies the company but also the company’s auditors, which is crucial as the auditors are the ones that certify compliance.
In light of these challenges, in this chapter we provide the following contributions: − We provide a conceptual model for compliance and for compliance governance dashboards that
covers a broad class of compliance issues. We identify the key abstractions and their relationships that are necessary to establish the dashboard’s role of single entry point for compliance assessment.
− We define a user interaction and navigation model that captures the way the different kinds of us-ers can interact with the dashboard, to minimize the time to access the information users need and to make sure that key problems do not remain unnoticed.
− We show how reporting on compliance can be complemented with a simple but effective instru-ment for the identification of root causes of compliance violations. While the up-to-date awareness of the compliance state of a company is useful to take operative decisions on how to deal with non-compliance, root cause analysis is important to understand how to improve current practices for the future.
− We combine the above broadness with simplicity and effectiveness. The challenge here is to derive models and interaction paradigms that, despite being broad, remain simple and useful/usable. If the abstractions are not carefully crafted and kept to a minimum, the dashboard and analyses will be too complex and remain unused.
− We derive a suite of solutions that are in line with the criteria and approach that auditors have to verify compliance. In this chapter, this last contribution is achieved “by design”, in that the model is derived also via a joint effort of two of the major auditing companies and reflects the desired method of understanding of and navigation among the various compliance concerns.
− We describe the implementation of our prototype tools and describe some concrete examples of how such have been applied in the context of our research.
3
Next, we describe a real-world scenario that highlights the need for compliance governance and root cause analysis in the context of healthcare. Then, we abstract the requirements deriving from the scenario into a set of conceptual models, describe the design of our Compliance Governance Dashboard (CGD), and show how the collected data can also be used for root cause analysis. We describe the implementation of our prototype system, discuss related works, and, finally, conclude the chapter, also providing some hints about our future research directions. SCENARIO Let us consider the case of a drug reimbursement process in the healthcare domain. The process is the case study in one of our European Union projects, where we cooperate with Hospital San Raffaele (Milan, Italy), which runs the process shown in Figure 1. The overall purpose of this process, from the hospital’s point of view, is to obtain reimbursements from the Italian Health Authority for the drugs dispensed to outpatients (i.e., patients that are not hospitalized). In order to obtain the reimbursement, there are many compliance requirements imposed by the Health Authority, among which we mention privacy preserva-tion in personal information processing, separation of duties, and the adherence of standard template of dispensation reports.
The core process that generates the information that needs to be sent to the Health Authority occurs in-side the Ward. The process starts when a patient visits the hospital’s ward to consult a doctor. After diag-nosing the patient, the doctor prepares a drug prescription that is delivered to a nurse, who is in charge of dispensing the prescribed drugs to the patient. If the amount of drugs is going below a certain threshold, the nurse issues a drug request to the central pharmacy of the hospital, which must replenish the ward’s drug stock in no later than 48 hours. The execution of this process is fully supported by the ward’s SOA-based information system, and all progress events generated during process executions are recorded in an event log for later inspection.
Figure 1 Summary of the direct drug reimbursement process.
While the process above is executed daily, the preparation of the FileF records for drug reimbursement is a monthly task. That is, at the end of each month, the Dispensation records (extracted from a database of dispensations) are collected from the various wards of the hospital and the corresponding FileF records to be sent to the Regional Healthcare Authority are created. The Accounting Office is the responsible for starting this process and creating the FileF records. These reports consist in simple text files (known as
4
FileF) in which data about the dispensations are included. Examples of data included in these files are hospital identification, patient, doctor, dispensed drug and quantity, and amount in Euros. Whenever the report is ready, it is sent to the Regional Healthcare Authority, which checks the quality of the report against some compliance requirements imposed on dispensation reports. For instance, one compliance requirement that decides whether a dispensation can be reimbursed or not regards the completeness and correctness of records: no null or incorrect data are tolerated in any field. If there are such problems in the report, the Regional Healthcare Authority sends a feedback to the hospital indicating the number and type of errors found for each record of the file, and, in turn, the hospital must correct them so as to get the re-imbursement. This is the last chance the hospital has to receive the reimbursement, if the data is not cor-rect that time the money will not be re-passed to the hospital by the Ministry of Health.
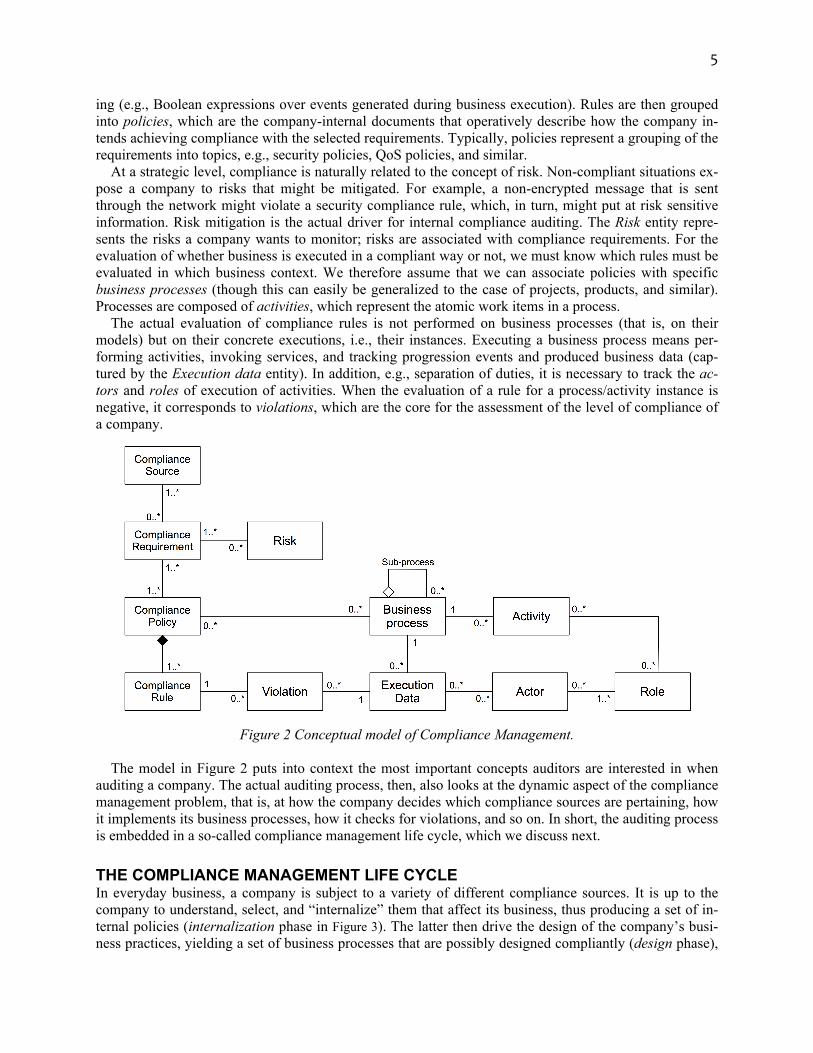
The complete reimbursement process is complex, and not complying with the above requirements can be costly. Therefore, in order to better control the compliance of the reimbursement process, the hospital wants to implement an early warning system that allows the hospital’s compliance expert to have updated information on daily compliance issues, e.g., in form of indicators, reports, or predictions on the compli-ance of its processes. In addition, in case of repeated problems, it is important to understand why they happen and how they can be solved for the future. However, manually analyzing the data in the event log is time consuming and also error-prone but, still, the hospital wants to improve its compliance in order not to lose money for not reimbursed drug dispensations. THE PROBLEM OF COMPLIANCE MANAGEMENT To characterize the compliance management problem intuitively introduced above, we now generalize the problem in terms of two models of its most important concepts, their relationships, and the dynamics that describe their adoption in practice. Concepts and Terminology Despite the increasing awareness of compliance issues in companies and the recognition that part of the compliance auditing task can be easily automated, i.e., assisted by means of software tools ((Evans and Benton 2007), (Sloane 2006) and (Trent 2008)), there is still a lot of confusion around (e.g., lack of dedi-cated tools to monitor compliance, unclear natural language compliance rules that need to be transformed in lines of code to check compliance, among others). This is especially true for the IT community, which would actually be in charge of aiding compliance governance with dedicated software. To help thinking in terms of auditing, in the following we aim to abstract a wide class of compliance problems into a few key concepts that are also the ones understood by auditors. The resulting model does not cover all possi-ble compliance problems, but our goal is to strike a balance between coverage and simplicity. The model is illustrated in Figure 2.
We read the model from the top-left corner: The Compliance Source entity generalizes all those docu-ments that regulate or provide guidelines for the correct or good conduct of business in a given business domain. Common examples of compliance sources are legislations (e.g., MiFID, The Electronic Com-merce Directive), laws (e.g., SOX, HIPAA), standards (e.g., CMMI, CoBIT, ISO-9001), and contracts or SLAs. Typically, a compliance source defines a set of rules or principles in natural language, which con-strain or guide the way business should be conducted. Complying with a source means satisfying its rules and principles. Yet, a company might be affected by only some of the rules or principles stated in a given source. The selection of the pertaining ones represents the requirements for compliance management, commonly expressed in terms of control objectives and control activities. A regulation expresses multiple requirements, and a requirement might relate to one or more compliance sources.
Assessing compliance demands for an interpretation and translation of the requirements provided in natural language in an actionable rule description (especially in the case of principle-based regulations) (Giblin et al. 2006), (Namir & Stojanovic, 2007). This is modeled by the Compliance Rule entity, which represents actionable rules expressed either in natural language (using the company’s terminology and telling exactly how to perform work) or, as desirable in a formalism that facilitates its automated process-
5
ing (e.g., Boolean expressions over events generated during business execution). Rules are then grouped into policies, which are the company-internal documents that operatively describe how the company in-tends achieving compliance with the selected requirements. Typically, policies represent a grouping of the requirements into topics, e.g., security policies, QoS policies, and similar.
At a strategic level, compliance is naturally related to the concept of risk. Non-compliant situations ex-pose a company to risks that might be mitigated. For example, a non-encrypted message that is sent through the network might violate a security compliance rule, which, in turn, might put at risk sensitive information. Risk mitigation is the actual driver for internal compliance auditing. The Risk entity repre-sents the risks a company wants to monitor; risks are associated with compliance requirements. For the evaluation of whether business is executed in a compliant way or not, we must know which rules must be evaluated in which business context. We therefore assume that we can associate policies with specific business processes (though this can easily be generalized to the case of projects, products, and similar). Processes are composed of activities, which represent the atomic work items in a process.
The actual evaluation of compliance rules is not performed on business processes (that is, on their models) but on their concrete executions, i.e., their instances. Executing a business process means per-forming activities, invoking services, and tracking progression events and produced business data (cap-tured by the Execution data entity). In addition, e.g., separation of duties, it is necessary to track the ac-tors and roles of execution of activities. When the evaluation of a rule for a process/activity instance is negative, it corresponds to violations, which are the core for the assessment of the level of compliance of a company.
Figure 2 Conceptual model of Compliance Management.
The model in Figure 2 puts into context the most important concepts auditors are interested in when
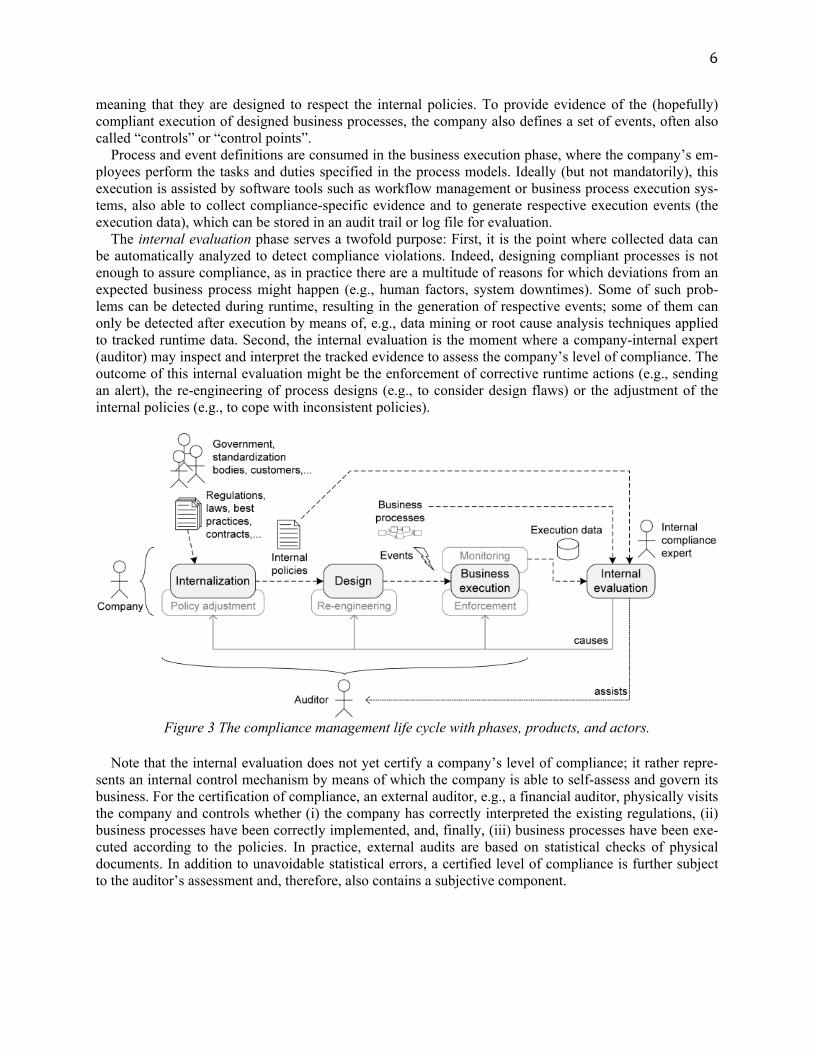
auditing a company. The actual auditing process, then, also looks at the dynamic aspect of the compliance management problem, that is, at how the company decides which compliance sources are pertaining, how it implements its business processes, how it checks for violations, and so on. In short, the auditing process is embedded in a so-called compliance management life cycle, which we discuss next. THE COMPLIANCE MANAGEMENT LIFE CYCLE In everyday business, a company is subject to a variety of different compliance sources. It is up to the company to understand, select, and “internalize” them that affect its business, thus producing a set of in-ternal policies (internalization phase in Figure 3). The latter then drive the design of the company’s busi-ness practices, yielding a set of business processes that are possibly designed compliantly (design phase),
6
meaning that they are designed to respect the internal policies. To provide evidence of the (hopefully) compliant execution of designed business processes, the company also defines a set of events, often also called “controls” or “control points”.
Process and event definitions are consumed in the business execution phase, where the company’s em-ployees perform the tasks and duties specified in the process models. Ideally (but not mandatorily), this execution is assisted by software tools such as workflow management or business process execution sys-tems, also able to collect compliance-specific evidence and to generate respective execution events (the execution data), which can be stored in an audit trail or log file for evaluation.
The internal evaluation phase serves a twofold purpose: First, it is the point where collected data can be automatically analyzed to detect compliance violations. Indeed, designing compliant processes is not enough to assure compliance, as in practice there are a multitude of reasons for which deviations from an expected business process might happen (e.g., human factors, system downtimes). Some of such prob-lems can be detected during runtime, resulting in the generation of respective events; some of them can only be detected after execution by means of, e.g., data mining or root cause analysis techniques applied to tracked runtime data. Second, the internal evaluation is the moment where a company-internal expert (auditor) may inspect and interpret the tracked evidence to assess the company’s level of compliance. The outcome of this internal evaluation might be the enforcement of corrective runtime actions (e.g., sending an alert), the re-engineering of process designs (e.g., to consider design flaws) or the adjustment of the internal policies (e.g., to cope with inconsistent policies).
Figure 3 The compliance management life cycle with phases, products, and actors.
Note that the internal evaluation does not yet certify a company’s level of compliance; it rather repre-
sents an internal control mechanism by means of which the company is able to self-assess and govern its business. For the certification of compliance, an external auditor, e.g., a financial auditor, physically visits the company and controls whether (i) the company has correctly interpreted the existing regulations, (ii) business processes have been correctly implemented, and, finally, (iii) business processes have been exe-cuted according to the policies. In practice, external audits are based on statistical checks of physical documents. In addition to unavoidable statistical errors, a certified level of compliance is further subject to the auditor’s assessment and, therefore, also contains a subjective component.
7
REPORTING ON COMPLIANCE To aid the internal evaluation and to help a company pass external audits, a concise and intuitive visuali-zation of its compliance state is paramount. To report on compliance, we advocate the use of web-based CGDs, whose good design is not trivial (Few 2006, Read et al. 2009). For example, in order to provide useful dashboards it is important to understand and solve complex issues like: i) what the typical informa-tion auditors expect to find is; ii) how large amounts of data can be visualized in an effective manner, and how data can be meaningfully grouped and summarized; and iii) how to structure the available informa-tion into multiple pages, that is, how to interactively and intuitively guide the user through the wealth of information. Each page of the dashboard should be concise and intuitive, yet complete and expressive. It is important that users are immediately able to identify the key information in a page, but that there are also facilities to drill-down into (i.e., ask for more) details.
Designing CGDs requires mastering some new concepts in addition to those discussed above. Then, the new concepts must be equipped with a well-thought navigation structure to effectively convey the neces-sary information. Here, we do not focus on how data are stored and how rules are evaluated; several pro-posals and approaches have been conceived so far for that (see the Related Work Section), and we build on top of them.
A Conceptual Model for CGDs In Figure 4 we extend the conceptual model (Figure 2) to capture the necessary constructs for the devel-opment of a CGD (bold lines and labels represent new entities and their respective interrelations). The extensions aim at (i) providing different analysis perspectives (in terms of time, user roles, and organiza-tional structures), (ii) summarizing data at different levels of abstraction, and (iii) enabling drill-down/roll-up features (from aggregated data to detailed data, and vice versa).
Figure 4 Conceptual model of the CGD The Dashboard view entity represents individual views over the compliance status of the company. A
view is characterized by the user role that accesses it, e.g., IT specialists, compliance experts, managers, or similar. Each of these roles has different needs and rights. For instance, managers are more interested in aggregated values, risk levels, and long time horizons (to take business decisions); IT personnel are rather interested in instance-level data and short time spans (to fix violations). A view is further character-ized by the time interval considered for the visualization of data (e.g., day, week, month, or year), also providing for the historical analysis (e.g., last year) and supporting different reporting purposes (opera-tive, tactical, strategic). Finally, a view might be restricted to only some of the business units in the com-
8
pany, based on the role of the user. Business units can be composed by other business units, forming a hierarchical organizational structure. In summary, views support different summarization levels of the overall available data, ranging over multiple granularity levels.
The described model extension aims at relating general compliance concepts with concepts that are specific to the design of dashboards. The model is general and extensible, so as to allow for the necessary flexibility to accommodate multiple concrete compliance scenarios.
Key Compliance Indicators Key Compliance Indicators (KCIs) provide compliance experts with highly aggregated view on the com-pliance performance of business processes and can be seen as particular type of KPIs (Key Performance Indicators) that specifically measures how compliant a process is with given requirements. A typical KCI may, for example, measure how many process instances, out of all the executed ones, satisfy a separation of duties requirement; but also a traditional QoS indicator (e.g., the average process execution time) can be seen as KCI, if we are subject to a compliance requirement regarding QoS (e.g., deriving from a con-tract with the customer). As we will see, KCIs also provide a starting point for finding the root causes of non-compliance.
The main sources of process execution and compliance data are the event logs generated by the execu-tion of service-based business processes. Therefore, let us first conceptualize the key ingredients charac-terizing event logs, as we perceive them for our analysis. An event is a tuple e = <t, s, ts, d, p1,…, pn, B>, where t is the type of the event (e.g., ProcessStart, ActivityExecuted, Violation), s is the source that gener-ates the event, ts is a timestamp, p1,…, pn is a set of properties (e.g., event message header properties such as correlation data, process instance identifier or similar), and B is the body of the event message (e.g., containing business data needed for the computation of an indicator). Using this data, events can be grouped together by their process instance and ordered by timestamp, forming this way traces. A trace is a sequence of events Ti=<ei1, ei2, …, ein>, where i refers to a process instance identifier and n is the num-ber of events that compose the process instance. This way, an event log can be expressed as a set of traces L={T1, T2, …, Tk}, where k is the total number of traces.
The events in the log are processed by Extract-Transform-Load (ETL) flows, in order to store them in-to a data warehouse (DW), which is modeled using a compliance-oriented dimensional data model. The reason for doing this is that we aim at leveraging the capability of dimensional models for keeping a con-ciliated view on the process execution and compliance data, and for supporting further analysis, e.g., by means of root-cause analysis algorithms or Online Analytical Processing (OLAP) tools.
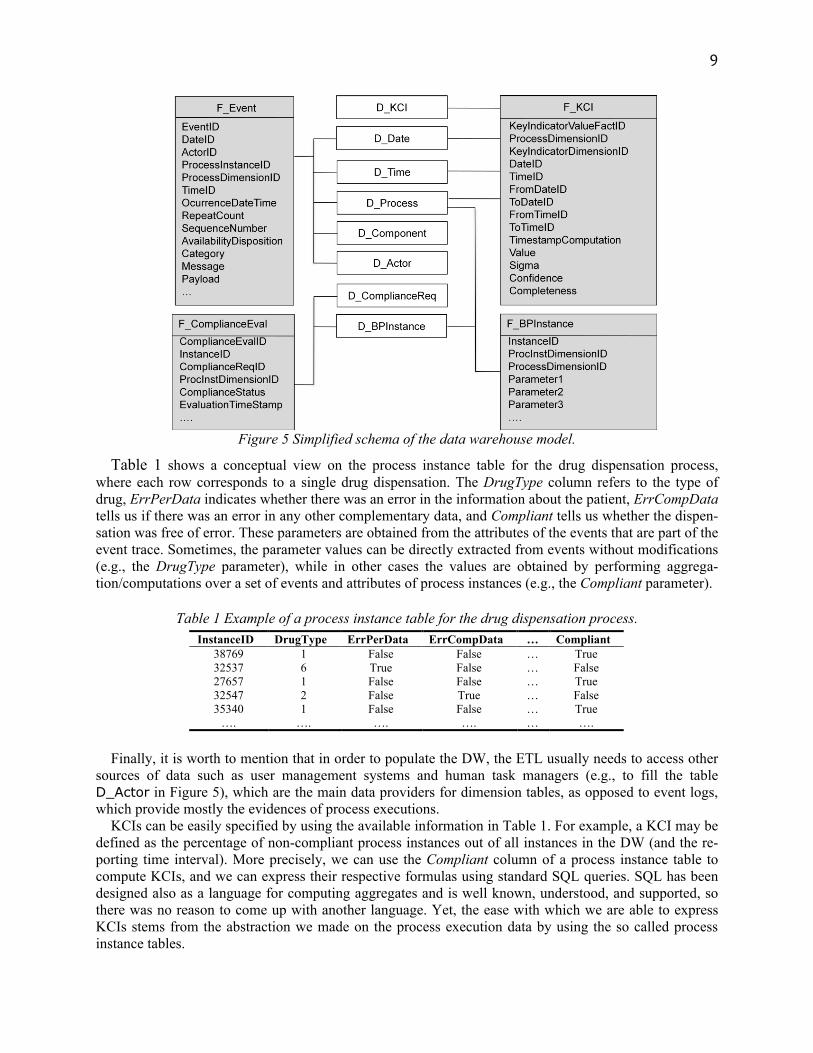
Figure 5 shows an excerpt of the schema of the DW. The tables in white are the dimensional tables that allow us to slice and dice through the fact tables (shaded in gray). The fact table F_Event stores the events as they come from the event log, F_KCI stores the computed values of indicators, F_BPInstance, the instances of processes, and F_ComplianceEval, the compliance status of process instances as com-puted, for instance, by the compliance checking algorithms adopted in the context of the EU projects COMPAS1 or MASTER2.
The F_BPInstance table deserves a further explanation, as it constitutes an abstraction of the process execution data, and the basis for computing indicators and performing root-cause analysis. In our DW model, each business process BP has its own F_BPInstance table, or, as we call it, process instance table (e.g., in our scenario we have a F_DrugDispensationInstance table that corresponds to the drug dis-pensation process of the hospital). In these tables, each row corresponds to an instance of the associated process, while columns (i.e., parameters of the process instance table) correspond to business data that are of interest for the analysis of each process.
1 Compliance-driven Models, Languages, and Architectures for Services (http://www.compas-ict.eu/) 2 Managing Assurance Security and Trust for sERvices (http://www.master-fp7.eu/)
9
Figure 5 Simplified schema of the data warehouse model.
Table 1 shows a conceptual view on the process instance table for the drug dispensation process, where each row corresponds to a single drug dispensation. The DrugType column refers to the type of drug, ErrPerData indicates whether there was an error in the information about the patient, ErrCompData tells us if there was an error in any other complementary data, and Compliant tells us whether the dispen-sation was free of error. These parameters are obtained from the attributes of the events that are part of the event trace. Sometimes, the parameter values can be directly extracted from events without modifications (e.g., the DrugType parameter), while in other cases the values are obtained by performing aggrega-tion/computations over a set of events and attributes of process instances (e.g., the Compliant parameter).
Table 1 Example of a process instance table for the drug dispensation process. InstanceID DrugType ErrPerData ErrCompData … Compliant
Finally, it is worth to mention that in order to populate the DW, the ETL usually needs to access other sources of data such as user management systems and human task managers (e.g., to fill the table D_Actor in Figure 5), which are the main data providers for dimension tables, as opposed to event logs, which provide mostly the evidences of process executions.
KCIs can be easily specified by using the available information in Table 1. For example, a KCI may be defined as the percentage of non-compliant process instances out of all instances in the DW (and the re-porting time interval). More precisely, we can use the Compliant column of a process instance table to compute KCIs, and we can express their respective formulas using standard SQL queries. SQL has been designed also as a language for computing aggregates and is well known, understood, and supported, so there was no reason to come up with another language. Yet, the ease with which we are able to express KCIs stems from the abstraction we made on the process execution data by using the so called process instance tables.
10
Navigation Design We now focus on the dynamic aspect of the dashboard, i.e., on how to structure the interaction of users with the dashboard, and on how users can explore the data underlying the dashboard application. Specifi-cally, on top of the conceptual model for CGDs, we now describe how complex data can be organized into hypertext pages and which navigation paths are important.
For this purpose, we adopt the Web Modeling Language (WebML) (Ceri et al. 2002), a conceptual modeling notation and methodology for the development of data-intensive web applications. We use the language for the purpose of illustration only (we show a simplified, not executable WebML schema) and intuitively introduce all the necessary constructs along with the description of the navigation structure.
Figure 6 WebML hypertext schema structuring the navigation of CGD concepts and data
11
The WebML hypertext schema (Figure 6) describes the organization of our ideal web CGD. It consists
of five pages (the boxes with the name labels in the upper left corner), Compliance Home being the home page (note the H label). Each page contains a number of content units, which represent the publication of contents from the data schema in Figure 5 (the selector condition below the units indicates the source data entity). Usually, there are many hyperlinks (the arrows) in a hypertext schema, representing the possible navigations a user might perform, but for simplicity, we limit our explanation to only those links that rep-resent the main navigation flow. Links carry parameters, which represent the selection performed by the user when activating a link (e.g., the selection of a process from a list). For the purpose of reporting on compliance, we define a new content unit (not part of the WebML), the compliance drill-down unit, which allows us to comfortably show compliance data in a table-like structure (see the legend in Figure 6 and the examples in Figure 7).
Let’s examine the CGD’s structure (Figure 6): The home page of the CGD provides insight into the compliance state of the company at a glance. It shows the set of most important indicators (Main indica-‐tors multidata unit) and a set of indicators grouped by their policy (IndByPolicy hierarchical index unit). Then, we show the (BUnits/C.Sour.) unit that allows the user to drill-down from business units to proc-esses and from compliance sources to policies. A click on one of: i) the processes lead the user to the ComplianceSources by Activity page; ii) compliance source leads her to the ComplianceRules by Busines-‐sUnits page; and iii) the cell of the table leads her to the ComplianceRules by Activity page. After the se-lection of a process, in the ComplianceSources by Activity page the user can inspect the compliance state of each activity of the selected process with the given compliance sources and policies (CSourByActivity), a set of related indicators (BPIndicators unit; the unit consumes the Process parameter), and the details of the selected process (Process data unit). Similar details are shown for policies in the ComplianceRules by BusinessUnits page, which allows the user to inspect the satisfaction of individual compliance rules at business unit or process level (ComplianceRulesByBU). A further selection in the compliance drill-down units in these last two pages or the selection of a cell in the BUnits/C.Sour unit in the home page leads the user to the ComplianceRules by Activity page, which provides the user with the lowest level of aggregated information. It visualizes the satisfaction of the compliance rules of the chosen policy by the individual activities of the chosen process (ComplianceRulesByActivity), along with the details of the chosen policy and process and their respective indicators. A further selection in this page leads the user to the Compli-‐ance Rule Violations page, which shows the details of the violations related to the chosen process/policy combination at an instance level in the Compliance Rule Violations index unit.
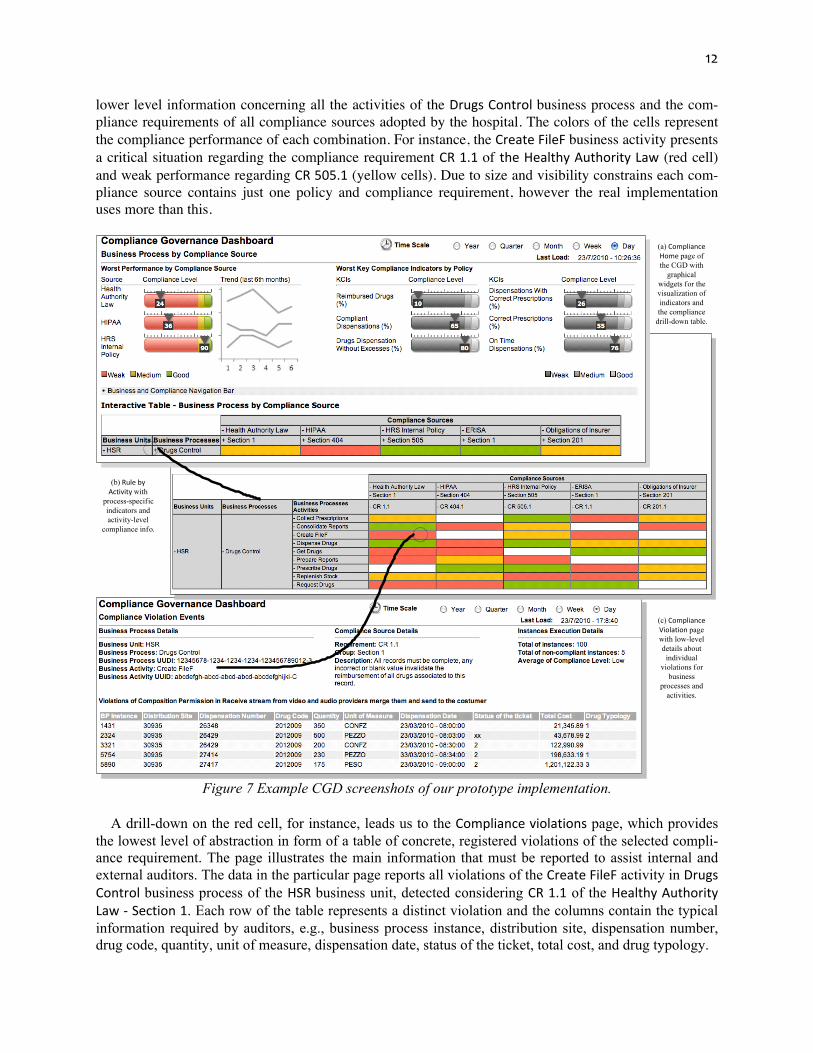
The navigation structure in Figure 6 shows one of the possible views over the data in Figure 5, e.g., the one of the internal compliance expert. Other views can easily be added. Each page provides a different level of summarization (overview, process-specific, policy-specific, process- and policy-specific, viola-tion instances), guiding the user from high-level information to low-level details. The time interval to be considered for the visualization can be chosen in each of the pages. CGDs in Practice Figure 7 illustrates some screenshots from our prototype CGD. The screenshots show views that clarify and consistently present our ideal CGD. Figure 7(a) shows the Compliance Home page (Figure 6), Figure 7(b) the Rules by Activity page, and Figure 7(c) the Compliance violations page.
Compliance Home concentrates on the most important information at a glance, condensed into just one page (compare with Figure 7). It represents the highest granularity of information. The three colored indi-cators (top left) are the most relevant, showing the most critical non-compliant compliance sources. The gray indicators (right) report on the compliance with KCIs. In the bottom, there is the interactive compli-ance drill-down table containing the compliance performance of business units and processes (rows) in relation to compliance sources and policies (columns). The user can easily reach lower levels of granular-ity by drilling down on the table or navigating to pages. For instance, the Rules by Activity page condenses
12
lower level information concerning all the activities of the Drugs Control business process and the com-pliance requirements of all compliance sources adopted by the hospital. The colors of the cells represent the compliance performance of each combination. For instance, the Create FileF business activity presents a critical situation regarding the compliance requirement CR 1.1 of the Healthy Authority Law (red cell) and weak performance regarding CR 505.1 (yellow cells). Due to size and visibility constrains each com-pliance source contains just one policy and compliance requirement, however the real implementation uses more than this.
Figure 7 Example CGD screenshots of our prototype implementation.
A drill-down on the red cell, for instance, leads us to the Compliance violations page, which provides
the lowest level of abstraction in form of a table of concrete, registered violations of the selected compli-ance requirement. The page illustrates the main information that must be reported to assist internal and external auditors. The data in the particular page reports all violations of the Create FileF activity in Drugs Control business process of the HSR business unit, detected considering CR 1.1 of the Healthy Authority Law -‐ Section 1. Each row of the table represents a distinct violation and the columns contain the typical information required by auditors, e.g., business process instance, distribution site, dispensation number, drug code, quantity, unit of measure, dispensation date, status of the ticket, total cost, and drug typology.
13
The amount and position of the graphical widgets for indicators, tables, summaries, and other visual metaphors are chosen in accordance with our short-term memory and the convention of most western lan-guages that are read from left to right and from top to bottom (Few 2006). ANALYZING NON-COMPLIANCE While checking the compliance of business process instances means determining whether the process in-stances are compliant or not at the individual event trace level, analyzing non-compliance of business process executions, i.e., understanding and explaining the underlying reasons of non-compliance, needs to be performed over a set of traces in order to be able to derive meaningful knowledge that can be used to improve processes for future executions.
Incidentally, labeling event traces as compliant or non-compliant, which is the main goal of compliance checking, is very similar to classifying data tuples, a data mining practice that is well-studied in literature (Grigori et al. 2004). There are several algorithms that can help in performing this analysis, among which we choose decision trees, as they are good for knowledge discovery where neither complex settings nor assumptions are required (Grigori et al. 2004), and they are easy to interpret and analyze. In this section, we discuss how we address the issue of compliance analysis through decision trees, going from data preparation to the actual building and interpretation of the decision tree. Preparing the Analysis In the previous section, we introduced our DW model, which constitutes the basis for our CGD and the root cause analysis. Preparing the analysis therefore means selecting which data, out of the huge amount of events stored in the DW, are suitable for identifying root causes for non-compliance. We also intro-duced the idea of having process instance tables, one per process, in which we store those process pa-rameters that are used for computing indicators. Recall that each tuple in a process instance table repre-sents a particular instantiation of the process under consideration and that each instance comes with its compliance label. Now, considering that we are interested in analyzing non-compliance problems for process instances, it is interesting to note that the process instance tables initially conceived for the com-putation of indicators also contain the data we are searching for. In fact, by defining a set of indicators for each process (and the events and data attributes that are necessary to compute them), the compliance ex-pert implicitly performs a pre-selection of the data that are most likely to be related with compliance is-sues. The availability of the compliance label for each instance indicates that the best choice for the root cause analysis is to use the process instance tables to feed the decision tree mining algorithm, as their data naturally fits the typical input format of these kinds of algorithms.
For instance, considering again the process instance table shown in Table 1, one way of building the training tuples for the decision tree is to use the Compliant column as the class attribute (leaf nodes) for the decision tree, while ErrPerData and ErrCompData can be used as the attributes on which the algo-rithm defines the split points (for internal nodes). This way, the training tuples can be represented as
<ErrPerData, ErrCompData, Compliant>
The set of training tuples can be easily obtained through trivial SQL queries, and the retrieved result set can be used directly to feed the decision tree algorithm. Note that, as in the case of the specification and computation of the KCIs, the task of building the training tuples is greatly facilitated by the abstraction provided by the process instance tables.
Understanding Key Factors The algorithm we use in our prototype implementation for building decision trees is J48 (a Java imple-mentation of the C4.5 algorithm) (Witten & Frank, 2005), one of the algorithms that comes with the We-ka library (Hall et. al.,), which we use for our implementation.
As in any decision tree, the internal nodes contain the criteria used for classifying tuples. The leaf nodes, instead, contain the classes to which tuples are classified. For instance, if we choose the Compliant
14
column of Table 1 as the class attribute, we will obtain a decision tree where the leaf nodes contain the compliance outcomes for the paths drawn from the root of the tree. However, nothing prevents us from choosing any other parameter of the process instance table as the class attribute when searching for the root causes of non-compliant process executions.
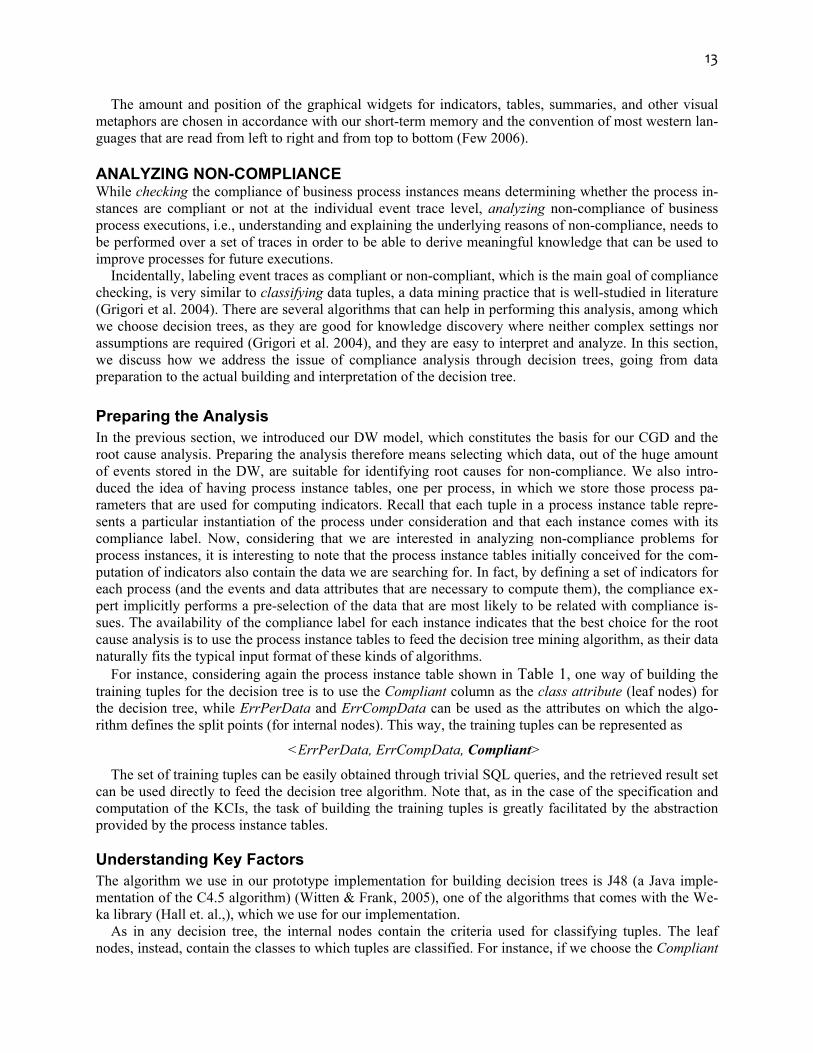
Figure 8 Decision tree computed over instances of the drug dispensation process
For instance, as part of the validation of this approach, we performed experiments on a dataset of more
than 30000 drug dispensations performed between January and April of 2009 in the hospital described in the Scenario section. To this end, a process instance table with around 25 relevant parameters was build for the drug dispensation process, among which the parameters shown in Table 1 were included. Since the dependence of the Compliance column on the ErrPerData and ErrCompData columns was fairly ob-vious (but still, proven with our tools), we narrowed our analysis by considering only those process in-stances that were not compliant. After exploring some combinations of parameters, we found out that there was a relation between the ErrCompData and DrugType parameters. More precisely, we found that 393 drugs dispensations out of around 30000 had some error, among which 173 had errors of the type ErrCompData and 220 errors of the type ErrPerData. While the decision tree was not able to tell us any-thing that was really significant about errors of the type ErrPerData, it was able to find something useful for the errors of the type ErrCompData, as shown in Figure 8. More precisely, the decision tree discov-ered that 137 out of 173 (79%) erroneous process instances corresponded to drugs of the type 2 (DrugType=2), which are drugs for ambulatory usage, while the rest (21%) corresponded to drugs of the type 6, 9 and 11.
Since the ErrCompData refers to error in the dispensation data (such as the drug code, quantity and un-itary price), this may be an indication that, for example, this type of drugs is dispensed at ease, and thus, a better monitoring or compliance enforcement need to be carried out on the controls related to this com-pliance requirement.
15
Predicting Compliance States While decision trees are generally perceived as simple classifiers, we however use them rather for discov-ering and understanding better the root causes of undesirable behaviors. Furthermore, we advocate the use of decision trees also for predicting the potential outcomes of process instances that are still running. In fact, each decision point in a tree corresponds to an event (or better to an attribute of an event). So, if dur-ing process execution an event that corresponds to a decision point is generated, this allows performing predictions on the likely outcome (in terms of compliance) of the process instance: it suffices to inspect the path in the tree determined by the registered event to identify the instances’ likely compliance label.
Thus, in the case of predictions of non-compliant behaviors, enforcement actions can be enacted in or-der to align process executions, whenever possible, to the corresponding compliance requirements. This is particularly useful in cases when the process has several tasks and long running times that span, e.g., over several hours. Also, the prediction is particularly useful in the case compliance is enforced manually, be-cause it allows the compliance expert to better focus his effort on those process instances that are likely to be non-compliant, leaving out compliance ones. IMPLEMENTATION The above described concepts are a joint result of the Compas and Master projects, which involve De-loitte and PricewaterhouseCoopers as industrial and auditing partners and who participated in the design of the user interfaces and validated the design models. Both projects share a similar functional architec-ture from a reporting point of view (Figure 9).
Figure 9 Functional architecture for logging business executions and reporting on compliance.
Figure 9 depicts such architecture, in which events are emitted and published, during business process
execution, on an Enterprise Service Bus (ESB), then stored in an Event Log to be Extracted, Transformed, and Loaded (ETL) in the DW. After that, compliance assessment routines are executed over the registered data in order to assess the compliance of the tracked event traces and to calculate KCIs. Finally, the CGD and the Root Cause Analysis components access the DW in order to retrieve the relevant compliance per-formance information to be showed to compliance experts and internal/external auditors. The CGD is set on the top of the DW (optimized for reporting purposes) that implements the data schema depicted in Figure 5. Although the navigation structure described in Figure 6 has been developed on top of the con-ceptual data model in Figure 4, implementing the CGD on top of the DW does not affect the logic behind
16
the conceived navigation structure, which represents a best practice for the rendering of compliance in-formation to auditors, according to the experience of the industrial partners involved in the projects.
Figure 10 Web applications involving the implementation of the CGD.
The front-end of the CGD is an interactive web application implemented according to Figure 10 and
composed of JSP pages. Dashboard.jsp is responsible for loading the dashboard widgets and the interac-tive table as illustrated in Figure 7(a) and 7(b). Each time this page is loaded, i.e., at the first access or when a new time scale is selected, it invokes the widgets.java class, which runs a set of pre-defined, pa-rameterized SQL queries over the DW, filled with variable input parameters (e.g., time scale and business level) representing user selections. Listing 1, for example, shows a typical query used to retrieve the nec-essary data to render indicators in their colorful or gray UI widgets. These graphical representations of indicators are implemented using Fusion Widgets V3 (www.fusioncharts.com) flash libraries, which re-quire XML files as input (Indicator Widget Data) and render their content into HTML divisions (<div>) of the dashboard page. SELECT Req.Source_Name AS Name, ROUND(100*(Count(*)-Sum(Proc_Inst.CausedViolation))/Count(*)) AS Value FROM D_Date, F_BPInstance Proc_Inst INNER JOIN F_ComplianceEvaluation Evaluation ON Proc_Inst.BPInstance_Key = Evaluation.BPExecutionKey JOIN D_ComplianceRequirement Req ON Req.ComplianceRequirement_Key = Evaluation.ComplianceRequirement_Key WHERE(D_Date.Calendar_Date_Key = Evaluation.Calendar_Date_Key) AND (D_Date.System_Date >= to_date('startDate', 'DD/MM/YYYY')) AND (D_Date.System_Date < (to_date('endDate', 'DD/MM/YYYY')+1))
17
GROUP BY Req.Source_Name ORDER BY Value ASC;
Listing 1 Percentage of non-compliance for a given sources in a pre-defined time interval.
When loading the dashboard into the client browser, also the content of the interactive table is updated according to the same parameters and the functions contained in table.java. In addition, the rows of the interactive table are also refreshed when a new business or compliance perspective is selected, e.g., via a mouse click. This table is fed with the DW data based on two SQL queries, one that brings all the data associated with business process and the other with business process activities. In both cases, the results of the query are locally stored on the client side as hash table objects, which allow us to dynamically show or hide their content in an HTML table according to the selected business and compliance perspec-tives.
The Violation.jsp page shows the lowest level information (events) and can be accessed through the in-teractive table, more specifically via a mouse click on one of the colored cells of the interactive table ren-dering the intersection of a business process activity and a compliance requirement. White cells corre-spond to activity-requirements combinations that do not have compliance requirements to be checked, thus no events associated to them are stored in the DW. The business process activity and the compliance requirement of the clicked cell are passed as parameters to the classes of the violation.java class that con-nects to the DW and retrieves the respective events. Similar to the previous approach, the Violation.jsp file also adopts an SQL query as depicted in Listing 2.
SELECT eb.BPInstance_Key, e.BPActivityExecutionKey, bpe.EventKey, bpe.EventType, bpe.BEvent_Source, to_char(dd.System_Date, 'YYYY/MM/DD HH:mm:ss') AS EventTimestamp FROM F_ComplianceEvaluation e JOIN B_BusinessEventBridge eb ON e.BPActivityExecutionKey = eb.BPActivityInstance_Key AND e.BPExecutionKey = eb.BPInstance_Key JOIN D_Date dd ON dd.Calendar_Date_Key = e.Calendar_Date_Key JOIN F_Event bpe ON bpe.eventKey = eb.BEvent_Key WHERE bpe.eventType != 'ComplianceViolationEvent' AND e.BP_Key = 'BP_Key' _ AND e.BPActivity_Key = 'BPActivity_Key' AND e.ComplianceRequirement_Key = 'CompReqKey' AND NVL(e.ServiceInstance_Key, 0) = NVL(eb.ServiceInstance_Key, 0 AND e.IsViolation = 1 AND dd.System_Date >= to_date('startDate','DD/MM/YYYY') AND dd.System_Date < (to_date('endDate', 'DD/MM/YYYY')+1)
Listing 2 SQL query used to retrieve all the low-level events associated to a specific compliance requirement and business process activity.
The decision tree page guides the user in the process of decision tree mining for root cause analysis and prediction. In this process, the page helps users in choosing the parameters of interest for building the de-cision tree. More precisely, it helps users in selecting the attributes for the internal nodes, the class attrib-utes to which tuples will be classified, the time range used for filtering process instances, among other parameters of the algorithm used for the mining task. Once these parameters have been selected, Dec-Tree.jsp processes the instances from the process instance table (stored in the DW) in order to prepare the
18
training tuples that will be used to feed the mining algorithm. The concrete algorithm used for building the decision tree is J48 and we rely on Weka (Hall et. al. 2009) as the supporting library for the whole mining process as it is a well-known and mature data mining library. Note, however, that we can choose any other decision tree mining algorithm among the ones available in Weka. We choose J48, which is an open source implementation of the C4.5 algorithm, due to its popularity and the fact that this is a well-understood algorithm for building decision trees. In addition, it is equipped with features such as continu-ous number categorization and missing value handling, which are key features when doing classification on data coming from realistic settings.
All pages of the CGD were developed using Eclipse Java EE IDE for Web Developers, and the DW runs on Oracle 11g. An example of the CGD web portal as used in the Compas project is available at http://compas.disi.unitn.it:8080/CGDs/main.jsp selecting the CGD tab. From the same start page it is also possible to access the decision tree component by selecting the Root Cause Analysis tab.
RELATED WORK Compliance has been investigated in several contexts yielding a variety of approaches. In the following, we discuss related work in four areas that fall in the context of this paper, namely, compliance modeling, compliance dashboards, Business Activity Monitoring (BAM), and data mining techniques.
Most of the compliance modeling efforts have been done with the aim of checking compliance at de-sign time, and, therefore, the resulting models consist in formalisms for expressing low-level rules for the compliance requirements (Awad and Weske, 2009), (Liu et al. 2007), (Lu et al. 2007). Typically, they are based on formal languages to express compliance requirements (e.g., Business Property Specification Language, Linear Temporal Logic) and simulations to prevent errors at runtime (e.g., finite state machine, Petri nets). For instance, in Liu et al. 2007 the problem of static (i.e., before process execution) compli-ance checking of process models against compliance rules is addressed by expressing the models in pi-calculus and the corresponding rules in linear temporal logic; then, model checking techniques are used to determine whether a process model complies with the rules or not. In Brunel et al. 2007, policies are modeled and checked as deontic sentences (i.e., rules are of the form “it is obligatory that X...” or “it is permitted that Y...”); then, a system can be compliant even if violations occur, in which case, a second-level set of rules might be applied, for which, again, compliance needs to be checked. A similar modeling technique is presented in Saqid et al. 2007, in which Format Contract Language (FCL), a combination of defeasible logic and deontic logic, is used to express normative specifications. Once the FCL specification is built, control tags can be derived from it and used to annotate the process model so that control con-cerns can be visualized in the process model space. In this context, just few approaches address compli-ance monitoring at runtime. For instance, Trinh et al. 2009 monitor time constraints during the execution of process activities, using UML Timing Diagrams to specify constraints and Aspect Oriented Program-ming to control executions. Chung et al. 2008 check if the user-defined process is compliant to pre-defined ontology and a specific model, in which compliance requirements are described. An IBM re-search group (Giblin et al. 2006) advocates the use of the REALM (Regulations Expressed As Logical Models) metamodel to define temporal compliance rules and the Active Correlation Technology to check them. That way, it can detect duplicate events or compute a user-definable function, which checks whether a function exceeds some threshold.
To the best of our knowledge, there are no works on dashboards that specifically address the problem of visualizing compliance concerns. However, there are some works that, in part, deal with the problems we address in this paper. For example, Bellamy et al. 2007 studies the problem of designing visualizations (i.e., the representation of data through visual languages) for risk and compliance management. Specifi-cally, the study is focused on capturing the exact information required by users and on providing visual metaphors for satisfying those requirements. In Chowdhary et al 2006, the business performance report-ing is provided in a model-driven fashion. The framework provides: data model, navigation model, report template model, and access control model, which jointly help designing a business performance dash-
19
board. However, none of mentioned approaches provides suitable navigation models supporting different analysis perspectives, summarization levels, and user roles.
Business Activity Monitoring (BAM) has gained a lot of attention during the last decade, and many tools have been proposed to support it (e.g., IBM Tivoli, HP Business Availability Center, Nimbus, Ora-cle Business Activity Monitoring). BAM aims at providing aggregated information suitable for perform-ing various types of analysis on data obtained from the execution of activities inside a business. For ex-ample, tools such as Oracle BAM, Nimbus and IBM Tivoli aim at providing its users with real-time vis-ual information and alerts based on business events in a SOA environment. The information provided to users comes in the form of dashboards for reporting on KPIs and SLA violations. The compliance man-agement part of these tools (if any) comes in the form of monitoring of SLA violations, which need the SLA formal specifications as one of its inputs. In our work, we take a more general view on compliance (beyond SLAs, which are a special case to us) and cover the whole lifecycle of compliance governance, including a suitable dashboard for reporting purposes. Although, such tools still do not have the capability to process and interpret generic events (e.g., user-defined business or compliance-related events). They only support the definition of thresholds for parameters or SLAs to be monitored. Also, the ability to compare monitored business process executions or, more in general, business patterns with expected exe-cution behaviors is not supported.
According to our expertise no data mining approaches have been specifically proposed to understand the root cause of the compliance violations. However, few related approaches for the mining of business processes are in place (Rozinat and Aalst 2009), (Grigori et al. 2004), (Seol et al. 2007), (Grigori et al. 2001), (Apte et al. 2001), and (Bibelnieks and Campbell, 2000). Similar to our solution, they adopted log files and a consolidated warehouse containing business and process historical data, from where data sub-sets are extracted and used as input to mining algorithms in order to predict or understand the origin of undesired business process execution behaviors.
It is important to notice that we do not provide any new compliance checking technique; we rather fo-cus on how to make the most of existing approaches by putting on top of them a visualization logic that is validated by auditors themselves, an aspect that is at least as important as checking compliance. As this paper has its roots in two EU FP7 research projects, i.e., Compas and Master, for the assessment of com-pliance and the identification of individual violations we rely on the techniques proposed there: Compas (www.compas-ict.eu) strongly focuses on model-driven development of compliant processes and pro-poses a compliance checking approach that is based on (i) compliance requirements expressed in logical rules or process fragments and (ii) complex event processing (CEP) and business protocol monitoring to detect non-compliance with requirements. Master (www.master-fp7.eu), instead, specifically focuses on the security domain and proposes a two-layered approach to compliance assessment: first, it supports the CEP-based monitoring of running processes and the enforcement of individual rules; then, offline, it checks compliance of executed processes by assessing their conformance to a so-called ideal process model. Both approaches have in common the use of an instrumented service orchestration engine for the execution of business processes and the generation/logging of suitable execution events, starting from a signaling policy that specifies which events are necessary for compliance assessment.
Our work mainly focuses on the case of compliance and provides a conceptual and data model for both compliance and dashboards, i.e., we present the relevant concepts regarding compliance and visualization and show the interplay of these two aspects. The purpose is that of providing compliance dashboard de-signers with a holistic and comprehensive view of the business and compliance aspects that characterized a good CGD, as well as root cause analysis techniques to discover the reason of non-compliance behav-iors. CONCLUSION AND FUTURE RESEARCH DIRECTIONS In this chapter we have discussed a relevant aspect in modern business software systems, i.e., compliance governance. Increasingly, both industry and academia are investing money and efforts into the develop-ment of compliance governance solutions. Yet, we believe compliance governance dashboards in particu-
20
lar, probably the most effective means for visualizing and reporting on compliance, have mostly been ne-glected so far. It is important to implement sophisticated solutions to check compliance, but it is at least as important (if not even more) to effectively convey the results of the compliance checks to a variety of different actors, ranging from IT specialists to senior managers.
Our contribution is a conceptualization of the issues involved in the design of compliance governance dashboards in service- and process-centric systems, the definition of a navigation structure that naturally supports drill-down and roll-up features at adequate levels of detail and complexity, a decision tree tool to discover the root cause of non-compliance behaviors, and a set of concrete examples that demonstrate the concepts at work. Our aim was to devise a solution with in mind the real needs of auditors (internal and external ones) and – more importantly – with the help of people who are indeed involved every day in the auditing of companies.
As a continuation of this work, we are planning to perform extensive usage studies in the context of the projects mentioned earlier. First, such studies will allow us to assess the acceptance of the proposed CGD by auditors in their everyday work. Second, the studies will allow us to understand which support for ac-tions for mitigating compliance problems or violations directly through the dashboard is desirable.
REFERENCES Apte, C., Bibelnieks, E., Natarajan, R., Pednault, E., Tipu, F., Campbell, D., & Nelson, B. (2001). Seg-mentation-Based Modeling for Advanced Targeted Marketing. In the 7th ACM SIGKDD international conference on Knowledge discovery and data mining (pp. 408-413). New York, NY, USA: ACM. Awad, A., & Weske, M. (2009) Visualization of Compliance Violation in Business Process Models. In 5th International Workshop on Business Process Intelligence BPI 09, Vol. 43 (pp. 182-193). Bellamy, R., Erickson, T., Fuller, B., Kellogg, W., Rosenbaum, R., Thomas, J., & Vetting Wolf, T. (2007). Seeing is believing: Designing visualizations for managing risk and compliance. IBM Systems Journal, 46(2), 205-218. Bibelnieks, E., & Campbell, D. (2000). Mail Stream Streamlining. Catalog Age, 17(12), 118-120. Brunel, J., Cuppens, F., Cuppens-Boulahia, N., Sans, T., & Bodeveix, J. (2007). Security Policy Com-pliance with Violation Management. In the 2007 ACM Workshop on Formal Methods in Security Engi-neering (pp. 31-40). Cannon, J., & Byers, M. (2006). Compliance deconstructed. ACM Queue, 4(7), 30-37. Ceri, S., Fraternali, P., Bongio, A., Brambilla, M., Comai, S. & Matera, M. (Ed.) (2002). Designing Data-Intensive Web Applications. USA: Morgan Kaufmann Publishers Inc. Chowdhary, P., Palpanas, T., Pinel, F., Chen, S.-K., & Wu., F.Y. (2006). Model-driven Dashboards for Business Performance Reporting. In the 10th IEEE International Enterprise Distributed Object Comput-ing Conference, (pp. 374-386). Chung, P., Cheung, L., & Machin, C. (2008). Compliance Flow - Managing the compliance of dynamic and complex processes. Knowledge-Based Systems, 21(4), 332-354. Daniel, F., D'Andrea, V., Strauch, S., Schumm, D., Leymann, F., Mulo, E., Zdun, U., Dustdar, S., Sebahi, S., de Marchi, F., & Hacid, M. (2009). Business Compliance Governance in Service-Oriented Architec-tures. In the 2009 International Conference on Advanced Information Networking and Applications (pp. 113-120). Washington, DC, USA: IEEE Computer Society. Evans, G., & Benton, S. (2007). The BT Risk Cockpit – a visual approach to ORM. BT Technology Jour-nal, 25(1), 88-100. Few, S. (Ed.). (2006). Information Dashboard Design: The Effective Visual Communication of Data. Cambride, MA: O'Reilly Media, Inc. Giblin, C., Müller, S., & Pfitzmann, B. (2006). From Regulatory Policies to Event Monitoring Rules: Towards Model-Driven Compliance Automation. IBM Research Report RZ 3662, Zurich.
21
Grigori, D., Casati, F., Dayal, U., & Shan, M. (2001). Improving business process quality through excep-tion understanding, prediction, and prevention. In the 27th International Conference on Very Large Data Bases (pp. 159-168). San Francisco, CA, USA: Morgan Kaufmann Publishers Inc. Grigori, D., Casati, F., Castellanos, M., Dayal, U., Sayal, M., & Shan, M. (2004). Business Process Intel-ligence. Computers in Industry Journal, 53(3), 321-343. Hagerty, J., Hackbush, J., Gaughan, D., & Jacobson, S. (2008). The Governance, Risk Management, and Compliance Spending Report, 2008-2009: Inside the $32B GRC Market. AMR Research. Hall, M., Frank, E., Holmes, G., Pfahringer, B., Reutemann, P., Witten, I. (2009). The WEKA Data Min-ing Software: An Update; SIGKDD Explorations, 11(1). Imrey, L. (2006). CIO Dashboards: Flying by Instrumentation. Journal of Information Technology Man-agement, 19(4), 31-35. Liu, Y., Müller, S., & Xu, K. (2007). A static compliance-checking framework for business process mod-els. IBM Systems Journal, 46(2), 335-361. Lu, R., Sadiq, S., & Governatori, G. (2007). Compliance Aware Business Process Design. In Lecture Notes in Computer Science: Business Process Management Workshops (pp. 120-131). Berlin, Germany: Springer. Mulo, E., Zdun, U., & Dustdar, S. (2009). Monitoring Web Service Event Trails for Business Compli-ance. In the IEEE International Conference on Service-Oriented Computing and Applications. Washing-ton, DC, USA: IEEE Computer Society Press. Namiri, K. & Stojanovic, N. (2007). A Semantic-based Approach for Compliance Management of Inter-nal Controls in Business Processes. Paper presented at 19th International Conference on Advanced In-formation Systems Engineering, Trondheim, Norway. Read, A., Tarrel, A., & Fruhling, A. (2009). Exploring User Preference for the Dashboard Menu Design. In 42nd Hawaii International Conference on System Sciences, (pp. 1-10). Rodríguez, C., Daniel, F., Casati, F., & Cappiello, C. (2009). Toward Uncertain Business Intelligence: the Case of Key Indicators. IEEE Internet Computing, 14(4). Rodríguez, C., Silveira, P., Daniel, F., Casati, F. (2010). Analyzing Compliance of Service-Based Busi-ness Processes for Root-Cause Analysis and Prediction. In the 1st Workshop on Engineering SOA and the Web (ESW'10), Vienne, Austria. Rozinat, A., & van der Aalst, W. (2009). Decision Mining in Business Processes. BETA Working Paper Series, WP 164, Eindhoven University of Technology, Eindhoven. Saqid, S. Governatori, G., & Naimiri, K. (2007). Modeling Control Objectives for Business ProcessCom-pliance. In G., Alonso, Dadam, P., & Rosemann, P. (Ed.), BPM 2007 vol. 4714 (pp.149-164). Heidelber: Springer. Seol, H., Choi, J., Park, G., Park, Y. (2007). A framework for benchmarking service process using data envelopment analysis and decision tree. Expert System Applications, 32(2), 432-440. Silveira, P., Rodríguez, C., Casati, F., Daniel, F., D'Andrea, V., Worledge, C., & Taheri, Z. (2009). On the Design of Compliance Governance Dashboards for Effective Compliance and Audit Management. In The 3rd Workshop on Non-Functional Properties and SLA Management in Service-Oriented Computing. Stockholm, Sweden: Springer. Sloane, E., Rosow, E., Adam, J., & Shine, D. (2006). JEDI - An Executive Dashboard and Decision Sup-port System for Lean Global Military Medical Resource and Logistics Management. In the Annual Inter-national Conference of the IEEE Engineering in Medicine and Biology Society (pp. 5440-5443). United States: Conf Proc IEEE Eng Med Biol Soc. Trent, H. (2008). Products for Managing Governance, Risk, and Compliance: Market Fluff or Relevant Stuff? In-Depth Research Report, Burton Group.
22
Trinh, T., Do, T., Truong, N., & Nguyen, V. (2009, October). Checking the Compliance of Timing Con-straints in Software Applications. 1st International Conference on Knowledge and Systems Engineering, Hanoi, Vietnam. Witten, I., & Frank, E. (2005). Data Mining: Practical Machine Learning Tools and Techniques. 2nd ed, Morgan Kaufmann, ISBN-0120884070.