25
AIIB Energy Sector Strategy: Sustainable Energy for Asia Discussion Draft for Consultation January 2017
AIIB Energy Sector Strategy: Sustainable
Energy for Asia
Discussion Draft for Consultation
January 2017

ASIAN INFRASTRUCTURE INVESTMENT BANK
SECOND ROUND OF CONSULTATION ON
ENERGY SECTOR STRATEGY DISCUSSION DRAFT
The Asian Infrastructure Investment Bank (AIIB) is a multilateral development bank (MDB)
conceived for the 21st century. Through a participatory process, its founding members are
developing its core philosophy, principles, policies, value system and operating platform. The
Bank's foundation is built on the lessons of experience of existing MDBs and the private sector.
Its modus operandi is lean, clean and green: lean, with a small efficient management team and
highly skilled staff; clean, an ethical organization with zero tolerance for corruption; and green,
an institution built on respect for the environment. The AIIB is putting in place strong policies
on governance, accountability, financial, procurement and environmental and social
frameworks.
In this context, AIIB is preparing an Energy Sector Strategy (the Strategy), focusing on
contributing to Sustainable Energy for Asia. The Strategy is being developed through an
iterative, consultative process. Two rounds of public consultations are being held on the
document, with the objective to shape and inform the development of the Strategy.
AIIB had earlier developed an Issues Note that outlined some proposed objectives, goals,
guiding principles and implementation matters, and sought comments on issues and policy
options that may be reflected in the Strategy. The first round of consultation on the Issues Note
was finalized on 12 November, 2016. AIIB wishes to thank all the parties who provided
comments for their valuable contributions. A summary of the contributions received can be
found on AIIB website.
The second round of consultation. AIIB has developed a Discussion Draft of the Energy
Sector Strategy to initiate the second round of public consultation. The objective is to solicit
further inputs and comments on the draft Energy Sector Strategy. After this, the Strategy will
be completed and considered by the Board of Directors.
Written comments. Written inputs and comments are welcome to be sent to the following
email address: [email protected]. These can be submitted until March 6, 2017. Written
summary of the consultation inputs will be posted on the AIIB website for public access.

3
Table of Contents
Introduction .............................................................................................................................. 5
The Global Energy Landscape ............................................................................................... 6
Issues and Challenges .............................................................................................................. 7
Lessons Learned from MDB Energy Sector Investment in Asia ....................................... 13
Objective of the Energy Sector Strategy .............................................................................. 14
Guiding Principles ................................................................................................................. 14
Implementation ...................................................................................................................... 17
Sectoral Approach ................................................................................................................ 17
Cross-Cutting Issues ............................................................................................................ 21
Results Monitoring Framework ........................................................................................... 22
Annex 1: Definitions for Asia and Region and Income Classification .................................... 23
Annex 2: Proposed Results Monitoring Framework ............................................................... 25
4
ABBREVIATIONS
ADB Asian Development Bank
AIIB Asian Infrastructure Investment Bank
CO2 Carbon dioxide
COP 21 21st session of the Conference of the Parties
CPS Current Policy Scenario, defined in the World Energy Outlook
CSP Concentrated solar power
EBRD European Bank for Reconstruction and Development
EE Energy efficiency
EIA U.S. Energy Information Administration
ESF Environmental and Social Framework
EvD Evaluation Department of EBRD
GCF Green Climate Fund
GDP Gross Domestic Product
GEF Global Environment Facility
IBRD International Bank for Reconstruction and Development
IDA International Development Association
IEA International Energy Agency
IEG Independent Evaluation Group of the World Bank
IFC International Finance Corporation
IsDB Islamic Development Bank
MDB Multilateral development bank
NDCs Nationally-determined commitments
NPS New Policies Scenario, defined in the World Energy Outlook
OECD Organisation for Economic Cooperation and Development
PPP Public-private partnerships
PV Solar photovoltaic
RE Renewable energy
SE4ALL Sustainable Energy for All
SDGs Sustainable Development Goals
SDG 7 Sustainable Development Goal 7
T&D Transmission and distribution
UN United Nations
UNFCCC United Nations Framework Convention on Climate Change
UNSD United Nation Statistics Division
WBG World Bank Group
WEO World Energy Outlook, published by the IEA
WHO World Health Organization
450S 450 Scenario, defined in the World Energy Outlook
WEIGHTS AND MEASURES
Mtoe Million tons of oil equivalent
TWh Terawatt hours
GWe Gigawatt electrical
GWh Gigawatt hours
MWe Megawatt electrical
US$ US dollar
5
DISCUSSION DRAFT
Energy Sector Strategy
Sustainable Energy for Asia1
Energy is central to nearly every major challenge and opportunity the world faces today.
Be it for jobs, security, climate change, food production or increasing incomes, access to
energy for all is essential. Sustainable energy is opportunity – it transforms lives,
economies and the planet.
-- Sustainable Development Goal 7
Purpose of the Discussion Draft
1. The Asian Infrastructure Investment Bank (AIIB) is preparing an Energy Sector
Strategy, focusing on contributing to Sustainable Energy for Asia. This Discussion Draft is,
by intention, a high-level draft to facilitate consensus building as the Strategy develops. The
options presented herein are for discussion purposes only. The proposals, findings,
interpretations, and conclusions expressed in this draft do not necessarily reflect the views of,
and may not be attributed to, the AIIB, its management, or its Board of Directors. AIIB does
not guarantee the accuracy of the data included in this work.
Introduction
2. Energy services are essential to economic activity, social development and quality of
life. They fuel the economy and facilitate the operation of large factories and small business.
They are essential to deliver goods and services and to meet people’s mobility needs. Finally,
they contribute to wellbeing, quality of life and social development and are essential to lift
vulnerable people out of poverty. As noted by the United Nations (UN) Secretary-General:
“The decisions we take today on how we produce, consume and distribute energy will
profoundly influence our ability to eradicate poverty and respond effectively to climate
change”2.
3. The objective of the Energy Sector Strategy is to provide the framework, principles,
and operational modalities to guide the Bank’s future energy sector engagement, including
the development of its pipeline and future sub-sectoral lines of business.
4. The Strategy is consistent with the Bank’s “Lean, Clean and Green” core values. The
Strategy embraces, and is informed by, the principles underpinning the Sustainable Energy
1 In this document, references to “Asia” and “Region” includes the geographical regions and composition
classified as Asia and Oceania by the United Nations, (Annex 1). This definition does not include Russia.
However, Russia is a regional member of AIIB and therefore is listed separately, and additionally, in various
places in this document. 2 “Energy for a Sustainable Future”, Foreword, The Secretary-General’s Advisory Group on Energy and Climate
Change (AGECC), Summary Report and Recommendations – 28 April 2010, New York.

6
for All (SE4ALL), the 2030 Agenda for Sustainable Development, and the Paris Agreement
(Box 1). It lays the framework for the Bank to support its client countries to: (i) develop and
improve their energy infrastructure and facilitate their transition to a less carbon-intensive
energy mix; and (ii) meet their goals and commitments under these global initiatives.
Box 1: Global Initiatives
The Sustainable Energy for All (SE4ALL) initiative, launched by the UN Secretary-General Ban
Ki-moon in September 2011, has three objectives for 2030: ensure universal access to modern
energy services; double the share of renewable energy in the global energy mix; and double the
global rate of improvement in energy efficiency. The initiative was launched to coincide with the
UN General Assembly Resolution 65/151 of 20 December 2010 that declared 2012 the
International Year of Sustainable Energy for All.
The 2030 Agenda for Sustainable Development is a set of 17 aspirational "Sustainable
Development Goals" (SDGs) with 169 targets developed under UN auspices, involving 193 UN
Member States and global civil society. The goals are contained in paragraph 54 of the UN General
Assembly Resolution A/RES/70/1 of 25 September 2015. One of those goals, SDG 7, calls for
ensuring access to affordable, reliable, sustainable and modern energy for all by 2030.
The Paris Agreement’s central aim is to strengthen the global response to the threat of climate
change by “holding the increase in the global average temperature to well below 2 degrees Celsius
above pre-industrial levels and pursue efforts to limit the temperature increase to 1.5 degrees
Celsius”. The Agreement also aims to make “finance flows consistent with a pathway towards low
greenhouse gas emissions and climate-resilient development”. According to the Agreement,
countries shall publicly outline nationally determined contributions (NDCs) that they intend to
achieve for reductions in greenhouse gas emissions. The Paris Agreement was agreed by 197
Parties during the 21st Conference of the Parties (COP 21) of the UN Framework Convention on
Climate Change (UNFCCC) in Paris in December 2015, and entered into force in November 2016.
Source: Sustainable Energy for All, www.se4all.org; the 2030 Agenda for Sustainable Development,
sustainabledevelopment.un.org/post2015/transformingourworld; the Paris Agreement, unfccc.int/paris
agreement/items/9485.php
The Global Energy Landscape
5. The Strategy is being developed in a global energy landscape that is characterized by
a growing sense of energy insecurity and widespread environmental concerns at both local
and global levels. Yet it is also a time of shared hope and promise as demonstrated both by
ambitious goals and commitments under global initiatives, and by technological advances
that will ease the transition towards more sustainable development. Bank support will assist
its clients to meet their nationally determined commitments (NDCs) under the Paris
Agreement and to reap the benefits of new technologies and innovation.
6. Energy insecurity and environmental concerns. Worries about energy security and
pricing volatility have been a concern for over four decades. These concerns have been
compounded by the free fall of oil prices after their peak in the late 2000s, and the geo-
political turmoil that threatens the security of vital energy infrastructure. Concerns about the
environment and the impact of climate change also loom large. The effects of the Deepwater
Horizon oil spill and the Fukushima Daiichi nuclear accident have added to public anxiety

7
and awareness about environmental and security risks. The first incident triggered increased
scrutiny of environmental issues related to the development of unconventional oil and gas
sources which may slow their development. The second incident has moderated the
enthusiasm about the “nuclear renaissance”. A number of countries subsequently tempered
their nuclear development ambitions significantly and some are considering phasing out this
technology. The extremely high pollution in many of Asia’s large cities has heightened
concerns about environmental risks and their impacts on the health and wellbeing of the
population. Asian countries, especially the most populous ones, are already experiencing
floods, devastating storms and drought and they will face higher risks if climate threats are
not mitigated (Table 1).
Table 1: Countries Most at Risk of Five Climate Change Threats
Drought Flood Storm Coastal Impact Agriculture
Malawi Bangladesh Philippines All low-lying Island states Sudan
Ethiopia China Bangladesh Vietnam Senegal
Zimbabwe India Madagascar Egypt Zimbabwe
India Cambodia Vietnam Tunisia Mali
Mozambique Mozambique Moldova Indonesia Zambia
Niger Laos Mongolia Mauritania Morocco
Mauritania Pakistan Haiti China Niger
Eritrea Sri Lanka Samoa Mexico India
Sudan Thailand Tonga Myanmar Malawi
Chad Vietnam China Bangladesh Algeria
Kenya Benin Honduras Senegal Ethiopia
Iran Rwanda Fiji Libya Pakistan
Note: Asian countries highlighted by the Study team.
Source: World Bank
7. Primary energy consumption growth driven by non-OECD countries. Since 2000,
the world’s primary energy consumption grew on average at 2.2 percent to reach about 13.7
billion of tons of oil equivalent (toe) in 2014. However, during 2010-2014, it grew at 1.9
percent per year, a slower growth rate than prior to the financial crisis (2.7 percent per year),
but likely due more to weaker global economic growth than to gains in energy efficiency.
From 2000-2014, the primary energy consumption increase has been driven by non-OECD
countries, which accounted for 98 percent of the growth during this period and reached 58
percent of the total world consumption in 2014.
Issues and Challenges
8. The specific issues countries in Asia confront in their energy sectors are similar to
those facing most non-OECD countries - the need for affordable, sustainable and reliable
energy systems to support regional and global economic growth.
9. Asia is endowed with abundant energy resources:
More than half of global conventional oil and gas reserves are in Asia: 3,795 trillion
cubic feet of gas (55 percent of the world reserves) and 888 billion barrels of oil (54
percent of the world reserves), most of which are concentrated in Western Asia:
8
Saudi Arabia, Iraq, Kuwait, Qatar and United Arab Emirates. In addition, Russia
has 1,688 trillion cubic feet of gas (28 percent of the world reserves) and 80 billion
barrels of oil (5 percent of world reserves).
Asia’s coal reserves are also abundant, amounting to more than 369,497 million
short tons and representing 38 percent of global reserves, with a high concentration
in five countries including: China (34 percent), Australia (23 percent), India (18
percent), Kazakhstan (10 percent) and Indonesia (8 percent). Russia’s coal reserves
amount to 173,074 million short tons, about 18 percent of the global reserves.
Asia’s hydropower technical potential amounts to about 5,980 TWh/year,
accounting for 37 percent of the global potential, while the total generation in 2011
amounted to about 37 percent of the economically exploitable generation. Three
countries accounted for more than 75 percent of total generation: China (61 percent),
India (10 percent) and Turkey (5 percent). Generation in the rest of non-OECD
Asia3 amounted in the same year to 182 TWh, about 22 percent of the economically
exploitable potential. Russia’s hydropower potential amounts to 1,670 TWh/year
and accounts for about 10 percent of global hydropower potential.
Asia’s estimated geothermal potential amounts to about 63 GWe and amounts to
78 to 90 percent of global potential, estimated at 70-80 GWe4. Asia’s potential is
concentrated five countries5: (i) Indonesia with a potential estimated at about 27.8
GWe, and an installed capacity of 1,340 MWe and an annual power generation of
9,600 GWh; (ii) Japan with a potential estimated at 23.5 GWe6, and an installed
capacity of 500 MWe; (iii) the Philippines with a potential of 6 GWe and an
installed capacity of 1,870 MW, the second largest in the world and an annual power
generation of 9,646 GWh; (iv) New Zealand with an estimated potential of 3.65
GWe, an installed capacity of 1,005 MWe and an annual generation of 7,000 GWh;
and (v) Turkey with an estimated potential of 2 GWe7, an installed capacity of 397
MWe and an annual production of 3,127 GWh. Russia’s geothermal potential is
estimated at 2 GWe.
Asia’s solar resources are estimated at 119,536 TWh/year, about 30 percent of the
global potential. China, Australia and India account for 55 percent of the potential.
Asia is also endowed with modest onshore wind potential, about 11 percent of
world potential, primarily limited to China, Australia, Mongolia, Afghanistan and
Pakistan. Russia’s solar resources amount to 30,586 TWh/year, accounting for 8
3 Non-OECD Asia is defined by IEA as: Bangladesh, Brunei Darussalam, Cambodia, China, Chinese Taipei, India,
Indonesia, the Democratic People’s Republic of Korea, Malaysia, Mongolia, Myanmar, Nepal, Pakistan, the
Philippines, Singapore, Sri Lanka, Thailand, Vietnam, and other Asian (UNSD definition) countries and territories.
Furthermore, IEA notes that: “Individual data are not available and are estimated in aggregate for: Afghanistan,
Bhutan, Cook Islands, Fiji, French Polynesia, Kiribati, Lao PDR, Macau (China), Maldives, New Caledonia, Palau,
Papua Guinea, Samoa, Solomon, Timor-Leste and Tonga and Vanuatu. 4 Sanyal, et al (2016), “Comparative Analysis of Approaches to Geothermal Resource Risk Mitigation: a Global
Survey”, Energy Sector Management Assistance Program (ESMAP), Knowledge Series 024/16, Washington,
D.C., World Bank Group. 5 Geothermal data for the five countries come from International Geothermal Association unless otherwise stated. 6 Geothermal potential is an estimated value from heat energy stored at a depth of geological basement or
shallower. Source: “Japan – Renewed Opportunities”, Kasumi Yasukawa, National Institute of Advanced
Industrial Science and Technology (AIST), 2014. 7 Geothermal Country Update Report of Turkey (2010-2015), Proceedings of World Geothermal Congress 2015.

9
percent of the World’s resources. Its wind resources amount to 9 percent of the
world potential and 81 percent of Asia’s potential.
10. Energy production in Asia is characterized by fast increasing production of fossil
fuels. During 2000-14, Asia’s fossil fuel production annual growth rate was: (i) 5.6 percent
for gas, more than twice the global production growth rate; (ii) 6.7 percent for coal, 1.7 times
the global rate; and (iii) 1.1 percent for oil, slightly higher than the global rate. Russia’s fossil
fuel production grew at 0.7 percent for gas, 2.8 percent for coal, and 1.1 percent for oil per
year during the same period.
11. There are significant challenges to achieve energy sustainability:
Rapidly growing primary energy consumption. Asia’s primary energy
consumption grew at 4.6 percent per year from 2000-14, more than twice the
global growth rate. It increased from 3,528 million tons of oil equivalent (Mtoe)
in 2000 to 6,579 Mtoe in 2014, accounting for 84 percent of the global increase
in consumption during this period (Table 2). Of note, 98 percent of Asia’s
consumption increase was driven by demand in non-OECD Asia. Figure 1 below
shows that China accounted for 47 percent of Asia’s consumption followed by
OECD Asia (15 percent), India (12 percent) and the rest of Asia (26 percent). In
addition, Russia’s primary energy consumption grew at 1.0 percent per year
during 2000-14, much slower than the global 2.2 percent per year and Asia’s 4.6
percent per year.
Table 2: Total Primary Energy Consumption (Mtoe)
By Region 2000 2014 CAAGR* (2000-14)
Asia 3,528 6,579 4.6%
China 1,175 3,066 7.1%
India 441 824 4.6%
OECD Asia 926 1,000 0.5%
Rest of Asia 986 1,688 4.6%
Russia 620 712 1.0%
World 10,053 13,690 2.2% *Compounded Annual Average Growth Rate;
Note: number may not exactly add up due to rounding
Source: International Energy Agency (IEA) Database
Figure 1: Breakdown of Total Primary Energy Consumption in (a) Asia
and (b) Asia + Russia (2014)
Source: IEA Database
China47%
India12%
OECD Asia 15%
Rest of Asia 26% China
42%
India11%
OECD Asia 14%
Rest of Asia 23%
Russia10%
(a) Asia Only (b) Asia + Russia

10
Dominance of fossil fuels. Fossil fuels accounted for 93 percent of Asia’s
consumption increase during 2000-14, and 84 percent of Russia’s consumption
increase during the same period. Non-fossil fuels made up the remaining 7 percent
in Asia and the remaining 16 percent in Russia. Figure 2 shows that in 2014,
Asia’s reliance on fossil fuels was 5 percentage points higher than the world
average, 86 percent compared to 81 percent. The higher percentage remains
unchanged if Russia is added to Asia.
Figure 2: Dominance of Fossil Fuels in Asia, Asia + Russia, and the World (2014)
Source: IEA and EIA Databases
Declining energy intensity, but slower than the world average. Energy
intensities of Asian countries declined steadily during 2000-14 indicating
increased energy efficiency. However, the decline of the average energy intensity
in Asia was less than the decline in the global average. The average rate of
reduction of Asia’s energy intensity was greater during 2010-14 than during 2000-
10. Regionally, OECD Asia (excluding Turkey), Central Asia, Eastern Asia
(excluding China) and Southeastern Asia achieved the improvement rate in
energy intensity needed to achieve the Energy Efficiency objective of Sustainable
Energy for All (SE4ALL sets a 2.3 percent per year target). Russia’s energy
intensity also declined by 35 percent during 2000-14. Its energy intensity
decreased by 3.1 percent per year during 2000-10 but slowed down to 1.5 percent
per year during 2010-14, which fell short of the SE4ALL target.
Low access to modern energy. Asia’s population without access to electricity was
estimated in 2012 at 464 million, about 43 percent of the world population without
such access. However, power system reliability in many countries does not meet
the reliability standards required by sophisticated equipment and the connectivity
needs of households and businesses. According to the World Bank Enterprise
0
2000
4000
6000
8000
10000
12000
14000
World Asia+Russia Asia
Mto
e
Oil Coal Gas Biofuels & waste Nuclear Hydro Solar/Wind/Other Geothermal
Coal(29%)
Gas(21%)
Fossil Fuel (81%)
Oil (26%)
13,690 MtoeNon-Fossil Fuel (19%)
Coal (40%)
Gas (20%)
Fossil Fuel (86%)
7,291 Mtoe Non-Fossil Fuel (14%)
Oil(31%)
Coal (43%)
Gas (17%)
Fossil Fuel (86%)
6,579 Mtoe Non-Fossil Fuel (14%)
Oil (26%)

11
Survey8, unreliable electricity services have been identified by enterprises as a
major constraint in 10 Asian countries, including Yemen, Syria, Lebanon, Iraq,
Georgia, Pakistan, Afghanistan, Bangladesh, the Kyrgyz Republic, and Papua
New Guinea. Moreover, according to the International Energy Agency (IEA), in
2013 about 2.7 billion people (about 38 percent of the World population) relied
on traditional biomass combustion, with over 2 billion (about three quarters of the
total) located in Asia and 1.43 million in Russia. These populations are exposed
to indoor pollution and suffer devastating health impacts. It is estimated by World
Health Organization (WHO) that about 4 million deaths per year are attributable
to the lack of access to non-solid fuels for use in lighting, cooking and heating.
Figure 3: Fuel Combustion-related CO2 Emissions in Asia and Russia (2014)
Source: IEA Database
Rapidly increasing combustion related CO2 emissions. Asia’s fuel combustion-
related CO2 emission amounted to 17,362 Mt in 2014, up by 42 percent from its
2006 level. The growth rate at 4.5 percent was more than twice the world average
during the same period. Although Asia’s per capita energy consumption is below
the world average, it is growing at a rate 2.5 times faster than the world average.
Asia’s carbon intensity was on a steady downward trend during 2006-14, but at a
slower pace than the world average. Figure 3 below shows that in 2014, five
countries (China, India, Japan, South Korea, and Iran) accounted for more than
three-quarters of Asia’s total emissions. Russia’s fuel-combustion related CO2
emissions reached 1,468 Mt in 2014, amounting to 8 percent of Asia’s emissions
and 5 percent of the global emissions. Notably, Asia’s emissions grew at 3.6
percent per year during 2006-14, much faster than the 0.6 percent global average,
while Asia’s average per capita fuel combustion-related CO2 emissions were 10
percent lower than the average of the World (4.47 tCO2/capita) in 2014. Russia’s
per capita emissions were practically stable during 2000-14 at 10.3 tCO2 per
capita, more than twice the global average.
Extensive local pollution. 19 of the 20 most polluted (PM2.5) cities in the world
are located in Asia: 10 in India, 4 in China, 3 in Saudi Arabia, 1 in Iran and 1 in
Pakistan. These cities experience annual mean PM2.5 concentrations, 11 to 22
times the WHO guideline value.
8 Based on surveys of more than 125,000 firms globally.
China52%
India12%
Japan7%
South Korea3%
Iran 3%
Others 23%
17,362 Mt CO2
(2014)
China48%
India11%
Russia8%
Japan6%
South Korea3%
Iran 3%
Others 21%
18,830 Mt CO2
(2014)
(a) Asia (b) Asia + Russia

12
12. Against the backdrop, non-OECD Asian countries and Russia face daunting
challenges to meet their energy needs to sustain economic growth while transitioning to a
less carbon-intensive energy mix.
13. According to the 2015 World Energy Outlook scenarios (Figure 4), global energy
investment during 2015-40 would amount to US$68 trillion under the Current Policies
Scenario (CPS), US$69 trillion under the New Policies Scenario (NPS) and US$75 trillion
under the 450 Scenario (450S) (in 2015 US$)9. The IEA further pointed out that the current
energy investment trends “continued to shift in the direction of low-carbon sources and
technologies, but not fast enough to meet energy security and climate goals”.10 To meet the
Paris Agreement goals would require not only a significant investment increase, but also
more focus on energy efficiency (EE) and renewable energy (RE). Energy investment in Asia
and Russia has been estimated based on the 2014 World Energy Investment Outlook
(WEIO)11, which focuses on energy investment requirements (in 2012 constant US$) for NPS
and 450S during 2016-2035:
Global investment would amount to about US$44 trillion under both NPS and 450S;
Asia’s investment would amount to about US$18 trillion under NPS and US$18.7
trillion under 450S; and
Russia’s investment would amount to about US$2.3 trillion under NPS and US$2.5
trillion under 450S.
Figure 4: IEA 2015 World Energy Outlook Scenarios
Cumulative world energy sector investment, by sector and scenario (2015-2040)
Source: IEA World Energy Outlook 2015
9 According to the IEA, the Current Policies Scenario (CPS) takes into account only formally enacted policies and
measures affecting energy markets as of mid-2015 and makes the assumption that these policies persist unchanged;
the New Policies Scenario (NPS) is the central scenario of the Outlook and it takes into account the already
adopted policies and measures as of mid-2015, as well as other relevant commitments that have been announced,
even when the precise implementation measures have yet to be fully defined; the 450 Scenario (450S) takes a
different approach, adopting a specified outcome – the international goal to limit the rise in the long-term average
global temperature to two degrees Celsius (2 °C) – and illustrating how that might be achieved. 10 IEA (2016) World Energy Investment, page 159. 11 Team estimate based on the results of IEA’s World Energy Investment Outlook – Special Report, 2014.
13
Lessons Learned from MDB Energy Sector Investment in Asia
14. The Strategy has been informed by the lessons from the evaluations of the Asia
portfolios of the Asian Development Bank (ADB), the European Bank for Reconstruction
and Development (EBRD), the Islamic Development Bank (IsDB) and the World Bank
Group (WBG).
15. The review of the active Asia portfolios of these MDBs indicates that:
Transmission and distribution (T&D) financing accounted for the largest share
of the MDBs’ sovereign portfolios, ranging from 31 percent to 48 percent of total
support to the public sector. For non-sovereign or private windows, T&D
financing accounted for only 3 percent to 14 percent of total support to the private
sector, reflecting the public sector dominance in this segment of the power
industry in Asia.
Zero carbon investments (EE and RE) accounted for between 20 percent and 41
percent of the total public loans and grants provided by each organization. They
also accounted for a large share, from 39 to 67 percent, of the non-sovereign
financial support. Intermittent (wind and solar photovoltaic) and still high cost RE
(geothermal and concentrated solar power) benefitted from grants and
concessional lending. Examples of grants providers include Global Environment
Facility (GEF), Clean Technology Fund (CTF), Scaling up Renewable Energy
Program (SREP), International Development Association (IDA).
Support to public thermal generation projects accounted for 7 to 23 percent of
respective total sovereign loans. Support to private sector thermal generation
accounted from 3 to 30 percent of total respective support to private sector energy
investments.
Financing of upstream activities (oil, gas and coal) accounted from 2 to 10
percent of total support to public energy projects. They accounted from 6 to 17
percent of total support to private sector. The number of projects and loan amounts
were limited for sovereign and moderate for non-sovereign operations.
Evaluations of completed energy projects by MDBs’ independent audit
departments show that the performance of energy projects has usually been higher
than the average performance of overall portfolio. For the less performing projects,
many of the implementation problems centered around failure to address weak or
inadequate legal, regulatory frameworks and effectively implement institutional
reforms related to corporatization, restructuring and privatization of energy
subsectors.
16. Lessons Relevant to the Bank’s Strategy:
The T&D operations are straightforward in preparation and generally do not raise
controversial or complicated implementation or policy issues. They should
however integrate technological advances to improve management and efficiency
of networks and empower consumers.
14
Investments in RE and EE (especially at the demand side level) are fragmented
and required in most cases access to grants and/or concessional financing. They
require specialized skills and financial intermediation, especially for EE
operations.
Addressing institutional issues requires extensive policy analysis and dialogue,
and the ability to provide technical assistance, often on concessional terms.
There are ample opportunities for investments in oil and gas extraction as clients
seek to improve the security of their energy supplies. However, such projects tend
to involve higher risk and must be subject to thorough assessment.
Objective of the Energy Sector Strategy
17. The objective of the Energy Sector Strategy is to provide the framework, principles,
and operational modalities to guide the Bank’s future energy sector engagement, including
the development of its project pipeline and future sub-sectoral lines of business.
18. The Strategy embraces, and is informed by, the principles underpinning
the Sustainable Energy for All (SE4ALL), the 2030 Agenda for Sustainable Development,
and the Paris Agreement (see Box 1 above). It lays the framework for the Bank to support its
client countries to: (i) develop and improve their energy infrastructure and facilitate their
transition to a less carbon-intensive energy mix; and (ii) meet their goals and commitments
under these global initiatives.
19. The Strategy is consistent with the Bank’s “Lean, Clean, and Green” core values and
its institutional goals. The Strategy embodies the Bank’s three thematic priorities: sustainable
infrastructure, cross-country connectivity and private capital mobilization. Regular
monitoring and reporting of portfolio composition will be an important discipline and help
build a portfolio that reflects the Strategy and is aligned with the Bank’s core values.
Guiding Principles
20. The Energy Sector Strategy is developed around six principles, which will guide the
build-up of the Bank’s energy portfolio during the early years of operation.
21. Principle 1: Promote energy access and security. Lack of access or unreliable access
to energy services deprives the most vulnerable people from availing of economic and other
opportunities to improve their lives. Bank financing for improved energy access and security
will support clients in achieving Sustainable Development Goal 7 (SDG 7). The Bank
proposes to place emphasis on: (i) promoting, directly or indirectly, access to modern energy
by those who currently have little or no access; (ii) improving the reliability of electricity
supply; and (iii) reducing the negative health impacts caused by indoor combustion of solid
fuels. According to the IEA12, achieving universal electricity access for basic human needs
by 2030 (Figure 5) would increase global greenhouse gas emissions by just 1.3 percent.
12 IEA (2009) World Energy Outlook, page 132.

15
Figure 5: Access to Modern Energy Services
Source: Energy for a Sustainable Future – United Nations AGECC. 28 April 2010- New York, page 14.
22. Principle 2: Realize Energy Efficiency potential. International experience and
primary energy forecasts by international institutions indicate that energy efficiency is one
of the major means to achieve global environmental objectives. Prosperity and wellbeing can
no longer be gauged by the consumption of energy but by the services derived from it. Given
the high energy intensity in most non-OECD countries in Asia, the Bank proposes to
cooperate with other MDBs operating in Asia to tap the existing large, but dispersed, potential
for energy efficiency in industry, buildings and transport. Initially, the Bank proposes to focus
on projects that make the most of existing energy infrastructure stocks through: (i)
rehabilitation and upgrade of existing generation plants, and (ii) aggressive loss reduction
and utility-driven energy efficiency programs in power and gas transmission and distribution
networks. Over time, it will also develop financial instruments and engage with potential
financial intermediaries in these areas.
Figure 6: Increased Low Carbon Energy Production
Source: IEA 2016 World Energy Investment
23. Principle 3: Reduce the carbon intensity of energy supply. Energy is the dominant
contributor to climate change, accounting for around 60 per cent of total global greenhouse
gas emissions. The Bank proposes to support clients to reduce the carbon intensity of energy
to help them achieve their long-term climate goals provided in the Paris Agreement.
According to the IEA 2015 World Energy Outlook (see Figure 4 above), energy infrastructure
investments need to be reshaped to meet the Paris Agreement goals:
16
Investments in fuel supply during 2015-40 need to decrease from US$33 trillion in
the Current Policies Scenario (CPS) to US$21 trillion in the 450 Scenario, mainly
through a considerable reduction in oil investments, a sizable reduction in coal
investments, and slightly lower investments in natural gas (although gas investments
will remain significant in all three scenarios);
Investments in power supply during 2015-40 need to increase from $20 trillion in the
Current Policies Scenario and the New Policies Scenario to US$22 trillion in the 450
Scenario. The power sector overall would need to focus more on renewable energy
(which will need to more than double to meet the goals of the Paris Agreement), and
sustained investment in power transmission and distribution (T&D).
The IEA 2016 World Energy Outlook confirmed the message above, and showed that more
ambitious investments would be required for renewable energy and energy efficiency in the
New Policies Scenario and the 450 Scenario.
The Bank proposes to support energy investments that minimize adverse environmental
impacts, and also reflect clients’ individual energy situations (e.g., energy resource
endowment, affordability of capital-intensive investments, security of supply, etc.). During
the transition to a lower carbon intensity energy sector, fossil fuels will continue to play a
significant role in the energy mix of most member countries. The Bank proposes to support
and accelerate its members’ respective transitions toward a low-carbon energy mix through
investments in renewable energy and reduction of carbon emissions from fossil fuels.
24. Principle 4: Local and regional pollution management. The Bank proposes to
support its clients in reducing, limiting and mitigating the deleterious impact of pollution.
Fossil fuel production, transport and consumption have severe negative impacts on the local
environment, especially in Asia’s densely populated cities. Historically, issues related to local
and regional pollution have been addressed mainly by limiting emissions of fossil fuel-based
power generation, especially coal-fired plants. New projects are now being developed by
MDBs to address local pollution specifically and comprehensively, to counter the negative
impacts on health and wellbeing. The Bank proposes to cooperate with other MDBs on these
initiatives.
25. Principle 5: Catalyze private capital. The Bank is committed to promote private
sector investments to help to close the momentous infrastructure investment gaps in
developing Asia. For varying reasons, to date, private capital investments in energy and
infrastructure have been marginal in non-OECD countries, although partial credits,
investment and country guarantees by MDBs have been instrumental in promoting successful
projects in several countries. Innovative approaches have also been initiated using grants and
concessional financing by some countries to reduce the cost of electricity generated under
public-private partnerships (PPP) and/or to improve risk sharing in PPP ventures. The largest
concentrated solar power (CSP) generation project in Morocco supported by the World Bank
and African Development Bank and the geothermal project supported by the World Bank in
Indonesia are representative of the former approach, whereas the envisaged support of a
geothermal PPP project in Nicaragua by the World Bank is illustrative of the latter. The Bank
proposes to: (i) explore innovative models to catalyze private investments, and significantly
increase their contribution to meet the infrastructure needs of countries in Asia, especially
those that are budget-constrained; (ii) build upon successful experiences and lessons learned

17
of MDBs operating in Asia, especially in PPPs, ensuring that the costs and risks are
appropriately shared and distributed; and (iii) explore with clients and private partners new
cooperation modalities to meet country needs. In addition, the Bank proposes to avoid
crowding out the private sector. When pursuing such opportunities, the Bank will evaluate
risk carefully and ensure that appropriate measures are put in place to mitigate and manage
such risks.
26. Principle 6: Promote regional cooperation and connectivity. Regional integration
and cooperation are essential to take advantage of synergies, increase market size to improve
competitiveness, and create a critical mass for cooperative R&D and manufacturing
capabilities. Efforts deployed by MDBs and bilateral organizations in Asian countries and
other regions have had moderate success. The Bank proposes to engage client countries and
pursue regional connectivity of energy systems in Asia, especially power and gas, with a
view to strengthening systems; improving the security and efficiency of energy supply;
optimizing the use of resources; allowing for greater flexibility in their operation; reducing
local, regional and global adverse environmental impacts; and fostering greater use of
renewable energy resources.
Implementation
27. The principles outlined above will guide the Bank’s investment approach in the
energy sector in its early years. As the Bank matures, accumulates experience, and its
portfolio develops, these principles will be reviewed. The review would take into account the
lessons of experience and also integrate the advances in scientific knowledge, technological
progress, and changed economic circumstances.
28. Application of the guiding principles will take into account, to the extent possible,
client countries’ constraints and uniqueness. Bank support to countries will be aligned with
their national energy investment plans/strategies.
Sectoral Approach
29. The Bank’s process for selecting projects will focus on projects that, among others:
improve country and regional connectivity; promote efficiency along the supply chain; and
use proven, transformational, low carbon-intensity technologies that are economically and
financially viable.
30. Power transmission and distribution. Power grid infrastructure development will be
an essential component of the Bank’s connectivity strategy and to promote regional
cooperation. Support for the development of transmission and distribution infrastructure
remains indispensable to ensure transfer of generated electricity to demand centers without
the bottlenecks and high losses that are hampering economic growth in many Asian countries.
MDBs operating in the region have deployed great efforts but substantial investments are still
needed to achieve SDG 7 and SE4ALL of access to modern energy and allow smooth RE
integration in power systems.
31. In 2015, global investments in transmission and distribution amounted to US$262
billion, or about 15 percent of total infrastructure investments. They are expected to increase,
as greener infrastructure will require increased support to renewable energy sources, which
are generally far from load centers. International experience also indicates that strong

18
transmission networks allow higher penetration of intermittent renewable energy. In common
with most MDBs, lower risk T&D projects are good vehicles for the Bank to build its project
pipeline in the early years of operation. Support for power T&D is expected to be one of the
core areas for Bank interventions, alone or in association with other multilateral or bilateral
institutions. The Bank proposes to support: (i) new T&D projects to increase power systems’
resiliency to natural disasters, and assist member countries in “leapfrogging” to smart
metering and other digital solutions to empower consumers, and manage the system
efficiently; and (ii) rehabilitation and reinforcement of existing networks to increase their
resiliency to natural disasters, reduce technical losses, allow smooth integration of
intermittent RE and improve reliability of supply.
32. Energy Efficiency (EE) investments. Figure 4 above shows that limiting the world’s
rise in average temperature to “well below 2 degrees Celsius above pre-industrial levels”
(450 Scenario) would require more than doubling global energy efficiency investments.
Demand-side EE investments are in most cases economically justified but financially
challenging because of pervasive subsidization of fossil fuels and electricity. They are also
usually small and fragmented. The implementation requires financial intermediation and
capacity building, as indicated by the most successful public or private sector projects
implemented by MDBs to date. Investments in energy efficiency (especially housing and
small and medium enterprises) are generally small-scale and might require retailing channels
and specific financial instruments (such as financial intermediary loans) and technical
assistance to build client capacity. Most EE activities undertaken by MDBs have been
supported by grants to build the capacity of financial intermediaries to evaluate potential EE
projects and monitor achievements during their implementation. At present, the Bank does
not provide technical assistance either on its own or associated with lending. It will look to
cooperate with multilateral, bilateral and other partners to address this constraint.
33. The Bank proposes to proactively support generators and utilities to: (i) improve the
use of existing electricity generation stocks through rehabilitation to reduce fuel consumption,
introduce predictive maintenance methods, and upgrade of the regulation systems; (ii)
develop and implement loss reduction programs at all levels of the electricity supply chain
and demand side management programs; (iii) design and implement utility-driven final use
efficiency initiatives, such as green lighting, improvement in insulation of buildings; and (iv)
enhance the efficiency of district heating networks and extend them to meet the need of
rapidly urbanizing cities. While developing the skills and approaches to develop own
portfolio, the Bank proposes to partner with MDBs and bilateral agencies operating in the
region to scale-up efficiency programs.
34. Renewable energy (RE) investments. RE investments are essential to limit CO2
emissions. The Bank will support clients to develop intermittent RE—wind, solar
photovoltaic (PV), hydropower—to reduce fossil fuel consumption and increase access to
modern energy through decentralized generation, and mini- and micro-grids. Moreover, data
collected to date indicate that: (i) out of the 20 countries with the largest wind potential, only
4 are in Asia; (ii) out of the 20 countries with the largest solar potential, 8 are in Asia; and
(iii) about two-thirds of the hydropower potential in Asia is untapped. Currently, the Bank
does not manage trust funds. Therefore, to further RE development in client countries, the
Bank proposes to proactively:

19
support hydropower that is technically, economically, financially, environmentally and
socially viable, in a manner consistent with the provisions of the Bank’s Environmental
and Social Framework (ESF) and lessons learned from other MDBs operating in Asia
and elsewhere. Development of hydropower, of all scales, in an environmentally and
socially sound manner could make an important contribution to sustainable energy
supply. This includes multi-purpose and run-of-the-river hydropower investments. The
Bank has already engaged in co-financing the upgrading of generation capacity and
rehabilitation of existing hydropower infrastructure to improve efficiency and dam
safety. It will continue to pursue such capacity upgrading, rehabilitation and dam safety
opportunities at existing facilities as they arise. When appropriate, the Bank proposes to
consider supporting hydropower development through two-stage loans: a first phase loan
to support thorough project preparation and a second phase loan to support the actual
investments.
support intermittent centralized and decentralized RE generation. For wind and PV, the
Bank proposes to build partnerships with other MDBs/bilateral agencies operating in
Asia, and seek access to grants from global funds and partners, to improve the financial
viability of investments in intermittent renewable technologies, and share associated
risks. The Bank proposes to also promote distributed generation (e.g. mini- and micro-
grids) to reduce burdens on centralized systems, increase RE penetration, and improve
reliability of power supply.
support selected countries (including possibly high-income countries with sizable
intermittent RE resources and the financial capacity to support them) to develop
innovative and transformative projects, particularly solar with adequate storage. The
Bank proposes to explore the development of transformative, but still high-cost,
technologies such as concentrated solar power (CSP) to contain consumption of fossil
fuels and help create a market of scale for such technology. The latter could be done
through increased cooperation among Asian countries to tap the synergy of the regional
technological and manufacturing capabilities to make the announced development
programs more affordable and replicable at lower cost in other regions.
support the development of the significant geothermal resources identified in many
Asian countries, alone or in partnership with other MDBs, through the development of
new approaches to reduce resource risks. Sovereign loans to governments or state owned
entities could be considered to confirm resources prior to requesting private sector
proposals for power generation or novel PPP approaches based on appropriate resource
risk sharing.
35. Local and regional pollution management. Stand-alone local and regional pollution
management projects represent an emerging new business line for MDBs operating in Asia.
These projects address the debilitating impacts of local and regional pollution on Asian
economies and populations. Economic valuations of local environment externality costs are
country- and even region-specific. They require detailed studies of the negative impacts of
pollution on the economy and health of the population, as well as a broad range of economic
assumptions, including sensitive assumptions such as the valuation of lost lives. The results
of high quality studies carried out in developed and some developing countries can, under
carefully determined assumptions, be transferred to Asian countries where fewer studies have
20
been carried out. The Bank proposes to assist client countries in reducing local and regional
pollution, in partnership with MDBs and bilateral agencies. Over time, it will consider
developing multi-sectoral approaches and instruments that contribute to the cleanup of Asia’s
highly polluted cities and/or regions. These could include initiatives addressing the problems
of acid rain (SO2), PM2.5, and smog, etc.
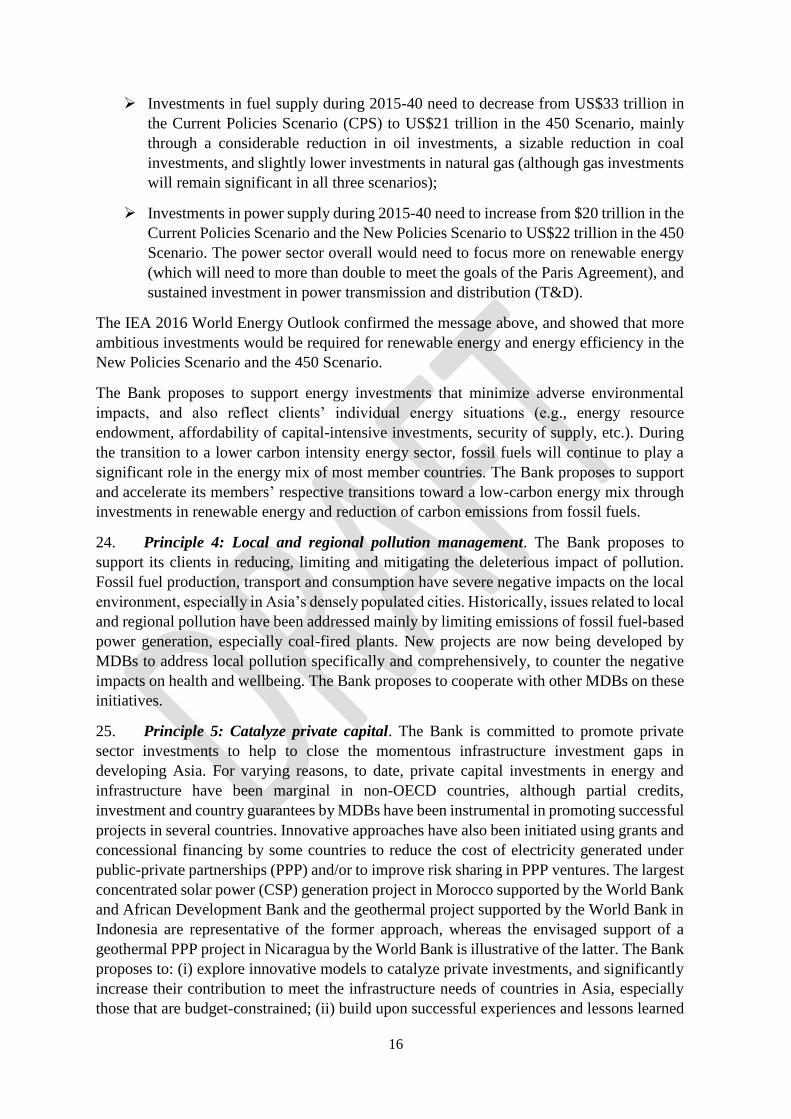
36. Fossil fuel power generation investments. Carbon intensity of power generation
investments in 2015 was more than 4 times the level required to reach climate change
stabilization in the next two decades (See Figure 7). While fossil fuels will continue to play
a significant role in the energy mix of most of its member countries, the Bank focuses on
supporting and accelerating its members’ respective transitions toward a low-carbon energy
mix including lower-carbon emissions from fossil fuels. The Bank would finance
investments that are demonstrably compatible with a county's transition toward sustainable,
low-carbon energy and internationally agreed targets. Supported fossil fuel based generation
facilities would be expected to use commercially available least-carbon technology. In many
countries, gas-fired power generation would form part of such transition. Carbon efficient oil
and coal-fired power plants would be considered if they replace existing less efficient
capacity or are essential to the reliability and integrity of the system, or if no viable or
affordable alternative exists in specific cases, particularly in low income countries.
Figure 7: Investments in the Electricity Sector (2015)
Source: IEA World Energy Investments 2016
37. Oil and natural gas processing, transportation and distribution. Private sector
involvement is more likely here than in other subsectors, as international oil and gas
companies have the technology and financial strength to support such projects in many cases.
In some countries in Asia, national oil and gas companies also are active in these subsectors
and governments may express interest in Bank financing. The Bank proposes to support such
investments provided that they improve energy security or promote regional integration and
trade. The Bank proposes to also consider development, rehabilitation and upgrading of
natural gas transportation (including storage) and distribution networks, and controlling gas
leakage, to foster greater penetration of gas during the transition to a “less CO2 intensive”
energy mix/power sector, especially in Asia where such penetration is low compared to other
regions.
38. Nuclear power generation. Financing of nuclear plants will not be considered by the
Bank. Should demand arise for very special cases of support in safety
enhancement/upgrading, the Bank could possibly consider engagement.

21
39. Adaptation projects. Climate change adaptation is emerging as an MDB business line
in association with grant facilities, such as the Green Climate Fund (GCF), Global
Environment Facility (GEF) and climate change trust funds. A recent study 13 on
infrastructure finance noted “it was estimated that between 10 and 15 percent of the (future)
required infrastructure investment could be attributed to making such investment (including
adaptation) sustainable, by ensuring lower emissions, higher efficiency and resilience to
climate change.” The Bank proposes to partner with MDBs and bilateral partners to support
such efforts in the Asian countries most threatened by climate change.
Cross-Cutting Issues
40. Global environmental and sustainable energy for all goals and principles are widely
accepted and embraced by other MDBs and clients, however, their application is not always
straightforward. Green energy investments require: (i) new approaches to evaluate their
economic viability because they may not be economically justified according to the
assumptions traditionally used by most MDBs; (ii) highly skilled and diversified teams and
a solid knowledge base; and (iii) effective coordination among sectoral teams within the
financing institutions to meet client needs efficiently. These issues are discussed below.
41. Developing a solid base for economic evaluation. The economic evaluation of
energy projects raises issues relating to the assumptions used for discount rates, carbon price
and externality costs of local pollution used in economic evaluations of projects, such as: (i)
high discount rates indicate a strong preference for the present; (ii) low carbon prices
underestimate the economic impacts of climate change; and (iii) low local and regional
pollution externality costs lead to pollution levels beyond the absorption capacity of the
environment, as experienced in most Asian cities. The Bank proposes to use an appropriate
discount rate and shadow price for carbon emissions and other externalities in its economic
evaluation of projects to determine their economic viability. Considering the lack of
consensus about a discount rate and carbon price, the Bank proposes to test the robustness of
its economic analyses using a range of different discount rates and carbon prices.
42. Building highly skilled multi-disciplinary team. Highly skilled teams are a
prerequisite to developing a strong and diversified energy portfolio. In line with its lean
approach to staffing, the Bank proposes to progressively build a highly skilled and diversified
team of staff and consultants with recognized expertise in technical, economic, financial,
environmental and social aspects of project conception, preparation, evaluation and
supervision. For example, strong hydropower technical expertise and highly qualified
environmental and social specialists are needed to engage with clients in developing large
hydropower schemes. High quality staff/consultants directly contributes to successful project
outcomes and a high quality portfolio. During the implementation of the Strategy, the Bank
proposes to focus on developing and deepening its sectoral expertise and knowledge. In the
early stages of its energy portfolio development, the Bank proposes to build partnerships with
other MDBs, private financial institutions, think tanks and academia to ensure that its energy
team has timely access to existing knowledge bases and sectoral developments. The Bank
also recognizes the importance of a supportive policy environment to project success. In the
13 A. Bhattacharya, M. Romani and R. Stern: Infrastructure for Development: Meeting the Challenge (London
School of Economics - 2012)
22
early years of operations, the Bank would not support policy-based financing instruments
and programmatic or sector loans. Over time, it may develop performance-based lending
instruments that are tailored to client needs and circumstances.
43. Promoting collaborative approaches among infrastructure subsectors. In
developing its portfolio, the Bank proposes to promote holistic approaches to energy sector
development. The Bank aims to: (i) ensure that its other sector strategies recognize the
importance of energy and incorporate energy efficiency in the Bank’s core business; and (ii)
promote intra-sectoral collaboration to meet client needs in the most efficient way and
maximize synergies among the different sub-sectors. Examples may include: EE and
sustainable urban infrastructure, including energy efficient buildings; transport sector
initiatives that improve carbon and energy efficiency outcomes; multi-purpose dams with the
agriculture, industrial and urban sectors; and access to modern energy within the rural
development and agriculture sectors.
Results Monitoring Framework
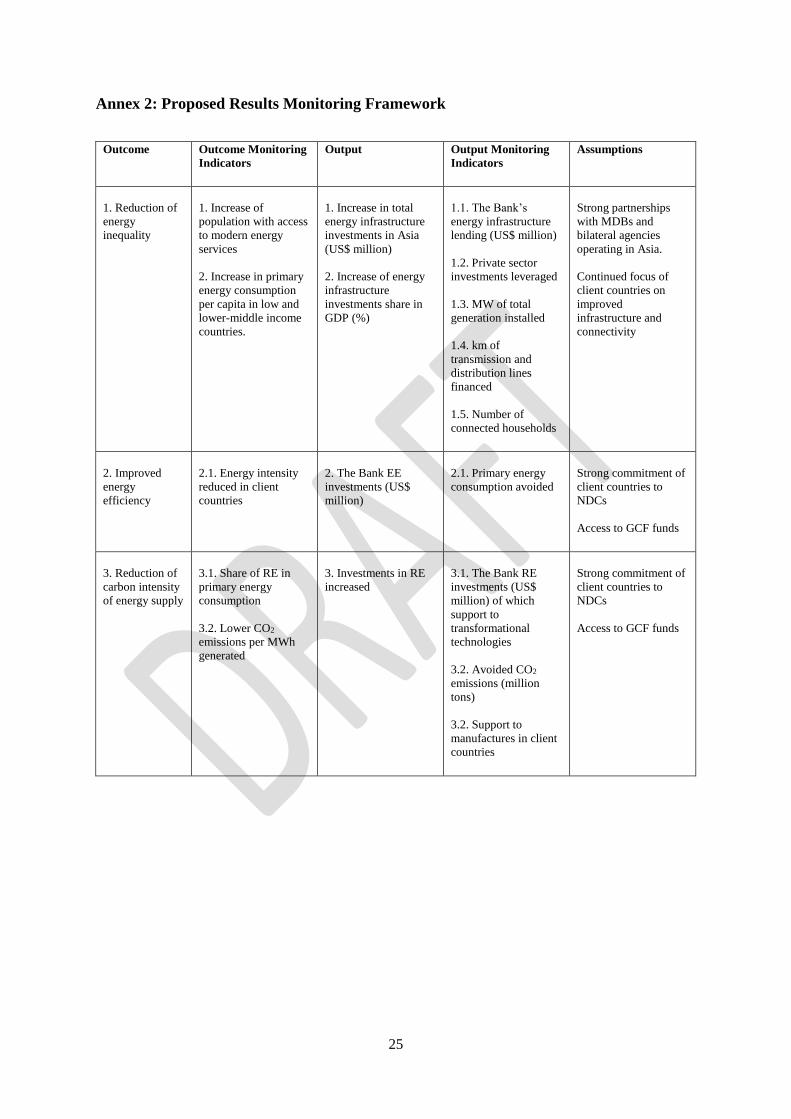
44. The Bank proposes to monitor outcome and output indicators to assess the alignment
of its evolving energy portfolio with the Strategy principles. A proposed Results Monitoring
Framework is attached in Annex 2.

23
Annex 1: Definitions for Asia and Region and Income Classification
In this document, references to “Asia” and “Region” includes the geographical regions and
composition classified as Asia and Oceania by the United Nations. This definition does not
include Russia. However, Russia is a regional member of AIIB and therefore is listed
separately, and additionally, in various places in this document. In this analysis, the Asian
countries are broadly divided into 3 groups:
Five Members of the Organization for Economic Co-operation and Development (OECD).
They are Japan and South Korea from Eastern Asia, Australia and New Zealand from
Oceania, and Israel from Western Asia.
Three individual countries - China, India (Non-OECD) and Turkey (OECD), are examined
separately from their regions because of their size or their different energy characteristics.
The Rest of Asia, which is defined as Asia excluding 6 OECD countries, China and India.
The Rest of Asia is then classified into six sub-regions: Eastern Asia, Southern Asia,
Southeastern Asia, Central Asia, Western Asia and Oceania, according to the geographical
classification adopted by United Nation Statistics Division (UNSD) (see Figure A.1).
Regionally, 23 countries/territories are in Oceania, 16 in Western Asia, 11 in Southeastern
Asia, 8 in Southern Asia, 4 in Eastern Asia, and 5 in Central Asia.
Figure A.1: UN Geo-scheme of Regional and Sub-Regional Groups
Note: Statistical regions as defined by UNSD. Antarctica is omitted.
Source: CC BY-SA 3.0 based on geographical subregions and breakdown by country information obtained
from unstats.un.org/unsd/methods/m49/m49regin.htm
The Asian countries can also be grouped into four income classes according to World Bank
Income Classification Criteria14. As illustrated in Figure A.2, there are 3 countries /
territories classified as low-income; 26 as lower-middle-income; 20 as upper-middle-
income; and 19 as high-income15.
14 Low-income economies are defined as those with gross National Income (GNI) per capita, calculated with the
World Bank Atlas method, of US$1,025 or less in 2015; Lower-middle-income economies are those with a GNI
per capita between $1,026 and $4,035; Upper-middle-income economies are those with GNI per capita between
$4,036 and $12,475; and high-income economies are those with GNI per capita of $12,476 or more.
Source: datahelpdesk.worldbank.org/knowledgebase/articles/906519 15 68 countries/territories in total as data of the remaining 7 Oceania countries are not available from World Bank
database.

24
Figure A.2: Income Classification of Countries in Asia
25
Annex 2: Proposed Results Monitoring Framework
Outcome Outcome Monitoring
Indicators Output Output Monitoring
Indicators
Assumptions
1. Reduction of
energy
inequality
1. Increase of
population with access
to modern energy
services
2. Increase in primary
energy consumption
per capita in low and
lower-middle income
countries.
1. Increase in total
energy infrastructure
investments in Asia
(US$ million)
2. Increase of energy
infrastructure
investments share in
GDP (%)
1.1. The Bank’s
energy infrastructure
lending (US$ million)
1.2. Private sector
investments leveraged
1.3. MW of total
generation installed
1.4. km of
transmission and
distribution lines
financed
1.5. Number of
connected households
Strong partnerships
with MDBs and
bilateral agencies
operating in Asia.
Continued focus of
client countries on
improved
infrastructure and
connectivity
2. Improved
energy
efficiency
2.1. Energy intensity
reduced in client
countries
2. The Bank EE
investments (US$
million)
2.1. Primary energy
consumption avoided
Strong commitment of
client countries to
NDCs
Access to GCF funds
3. Reduction of
carbon intensity
of energy supply
3.1. Share of RE in
primary energy
consumption
3.2. Lower CO2
emissions per MWh
generated
3. Investments in RE
increased
3.1. The Bank RE
investments (US$
million) of which
support to
transformational
technologies
3.2. Avoided CO2
emissions (million
tons)
3.2. Support to
manufactures in client
countries
Strong commitment of
client countries to
NDCs
Access to GCF funds


![[AIIB Conference] 세션1 오영일 · 2015-11-19 · 7. Big Data 분석을통한키워드 중국E&C 기업 경쟁력Upgrade AIIB 포함, MDB 활용가능성大 수원국정부 Leading](https://static.documents.pub/doc/80x56/5ed8bbc76714ca7f47687864/aiib-conference-1-2015-11-19-7-big-data-eoeoeeoe.jpg)


