44
Aiming At a Moving Target Managing inflation risk in target date funds

Aiming At a Moving TargetManaging inflation risk in target date funds

About J.P. Morgan Asset Management—Global Multi-Asset Group
The Global Multi-Asset Group (GMAG) has been managing portfolios on behalf of institutional
investors including defined contribution and defined benefit pension plans, endowments and
foundations, for over 30 years. GMAG, which consists of 43 investment professionals with an
average of 15 years of industry experience, combines its capital markets, strategic and tactical
asset allocation, portfolio construction and active risk budgeting capabilities with one of the
broadest product offerings in the industry.
J.P. Morgan’s sources of performance extend across asset classes, geographies and proven
investment methodologies. This global product palette provides GMAG’s experienced investment
specialists with access to the ideal, low correlation building blocks necessary for structuring
efficiently diversified portfolios.
SmartRetirement, our target date program, provides defined contribution plan sponsors and
participants with defined benefit quality investment solutions. The GMAG management team
combines the skills and asset classes to which our most sophisticated defined benefit plans have
access, with over 20 years of insights on participant behavior, resulting in portfolios which help
plan participants achieve their retirement savings goals.

J.P. Morgan Asset Management | 1
Foreword
Over the past several years, target date funds have become more popular and complex, reflecting advanced thinking on asset class diversification. At the same time, the investing environment has become more challenging and volatile—particularly with regard to inflation.
It was not so long ago that investors were focused on the pos-sibility of an inflation shock. Now the pendulum has swung all the way back, with investors uncertain as to which inflationary environment to anticipate.
It is too early to tell where current trends will take us, but this rapid swing in both the rate of inflation and investor expecta-tions creates a valuable opportunity for us to re-examine our notions of inflation risk, and to help target date fund sponsors bring a strong fiduciary foundation to the challenge of inflation protection.
Specifically, this paper explores the challenge of translating the need for individual inflation protection into a pooled fund vehicle, such as forging an effective link between individual in-
vestor objectives and appropriate fiduciary decisions on behalf of the entire investor pool.
This analysis is an extension of previous target date research in our Ready! Fire! Aim? series, in which we discuss target date investing as a balance between maximizing upside potential while minimizing the risk of downside outcomes. As fiduciaries, we believe that an appropriate target date strategy will place more emphasis on downside protection, and we see inflation risk, which is really the risk of negative real returns, as part of this challenge.
We should note that this is not a theoretical paper meant to elucidate the causes or characteristics of inflation. In this paper, we offer a practitioner’s view of inflation risk, regardless of its specific manifestations, i.e. high or low, short-term or long-term, secular or cyclical, and propose potential solutions for portfolio construction.
In sum, we found that inflation presents a risk in all its forms. Therefore, the most appropriate framework for addressing inflation risk is not one that views inflation as a one-off shock, as many investors believe, but rather one that incorporates it as a recurring cyclical phenomenon.
We believe that adopting this kind of “all season” approach to portfolio construction is the first and most important step that investors can take in identifying their specific inflation vulner-abilities and then devising appropriate solutions.
As always, we appreciate your support and welcome any feedback.
Sincerely yours,
Anne Lester Katherine Santiago
Anne Lester Katherine Santiago, CFA Senior Portfolio Manager Quantitative Research Analyst Global Multi-Asset Group Global Multi-Asset Group

Inflation HeadlinesA tale of many reversals
6%
5%
4%
3%
2%
Headline CPI, Bureau of Labor StatisticsThe above chart is shown for illustrative purposes only.
1%
Jan 04 May 05 Sept 06 Jan 08Sept 04 Jan 06 May 07 Sept 08 Oct 08May 04 Sept 05 Jan 07 May 08Jan 05 May 06 Sept 07 Nov 08 Dec 08
Strategies: Rising Inflation and Rising Stocks? Why Not? (NY Times)
June 04
Jitters About Inflation Put Investors In a Selling Mood (NY Times)
February06
Stocks Tumble on Inflation Worries (Business Week)
May06
April07
0

U.S. Future Inflation Gauge Plummets to Six-Year Low (Seeking Alpha)
Fed’s Bernanke Says Inflation Problems Moderating (Forbes.com)
Inflation Jumps, Retail Slumps in September (CNBC)
Don’t Worry About Inflation (Wall Street Journal)
Jan 04 May 05 Sept 06 Jan 08Sept 04 Jan 06 May 07 Sept 08 Oct 08May 04 Sept 05 Jan 07 May 08Jan 05 May 06 Sept 07 Nov 08 Dec 08
Inflation’s Bite Lets Up a Bit (USA Today)
May07
Bernanke Maintains That Inflation is a Big Risk (CNN)
November06
Inflation Moderates in 2006, Wages Up (Washington Post)
January07
Inflation Takes aBackseat—for Now (Business Week)
September07
October08
September08
Stocks Rise as Investors Set Aside Inflation Concerns (USA Today)
February08
Inflation Concerns Weigh on Investors (Chicago Tribune)
June08
Fear of U.S.Inflation Rises (Forbes)
April07 Fuel Prices Aside,
Inflation Is Tame (NY Times)
June07

4 | Aiming At a Moving Target—Managing inflation risk in target date funds
1 Foreword
5 Overview
9 Inflation Risk A new way of thinking
9 Time horizon
10 Inflation cycles
11 Business cycles
12 Unexpected risk
13 Inflation Basics Prerequisites to effective protection
16 Hedging Tools and Strategies A review of traditional asset classes
21 Hedging Tools and Strategies A review of real assets
21 Commodities
23 TIPS
26 Real Estate
29 Issues for Target Date Funds
31 Who is most vulnerable?
31 How long does inflation risk persist?
34 The role for real assets
34 Addressing residual risk
35 Glide path diversification
36 Conclusion
37 Appendix
37 Appendix 1: Historical TIPS index returns
37 Appendix 2: Commodities index alternatives
38 Appendix 3: Data sources
Table of Contents

J.P. Morgan Asset Management | 5
The Chinese proverb says, “May you live in interesting times.” This is especially true where inflation is concerned.
Just a quick skim of news headlines from the past few years shows a record of reversals, not just in inflation numbers, but in fears and expectations, too. As inflation fears were peaking, one of investors’ chief concerns was building some form of infla-tion protection into their portfolios, an inflation hedge, in the language of investing.
But, in the wake of widespread stress in the financial sector and increasing prospects for a prolonged global economic slow-down, inflationary pressures have eased. Does that mean the need for protection has passed? What should investors do with their inflation hedging positions? Will there be a continued role for these assets during times of moderate to low inflation?
Such questions highlight a major weakness in the way institu-tions address inflation risk. Investors often see inflation risk as a rapid inflationary spike to 5% or higher, rather than a long-term challenge that can negatively affect portfolios when inflation is both high and low.
Furthermore, what we do not know about inflation can be more dangerous than what we do know. That is, the drivers of inflation change from one period to the next; and the effects of inflation never look exactly the same from regime to regime, in part because policy responses to inflation have evolved. So, we can never entirely predict how different asset classes will react to inflation in the future. This challenge is even more difficult for some of the favored hedging asset classes, which have no historical track record in periods of high inflation.
Despite such uncertainties, we believe that the current situation presents a perfect opportunity to re-examine broader questions about inflation as it relates to portfolio design.
As practitioners and fiduciaries, we seek to protect investors across all inflationary environments. And because we cannot
effectively predict them, we believe the most pragmatic approach is to be agnostic as to inflation’s causes and char-acteristics. It is from this point of view that we consider the following four issues:
How significant is inflation risk in historical or empirical •terms?
How should an investor define inflation risk to a specific •portfolio?
How can investors accurately assess the cost of inflation •protection?
Is there one optimal hedging strategy or asset?•
Our goal in asking these questions is to construct an “all sea-son” framework for inflation protection that can be utilized by target date investors all along the glide path, as well as to sug-gest “all season” approaches for other types of investors.
Overview

6 | Aiming At a Moving Target—Managing inflation risk in target date funds
Our analysis of the data reveals five main findings:
• Cyclicality: Empirical evidence suggests that the proper framework for viewing inflation risk is that of cyclicality, i.e. small episodic movements of increasing or decreasing infla-tion, or larger regime shifts from prolonged periods of mod-erate inflation to periods of extreme and volatile inflation.
We identified three key issues that should inform any effort to mitigate inflation risk:
– Inflation spikes are, in historical terms, relatively rare—inflation typically remains contained, interrupted by short bursts of moderate inflation.
– Every asset has unique inflation cycle sensitivities—varia-tions in performance depending on whether inflation is high or low, rising or falling.
– Each asset used for inflation protection may have its own performance cyclicality—bubbles and bear markets that form quite independently from changes in inflation.
Therefore, overweighting a portfolio with a single hedging asset—to gain protection in a specific inflationary scenario—could create significant problems later as the portfolio encoun-ters other inflationary cycles and economic regimes.
Inflation shocks are not the biggest risk:• Data indicate that the most common inflation risk scenario is a period of low inflation combined with a bear market, producing negative real returns. The risk of negative real returns happens most commonly during periods of low inflation, not high inflation.
Insurance against unexpected inflation:• In the long run, an asset’s expected return will have inflation expectations embedded in it, paying the investor a premium for bearing that risk. So inflation risk is really the risk of short-term un-expected inflation that is not compensated by the embedded premium. Investors can anticipate and protect against such risks, but must understand that every insurance policy has a cost during those times when the hedge is on, but inflation is not.
No risk-free hedge:• Likewise, every inflation protection strategy carries with it specific asset class risks. And because narrow solutions do not work consistently, we believe that there is no such thing as a risk-free hedge. Inflation protec-tion strategies should be diversified and designed within the
There is no single optimal
hedge that suits all investors,
just as there is no risk-free
hedge.
Protecting a portfolio from
inflation risk must be sub-
ordinate to each investor’s
goals and constraints, and
must be part of an overall
portfolio construction
process, just like any other
risk management program.

J.P. Morgan Asset Management | 7
context of the investor’s total objective. Only in this way can one gain effective inflation protection without compromising the portfolio’s other goals, such as liquidity, return targets and volatility constraints.
Narrow solutions are inappropriate:• A single, simplistic hedging strategy cannot account for all of the variables in inflation risk, such as cyclicality of inflation regimes, their correlation to the business cycle, the wide variance in asset performance under different inflationary regimes and the po-tential costs of having the wrong hedge on at the wrong time.
We believe that an “all season” approach—based on strong, empirical analysis—is optimal for managing inflation risk across all of its cycles, up and down, long and short. And as is the case with most investment challenges, diversification should be the watchword, as it provides the greatest protection not just from inflation in all its forms, but from many of the risks embedded in certain hedging strategies themselves.
Investors should customize their inflation protection strategies based on individual objectives and time horizon. These variables can be used to determine which parts of the inflationary cycle pose the greatest threat to their goals and objectives.
What is most beneficial to investors is to start with the broadest possible view of inflation risk, identify specific vulnerabilities in relation to their goals, and then position the portfolio accord-ingly. Once these specific vulnerabilities are known, then over-weighting specific approaches may prove optimal for specific investors.
A Word About DeflationAs this paper goes to press, headline inflation has dropped rap-idly from 5% to 0% in less than three months, and it is trending toward the negative. Given this news, it is appropriate to add a few observations about deflation, which can be significantly different from other inflationary environments.
First, this swift decline highlights the fact that it is difficult to predict the ever-changing path of inflation. It is also a sobering reminder that over-reliance on what we know from history, par-ticularly recent history, can mislead efforts to protect against future inflationary trends.
Second, with respect to what we do not know, when it comes to deflation, what we do not know is a great deal. There are few, if any, reliable guideposts:
•ComparisonswiththelastdeflationaryenvironmentintheU.S. (the Great Depression) are neither particularly relevant, nor helpful. There is insufficient data from this period—too few asset classes traded in large volume at that time—to draw any statistically viable conclusions regarding how diversifying assets may react to a deflationary period today.
•Likewise,comparisonstoJapanmaybeinappropriate.Japanentered a deflationary environment in the late 1990s, and it has lasted well over a decade. While the government has been combating the issue ever since, its policy response can be viewed as “too little, too late,” to have been effective: policy-makers kept monetary policy tight and used a fiscal stimulus only. The U.S., on the other hand, has shown a marked prefer-ence for quick monetary easing. In addition, demographic dif-ferences are significant: a growing U.S. population (including immigration) can be expected to help demand growth and mitigate declining prices.
What we do know is that deflation can move quickly into and out of inflation. More important than deflation itself is the government’s monetary and fiscal response.
For this reason, we believe that a highly diversified, low volatil-ity portfolio will best help investors weather an inflationary or deflationary storm. Such an approach appears to be the least risky method of navigating the uncertainties and unknowns of any emerging deflationary environment.

8 | Aiming At a Moving Target—Managing inflation risk in target date funds
Inflation: What is it? How is it measured?INFlAtION: The increase in the cost of goods over time “A continuing rise in the general price level usually attributed to an increase in the volume of money and credit relative to available goods and services” (Merriam-Webster).
The causes of inflation can vary, but can be grouped roughly into two categories: monetary-driven versus price-driven inflation. The former is caused by excess money supply being pumped into the market, devaluing the currency. As the currency quickly depreciates, more money is needed to purchase the same amount of goods or services, causing prices to rise. Price inflation is caused by supply-demand imbalances, where the money supply may be relatively stable, but a shortage of supply, or a spike in demand, may cause the price of an asset to increase. Price increases in assets such as commodities can flow through to other goods, leading to general inflation.
CONSuMer PrICe INDex (CPI): An index that measures price changes of a basket of consumer goods, most often measured from one year to the next (or year-over-year) and adjusted for seasonal increases, such as the winter holidays or summer vacation travel. The basket changes over time to reflect the typical household’s spending patterns. CPI is published by the Bureau of Labor Statistics (BLS).
HeADlINe CPI: The full CPI index including food cost and energy represents aggregate price changes that impact most consumers. Many assets are tied to this measure of inflation, i.e. TIPS returns are adjusted by headline CPI.
COre CPI: A CPI-based measure that removes two categories that are most commonly affected by temporary price shocks: food and energy. Core is considered a better long-term measure of underlying inflation as it focuses on less volatile inflation components that are easily measured by the average consumer, such as housing, apparel, medical care and entertainment. The Fed focuses on a core inflation measure to adjust its monetary policy. Cash rates, which are targeted by the Fed, then adjust with increases in core inflation.
uNexPeCteD INFlAtION: Unexpected inflation can be caused by a temporary price shock that can quickly drive up prices. For example, a hurricane in the gulf coast that severely damages oil rigs or refineries can cause a spike in oil prices, which then flows into headline CPI. These price shocks are difficult to anticipate but are often a short-term concern.
INFlAtION vS. StANDArD OF lIvINg: Inflation risk is often viewed as loss of purchasing power, i.e. higher prices for the same or equivalent products. Inflation figures deliberately exclude higher expenditures for improved products such as replacing an old CRT television with a flat-screen TV. The new product may be more expensive, but it is fundamentally a different product, and so a large part of the increase in cost is not considered as part of inflation.
DISINFlAtION vS. DeFlAtION: Disinflation is a reduction of the rate at which prices are increasing from one year to the next, i.e. a slowing in the rate of inflation. Deflation is negative price growth and can have a devastating impact on the economy.

J.P. Morgan Asset Management | 9
We believe that framing the issue of inflation risk correctly is critical to managing it effectively. So we begin with a few key observations about investor objectives and the behavior of inflation itself.
A. Time horizon: The most critical variable
If an investor has a long time horizon and can withstand volatil-ity, then inflation will most likely not be an issue. The portfolio should have enough time to ride out inflationary cycles.
As all assets can be volatile in the short-term, the investor is likely to be less successful in keeping up with inflation over shorter holding periods than over longer ones. Therefore, the most important task in hedging inflation is to establish a refer-ence point with respect to time horizon.
For example, consider the historical batting averages versus inflation of a range of traditional and alternative assets. Exhibit 1 shows the frequency of beating inflation over multiple rolling periods. As the time horizon approaches rolling 10-year periods, the frequency with which all these assets have histori-cally beaten inflation approaches 100%.
The first thing to note here is that the relationships of these assets to inflation are not linear. For some assets, like commodi-ties and direct real estate, the frequency of beating inflation actually declined as the horizon extended before resuming an upward course. These performance aberrations may be explained by several short periods of underperformance, or a single period of prolonged negative real returns, such as real estate in the 1990s.
Second, though all assets fall below 100% frequency in periods shorter than 10 years, we did not find a single time period in which all assets failed to beat inflation. In every time period at least one asset achieved that goal. So investors with diversified portfolios will likely have at least one asset beating inflation.
And finally, simply measuring the frequency of the shortfall tells the investor nothing about magnitude. Even periods in which an asset or portfolio shows a high frequency of beating inflation or in the rare period where it fails to beat inflation, the shortfall could still be extreme and dangerous.
With respect to one of the core approaches to inflation hedging, real assets, it is important to note that time horizon may play a key role in assessing utility. Though real assets can have great inflation fighting benefits, especially for horizons longer than five years, investors with shorter time horizons may not be able to tolerate their volatility.
The good news is that a well-diversified portfolio can help inves-tors achieve their inflation protection objectives. And while real assets can be a valuable component of such strategies, other types of assets can help as well.
Inflation RiskA new way of thinking
% P
roba
bilit
y
* Sources: please refer to appendix 3 on P. 38
50
60
70
80
90
100
Quarterly 1 year 2 years 3 years 5 years 10 years
Direct real estateCommoditiesU.S. Core Fixed IncomeREITsU.S. Large Cap Equity
ExHIBIT 1: PROBABILITY OF BEATING INFLATION OVER ROLLING PERIODS*
Holding Period

10 | Aiming At a Moving Target—Managing inflation risk in target date funds
B. Inflation as a cyclical risk
We believe that investors should treat near-term inflation risk in much the same way they treat other cyclical market risks.
Exhibit 2 shows year-over-year headline CPI from 1927 to 2008. In it we see that there are discrete episodes when inflation was “out of control”, i.e. spiking well above 5%. There were five periods in which it peaked at 10% or well above it, and there were three other periods in which it peaked just above 5%. That is just eight shocks in more than 80 years.
Such episodes are by far the exception, not the rule. The far more common scenario, accounting for approximately two thirds of inflationary episodes, was a short period in which the increase in inflation was moderate and then corrected relatively quickly.
We should note here that one approach to understanding inflation focuses on its super-cyclical (or secular) tendencies—regimes lasting a decade or longer. In recent history, such regimes have featured long cycles of relatively contained inflation, with smaller cycles moving in a tight range. There have also been extended periods, such as the 1970s through the early 1980s, or the 1930s-1940s, in which inflation was very volatile and spiked to significant levels before falling.
Not only does the volatility of inflation change over time, the causes of inflation in these super cycles also change. We have seen long periods (in the 1970s) when inflation was driven by price shocks, specifically by oil. In other periods, inflation has been more driven by monetary policy, such as in the 1940s.
But whether the inflationary regime is a long one or a short one, the implications for practitioners are the same: inflation is cyclical. It is not always under control, but it is not always out of control either.
Inflation’s cyclical nature highlights a deep flaw in today’s most common approach to managing inflation risk, which worries about inflation only when it’s on the rise and ignores it when it appears under control or is falling.
This simplistic approach can be inadequate, or even dangerous, as it causes investors to focus too heavily on assets that lead inflation, which perform well when inflation is high and rising. Unfortunately, such assets tend to lead inflation on the way down as well, performing poorly when inflation begins to fall.
ExHIBIT 5: FREqUENCY OF INFLATION REGIMES*
Contained Inflation Inflation Shocks
High and rising High and falling
Inflation 3.1% 6.7% 6.8%
# months 266 94 94
ExHIBIT 4: INFLATION VS. BUSINESS CYCLE*
Expansion Contraction Recession Recovery
Inflation 4.2% 6.1% 4.1% 3.7%
# months 150 175 37 51
ExHIBIT 2: U.S. INFLATION—YEAR-OVER-YEAR INFLATION*
-15
-10
-5
0
5
10
15
20
25
'27 '33 '39 '45 '51 '57 '63 '69 '75 '81 '87 '93 '99 '05 '08
%
ExHIBIT 3: BUSINESS AND INFLATION CYCLES*
-4
-2
0
2
4
6
8
10
12
14
‘70 ‘72 ‘74 ‘76 ‘78 ‘80 ‘82 ‘84 ‘86 ‘88 ‘90 ‘92 ‘94 ‘96 ‘98 ‘00 ‘02 ‘04 ‘06 ‘08
Business cycle
Y-O-Y inflation
%
* Sources: please refer to appendix 3 on P. 38

J.P. Morgan Asset Management | 11
Thus, investors are left with little protection in post-peak environments when inflation, although falling, remains rela-tively high.
C. Inflation risk is tied to business cycle risk
The second point about cyclicality involves business cycle risk. We strongly believe that accounting for business cycle risk must be an integral part of understanding and protecting against inflation.
Exhibit 3• shows both business and inflationary cycles over a 36-year time horizon. As this graph indicates, sometimes inflation and business cycles correlate, but sometimes they do not.
Exhibit 4• shows the number of monthly periods during this time in which the business cycle was in an expansion or recovery, versus periods in contraction or recession. We see that the frequency of these periods, in aggregate, is nearly identical.
Exhibit 5• presents the frequency of inflationary regimes over this same time period. We see that periods of contained infla-tion were much more common than periods of high runaway inflation.
The first key point about this data is that while inflation shocks are rare, recessions and contractions are not. So in those frequent sustained periods of contained inflation (<5%), there still remains a strong possibility of encountering the down-draft of a business contraction or recession. There are several periods (the recessions of 1992 and 2002) in which a recession or contraction coincided with low inflation. And because a down business cycle can erode returns, even though inflation may have been low (in the 2% to 3% range), markets posted nega-tive nominal returns, which created even larger negative real returns for investors.
The second point is that recessions tend to be disinflationary, relieving inflationary pressure and slowing the rate of inflation. This relationship can be significant for portfolios using real assets as an inflation hedge. Such assets tend to decline more quickly when inflation is still high but has started to fall, just after a peak. But during a recession or contraction, traditional assets are also under pressure. In those periods where reces-sion or contraction coincides with high but declining inflation,
there exists a perfect storm scenario in which assets, including hedging assets, are heading south rapidly, all at once.
With respect to inflation protection, investors need be less concerned with the specific question of what is driving the relationship between inflation and business cycle risk, and more concerned with the broader observation that inflation does not exist in a vacuum:
Inflation risk must be understood holistically in the context of •other kinds of risk that may interact with it. Even if investors solve the narrow issue of inflation spikes, that solution does not imply they have also solved the larger issue of negative real returns due to bear markets.
Comprehensive “all season” planning is the key to success. •We cannot know in advance what other risks will appear together with inflation and increase its dangers.
Thus, a pure inflation hedge is, in and of itself, incomplete. Like-wise, a pure business cycle hedge is incomplete. Investors need to strike a happy medium between these forces, both of which
Definitions exPANSION: Economy is growing (non-farm payroll).
CONtrACtION: Economy still growing but rate is slowing.
reCeSSION: Economic growth is negative.
reCOvery: Growth is still negative but trending upward.
CONtAINeD INFlAtION: Year-over-year headline inflation under 5% growth and has been under 5% in previous period.
INFlAtION SHOCkS, HIgH AND rISINg: Year-over-year headline inflation is above 5% and greater than the previous period.
INFlAtION SHOCkS, HIgH AND FAllINg: Year-over-year headline inflation is above 5% but lower than the previous period.

12 | Aiming At a Moving Target—Managing inflation risk in target date funds
may have a dramatic impact on the performance of investment portfolios.
D. The cost to insure against the unexpected
As mentioned earlier, a long time horizon can minimize infla-tion risk. In the long run, all assets historically had positive real rates of return. Inflation expectations typically are embedded in long-run nominal returns for all asset classes with investors being compensated for bearing that risk.
The specific inflation risk (and converse deflation risk) that is the target of hedging is really the short-term risk of the unex-pected. It is the risk that a storm will suddenly crop up and blow you off your expected course, creating negative real returns, possibly at your most vulnerable time.
In dealing with such risk, a fitting analogy would be that the only way to protect against the unexpected is to purchase insur-ance. So the practical questions become:
Can you fully insure against something that is truly unex-•pected?
Does the amount you are willing to pay for such insurance •change depending on your time horizon, return objectives and liquidity needs?
We would offer five general observations related to the notion of insurance:
1. Its effectiveness can vary: Our first observation would be one of caution. Because the nature of inflation varies from one regime to the next, the effectiveness of specific solutions can vary as well. One has to build in tolerance for variation and unpredictability of effectiveness. It cannot be assumed that be-cause an inflation hedging strategy worked well in one inflation-ary regime, it will work equally well in the next one.
2. It cannot be a blunt instrument: Different hedging assets have different risk/return profiles and different cyclical sensitiv-ities. Choosing the right assets and implementation approaches requires a precise understanding of the investor’s inflation vulnerabilities. If you buy the wrong kind of insurance for the wrong problem, you will not get the expected coverage, and it may end up creating more problems than it solves.
3. It has limitations and forces trade-offs: As we will see in the next section, it may not be possible to accurately time short inflation cycles. Then there is the issue of size: how much of a hedge is needed to be effective, versus how much risk those positions create.
4. It imposes costs on the portfolio: Inflation protection im-poses a cost on investors, either in opportunity cost or lower returns. Therefore, investors need to carefully weigh the poten-tial benefits versus the ongoing cost of protecting against what might be rare events.
5. It is most expensive when it is most needed: Further complicating the timing issue is that waiting to put on a hedge can increase its cost. For example, the price of a pure inflation swap is based on inflation expectations. Once inflation increases become certain, swap costs rise quickly and it may be too late to implement them cost effectively. Commodities tend to lead inflation, so waiting for indications of a spike before buying can result in buying commodities at their peak price, when inflation expectations are already baked in.
We believe that inflation hedging, like most risk management challenges, is a complex problem that requires an in-depth analysis of risks benefits and trade-offs. Narrow solutions will not work consistently: there is no such thing as a risk-free hedge.
The most effective way to address inflation protection is with an “all season” approach that helps the portfolio weather a range of inflationary and business cycle risks, adjusted as necessary according to the investor’s specific return objectives, con-straints, and time horizon.

J.P. Morgan Asset Management | 13
As we have emphasized thus far, uncertainty is one of the chief difficulties in designing effec-tive inflation protection strategies. Over-reliance on the historical record, or what we know about inflation itself, can yield inappropriately narrow strategies that fail to anticipate inflation’s wide variability.
In this same vein, investors must take into account the many unknowns and uncertainties in asset performance, both histori-cal and forecasted performance, as it relates to inflation.
Below we offer a basic, three-part checklist for evaluating the uncertainties and vulnerabilities of any given asset class. Some or all of these issues apply to all assets in the portfolio, whether or not they are strictly considered part of an inflation hedging strategy:
1. Data Issues: For many asset classes, one has to deal with two data issues: lack of data, and the questionable reliability of available data. For example:
While some commodities and REIT indices have existed since •the 1970s, some of today’s most commonly used indices have only been around since the 1990s, i.e. the Goldman Sachs Commodities Index (GSCI) and the Dow Jones Wilshire Index (DJWilshire).
• Prior to 1997, the Treasury Inflation Protected Securities (TIPS) Index did not exist.
As we recently hit a 17-year high in inflation, this is the first true inflationary period that these indices have encountered since their creation. Any forecasts as to how they might perform in a high inflation environment were purely hypothetical.
Inflation BasicsPrerequisites to effective protection
r-squared In the scatter plots on the following pages, the R-squared value indicates how well the line represents the relationship between asset returns and inflation, i.e. how tight the dispersion of plot points around the line is. The lower the number, the more likely there are outside influences or a mismatch in the timing of influ-ences. In these examples, an R-squared over 0.25 can be seen as a strong relationship.
We believe that the relationships between inflation and asset class performance generally hold true, despite the statistically weak R-squared values. The low values could be due to a number of factors, including the fact that the high inflation regimes include periods when inflation is high and rising and high and falling. Asset performance can be quite different under each regime and plotting it in the same high inflation chart could cause excessive dispersion.
Low R-squared values, however, do tend to support our view of the benefits of diversifying the assets used for hedging. Given that these relationships are statistically weak, investors should view the inflation protection benefits of specific assets with caution. These assets may not always provide all the protection that inves-tors are expecting.
To address these issues, one needs to look at time periods for which there is reliable hard data, as well as longer time periods in which there was inflation (even if there is little asset data), and finally, forward-looking macroeconomic and market as-sumptions. An entire body of academic literature addresses how to deal with such data problems. We have attempted to discuss limitations of particular asset classes in specific ways, which are discussed in the relevant asset class sections.

14 | Aiming At a Moving Target—Managing inflation risk in target date funds
2. Investability: There can sometimes be a large gap between what investors can analyze and what they can invest in.
For instance, the TIPS vehicle used by most institutional inves-tors is a TIPS fund, while most industry performance analysis is done using individual TIPS bonds. In the same vein, com-modities indices can be constructed differently, and none of the major indices are equally-weighted and fully collateralized, which means these indices have embedded bias toward certain underlying commodities.
3. Cyclical sensitivities: One of the most important prerequi-sites to inflation hedging is understanding that individual assets do not perform the same way in all inflationary environments.
Returns can often be driven by independent asset cycles such as asset bubbles, seasonal changes, sector weighting changes or changes in the business cycle. These cycles can occur in con-nection with or independent of inflation cycles which cause the asset returns to behave differently in one inflationary environ-ment versus another.
How to read the trends in the Asset returnsA simple way to determine the basic relation-ship between asset returns and inflation is to analyze a scatterplot. Here we plot rolling 1-year returns on the y-axis and the corre-sponding annual inflation rate on the x-axis.
Drawing a trend line through these plots gives us an equation like y = 1.1x + 0.1. The first number describes the slope of the line, i.e. whether the trend is a positive or negative relationship. Positive slopes imply that on average higher inflation corresponds with higher asset returns and the higher the number, the higher the return observed as inflation increases. The R-squared then tells us how well we can rely on that relationship.
% R
etur
n
% Inflation
-40
-20
0
20
40
60
0 2 4 6 8 10 12 14 16
ExHIBIT 6: U.S. SMALL CAP EqUITY—ROLLING 1-YEAR RETURNS VS. INFLATION SINCE 1978*
y = 1.113x + 0.1056 R2 = 0.0245
% Inflation
% R
etur
n
-40
-20
0
20
40
60
0 2 4 6 8 10 12 14 16
ExHIBIT 8: U.S. SMALL CAP EqUITY—ROLLING 1-YEAR RETURNS VS. HIGH INFLATION SINCE 1978*
y = 1.0849x + 0.0481R2 = 0.0132
% Inflation
% R
etur
n
-40
-20
0
20
40
60
0 2 43 51 6
ExHIBIT 7: U.S. SMALL CAP EqUITY—ROLLING 1-YEAR RETURNS VS. LOW/MODERATE INFLATION SINCE 1978*
y = -3.2027x + 0.2319 R2 = 0.0194
* Sources: please refer to appendix 3 on P. 38

J.P. Morgan Asset Management | 15
It is essential for investors to understand this principle if they are to devise effective strategies that address their specific vulnerabilities. We can use U.S. Small Cap Equity as a case study to illustrate this phenomenon.
U.S. Small Cap returns tend to be positively correlated with inflation, i.e. higher inflation often occurs with higher returns (Exhibit 6). But this overall trend hides some interesting cyclical sensitivities. Its performance is not consistent across all inflat-ionary regimes:
During low inflation environments, such as at the start of the •inflationary cycle with inflation < 5%, small cap’s relationship to inflation is negative (Exhibit 7).
On the other hand, in high inflation environments, when •inflation is > 5%; just before/after inflationary peak, small cap shows a positive relationship (Exhibit 8).
Moreover, as we see in • Exhibit 9, small cap is also highly sensitive to the direction of inflation—performing poorly when inflation is high and rising, but performing strongly when inflation is high and falling.
Whereas small cap tends to lead in a business cycle recovery, it actually tends to lag the inflationary cycle, performing best when inflation is just past its peak and starting to decline.
We speculate that this uptick in performance in high inflation environments is due in part to the pricing flexibility of small cap companies. They may have the ability to quickly pass inflation costs through to customers, restore their margins, and be bet-ter able to quickly rebound when inflationary pressures begin to ease.
These examples illustrate the complexity of inflation hedging: multiple analytical and behavioral factors must be considered for each hedging asset, including its sensitivity to the level of inflation, the direction of inflation and the business cycle.
Contained Inflation Inflation Shocks
High and Rising High and Falling
U.S. Large Cap Equity 17.1% -7.1% 18.9%
U.S. Small Cap Equity 13.7% -5.8% 24.0%
International Equity 30.6% -8.7% 6.4%
Emerging Markets Equity 24.0% 0.4% 23.8%
Emerging Market Debt 13.8% -0.9% 19.6%
High Yield 11.8% -2.6% 20.8%
U.S. Core Fixed Income 8.19% 4.3% 4.3%
Cash 5.8% 6.5% 7.9%
TIPS 5.6% 18.4% 8.0%
Commodities 18.9% 48.2% -1.6%
REITs 13.6% -14.1% 27.0%
Direct Real Estate 10.3% 9.6% 12.5%
Inflation 3.1% 6.7% 6.8%
# Months 266 94 94
ExHIBIT 9: ASSET RETURNS BY INFLATION ENVIRONMENTS (1970–2008)*
* Sources: please refer to appendix 3 on P. 38

16 | Aiming At a Moving Target—Managing inflation risk in target date funds
Hedging Tools and Strategies A review of traditional asset classes
Exhibits 9 and 10 provide an overview of asset performance in relation to inflationary regimes and business cycles. We will refer back to these tables throughout the next two sections of the paper as we take a detailed look at the hedging potential of various assets.
But as a preface, we should note how these exhibits support several of the key points discussed thus far:
The direction of inflation is just as important as its level—•some assets show rapid, large reversals in returns depending not on whether inflation is high or low, but rather on whether inflation is rising or falling (Exhibit 9).
Economic cycles can have a similar performance impact. For •example, commodities maintain their high returns as the economy slows (contraction), but swing to double-digit de-clines during recessions, and then rapidly reverse to double-digit gains in a recovery (Exhibit 10).
Timing these cycles can be very difficult given the speed •with which inflation and economic cycles can reverse, and the scale of the potential shift in asset performance. Thus, investors should be wary of a whipsaw effect in trying to time hedges too closely.
• Assets that show the highest sensitivity to recession also tend to have the strongest performance in recovery.
Asset returns will often show a change in performance before •any underlying economic change is reflected in published government statistics.
Expansion Contraction Recession Recovery
U.S. Large Cap Equity 11.7% 6.0% 10.8% 22.2%
U.S. Small Cap Equity 14.6% 2.6% 18.1% 46.2%
International Equity 15.9% 7.7% -1.4% 18.3%
Emerging Markets Equity 12.6% 8.9% 9.9% 36.4%
Emerging Markets Debt 8.9% 10.0% 9.8% 13.5%
High Yield 7.2% 6.1% 9.6% 16.0%
U.S. Core Fixed Income 4.9% 9.8% 11.1% 10.2%
Cash 5.4% 7.1% 5.9% 4.9%
TIPS 8.2% 18.7% -5.5% -0.1%
Commodities 12.9% 21.2% -11.8% 15.9%
REITs 17.0% -0.3% 6.9% 20.9%
Direct Real Estate 12.7% 11.5% 4.6% 2.9%
Inflation 4.2% 6.1% 4.1% 3.7%
# Months 150 175 37 51
ExHIBIT 10: ASSET RETURNS BY STAGE OF BUSINESS CYCLE (1970–2008)*
* Sources: please refer to appendix 3 on P. 38

J.P. Morgan Asset Management | 17
We can use this framework of cyclicality—of both inflation and the business cycle—to develop a clear picture of the inflation-protection potential of specific asset classes. Our review begins with some core traditional portfolio allocations:
• U.S. Core Fixed Income: Bonds are sensitive to inflation because yields increase with inflation expectations, and when yields go up, bond returns go down. As expected, bonds show deterioration in performance with increases in inflation in all inflation scenarios (Exhibits 11–13).
It is not surprising that bonds are also the only asset class to show little change in return potential when inflation changes direction. Bond returns tend to suffer in all high inflationary scenarios whether inflation is rising or falling (Exhibit 9). However, strong bond performance in recessionary periods can add robust support when other assets suffer.
• U.S. Large Cap Equity: Large cap, as expected, provides little in the way of an inflation hedge—with slightly negative correlation in both low and high inflation regimes (Exhibits 14–16). What may be surprising, however, is that large cap rebounds strongly as inflation declines, even if inflation is still relatively high in absolute terms. In addition, large cap tends to lead a recovery; after a period of economic contraction, it rebounds with positive performance even as the economy moves through recession (Exhibit 10).
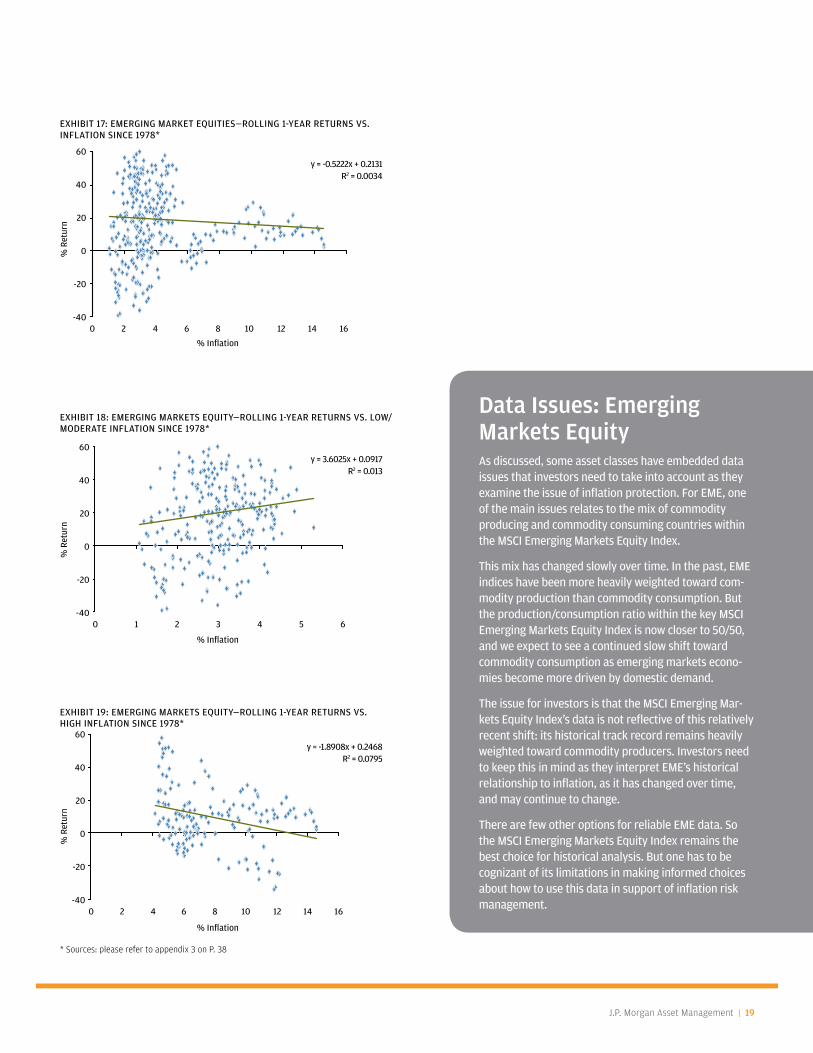
Emerging Markets Equity:• Emerging markets equity (EME) appears to act as an effective hedge in stable, low inflation scenarios, but show negative correlation in high inflation scenarios. As mentioned earlier, however, the direction of inflation is what is most important: EME performance dete-riorates markedly as inflation rises, but recovers dramatically as inflation declines (Exhibit 9).
-10
-5
0
5
10
15
20
25
30
0 2 4 6 8 10 12 14 16
ExHIBIT 11: U.S. CORE FIxED INCOME—ROLLING 1-YEAR RETURNS VS. INFLATION SINCE 1978*
y = -0.7379x + 0.1177 R2 = 0.0844
% Inflation
% R
etur
n
-10
-5
0
10
5
20
30
25
15
0 1 2 3 4 5 6
ExHIBIT 12: U.S. CORE FIxED INCOME—ROLLING 1-YEAR RETURNS VS. LOW/MODERATE INFLATION SINCE 1978*
y = -0.3281x + 0.1014 R2 = 0.0016
% Inflation
% R
etur
n
-10
-5
0
10
5
20
30
25
15
0 2 4 6 8 10 12 14 16
ExHIBIT 13: U.S. CORE FIxED INCOME—ROLLING 1-YEAR RETURNS VS. HIGH INFLATION SINCE 1978*
y = -1.4377x + 0.1813 R2 = 0.2828
% Inflation
% R
etur
n
* Sources: please refer to appendix 3 on P. 38

18 | Aiming At a Moving Target—Managing inflation risk in target date funds
International equityWe believe that International Equity plays an important role in diversified portfolios, but a limited one in providing inflation pro-tection. These assets often carry currency returns that can overwhelm the influence of equity performance, depending on how those currency effects are hedged for U.S. dollar investors. Long-term cur-rency relationships indicate some relative inflation premium versus other countries. However, as with many assets, short-term deviations due to market movements can diminish this effect. This problem arises less in emerging market equities where equity returns are generally much stronger than their currency effects. That said, with currency effects removed, International Equity could be expected to show a similar relationship to inflation as to U.S. Large Cap Equity, and for this reason we have not in-cluded International Equity in this analysis.
And while EME returns tend to lag the economic cycle (not showing a pick-up in return until a recovery has started), they are relatively more robust in enduring all economic cycles than other types of assets (Exhibit 10). We believe this return profile is due to EME’s equity and commodity characteristics, as some emerging market countries are heavy users, while others are producers of commodities. For U.S. investors wor-ried about U.S. inflation, EME can be a strong diversifier.
What this data shows is that each asset works differently in various parts of the inflation cycle, and that traditional assets can be helpful in protecting a portfolio under certain sce-narios. Their utility will depend on the level and direction of inflation. But the message for investors is a clear one: do not discount the potential contribution these assets may make to an inflation fighting program.
y = -0.3106x + 0.152 R2 = 0.0032
-40
-20
0
20
40
60
0 2 4 6 8 10 12 14 16
ExHIBIT 14: U.S. LARGE CAP EqUITY—ROLLING 1-YEAR RETURNS VS. INFLATION SINCE 1978*
% Inflation
% R
etur
n
-40
-20
0
20
40
60
0 2 4 6 8 10 12 14 16
ExHIBIT 15: U.S. LARGE CAP EqUITY—ROLLING 1-YEAR RETURNS VS. LOW/MODERATE INFLATION SINCE 1978*
y = -2.8293x + 0.2286 R2 = 0.0227
% Inflation
% R
etur
n
0 2 4 6 8 10 12 14 16-40
-20
0
20
40
60
ExHIBIT 16: U.S. LARGE CAP EqUITY—ROLLING 1-YEAR RETURNS VS. HIGH INFLATION SINCE 1978*
y = -0.6631x + 0.1309 R2 = 0.0128
% Inflation
% R
etur
n
* Sources: please refer to appendix 3 on P. 38
J.P. Morgan Asset Management | 19
Data Issues: emerging Markets equity As discussed, some asset classes have embedded data issues that investors need to take into account as they examine the issue of inflation protection. For EME, one of the main issues relates to the mix of commodity producing and commodity consuming countries within the MSCI Emerging Markets Equity Index.
This mix has changed slowly over time. In the past, EME indices have been more heavily weighted toward com-modity production than commodity consumption. But the production/consumption ratio within the key MSCI Emerging Markets Equity Index is now closer to 50/50, and we expect to see a continued slow shift toward commodity consumption as emerging markets econo-mies become more driven by domestic demand.
The issue for investors is that the MSCI Emerging Mar-kets Equity Index’s data is not reflective of this relatively recent shift: its historical track record remains heavily weighted toward commodity producers. Investors need to keep this in mind as they interpret EME’s historical relationship to inflation, as it has changed over time, and may continue to change.
There are few other options for reliable EME data. So the MSCI Emerging Markets Equity Index remains the best choice for historical analysis. But one has to be cognizant of its limitations in making informed choices about how to use this data in support of inflation risk management.-40
-20
0
20
40
60
0 2 4 6 8 10 12 14 16
ExHIBIT 19: EMERGING MARKETS EqUITY—ROLLING 1-YEAR RETURNS VS. HIGH INFLATION SINCE 1978*
y = -1.8908x + 0.2468 R2 = 0.0795
% Inflation
% R
etur
n
-40
-20
0
20
40
60
0 2 43 51 6
ExHIBIT 18: EMERGING MARKETS EqUITY—ROLLING 1-YEAR RETURNS VS. LOW/MODERATE INFLATION SINCE 1978*
y = 3.6025x + 0.0917 R2 = 0.013
% Inflation
% R
etur
n
-40
-20
0
20
40
60
0 2 4 6 8 10 12 14 16
ExHIBIT 17: EMERGING MARKET EqUITIES—ROLLING 1-YEAR RETURNS VS. INFLATION SINCE 1978*
y = -0.5222x + 0.2131 R2 = 0.0034
% Inflation
% R
etur
n
* Sources: please refer to appendix 3 on P. 38

20 | Aiming At a Moving Target—Managing inflation risk in target date funds
When it comes to inflation protection,
risk diversification is key to identifying
an “all season” approach.

J.P. Morgan Asset Management | 21
Over the last year, some real assets have been getting a lot of attention as silver bullets—lauded as perfect, and even risk-free, hedges. In this section, we consider three categories of real assets: commodities, TIPS, and real estate. Within real estate, we distinguish direct real estate from REITs.
What we see is that each of these real assets provide some inflation protection, but none is perfect, and none is risk-free. Each asset class has both strengths and weaknesses, which we cover in some detail.
A. Commodities: Commodities are frequently cited as a key component of an inflation protection program. They often move in lockstep with inflation because they are a component, and sometimes even a driver, of headline inflation.
However, the danger of extrapolating from theory into practi-cal reality is arguably larger here than it is in many other asset classes for a number of reasons:
There are many different measures of commodities. Different •indices use different construction methods, but none of them are equally-weighted and fully collateralized. For our analysis, we use the Goldman Sachs Commodities Index (GSCI), as well as an equally-weighted return series, both of which include oil, gas, precious metals, livestock, and agricultural commodi-ties.
Inflation occurs for many reasons, and it is not safe to assume •that what drove inflation last time will drive inflation next time. For example, the chief driver might be money supply, housing, healthcare, or labor cost and not commodity prices; commodity prices may not increase as a result of these types of inflation.
• A benchmark’s inherent bias can reduce or heighten its sen-sitivity to certain types of inflation. For example, we use the GSCI for historical analysis, but are cautious in our extrapola-tions as the GSCI is significantly weighted toward energy.
Benchmark selection can also create track record issues. •Investors who rely on the GSCI are choosing to rely heavily on recent performance. The GSCI gained favor as a commodi-ties proxy because it is heavily weighted to one of the chief drivers of inflation, oil. But among the major commodities indices, the GSCI has a short actual history. Its bias toward recent history may make it less reliable than some of the indices with longer track records.
There are many different methods of gaining commodities •exposure, such as futures, natural resources, and, as we discussed in the last section, regional EME. Each approach delivers different levels of inflation protection, protects against different types of inflation risk, and brings a unique risk profile.
Hedging Tools and Strategies A review of real assets
22 | Aiming At a Moving Target—Managing inflation risk in target date funds
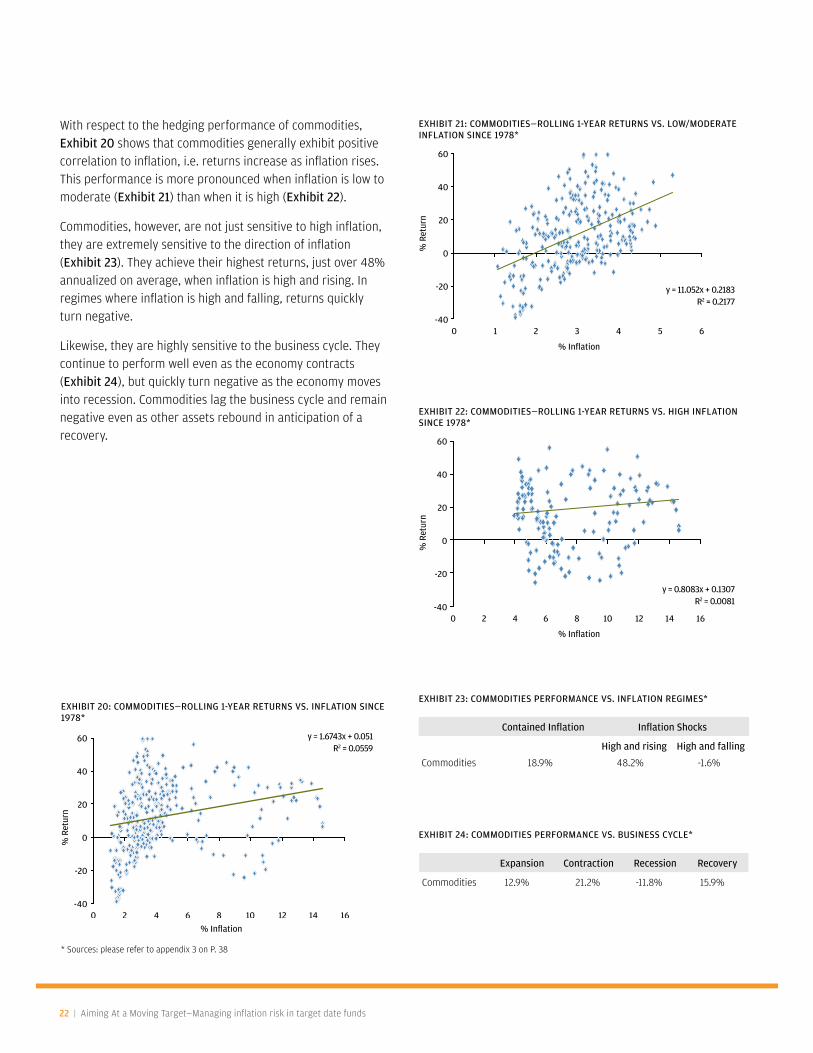
With respect to the hedging performance of commodities, Exhibit 20 shows that commodities generally exhibit positive correlation to inflation, i.e. returns increase as inflation rises. This performance is more pronounced when inflation is low to moderate (Exhibit 21) than when it is high (Exhibit 22).
Commodities, however, are not just sensitive to high inflation, they are extremely sensitive to the direction of inflation (Exhibit 23). They achieve their highest returns, just over 48% annualized on average, when inflation is high and rising. In regimes where inflation is high and falling, returns quickly turn negative.
Likewise, they are highly sensitive to the business cycle. They continue to perform well even as the economy contracts (Exhibit 24), but quickly turn negative as the economy moves into recession. Commodities lag the business cycle and remain negative even as other assets rebound in anticipation of a recovery.
* Sources: please refer to appendix 3 on P. 38
ExHIBIT 24: COMMODITIES PERFORMANCE VS. BUSINESS CYCLE*
Expansion Contraction Recession Recovery
Commodities 12.9% 21.2% -11.8% 15.9%
ExHIBIT 23: COMMODITIES PERFORMANCE VS. INFLATION REGIMES*
Contained Inflation Inflation Shocks
High and rising High and falling
Commodities 18.9% 48.2% -1.6%
-40
-20
0
20
40
60
0 2 4 6 8 10 12 14 16
ExHIBIT 20: COMMODITIES—ROLLING 1-YEAR RETURNS VS. INFLATION SINCE 1978*
y = 1.6743x + 0.051 R2 = 0.0559
% Inflation
-40
0
-20
20
40
60
0 2 43 51 6
ExHIBIT 21: COMMODITIES—ROLLING 1-YEAR RETURNS VS. LOW/MODERATE INFLATION SINCE 1978*
y = 11.052x + 0.2183 R2 = 0.2177
% Inflation
% R
etur
n
-40
-20
0
20
40
60
0 2 4 6 8 10 12 14 16
ExHIBIT 22: COMMODITIES—ROLLING 1-YEAR RETURNS VS. HIGH INFLATION SINCE 1978*
y = 0.8083x + 0.1307 R2 = 0.0081
% Inflation
% R
etur
n
% R
etur
n

J.P. Morgan Asset Management | 23
Given their sensitivity to different environments, commodities are highly volatile, and their best- and worst-performing periods can be just months apart. Investors who invest in commodities halfway into an up-cycle could find themselves trapped in those positions with no exit as the cycle quickly reverses. And in a per-fect storm scenario in which high or falling inflation coincides with recession, commodities investors could face significant losses. The data and price action we saw in commodities mar-kets at the end of 2008 may lead to just such an environment.
Ultimately, the issue for investors is that inflation hedging is aimed at protecting against inflation volatility, but in this case the hedging asset, commodities, is much more volatile than inflation itself. Commodities can be useful for certain investors and in certain circumstances, but the investor choices need be informed of all the attendant risks that commodities bring.
B. TIPS: These bonds offer a coupon plus appreciation with inflation. They were designed to provide inflation protection to investors and can be reliable hedges in times of low to moder-ate inflation (Exhibit 26).
In times of high inflation, even when their correlation with inflation turns marginally negative (Exhibit 27), they still offer protection. Though returns fall as inflation declines, TIPS index returns fall from a relatively high annualized rate of 18% to a rate of 8% (Exhibit 28), which is almost double the 4.3% deliv-ered by core fixed income in the same inflationary cycle.
* Sources: please refer to appendix 3 on P. 38
-20
0
20
40
60
0 2 43 51 6
ExHIBIT 26: TIPS (BACKTESTED)—ROLLING 1-YEAR RETURNS VS. LOW/MODERATE INFLATION SINCE 1978*
y = 3.1947x + 0.0037 R2 = 0.0632
% Inflation
y = -0.3069x + 0.1452 R2 = 0.0066
-20
-10
0
10
20
40
30
0 2 4 6 8 10 12 14 16
ExHIBIT 27: TIPS (BACKTESTED)—ROLLING 1-YEAR RETURNS VS. HIGH INFLATION SINCE 1978*
% Inflation
% R
etur
n%
Ret
urn
-40
-20
0
20
40
60
0 2 4 6 8 10 12 14 16
ExHIBIT 25: TIPS (BACKTESTED)—ROLLING 1-YEAR RETURNS VS. INFLATION SINCE 1978*
y = 0.3002x + 0.097 R2 = 0.006
% Inflation
% R
etur
n

24 | Aiming At a Moving Target—Managing inflation risk in target date funds
However, we need to point out that TIPS have not existed in a period of high inflation. As a TIPS Index was not introduced until 1997, index returns have to be back-tested, so the reliability of this assumed behavior is yet to be proven. Thus, our focus on TIPS funds performance, rather than individual TIPS bonds for our analysis, is an important aspect of our analysis. (Please see the sidebar on the facing page for further details.)
The protection offered by TIPS, however, does not come cheaply. We see in Exhibit 28 that TIPS offer no risk premium in periods when inflation is controlled, which is the majority of historical periods (Exhibit 2, page 10). The majority of returns in a TIPS fund come from nominal yield, and when there is no inflation, the added premium investors pay to get inflation protection limits their returns.
TIPS are also vulnerable to their own kind of perfect storm scenario. In regimes where nominal yields are rising because inflation is high, but inflation expectations have started to re-verse, real yields (nominal yields minus expected inflation) can increase quickly. This would mean that returns can decline just as fast as they went up. In back-tests for TIPS returns, there are periods in the late 1970s and early 1980s when TIPS were down approximately 20% because of this type of scenario.
TIPS, it turns out, can be valuable in hedging inflation, but not in all environments. So loading up on TIPS to protect against the rare inflation shock means that the portfolio can be subjected to sizeable carrying costs during frequent periods of low infla-tion. The portfolio is also exposed to significant business cycle risk (Exhibit 29), with TIPS performance turning negative during periods of recession and recovery.
ExHIBIT 29: TIPS PERFORMANCE VS. BUSINESS CYCLE*
ExHIBIT 28: TIPS PERFORMANCE VS. INFLATION REGIMES*
Contained Inflation Inflation Shocks
High and rising High and falling
U.S. Core Fixed Income 8.2% 4.3% 4.3%
Cash 5.8% 6.5% 7.9%
TIPS 5.6% 18.4% 8.0%
Expansion Contraction Recession Recovery
U.S. Core Fixed Income 4.9% 9.8% 11.1% 10.2%
Cash 5.4% 7.1% 5.9% 4.9%
TIPS 8.2% 18.7% -5.5% -0.1%
* Sources: please refer to appendix 3 on P. 38

J.P. Morgan Asset Management | 25
Investability Issue: tIPSWhile inflation-linked bonds have been around for a long time, TIPS indices and funds were introduced in the late 1990s. The relative youth of TIPS funds raises a key data issue for institutions looking to TIPS for inflation protection. Much of our industry’s inflation analysis on TIPS is based on individual TIPS bonds, even though institutional investors primarily use TIPS funds in their portfolios.
Using TIPS bonds for inflation analysis may be appropriate for individual investors because TIPS bonds are often a best-fit solution to their challenges. Individuals usually have a specific objective (such as college saving or retirement), that allows them to match a bond’s maturity with their time horizon, holding it to maturity without the need to mark-to-market along the way.
For institutions or multi-asset funds, TIPS bonds are less useful. The typical institutional investor, i.e. mutual fund or DB plan, does not have a single cashflow target or time horizon. Institutions are also required to mark-to-market, recognizing price changes that could impact returns.
In a buy-and-hold strategy, institutions will likely be forced to recognize paper gains or losses from mark-to-market accounting, or buy and sell individual bonds in response to cashflow demands that are outside their control.
The only practical approach is for institutions to access TIPS through pooled assets. And here is where we find a breakdown with conventional TIPS analysis: using inflation analysis based on TIPS bonds fails to incorporate the market risk associated with TIPS funds.
Despite its relatively short data history, we believe that the most relevant inflation and portfolio modeling for institutional investors will be based on the asset that they are actually going to use in their portfolios: TIPS funds, not TIPS bonds.
For more on our back-testing methodology please see Appendix A.
Despite its relatively short data history,
we believe that the most relevant inflation
and portfolio modeling for institutional
investors will be based on the asset that
they are actually going to use in their
portfolios: TIPS funds, not TIPS bonds.

26 | Aiming At a Moving Target—Managing inflation risk in target date funds
C. Real Estate (direct and REITs): Real estate appears to be the most consistent inflation hedge of all the real assets we have examined, and its relatively high R-squared values indicate that its relationship to inflation is stronger and more statistically significant than that of other assets.
Both direct real estate and REITs show a positive correlation to inflation (Exhibits 30 and 33). Both assets show modest protec-tion when inflation is low to moderate (Exhibits 31 and 34), and improved protection in high inflation environments (Exhibits 32 and 35).
Of the two types of real estate assets, however, direct real estate appears to be more robust across directional regimes. It retains its positive return profile whether inflation is high and rising or high and falling (Exhibit 36).
By contrast, REIT performance is more akin to that of equi-ties. REITs turn negative as inflation is high and rising, but turn sharply positive as inflation peaks and begins to decline (Exhibit 36). The similarity with equities is also apparent in REITs’ response to the business cycle (Exhibit 37), which is more in line with large cap equity than with direct real estate.
As strong as the correlation appears to be, however, real estate is like any other asset and brings its own unique risk factors to a portfolio.
• It is highly correlated with the business cycle (Exhibit 37). So a recessionary period that coincides with a regime of high and/or rising inflation should be cause for concern, particu-larly for REIT investors.
Direct real estate can pose liquidity risks. By its nature, direct •real estate can be illiquid. In stressful economic times, while direct real estate returns may be sustainable, liquidating the underlying assets can be even more difficult. Such illiquidity can be a risk for investors with a strong need for cash, or a need to rebalance.
Again, this brings us back to one of our core tactical problems with inflation hedging: individual investor objectives. While real estate may help manage inflation risk in more environments than other asset classes, it may not work effectively in all envi-ronments, and not for all investors.
-10
-5
0
5
10
15
20
25
30
0 2 4 6 8 10 12 14 16
ExHIBIT 30: DIRECT REAL ESTATE—ROLLING 1-YEAR RETURNS VS. INFLATION SINCE 1978*
y = 0.9015x + 0.0668 R2 = 0.1704
% Inflation
% R
etur
n
-10
-5
0
10
5
20
30
25
15
0 1 2 3 4 5 6
ExHIBIT 31: DIRECT REAL ESTATE—ROLLING 1-YEAR RETURNS VS. LOW/MODERATE INFLATION SINCE 1978*
y = 0.4584x + 0.0835 R2 = 0.0042
% Inflation
% R
etur
n
0 2 4 6 8 10 12 14 16-5
0
5
10
15
20
25
30
ExHIBIT 32: DIRECT REAL ESTATE—ROLLING 1-YEAR RETURNS VS. HIGH INFLATION SINCE 1978*
y = 1.6197x + 0.0059 R2 = 0.7529
% Inflation
% R
etur
n
* Sources: please refer to appendix 3 on P. 38

J.P. Morgan Asset Management | 27
Direct real estate shows surprising strength in its correlation with inflation, performs well across phases of the inflation cycle, is a helpful diversifier and generates strong real returns over time.
But its limitations with regard to liquidity mean that the amount of real estate owned in the portfolio must be carefully gauged with respect to liquidity needs.
It should be clear from this data that while real assets (commodi-ties, TIPS, and real estate) can play an important role in inflation protection, none of these asset classes, individually, can play the role of a silver bullet. When it comes to inflation protection, risk diversification is key—and not just protection against inflation risk, but against all the attendant asset class risks that investors face in designing a hedging program.
ExHIBIT 37: REAL ESTATE PERFORMANCE VS. BUSINESS CYCLE*
Expansion Contraction Recession Recovery
REITs 17.0% -0.3% 6.9% 20.9%
Direct Real Estate 12.7% 11.5% 4.6% 2.9%
ExHIBIT 36: REAL ESTATE PERFORMANCE VS. INFLATION REGIMES*
Contained Inflation Inflation Shocks
High and rising High and falling
REITs 13.6% -14.1% 27.0%
Direct Real Estate 10.3% 9.6% 12.5%
0 2 4 6 8 10 12 14 16-40
-20
0
20
40
60
ExHIBIT 35: REITS—ROLLING 1-YEAR RETURNS VS. HIGH INFLATION SINCE 1978*
y = 0.3137x + 0.084 R2 = 0.0027
% Inflation
% R
etur
n
-40
-20
0
20
40
60
0 2 43 51 6
ExHIBIT 34: REITS—ROLLING 1-YEAR RETURNS VS. LOW/MODERATE INFLATION SINCE 1978*
y = -0.9917x + 0.1904 R2 = 0.0032
% Inflation
% R
etur
n
-10
-5
0
5
10
15
20
25
30
0 2 4 6 8 10 12 14 16
ExHIBIT 33: REITS—ROLLING 1-YEAR RETURNS VS. INFLATION SINCE 1978*
y = 0.2874x + 0.1446 R2 = 0.003
% Inflation
% R
etur
n
* Sources: please refer to appendix 3 on P. 38

28 | Aiming At a Moving Target—Managing inflation risk in target date funds
In constructing an inflation risk solution,
target date fund sponsors should consider
volatility constraints and time horizon.

J.P. Morgan Asset Management | 29
When considering inflation protection, the goal of a target date fund sponsor should be to identify and implement a robust “all season” solution that addresses both sides of the risk- return equation. We see five key factors influencing that goal:
Time horizon of inflation:• Historical analysis indicates that all individual asset class returns have beaten inflation over time periods longer than 10 years. Combining asset classes into diversified portfolios may shorten this time horizon, but a conservative view would set the outer boundary of inflation sensitivity at 10 years. We believe that investors should begin to worry about inflation 10 years before their determined as-set accumulation end point, with inflation sensitivity increas-ing steadily as the time horizon shortens further.
Time horizon for target date investors:• The notion of an end point for target date fund investing can be fuzzy. For a number of practical and historical reasons, the industry’s current convention uses age 65 as a target retirement age. It is the midpoint between the age that investors can start taking withdrawals (age 59 1/2) and the date they must begin withdrawals (age 70). And it was once the age at which Social Security benefits were fully payable.
The real end point, however, is much more fluid, having less to do with age and more to do with the decision to shift from saving to spending, which is highly dependent on personal circumstance. Thus, with the fiduciary’s goal of balancing the needs of the investment pool with the needs of the individual investor, sponsors should think of the end point more in terms of a band in which the inflation sensitive period starting at 10 years out could start as early as age 50 or as late as age 60.
Volatility tolerance:• As the investor’s time horizon shortens, portfolio volatility becomes a significant concern. Portfolios may experience large negative real returns close to retire-ment, eroding purchasing power without sufficient time to
recover it before those funds are needed. In addition, other factors can influence risk tolerance, such as low contribution rates, participant loans and early withdrawals. Any reduc-tion in the savings rate increases investors’ vulnerability to downside outcomes, and in turn reduces the portfolio’s tolerance for volatility. Given these concerns, volatile assets, such as commodities, become more and more risky the closer the portfolio gets to the target time-band for retirement. As a result, managers and plan sponsors must reassess the use of potentially volatile assets, asking how much is required to gain meaningful inflation protection, and at what price to the portfolio in terms of volatility.
Issues for Target Date Funds Seeking robust inflation protection
key takeaways for target Date Fund Sponsors and Managers•Targetdateportfoliosbecomesteadilymore
vulnerable to inflation risk as the time horizon shortens to under 10 years to retirement, with significantly higher risk in periods shorter than five years.
•Loweringportfoliovolatilityforreasonsotherthan inflation protection can get investors a large part of the way toward protecting against negative real returns.
•Thislowvolatilityapproachprotectsagainstthemost common type of inflation risk—negative real returns in a low inflation environment.
•Volatilityconstraints,however,mayrequiretrade-offs in portfolio growth as well as reduce the utility of certain volatile hedging assets that are otherwise quite useful in portfolios with longer time horizons.

30 | Aiming At a Moving Target—Managing inflation risk in target date funds
Date issues: Data availability and reliabilityTo analyze inflation risk on a historical basis, one needs to include periods of low inflation as well as periods of inflation shocks.
We analyzed two periods—the period from 1978-2007 which includes inflation shocks, and the period from 1997-2007 which does not.
The longer time series creates data issues in that it includes back-tested data for assets and indices that did not exist at that time.
To improve the reliability and accuracy of infla-tion analysis, we advocate using a variety of data samples, i.e. multiple time periods, as well as both historical and forward looking analysis.
The results suggest that
investors should not rely
exclusively on any one set of
assumptions—either historical
track record or forward-looking
assumptions.
• Return trade-offs: In addition to costs in high volatility, infla-tion protection can impose portfolio costs in terms of lower growth. In times of low inflation, which are much more com-mon than inflationary shocks or spikes, TIPS returns could fall short of returns for core fixed income, and investors may pay a premium for inflation insurance that they are not using. So target date sponsors need to think carefully about striking an effective balance between protecting against negative real returns and meeting growth targets. How much inflation protection is really needed, and how much growth can the portfolio afford to give up to get such protection?
Liquidity constraints:• Finally, certain assets such as direct real estate may provide robust inflation protection, but may also compromise other portfolio objectives such as liquidity. As withdrawals increase, large positions in illiquid assets can compromise a fund’s ability to meet cash flow demands. In addition, the fund may not be able to liquidate certain assets fast enough to maintain its target allocation. (To address the latter challenge, fiduciaries may under-allocate to their ideal target weight in illiquid assets as the fund approaches its target retirement date. Then, if such withdrawals occur the effective allocation to the illiquid asset classes rises to its target, rather than above it.)
In the rest of this section, we address some of the key concerns of target date fund sponsors, namely:
Identifying those most at risk.•
• Lower volatility portfolios and the persistence of inflation risk.
The role of real assets.•
Addressing residual risk.•
Following these discussions, we provide a sample glide path for one of our own target date strategies to illustrate how these principles can be applied in practice.

J.P. Morgan Asset Management | 31
A. Who is most vulnerable to inflation risk?
We generally agree with two pieces of conventional wisdom:
First, young investors tend to be protected by a longer invest-ment time horizon. Wage growth over time tends to keep pace with inflation and allow for growth in savings. In addition, long-term real returns for all asset classes should make up for any periodic real or nominal underperformance. We do, however, offer two caveats based on previous target date research in the Ready! Fire! Aim? series:
• We have observed that real wages can fall behind inflation in some industries, and we do not yet know whether these effects are temporary or permanent.
Compromises in savings rate, through inconsistent or low •contributions, or pre-retirement loans and withdrawals, can also reduce the ability of the portfolio’s long-term real rate of return to keep pace with inflation.
Second, older investors face vulnerabilities. Short-term shocks can erode purchasing power, as well as disrupt markets and cause asset deflation that cannot be corrected in sufficient time. In addition, retiree inflation may be higher than headline inflation due to purchasing patterns that emphasize goods and services, i.e. healthcare, that tend to rise faster than inflation. However, older investors do have some protection:
Social Security increases with inflation annually; the long-•term inflationary impact on yields can decrease annuity costs.
In sum, we believe that the time horizon of younger investors provides a built-in measure of inflation protection and that older investors in the end stages of asset accumulation—less than 10 years before retirement—are most vulnerable to infla-tion risk.
B. Lower volatility portfolios and the persistency of inflation risk
Our analysis indicates that inflation sensitivity begins at approx-imately 10 years prior to retirement, with heightened sensitivity in periods shorter than five years.
We also found, however, that different types of analysis revealed different levels of persistence. For this reason, we ad-vocate using multiple measures to assess the need for inflation protection as well as the time horizon for investor vulnerability. For example:
Historical asset class batting averages indicate inflation risk •persistence of 10 years. As discussed earlier in the paper, investors with a time horizon longer than 10 years—who can also withstand volatility—will most likely not be concerned with inflation. The portfolio should have time enough to ride out many and diverse inflationary cycles. In Exhibit 38, we see that as the time horizon approaches 10 years, i.e. rolling 10-year periods, the frequency with which all these assets beat inflation approaches 100%.
50
60
70
80
90
100
Quarterly 1 year 2 years 3 years 5 years 10 years
Direct real estateCommoditiesU.S. Core Fixed IncomeREITsU.S. Large Cap Equity
ExHIBIT 38: PROBABILITY OF BEATING INFLATION OVER ROLLING PERIODS*
Holding Period
% P
roba
bilit
y
* Sources: please refer to appendix 3 on P. 38
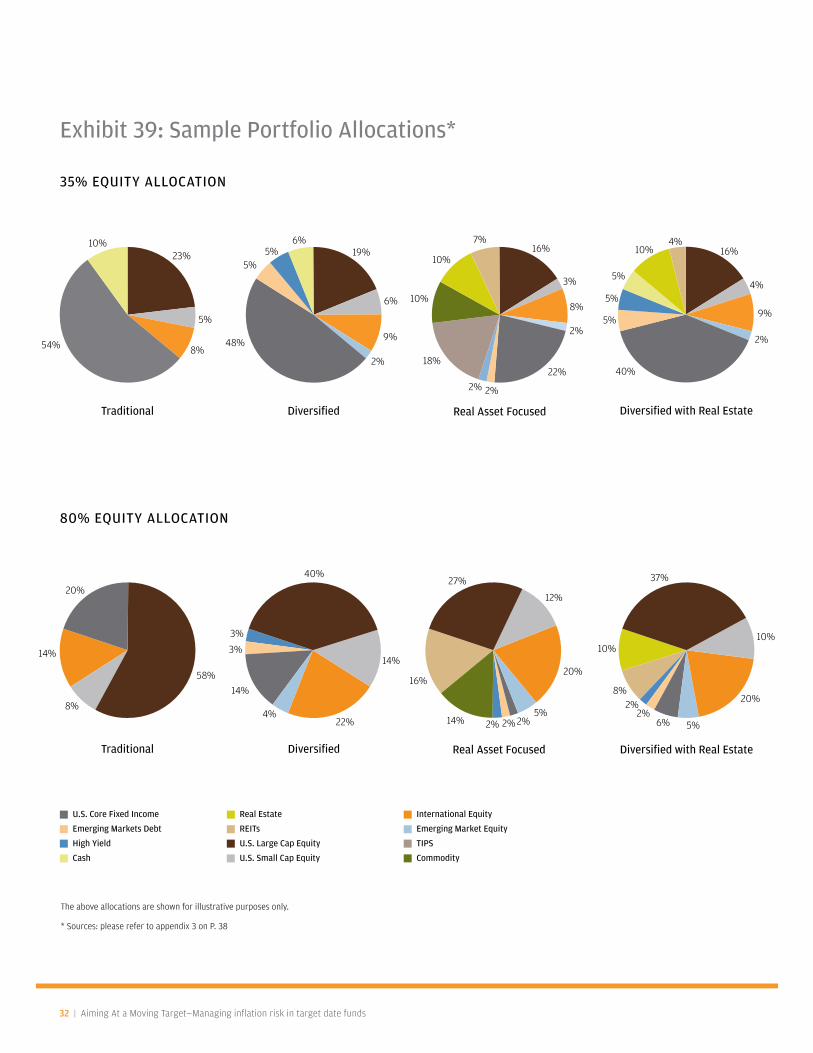
32 | Aiming At a Moving Target—Managing inflation risk in target date funds
Exhibit 39: Sample Portfolio Allocations*
35% EqUITY ALLOCATION
80% EqUITY ALLOCATION
U.S. Core Fixed Income
Emerging Markets Debt
High Yield
Cash
Real Estate
REITs
U.S. Large Cap Equity
U.S. Small Cap Equity
International Equity
Emerging Market Equity
TIPS
Commodity
Real Asset Focused Diversified with Real EstateTraditional
58%
40%27%
12%
20%
10%
37%
10%
20%
5%6%2%
2%8%
5%2%2%2%14%
16%
14%
22%
14%
3%
3%
4%8%
14%
20%
Diversified
Diversified with Real Estate
4%10%
5%
5%
5%
40%
16%
4%
9%
2%
Real Asset Focused
2%
18%
2%
10%
10%
7%16%
3%
8%
2%
22%
Traditional
54%
10%23%
5%
8%
Diversified
48%
19%
6%
9%
2%
5%5%
6%
The above allocations are shown for illustrative purposes only.
* Sources: please refer to appendix 3 on P. 38

J.P. Morgan Asset Management | 33
• Low-volatility portfolio batting averages indicate inflation risk abates after five years. Significant reductions in equity exposure can shorten the inflation sensitive period from 10 years to five. Diversified portfolios—both including and excluding real assets—show a five-year batting average versus inflation of nearly 100% based on historical return analysis (Exhibit 40). These results also demonstrate that lowering portfolio volatility through reduced equity exposure and add-ing diversification can be effective in minimizing the risk of negative real returns, independent of any allocations to real assets.
• Low-volatility portfolio forward-looking performance indicates consistency after 10 years. The forecasted perfor-mance of the low-volatility portfolio differs significantly from the historical performance. Based on forward-looking return assumptions for its component asset classes, the batting average versus inflation does not approach 100% until close to the 10-year mark (Exhibit 41).
These three sets of results suggest that investors should not rely exclusively on any one set of assumptions—historical track record or forward-looking assumptions—to understand how their portfolios might behave in different inflationary environ-ments.
Neither can they rely solely on asset class analysis or even portfolio simulations. A holistic approach is best, one which uses both historical performance and forward-looking assump-tions, for both asset classes and portfolios. This approach gives a clearer picture of the fluidity of inflation sensitivity over the entire time horizon.
It also adds nuance to the design and implementation of infla-tion protection strategies, suggesting that investors need to gradually reposition portfolios during the 10-year period before retirement. While the goal is to complete the desired allocation shift by the five-year mark (after which inflation sensitivity in-creases rapidly), the reallocation path is just as important as the goal. The fund should dollar-cost-average into these positions over several years in an effort to avoid time period sensitivity during the reallocation process.
Traditional
Diversified
Diversified w/real estate
Real Asset-focused
70
80
90
100
1 year 3 year 5 year 10 year
ExHIBIT 40: HISTORICAL BATTING AVERAGE VS. CPI FOR 35% EqUITY PORTFOLIOS*
Holding period
% B
atti
ng a
vera
ge
ExHIBIT 41: FORECASTED BATTING AVERAGE FOR 35% EqUITY PORTFOLIOS*
Traditional
Diversified
Diversified w/real estate
Real Asset-focused
70
80
90
100
1 year 3 year 5 year 10 year
Holding period
% B
atti
ng a
vera
ge
* Sources: please refer to appendix 3 on P. 38

34 | Aiming At a Moving Target—Managing inflation risk in target date funds
C. The role for real assets in target date funds
The need to lower portfolio volatility during the pre-retirement phase of the glide path can affect the attractiveness of certain assets commonly used for inflation protection.
In our empirical analysis of real assets, commodities emerged •as an attractive real asset. However, we believe its potentially high volatility makes it inappropriate for target date funds during the relatively short time period just prior to retirement where inflation protection is most important, as investors seek to pull their money out of these funds.
We do believe that commodities remain an attractive option for longer time horizons, but their attractiveness stems as much from their diversification benefits as from their pure inflation protection benefits. As we have demonstrated, investors with a long time horizon can rely on total portfolio returns to make up any losses incurred during transitory inflation cycles.
Direct real estate appears to be the most attractive real asset •for this pre-retirement phase. It shows low volatility and still achieves high relative returns. It may, however, pose liquidity constraints, and it may be out of reach for some non-institu-tional investors.
TIPS appear to provide effective inflation protection when •inflation spikes, but these regimes are rare. And during periods of low inflation, TIPS may dampen the portfolio’s return potential. Combining TIPS with REITs, however, may be an effective approach, particularly if direct real estate is not accessible.
D. Addressing residual risk
Historical analysis shows that even in the shortest time hori-zons, i.e. less than three years, low volatility portfolios may re-duce the frequency of negative real returns. The risk of negative real returns, however, can never be entirely eliminated.
This is particularly true for low inflation regimes, such as the 10-year period from 1997 to 2007 (Exhibit 42). During this period, nearly all negative real returns resulted from negative nominal returns, and reducing the portfolio’s equity component appears to have helped reduce downside outcomes.
It also holds true for regimes that include inflation shocks, such as the 30-year period from 1978–2007 (Exhibit 42). However,
low volatility portfolios provided less effective protection during a period when only 40% of negative real returns were caused by negative nominal returns. Reducing the portfolio’s equity component was ineffective in keeping up with rare inflationary spikes during this time period.
Even on a forward-looking basis, the low volatility, low equity portfolio significantly reduced the expected frequency of nega-tive real returns (Exhibit 43).
But again, no matter how effective the hedging strategy, some residual risk remains. It is up to target date fund managers and sponsors to assess how great the residual risk is for the target time period. Then they must make balanced fiduciary decisions regarding the trade-offs necessary to mitigate that risk, i.e. sac-rificing growth in exchange for short-term inflation protection, or accepting additional volatility and inflation risk in an effort to maintain the portfolio’s growth.
ExHIBIT 43: FORECASTED PROBABILITY OF ROLLING 3-YEAR RETURN BELOW INFLATION*
ExHIBIT 42: FREqUENCY OF ROLLING 3-YEAR RETURN BELOW INFLATION*
80% Equity 35% Equity
Historical since 1978
Traditional 13.5% 11.9%
Diversified 12.9% 10.5%
Diversified with Real Estate 9.6% 8.1%
Real Asset Focused 8.4% 4.5%
Historical since 1997
Traditional 26.7% 12.5%
Diversified 25.0% 10.8%
Diversified with Real Estate 20.0% 5.0%
Real Asset Focused 15.0% 0.8%
80% Equity 35% Equity
Traditional 21.8% 9.2%
Diversified 21.3% 10.1%
Diversified with Real Estate 20.5% 8.8%
Real Asset Focused 18.9% 8.6%
* Sources: please refer to appendix 3 on P. 38

J.P. Morgan Asset Management | 35
E. Connecting the dots: Diversification across the target date glide path
A fiduciary goal of minimizing downside outcomes, rather than maximizing the upside, brings with it a built-in bias toward steady reductions in volatility as the portfolio progresses along the glide path. This approach has the additional benefit of helping to minimize the risk of negative real returns prior to retirement.
We demonstrate this with the glide path of the J.P. Morgan SmartRetirement strategy (Exhibit 44). With 40 years to retire-ment, this glide path starts out on the left with a relatively high allocation to risk assets such as equities and extended fixed income (almost 90%), and moves to a low volatility, low equity position (about 30%) at the point of retirement, almost all the way to the right. This allocation is maintained throughout retire-ment, as the con-stant allocations indicate.
Asset classes that are not part of the initial allocation but are added later in the glide path, such as TIPS, are incorporated
gradually rather than all at once at their full target weight—in the case of TIPS the target weight is 10% at the point of retire-ment. This gradual approach is aimed at managing market-tim-ing risk with respect to both inflation-sensitive assets and total portfolio volatility.
We emphasize the need to minimize market-timing risk, particu-larly with respect to inflation sensitive assets. Since large swings in returns can occur quickly as inflation moves from rising to falling, making large allocation shifts at a single point in time runs the risk of doing so at the worst part of the cycle.
Dollar-cost-averaging into the position, by incrementally adding to the asset as the glide path changes, limits potential damage to the portfolio if an asset is added at a cyclical high, since only a fraction of the total position will be added at the highest price. In the same vein, any significant changes to asset allocations, such as the reduction of risk assets overall, should be done gradually for the same reason.
Cash
TIPS
U.S. Core Fixed Income
High Yield
Emerging Markets Debt
Emerging Market Equity
International Equity
U.S. Small Cap Equity
U.S. Large Cap Equity
REITs
Direct Real Estate
% o
f Por
tfol
io A
lloca
tion
ExHIBIT 44: SAMPLE GLIDE PATH ALLOCATIONS*
100
90
80
70
60
50
40
30
20
10
25 30 35 40 45 50 55 60 65 70 75 80
0
Participant Age
* Sources: please refer to appendix 3 on P. 38

36 | Aiming At a Moving Target—Managing inflation risk in target date funds
Consider the fiduciary goal: Minimizing the risk
of downside outcomes and achieving a balance
between individual needs and the interests of the
entire investor pool.

J.P. Morgan Asset Management | 37
Clearly, there is no silver bullet for managing inflation risk. Effective inflation protection strate-gies can only come from a complete understand-ing of the investor’s goals and objectives. In the case of target date funds, that goal is a fiduciary one: Minimizing the risk of downside outcomes and achieving an effective balance between individual needs and the interests of the entire investor pool.
Sponsors seeking to protect investors from negative real re-turns must simultaneously address three issues that play a key role in managing downside risk: growth, volatility, and liquidity. In the role of fiduciary, the plan sponsor must balance all these competing needs and goals. It is not easy, and there will not be one optimal solution that suits every plan.
This research, however, provides a framework for assessing the appropriate time horizon for inflation protection, and for understanding the risks and trade-offs involved. The framework we present, with strong empirical support, is based on the fol-lowing principles:
• Inflation shocks are rare, and most inflation shortfalls or negative real returns occur when inflation is contained.
• Every inflation hedging asset will work in some environments, but no hedging asset will work in every environment.
Individual objectives and constraints are crucial to effective •hedging—particularly time horizon, volatility tolerance, and liquidity needs.
With these sound quantitative and qualitative insights, we hope that this research can help plan sponsors achieve the best, most appropriate decision for their plan and their participants.
An investor’s rule of thumb should be that the narrower and more focused the hedge, the less overall protection can be
expected from it, and the higher its vulnerability to asset class risk. Thus, investors need to consider inflation in context—evalu-ating other business and economic cycles that may be occurring contemporaneously with inflation, and the asset class risks they may create. And like any other portfolio challenge, the tactics used for inflation protection must also support the portfolio’s other objectives and priorities.
When evaluated against these essential principles, we find that real assets are a critical weapon in the inflation battle, but they are far from the only one.
We believe that a well-diversified, low-risk portfolio can provide effective protection across multiple inflationary scenarios. The key to success is owning those assets that are most helpful and least hurtful on the way up and down, using a diversified strat-egy that protects the portfolio throughout the entire inflation cycle.
Finally, we would encourage investors to raise the question of inflation risk in the context of overall portfolio construction. The holistic approach we have outlined in this paper supports the notion that inflation hedging should not be approached as a portfolio add-on, but rather as a core component of the portfo-lio modeling and construction process.
It is an interesting problem that we will continue to analyze and consider, with a goal of advancing the understanding of inflation risk and moving toward innovative and effective portfolio solu-tions.
Conclusion There is no silver bullet: Diversification is the best weapon against inflation

38 | Aiming At a Moving Target—Managing inflation risk in target date funds
Appendix
Appendix 1: Historical TIPS index returns 1,2
Inflation-linked bonds have existed since the 1700s, but Treasury Inflation-Protected Securities (TIPS)—inflation-linked bonds issued by the U.S. Treasury—have only existed since 1997. Because there is no long-term history for government-issued, inflation-linked bonds, we are required to create a historical return series if we are to undertake any long-term statistical analysis. We do this by generating a historical real yield series and estimating total returns. The following methodol-ogy was used to generate the historical returns used in most of the analysis in this paper.
Historical Real YieldsThe price of an inflation-linked bond is driven by real yields just as regular bond prices are affected by nominal yields. As real yields increase, TIPS prices fall and vice versa.
To estimate historical real yields, we applied the Fisher Relation Model, where the nominal yield is equal to the real yield compounded by the expected inflation. This is equivalent to saying that real yields are ap-proximately equal to nominal yields less expected inflation.
Rr = Rn – E(I)
Historical nominal yields are readily available but expected inflation is difficult to measure. We have estimated expected inflation as the most recently published annual inflation. This is the previous month’s Y-O-Y CPI which is typically used by the market. (Source: Ibbotson / Lucas and Queck)
Current real and nominal yields can be quoted in the market. How-ever, the difference between these two yields may not be equal to the market’s expected rate of inflation because investors should be willing to accept a lower real yield on TIPS because the bond provides inflation protection.
Investors pay a premium for owning an individual bond that guaran-tees the total return will keep pace with inflation. The current premium is calculated as the difference between the expected real return of a nominal bond and the current yield of an inflation-linked bond with the same maturity. The premium should be proportional to the recent volatility of inflation.1
We can calculate the historical inflation index premium as:
Pi = Si/St * Pt
Where:
• Si is the standard deviation of inflation over the previous three years;
•St is the standard deviation of inflation over the three years ending in 1997 to set up a base level of volatility;
• Pt is the average premium observed since 1997
We can then create an historical real yield series as:
Rr = Rn – E(I) - Pi
Historical Monthly Total ReturnsTo translate the real yield series into a total return history for a synthetic TIPS index, we simulated an index that was capturing the mark-to-market effects of monthly changes in real yields, similar to other fixed income index returns. We estimate the index return as the current coupon plus the change in yields from the previous month times the average duration of a TIPS Index.
TIPS return = annual real yield/12 + (previous month’s yield—current yield)2 Duration
We estimated the duration to be five years by looking at Barclays Capi-tal U.S. inflation-linked Index. To create a total return, we then added the current month’s inflation.
Appendix 2: Commodity index alternatives3
Equally-weighted ReturnsIn order to analyze returns of commodities without the biases often present in the popular indices (such as overweighting oil and energy), we sought to construct an equally-weighted index of commodity futures to test along side a conventional index such as the Goldman Sachs Commodities Index (GSCI).
To create the equally-weighted index, we obtained data from a number of sources, including the Gorton-Rouwenhorst study described in their paper, Facts and Fantasies about Commodity Futures; the Commodity Research Bureau (CRB); and the London Metals Exchange. This covers all commodity futures that are in existence today.
To create returns for this equally-weighted index, the returns of each commodity are first calculated by rolling the nearest futures contract, assuming it is fully collateralized with T-bills and marked-to-market on a monthly basis. The index is then constructed by averaging the monthly returns of all the commodities in the index. (Please see Gorton-Rouwenhorst’s paper or NBER’s website for further details.)3
Returns post-2005 were calculated by using fully collateralized total returns for each individual commodity used in the DJ-AIG Index, again equally-weighted. This series is spliced onto the previous series.
1 Ibboston2 Chen and Terrien, TIPS as an Asset Class, Ibbotson Associates, November 1999.3 Gorton and Rouwenhorst, Facts and Fantasies about Commodity Futures, National Bureau of Economic Research, June 2004.

J.P. Morgan Asset Management | 39
Appendix 3: Data SourcesExhibit 1: 22 quarters are represented; as a result, there are 119 rolling 1-year results, 115 rolling 2-year results, etc.
NCREIF, Barclay’s Capital Aggregate Index, NAREIT Equity Index, S&P 500 Total Return, J.P. Morgan equal weighted proprietary backtested commodities index.
Based on quarterly total returns, 1978 Q1 to 2008 Q2
Exhibit 2: Based on quarterly total returns, 1978 Q1 to 2008 Q2
CPI headline inflation, Bureau of Labor Statistics
Exhibit 3: Business Cycle estimated by YOY change in U.S. non-farm payroll.
Exhibit 4 and 5: Inflation is shown as an average annualized percent-age for the relevant periods
Exhibit 6, 7 and 8: Russell 2000 Total Return Index
Exhibit 9 and 10: U.S. Large Cap Equity – S&P 500 Total Return IndexU.S. Core Fixed Income – Barclays Capital Aggregate Bond IndexU.S. Small Cap Equity – Russell 2000 Total Return IndexEmerging Markets Equity - MSCI Emerging Market Free IndexEmerging Market Debt – JPMorgan EMBI Global IndexCommodities – Goldman Sachs Commodities Index (GSCI)
TIPS: Barclays Capital Inflation Linked Index, and TIPS Back-tested his-torical returns: returns estimated from backfilled TIPS yields = nominal yields—expected inflation—TIPS premium (average premium * inflation volatility)
High Yield: Barclays Capital High Yield IndexREIT – NAREIT Equity IndexDirect Real Estate – NCREIF IndexInternational Equity – MSCI EAFE (USD) Index
Inflation is shown as an average annualized percentage for the relevant periods
Exhibit 11, 12 and 13: U.S. Core Fixed Income - Barclays Capital Aggregate Bonds Index
Exhibits 14, 15 and 16: U.S. Large Cap Equity - S&P 500 Total Return Index
Exhibits 17, 18 and 19: Emerging Markets Equity - MSCI Emerging Market Free Index
Exhibits 20, 21, 22, 23 and 24: Commodities – Goldman Sachs Com-modities Index (GSCI)
Exhibits 25, 26 and 27: TIPS – Barclays Capital Inflation Linked Index, and TIPS Back-tested historical returns: returns estimated from backfilled TIPS yields = nominal yields—expected inflation—TIPS pre-mium (average premium * inflation volatility)
Exhibits 28 and 29: U.S. Core Fixed Income – Barclays Capital Aggre-gate Bond Index
Exhibit 30, 31 and 32: Direct Real Estate – NCREIF Index
Exhibit 33, 34 and 35: REIT – NAREIT Equity Index
Exhibit 36 and 37: Direct Real Estate – NCREIF IndexREIT – NAREIT Equity Index
Exhibit 38: 22 quarters are represented; as a result, there are 119 roll-ing 1-year results, 115 rolling 2-year results, etc.
NCREIF, Barclays Capital Aggregate Bond Index, NAREIT Equity Index, S&P 500 Total Return, J.P. Morgan equal weighted proprietary back-tested commodities index.
Based on quarterly total returns, 1978 Q1 to 2008 Q2
Exhibit 39, 40, 41, 42 and 43: U.S. Large Cap Equity – S&P 500 Total Return IndexU.S. Core Fixed Income – Barclays Capital Aggregate Bond IndexU.S. Small Cap Equity – Russell 2000 Total Return IndexEmerging Markets Equity - MSCI Emerging Market Free IndexEmerging Market Debt – JPMorgan EMBI Global IndexCommodities – Goldman Sachs Commodities Index (GSCI)
TIPS — Barclays Capital Inflation Linked Index, and TIPS Back-tested historical returns: returns estimated from backfilled TIPS yields = nominal yields—expected inflation—TIPS premium (average premium * inflation volatility)
High Yield — Barclays Capital High Yield IndexREIT — NAREIT Equity IndexDirect Real Estate — NCREIF IndexInternational Equity — MSCI EAFE (USD) Index
Frequency of historical rolling 3-year returns below 3-year inflation rate for portfolios of varying diversification and equity levels
Frequency of simulated rolling 3-year returns below 3-year inflation rate based on foreward-looking risk and return assumptions
Exhibit 44: J.P. Morgan Asset Management

40 | Aiming At a Moving Target—Managing inflation risk in target date funds
IMPOrtANt DISClAIMer
This document is intended solely to report on various investment views held by J.P. Morgan Asset Management. Opinions, estimates, forecasts, and statements of financial market trends that are based on current market conditions constitute our judgment and are subject to any change without notice. We believe the information provided here is reliable but should not be assumed to be accurate or complete. The views and strategies described may not be suitable for all investors. References to specific securities, asset classes and financial markets are for illustrative purposes only and are not intended to be, and should not be interpreted as, recommendations. Indices do not include fees or operating expenses and are not available for actual investment. References to future net returns are not promises or even estimates of actual returns a client portfolio may achieve. The exhibits contained herein are for illustrative purposes only and are not to be relied upon as advice or interpreted as a recommendation. The value of investments and the income from them may fluctuate and your investment is not guaranteed. Past performance is no guarantee of future results. Please note current performance may be higher or lower than the performance data shown.
J.P. Morgan Asset Management is the marketing name for the asset management businesses of JPMorgan Chase & Co. Those businesses include, but are not limited to, J.P. Morgan Investment Management Inc., JPMorgan Investment Advisors Inc., Security Capital Research & Management Incorporated and J.P. Morgan Alternative Asset Management, Inc.
245 Park Avenue, New York, NY 10167
© 2009 JPMorgan Chase & Co.
Authors
Anne Lester Katherine Santiago, CFAManaging Director Quantitative Research AnalystSenior Portfolio Manager Global Multi-Asset GroupGlobal Multi-Asset Group
Key Contributor
Michael GilibertoManaging DirectorPortfolio ManagerGlobal Real Assets Group


www.jpmorgan.com/insight
J.P. MorGAn Asset MAnAGeMent
245 Park Avenue I New York, NY 10167


