37
AIMS APAC REIT 13 October 2021 FY2022: Half Year Financial Results Ended 30 September 2021 3 TUAS AVE 2, SINGAPORE

AIMS APAC REIT
13 October 2021
FY2022: Half Year Financial Results Ended
30 September 2021
3 TUAS AVE 2, SINGAPORE
Disclaimer
This Presentation is focused on comparing actual results for the financial period from 1 April 2021 to 30 September 2021 (“1H FY2022”) versus actual results year-on-year (“y-o-y”) and
quarter-on-quarter (“q-o-q”). This Presentation shall be read in conjunction with AIMS APAC REIT’s (“AA REIT” or the “Trust”) results for 1H FY2022 as per the SGXNet Announcement.
The information contained in this presentation is for information purposes only and does not constitute an offer to sell or any solicitation of an offer or invitation to purchase or subscribe for
units in AIMS APAC REIT (“Units”) in Singapore or any other jurisdiction, nor should it or any part of it form the basis of, or be relied upon in any connection with, any contract or commitment
whatsoever.
The past performance of the Units and AA REIT is not indicative of the future performance of AA REIT. Predictions, projections or forecasts of the economy or economic trends of the
markets are not necessarily indicative of the future or likely performance of AA REIT.
The value of the Units and the income derived from them may fall as well as rise. Units are not obligations of, deposits in, or guaranteed by, the AIMS APAC REIT Management Limited (the
“Manager”). An investment in Units is subject to investment risks, including the possible loss of the principal amount invested. Investors have no right to request that the Manager redeem
their Units while the Units are listed. It is intended that holders of Units (“Unitholders”) may only deal in their Units through trading on Singapore Exchange Securities Trading Limited (the
“SGX-ST”). Listing of the Units on the SGX-ST does not guarantee a liquid market for the Units.
This presentation may contain forward-looking statements that involve risks and uncertainties. Actual future performance, outcomes and results may differ materially from those expressed in
forward-looking statements as a result of a number of risks, uncertainties and assumptions. Representative examples of these factors include (without limitation) general industry and
economic conditions, interest rate trends, cost of capital and capital availability, competition from similar developments, shifts in expected levels of property rental income, changes in
operating expenses, including employee wages, benefits and training, property expenses and governmental and public policy changes and the continued availability of financing in the
amounts and the terms necessary to support future business. You are cautioned not to place undue reliance on these forward-looking statements, which are based on the Manager's current
view of future events.
The information in this presentation has not been independently verified. No representation, warranty, express or implied, is made as to, and no reliance should be placed on, the fairness,
accuracy, completeness or correctness of the information and opinions in this presentation. None of the Manager, or any of its respective affiliates, advisers or representatives, shall have
any liability (in negligence or otherwise) for any loss howsoever arising from any use of this presentation or its contents or otherwise arising in connection with this presentation.
Important Notice
2

3
Contents
1H FY2022 Financial Results
Portfolio Performance
Highlights: 1H FY2022
Prudent Capital Management
Market Outlook & Strategy
3 TUAS AVE 2, SINGAPORE

4
7 BULIM STREET, SINGAPORE
Highlights:
1H FY2022

Highlights for 1H FY2022
5
Valuation Growth
DPU of 2.50 cents per Unit for 2Q
FY2022, an increase by 25.0% y-o-y
DPU of 4.75 cents for 1H FY2022
Growing DPU
Proactive Lease Management
1H FY2022 Net Property Income of
S$47.7 million, an increase of S$7.8
million or 19.4% from 1H FY2021
Contributed by the acquisition of 7 Bulim Street
and higher rentals from three other properties
Net Property Income Growth
26 New & Renewal Leases for 2Q FY2022
Totaling 45,722 sqm or 6.2% of Total Net
Lettable Area
Portfolio Occupancy: 97.3%
Above JTC 2Q 2021 industrial average of 90.1%
Increase from 95.4% as at 31 March 2021
Revaluation uplift of S$37.1 million
resulting in an increase in portfolio
valuation to S$1,746.5 million
Valuation uplift largely driven by revaluation
gains for Optus Centre and Boardriders Asia
Pacific HQ in Australia

6
Highlights for 1H FY2022 (cont’d)
Resilient performance backed by established portfolio, with over 50% comprising of
warehouse and logistics sectors
• Diverse, reputable tenant base comprising 190 reputable global and local companies across
multiple industries
Continues to pursue strategic investments and business partnerships to generate attractive
long-term total returns
Announced proposed acquisition of Woolworths HQ at a purchase consideration of
A$463.25 million
Established Resilient Portfolio
Healthy Leverage of 24.7% (31 March 2021: 33.9%)
Undrawn Committed Facilities of S$151.8 million
Low blended debt funding cost of 2.8%
Healthy Interest Coverage Ratio of 4.5 times
98.1% of the portfolio’s interest rates fixed taking into account interest rate swaps and fixed
rate notes
Prudent Capital Management

1 Based on the closing price of S$1.46 on 12 October 2021 and annualised FY2022 DPU of 9.50 cents. Annualised DPU is computed based on actual DPU payout for the
first half of FY2022 and annualised to the full year2 Source: Bloomberg data as at September 20213 Prevailing CPF Ordinary Account interest rate
AA REIT Yield1 FTSE ST REIT 12-month Yield2
CPF Ordinary Account3
Singapore Govt 10-year bond2
Bank 12-mth fixed deposits2
8%
6%
4%
2%
0%
492 bps spread
%yie
ldp
er
an
nu
m
6.51%
4.25%
2.50%
1.59%
0.24%
Attractive Return on Investment
7

8
Total Distributions Since 2011
1 The number of Units used to calculate the Distr ibut ion per Unit has been adjusted for the effect of the Unit Consolidat ion to allow for comparison2 CAGR (compound annual growth rate) computed from FY2011 to FY2021
To
tal D
istr
ibu
tio
ns (
S$
`m
)
9.92 10.4510.72 10.53
11.07 11.3511.05
10.3 10.259.5
8.95
4.75
37.2
46.3248.06
57.2
69.272.06
70.567.37
70.5
66.5163.25
33.6
0.0
10.0
20.0
30.0
40.0
50.0
60.0
70.0
80.0
0.00
10.00
20.00
30.00
FY2011 FY2012 FY2013 FY2014 FY2015 FY2016 FY2017 FY2018 FY2019 FY2020 FY2021 1HFY2022
Distributions Per Unit (LHS) Total Distrbutions (RHS)
Dis
trib
utio
ns P
er
Unit
(Sin
ga
po
re C
en
ts)
1 1

9
No. of
Properties
Valuation as at
30 September 2021
($’000)
Valuation as at
31 March 2021
($’000)
Change
($’000)
Change
(%)
Singapore 26 S$1,357,600 S$1,348,200 S$9,400 0.7
Australia 1 2S$388,909 2
(A$396,990)
S$376,503 3
(A$367,900)
S$12,406
(A$29,090) 3.3
Total 28 S$1,746,509 S$1,724,703 S$21,806 1.3
1 Based on 49% interest in Optus Centre.2 An exchange rate of A$1: S$0.979644 is adopted as at 30 September 2021.3 An exchange rate of A$1: S$1.023385 is adopted as at 31 March 2021.
Investment Property - Valuation Uplift
Total revaluation gain of S$37.1 million increases AA REIT’s portfolio value to S$1.746 billion
10
1H FY2022
Financial
Results
29 WOODLANDS INDUSTRIAL PARK E1, SINGAPORE
10
11
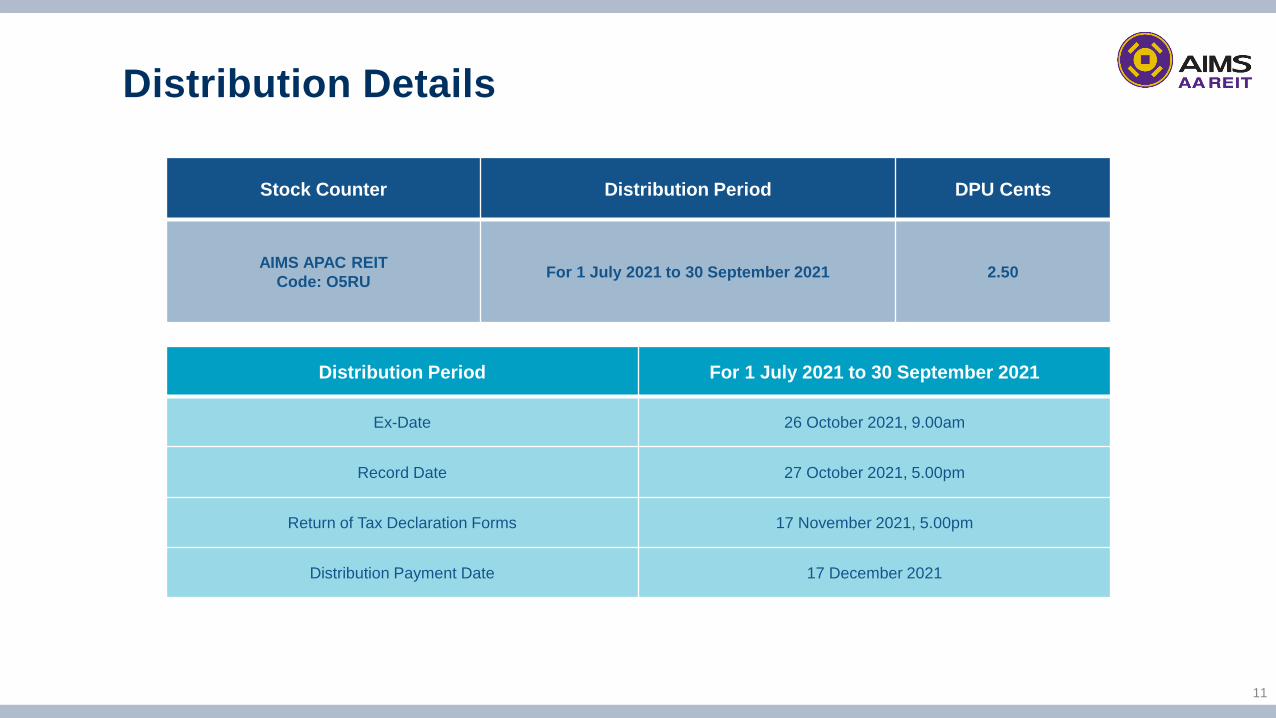
Distribution Details
Stock Counter Distribution Period DPU Cents
AIMS APAC REIT
Code: O5RUFor 1 July 2021 to 30 September 2021 2.50
Distribution Period For 1 July 2021 to 30 September 2021
Ex-Date 26 October 2021, 9.00am
Record Date 27 October 2021, 5.00pm
Return of Tax Declaration Forms 17 November 2021, 5.00pm
Distribution Payment Date 17 December 2021

12
1H FY2022 Results1
(S$’000 unless otherwise stated)1H
FY2022
1H
FY2021
Y-o-Y
(%)
Gross Revenue 65,246 57,732 13.0
Net Property Income 47,709 39,953 19.4
Share of Profits of Joint Venture (net of tax) 2 27,264 7,624 >100.0
Distributions to Unitholders 33,603 28,268 18.9
DPU (cents) 4.75 4.00 18.8
1 Please refer to Section 3 “Review of performance of the Group“ of the interim financial statements for further explanation of the variances.2 The increase in the share of profits of joint venture was mainly due to higher share of revaluation surplus recognised from the valuation of Optus Centre of
S$19.4 million (1H FY2021: S$0.9 million).

13
1 On 1 September 2021, the Trust issued S$250.0 million of Perpetual Securities under its S$750 million Multicurrency Debt issuance Programme. The increase in cash and
cash equivalents was mainly contributed from the net proceeds, partially offset by the repayment of borrowings and the initial deposit payment for the acquisition of 1
Woolworths Way, Bella Vista, New South Wales, Australia.2 Excluding unamortised loan transaction costs.3 Aggregate leverage ratio is computed as total borrowings as a percentage of total assets. Right-of-use assets and lease liabilities were excluded from the computation of
aggregate leverage. The total borrowings excluded Perpetual Securities holders’ funds.
Balance Sheet
(S$ million unless otherwise stated)As at
30 September 2021
As at
31 March 2021
Total Assets 1,991.2 1,846.6
Comprising:
Investment properties
Joint venture
Trade and other receivables
Derivative financial instruments
Cash and cash equivalents
1,506.7
341.7
33.6
0.9
108.31
1,489.0
335.7
9.6
1.1
11.2
Total Liabilities 630.5 759.2
Net Assets 1,360.7 1,087.4
Comprising:
Unitholders’ funds
Perpetual Securities holders’ funds
987.1
373.61
962.8
124.6
NAV per Unit 1.40 1.36
Total Borrowings2 467.3 593.8
Aggregate Leverage3 (%) 24.7 33.9

14
1 Based on the book value of investment properties as well as the 49.0% interest in the book value of Optus Centre, Macquarie Park, NSW, Australia and excluding right-of-use assets2 Based on the units outstanding and closing price of S$1.46 on 12 October 2021, and S$1.21 on 26 October 2020 respectively3 Aggregate leverage ratio is computed as total borrowings as a percentage of total assets. Right-of-use assets and lease liabilities were excluded from the computation of aggregate
leverage. The total borrowings excluded Perpetual Securities holders’ funds4 Based on Interest Coverage Ratio (ICR) definition in Appendix 6 of Code of Collective Investment Schemes (last revised on 16 April 2020). For purpose of the computation, interest
expense included borrowing costs on lease liabilities. As at 30 September 2021, the Adjusted ICR was 3.3 times (31 March 2021: 3.4 times) where the interest expense for Adjusted
ICR further included the amount reserved for distribution to Perpetual Securities holders5 In July 2021, AA REIT obtained commitments of up to S$220 million and A$100 million to refinance several of its secured debt facilities due in 2021 and 2022. Post-refinancing and
the utilisation of the secured debt facilities to fully repay the fixed rate notes maturing in March 2022, the weighted average debt maturity (on a pro forma basis) will increase to 2.7
years.
Key Financial Metrics – 2Q FY2022
2Q
FY2022
2Q
FY2021
Portfolio Value (S$ million)1 1,746.5 1,549.5
Market Capitalisation (S$ million)2 1,032.9 855.1
NAV per Unit (S$) 1.40 1.34
Share Price (S$) 1.46 1.21
Premium over / (Discount to) NAV (%)2 4.3 (9.7)
Aggregate Leverage (%)3 24.7 33.6
Interest Coverage Ratio (times)4 4.5 3.7
Weighted Average Debt Maturity (years)
2.1
(2.7 post refinancing on a
proforma basis)5
2.6

15
Prudent
Capital
Management
1A INTERNATIONAL BUSINESS PARK, SINGAPORE

16
Debt Facilities as at 30 September 2021
Secured SGD Borrowings
Total secured facility of S$245.0 million comprising:
4-year revolving credit facility of S$120.0 million maturing in November 2021
4-year term loan facility of S$25.0, maturing in July 2022
4-year term loan facility of S$100.0, maturing in July 2024
Secured AUD Borrowings
Secured AUD borrowings as natural hedge for the investments in Australia.
Total secured facility of A$228.7 million comprising:
3-year revolving credit facility of A$65.0 million, maturing in June 2022
5-year term loan facility of A$110.0 million, maturing in July 2023
3-year term loan facility of A$32.5 million, maturing in November 2023
5-year term loan facility of A$21.2 million, maturing in July 2024
In July 2021, AA REIT obtained commitments of up to S$220.0 million and A$100.0 million to
refinance several of its secured debt facilities due in 2021 and 2022.

17
Unsecured Borrowings
S$50.0 million 5-year fixed rate notes at 3.60% maturing in March 2022.
S$100.0 million 5-year fixed rate notes at 3.60% maturing in November 2024.
Summary
Overall blended debt funding cost of 2.8%.
98.1% of the portfolio’s interest rate hedged via interest rate swaps and fixed rate notes.
Weighted average debt maturity of 2.1 years (2.7 years post refinancing on a pro forma basis)1.
Diversified Funding Source
S$125 million perpetual securities at a coupon rate of 5.65%, with the first distribution rate reset
falling on 14 August 2025.
S$250 million perpetual securities at a coupon rate of 5.375%, with the first distribution rate reset
falling on 1 September 2026.
Debt Facilities as at 30 September 2021 (cont’d)
1 In July 2021, AA REIT obtained commitments of up to S$220 million and A$100 million to refinance several of its secured debt facilities due in 2021 and 2022. Post-refinancing and
the utilisation of the secured debt facilities to fully repay the fixed rate notes maturing in March 2022, the weighted average debt maturity (on a pro forma basis) will increase to 2.7
years.

108
21
32
50 49
120
49
100
49
25100
120
15
100
Maturing inFY2022
Maturing inFY2023
Maturing inFY2024
Maturing inFY2025
Maturing inFY2026
Maturing inFY2027
Pro Forma refinancing of existing secured facilities
5-year A$ term loan 3-year A$ term loan 5-year S$ fixed rate notes
3-year A$ revolving credit facility New 4-year S$ revolving credit facility New 4-year A$ revolving credit facility
New 5-year S$ term loan New 5-year A$ term loan 4-year S$ term loan
4-year S$ revolving credit facility 3-year A$ revolving credit facility 5-year S$ fixed rate notes
S$109.1m
undrawn
All
undrawn
S$17.6m
undrawnNote 1
18
2021 November (FY2022)
MATURITY DATE S$'M
2022 March (FY2022)
10.9
2022 June (FY2023)
2023 July (FY2024)
2023 November (FY2024)
2024 July (FY2025)
2024 November (FY2025)
Total Debt Drawn Down
50.0
46.1
107.8
31.8
120.7
100.0
467.3
Undrawn Available Facilities
Total Committed Facilities
151.8
619.1
Note 1: The refinancing of the secured debt facilities will enable AA REIT to have sufficient undrawn committed facilities to
repay the fixed rate notes due in March 2022
Debt Facilities as at 30 September 2021 (cont’d)

19
Portfolio
Performance
15 TAI SENG DRIVE, SINGAPORE

20
Revenue Performance since 2011
52,982
59,071 58,896
71,895
80,01382,329
79,43376,417
78,493
89,054 87,532
47,709
73,245
83,983
92,082
108,240
115,432
124,389120,119
116,916 118,078 118,860
112,633
65,246
0
20,000
40,000
60,000
80,000
100,000
120,000
140,000
FY2011 FY2012 FY2013 FY2014 FY2015 FY2016 FY2017 FY2018 FY2019 FY2020 FY2021 1H FY2022
NPI Gross Revenue
(S$
`00
0)
1 CAGR (compound annual growth rate) computed from FY2011 to FY2021
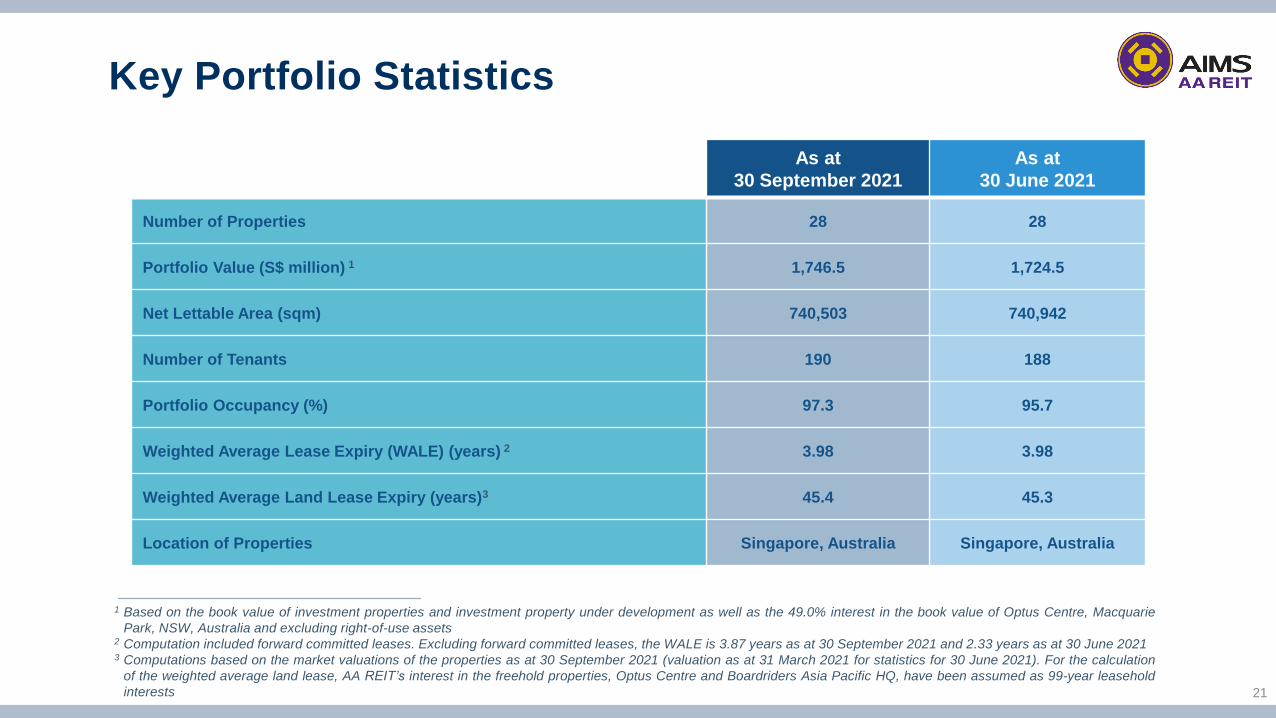
1 Based on the book value of investment properties and investment property under development as well as the 49.0% interest in the book value of Optus Centre, Macquarie
Park, NSW, Australia and excluding right-of-use assets2 Computation included forward committed leases. Excluding forward committed leases, the WALE is 3.87 years as at 30 September 2021 and 2.33 years as at 30 June 20213 Computations based on the market valuations of the properties as at 30 September 2021 (valuation as at 31 March 2021 for statistics for 30 June 2021). For the calculation
of the weighted average land lease, AA REIT’s interest in the freehold properties, Optus Centre and Boardriders Asia Pacific HQ, have been assumed as 99-year leasehold
interests
Key Portfolio Statistics
21
As at
30 September 2021
As at
30 June 2021
Number of Properties 28 28
Portfolio Value (S$ million) 1 1,746.5 1,724.5
Net Lettable Area (sqm) 740,503 740,942
Number of Tenants 190 188
Portfolio Occupancy (%) 97.3 95.7
Weighted Average Lease Expiry (WALE) (years) 2 3.98 3.98
Weighted Average Land Lease Expiry (years)3 45.4 45.3
Location of Properties Singapore, Australia Singapore, Australia

22
Portfolio Operating Metrics
PORTFOLIO NLA
Singapore, 92.4%
Australia, 7.6%
Singapore, 83.3%
Australia, 16.7%
GROSS RENTAL INCOME
MULTI-TENANTED/MASTER LEASE
Multi-tenanted, 63.6%
Master Leases, 36.4%
PORTFOLIO BREAKDOWN
Hi Tech Space, 7.9%
Light Industrial, 9.7%
General Industrial, 14.7%
Business Park, 17.5%
Logistics & Warehouse,50.2%
By 2Q
FY2022
GRI

23
Diversified Tenant/Industry Base1
1 Tenant base expanded by 6.1% over the last 24 months (190 as at 30 September 2021 vs 179 tenants as at 30 September 2019).
Logistics, 35.7%
Telecommunications, 14.7%Engineering, 11.9%
Bio-Tech/Life Sciences, 7.7%
Consumer Products, 6.2%
Pharma/Healthcare/Cosmetics, 5.2%
Fashion & Apparels, 4.3%
Furniture, 2.5%
FMCG, 2.1%
Self-Storage, 2.0%
Data Centre, 1.9%
IT & Electronics, 1.7% Others, 4.1%
Tenant/
Industry Base
By 2Q FY2022
Gross Rental Income

241 Weighted average rental increase for renewal leases was 2.1%
Active Lease ManagementLease Expiry Profile as of 30 September 2021 (By 2Q FY2022 Gross Rental Income)
New Leases Signed: 13
2Q FY2022
New Leases: 20,947 sqm
NET AREA
New and Renewal Leasesrepresent 6.2% of total NLAexecuted in 2Q FY2022
% OF TOTAL NLA
Renewal Leases Signed1: 13 Renewal Leases: 24,775 sqm
13.8%
17.2%
25.3%
9.6%
4.5%
29.6%
0.0%
5.0%
10.0%
15.0%
20.0%
25.0%
30.0%
35.0%
FY2022 FY2023 FY2024 FY2025 FY2026 FY2027 &Beyond
Lease Expiry Profile as at 30 Sept 2021
% o
f G
ross R
enta
l In
com
e

25
Resilient sectors such as logistics & warehouse, bio -medical & life science,
telecommunications & data centre operators account for 7 of our top 10 tenants
Quality Tenant Base
1.8%
1.9%
1.9%
2.6%
3.1%
3.7%
4.4%
7.4%
7.7%
14.1%
TOP 10 TENANTS BY 2Q FY2022 GROSS RENTAL INCOME

26
* For the calculation of the weighted average land lease of AA REIT, AA REIT’s interests in the freehold properties, Optus Centre and Boardriders Asia Pacific HQ, have been
assumed as 99-years leasehold interests
Our portfolio land lease tenure (by valuation) is one of the longest amongst our peers
Long Land Lease Expiry* of 45.4 years
12.7%
25.3%
31.1%
8.6%
22.3%
0%
5%
10%
15%
20%
25%
30%
35%
15 to 20 years >20 to 30 years >30 to 40 years >40 to 50 years >50 years
% o
f P
ort
folio
Va
lua
tion

27Source: Based on JTC 2Q 2021 industrial average of 90.1%
Portfolio Occupancy vs JTC Average
Our portfolio occupancy across all segments has consistently outperformed the market
97.3%
90.1%
98.1%97.5%
90.1%
84.8%
89.7% 89.7%
75.0%
80.0%
85.0%
90.0%
95.0%
100.0%
Overall Business Park Warehouse Industrial
AA REIT JTC's 2Q 2021

Portfolio Expansion – Woolworths HQ
1 An exchange rate of A$1: S$0.98 is adopted.2 Based on the valuation report by Knight Frank NSW Valuations and Advisory Pty Ltd dated 30 September 2021.3 Initial NPI Yield based on Year 1 NPI of A$23.94 million divided by Purchase Consideration.4 Includes acquisition fee of A$4.6 million and other transaction cost of A$0.9 million. 28
Purchase Consideration A$463.25 million (S$454.0 million1)
Independent Valuation A$463.25 million2 (S$454.0 million1)
NPI Yield 5.17%3
Stamp Duty A$25.5 million (S$25.0 million1)
Transaction Cost A$5.5 million4 (S$5.4 million1)
Total Acquisition Cost A$494.3 million (S$484.4 million1)
Method of Financing
Total acquisition cost is proposed to be funded by a combination of local debt
financing and net proceeds from the issuance of perpetual securities.
The Manager may also consider funding the Proposed Acquisition by a
combination of debt financing, Acquisition Fee units, net proceeds raised from
the issuance of the Perpetual Securities and new equity.
The final decision regarding the method of financing the Proposed Acquisition
will be made by the Manager at the appropriate time, taking into account the
prevailing market conditions.

Property Information
29
Property Description
Master-tenanted corporate campus comprising
(i) three multi-level interconnecting buildings housing A-grade office
accommodation,
(ii) a data centre operation and amenities; and
(iii) an on grade car park, a car park building and a four-storey multi-storey car
park totaling 3,120 car parking spaces
Address 1 Woolworths Way, Bella Vista, New South Wales
Asset Type Business Park
Land Tenure Freehold
Land Area 90,010 sq m
Net Lettable Area 44,972 sq m
Master Tenant Woolworths Group Limited
Existing Lease Term 10 years commencing from completion, with built-in rental escalation of 2.75%
Property Occupancy 100%

30
Market
Outlook &
Strategy
29 WOODLANDS INDUSTRIAL PARK E1, SINGAPORE

SINGAPORE'S ECONOMY
For the second quarter of 2021, the Singapore economy expanded by 14.7% year-on-year, faster than the 1.5% growth
in the previous quarter. The strong growth was largely due to the low base in the second quarter of 2020, when GDP
fell due to the Circuit Breaker measures implemented.
On a quarter-on-quarter seasonally-adjusted basis, the Singapore economy contracted by 1.8% in the second quarter
of 2021, a reversal from the 3.3% expansion in the preceding quarter.
The Ministry of Trade and Industry (“MTI”) upgraded Singapore’s GDP growth forecast for 2021 to “6% to 7%”, from its
previous forecast of “4% to 6%”, taking into account the better-than-expected performance in the first half of the year.
MACRO
Overall, economic growth is recovering after the pandemic-related slowdown in 2020, although economic prospects in
the global recovery have diverged further across countries. The International Monetary Fund has retained its global
growth forecast for 2021 at 6.0%.
INDUSTRIAL
Based on JTC Corporation’s market report for 2Q 2021 released on 22 July 2021, the occupancy rate for the overall
industrial property market rose slightly by 0.1 percentage point to 90.1%, compared to the previous quarter.
LOOKING AHEAD
Despite the uncertainties in the global recovery from COVID-19, the broad recovery in the Singapore and Australia
economies has provided support for the industrial sector. Demand for industrial real estate continued to be underpinned
by the manufacturing sector. Manufacturing firms are also anticipating favourable business sentiments to continue into
the last quarter of the year.
Amidst the current macroeconomic environment, AA REIT will continue to proactively manage its portfolio to deliver
sustainable distributions and create long-term value for Unitholders.
Market Outlook
31
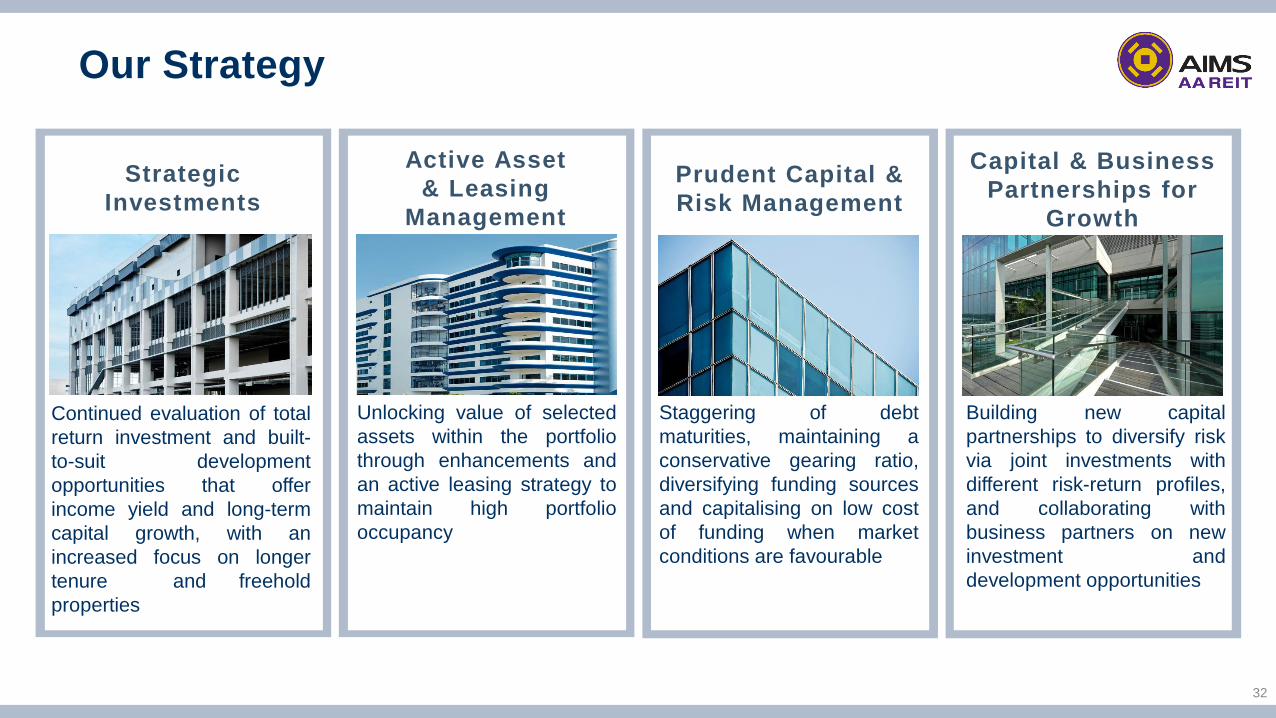
Strategic
Investments
Continued evaluation of total
return investment and built-
to-suit development
opportunities that offer
income yield and long-term
capital growth, with an
increased focus on longer
tenure and freehold
properties
Active Asset
& Leasing
Management
Unlocking value of selected
assets within the portfolio
through enhancements and
an active leasing strategy to
maintain high portfolio
occupancy
Prudent Capital &
Risk Management
Staggering of debt
maturities, maintaining a
conservative gearing ratio,
diversifying funding sources
and capitalising on low cost
of funding when market
conditions are favourable
Capital & Business
Partnerships for
Growth
Building new capital
partnerships to diversify risk
via joint investments with
different risk-return profiles,
and collaborating with
business partners on new
investment and
development opportunities
Our Strategy
32
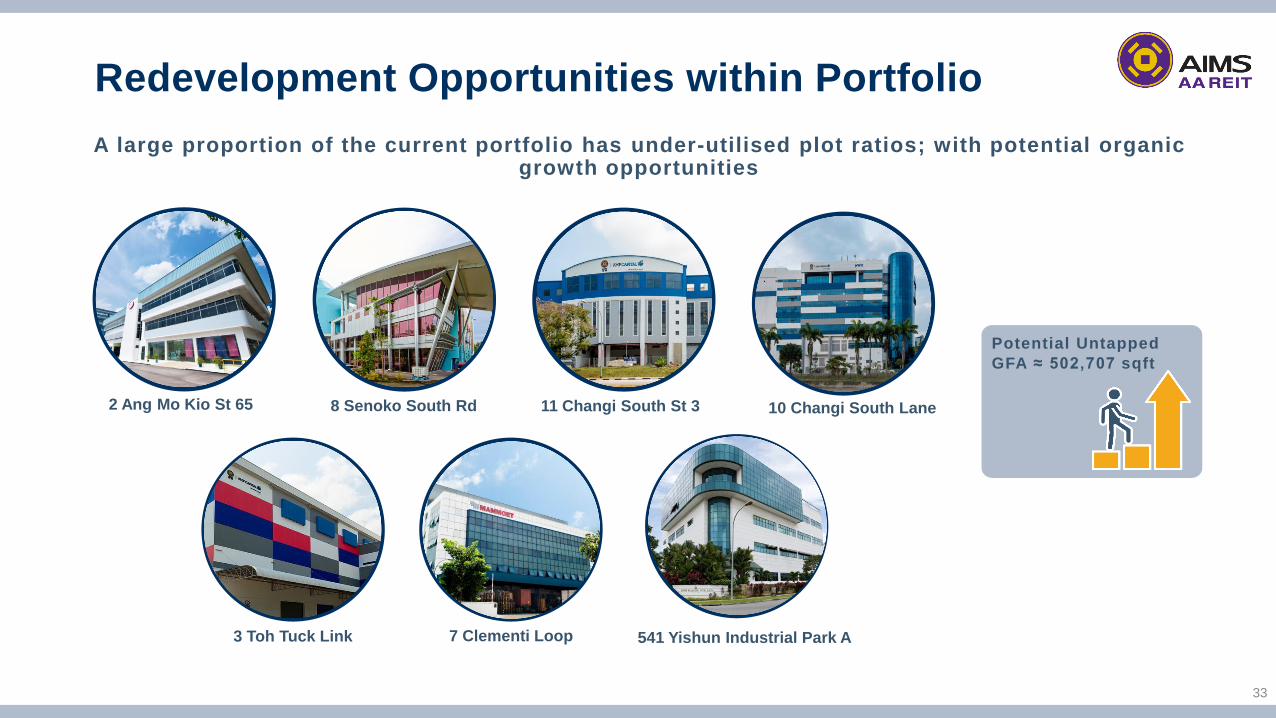
A large proportion of the current portfolio has under-utilised plot ratios; with potential organic growth opportunities
Potential Untapped
GFA ≈ 502,707 sqft
2 Ang Mo Kio St 65 8 Senoko South Rd 11 Changi South St 3 10 Changi South Lane
3 Toh Tuck Link 7 Clementi Loop 541 Yishun Industrial Park A
Redevelopment Opportunities within Portfolio
33

34
Our Resilient Portfolio
HIGH OCCUPANCY
High portfolio occupancy
rate of 97.3% versus
JTC's industry average
which stands at 90.1%1
HIGHLY RESILIENT
SECTOR
Logistics & Warehouse
account for 50.2% of AA
REIT's portfolio by Gross
Rental Income; largely
driven by resilient e-
commerce and logistics
sectors
HIGHLY DIVERSIFIED
AA REIT's portfolio is
backed by 190 tenants
across 28 properties in
Singapore & Australia from
a wide range of industry
sectors
1 JTC Quarterly Market Report, Industrial Properties, 2Q 2021

35
Sustainable Cities & Communities
Decent Work & Economic
Growth
Innovation & Infrastructure
Good Health &
Wellbeing
Affordable & Clean Energy
We are committed to incorporating
ESG factors into AA REIT’s strategy
and operations, to ensure Unitholders
with long-term sustainable returns
• Improve and minimise environmental impact
• Promote inclusive and sustainable economic growth
• Understanding and serving interests of all
stakeholders
• Ensuring robust governance framework
Our ESG Focus Areas
Strong Investor Base with
Institutional Investors
• Majority held by institutional investors
• Included in indices likely to further attract and
expand unitholder base:
• MSCI Singapore Small-Cap Index (May 2020)
• FTSE Russell ST Singapore Shariah Index (Dec 2020)
• FTSE EPRA Nareit Global Developed Index (Sep 2021)
Recognised for Corporate Governance
& Social Responsibility• Ranked 3rd out of 45 REITs and Business Trusts for
Governance Index Trusts (GIFT) 2020
• Ranked 13th out of 43 REITs and Business Trusts in
the Singapore Governance and Transparency
Index (SGTI) 2021
Environment, Social & Governance

Key Accolades
36
2017
Awarded
Shareholder
Communications
Excellence
Award
2018
Honours Award
in Traditional
Annual Report
2020
Gold Excellence in
Corporate
Governance,
Social
Responsibility and
Investor Relations
2020
Platinum Award
for Print Media/
Publications –
Annual Report
2020
3rd at the
Governance
Index for Trust
(GIFT)
2021
13th at the
Singapore
Governance
and
Transparency
Index (SGTI)

For enquiries, kindly contact:
Phone Number
Email Address
+65 6309 1063/1050 /
+65 6534 5122
Thank you!
Looking forward to your support.
1 KALLANG WAY 2A, SINGAPORE


