18
Confidential – not for third party distribution © Seabury Group 2015 Air Cargo 2015: Recent trends and impact on air cargo industry More insights, better decisions... 10.Mar.15
Confidential – not for third party distribution © Seabury Group 2015
Air Cargo 2015:
Recent trends and impact on air
cargo industry
More insights, better decisions...
10.Mar.15
1 Confidential – not for third party distribution © Seabury Group 2015
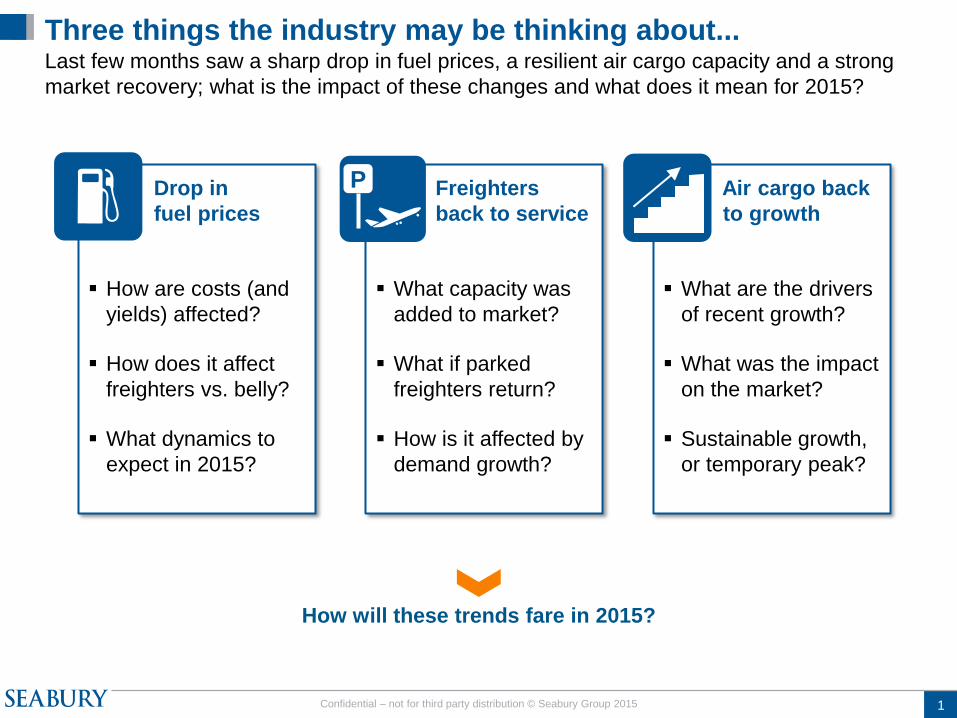
Air cargo back
to growth
What are the drivers
of recent growth?
What was the impact
on the market?
Sustainable growth,
or temporary peak?
Freighters
back to service
What capacity was
added to market?
What if parked
freighters return?
How is it affected by
demand growth?
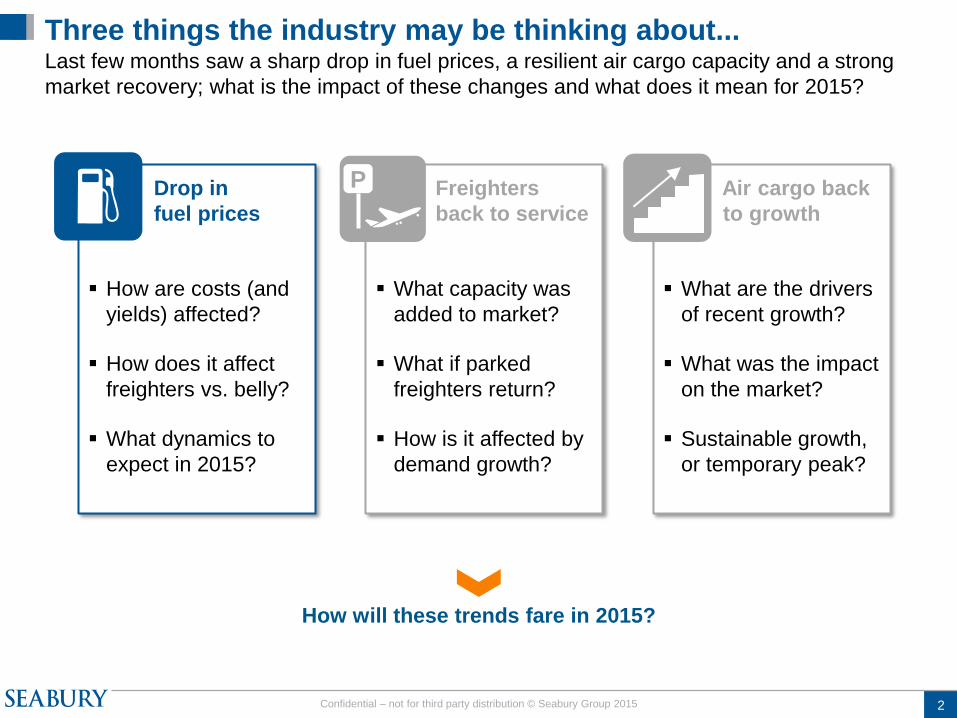
Drop in
fuel prices
How are costs (and
yields) affected?
How does it affect
freighters vs. belly?
What dynamics to
expect in 2015?
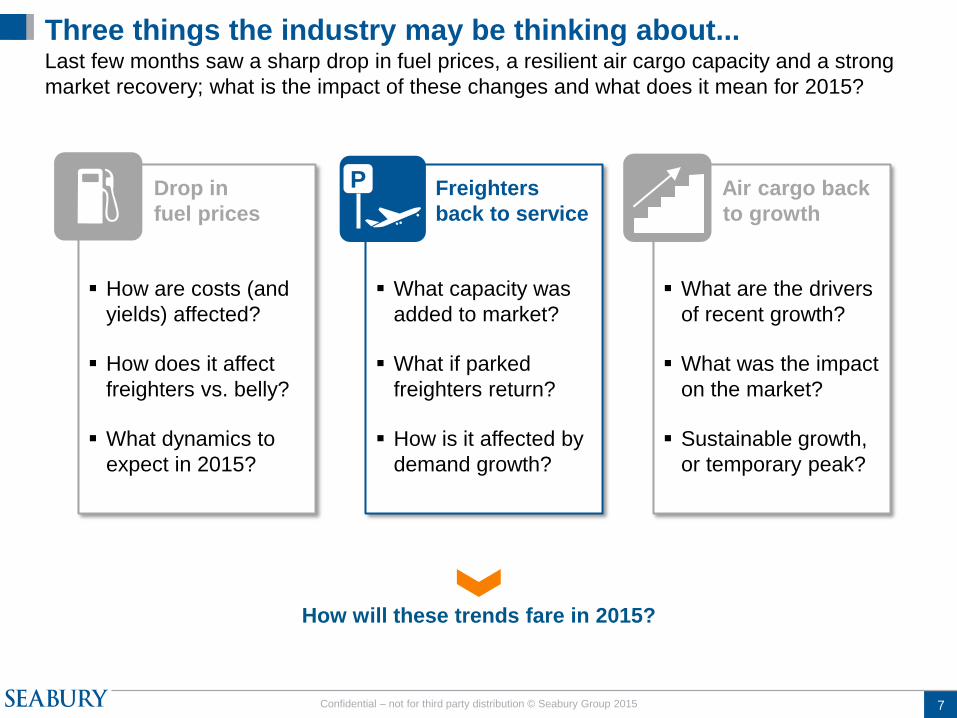
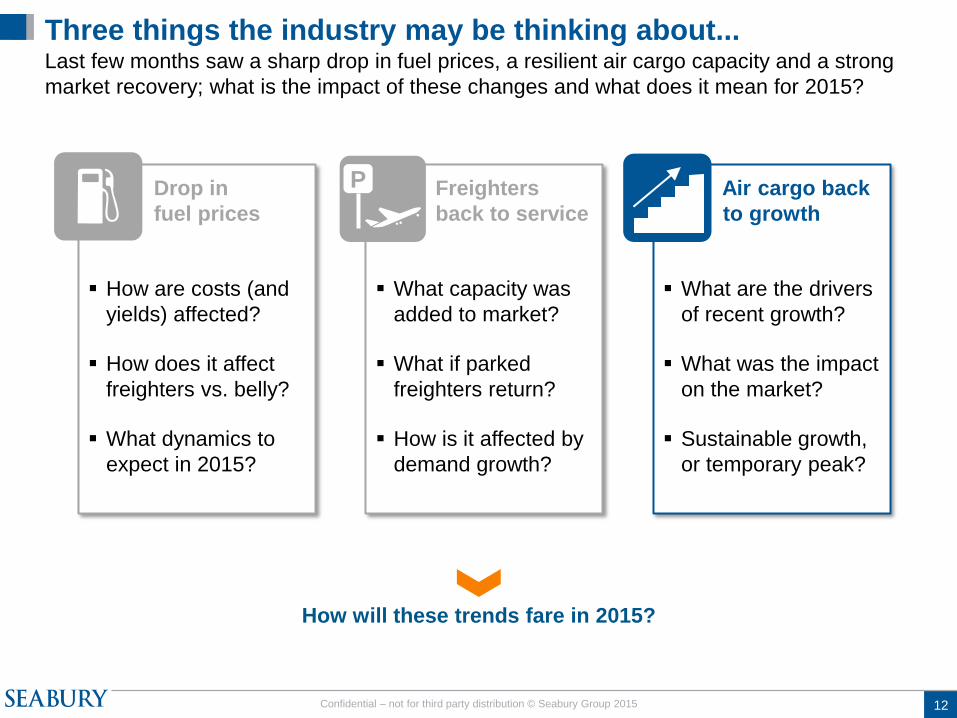
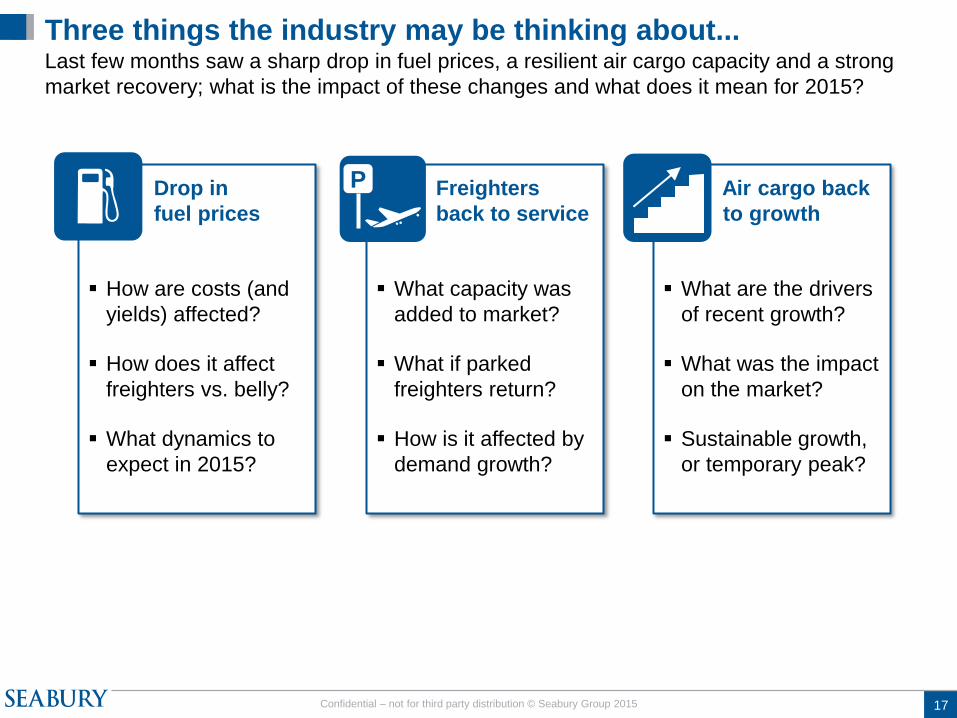
Three things the industry may be thinking about... Last few months saw a sharp drop in fuel prices, a resilient air cargo capacity and a strong
market recovery; what is the impact of these changes and what does it mean for 2015?
P
How will these trends fare in 2015?
Text from the program:
Air Cargo 2015: what is the
impact of key recent trends
to the air cargo industry?
Marco Bloemen, Senior Vice
President Seabury Group
A number of factors have
changed the air cargo
landscape in the last nine
months: fuel prices have
halved, consequently air
cargo capacity has been
resilient and market demand
saw a strong Q4 in 2014,
driven from China in
particular. What are the
effects of fuel changes? And,
will freighters that were
deemed uneconomical now
return to the marketplace? Is
the recent pick-up in demand
growth in the fourth quarter
continuing? And what role will
China continue to play as a
catalyst to air cargo growth?
2 Confidential – not for third party distribution © Seabury Group 2015
Air cargo back
to growth
What are the drivers
of recent growth?
What was the impact
on the market?
Sustainable growth,
or temporary peak?
Freighters
back to service
What capacity was
added to market?
What if parked
freighters return?
How is it affected by
demand growth?
Drop in
fuel prices
How are costs (and
yields) affected?
How does it affect
freighters vs. belly?
What dynamics to
expect in 2015?
Three things the industry may be thinking about... Last few months saw a sharp drop in fuel prices, a resilient air cargo capacity and a strong
market recovery; what is the impact of these changes and what does it mean for 2015?
P
How will these trends fare in 2015?
3 Confidential – not for third party distribution © Seabury Group 2015
110
80
70
100
90
60
50
Oct-
2014
Jan-
2015
Jul-
2014
Apr-
2014
Jan-
2014
Oct-
2013
Jul-
2013
Apr-
2013
Jan-
2013
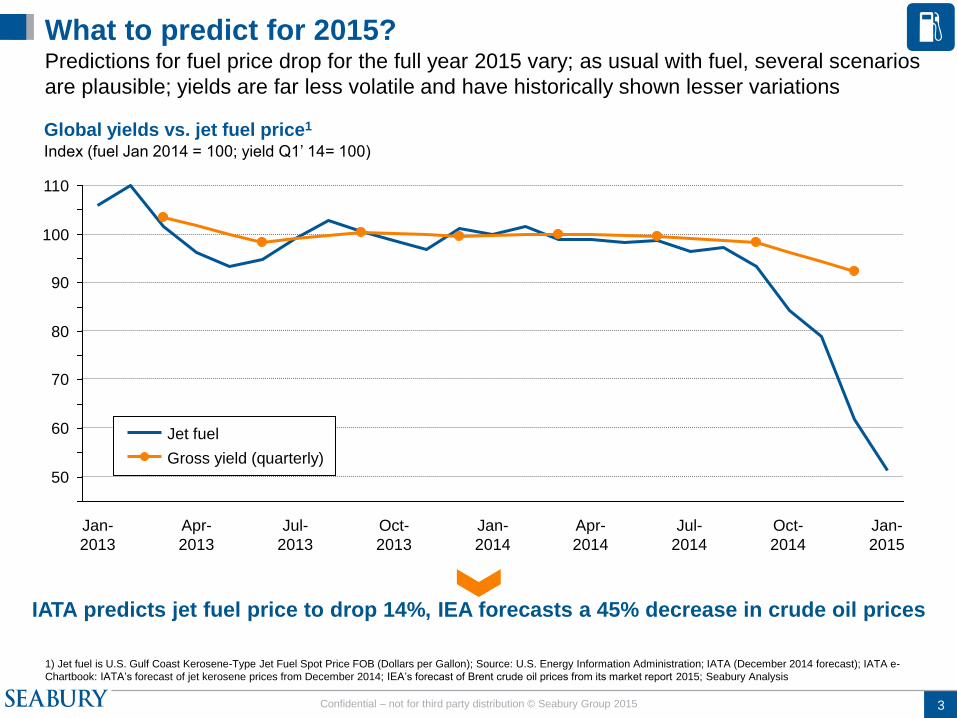
What to predict for 2015? Predictions for fuel price drop for the full year 2015 vary; as usual with fuel, several scenarios
are plausible; yields are far less volatile and have historically shown lesser variations
Global yields vs. jet fuel price1 Index (fuel Jan 2014 = 100; yield Q1’ 14= 100)
1) Jet fuel is U.S. Gulf Coast Kerosene-Type Jet Fuel Spot Price FOB (Dollars per Gallon); Source: U.S. Energy Information Administration; IATA (December 2014 forecast); IATA e-
Chartbook: IATA’s forecast of jet kerosene prices from December 2014; IEA’s forecast of Brent crude oil prices from its market report 2015; Seabury Analysis
IATA predicts jet fuel price to drop 14%, IEA forecasts a 45% decrease in crude oil prices
Jet fuel
Gross yield (quarterly)
4 Confidential – not for third party distribution © Seabury Group 2015
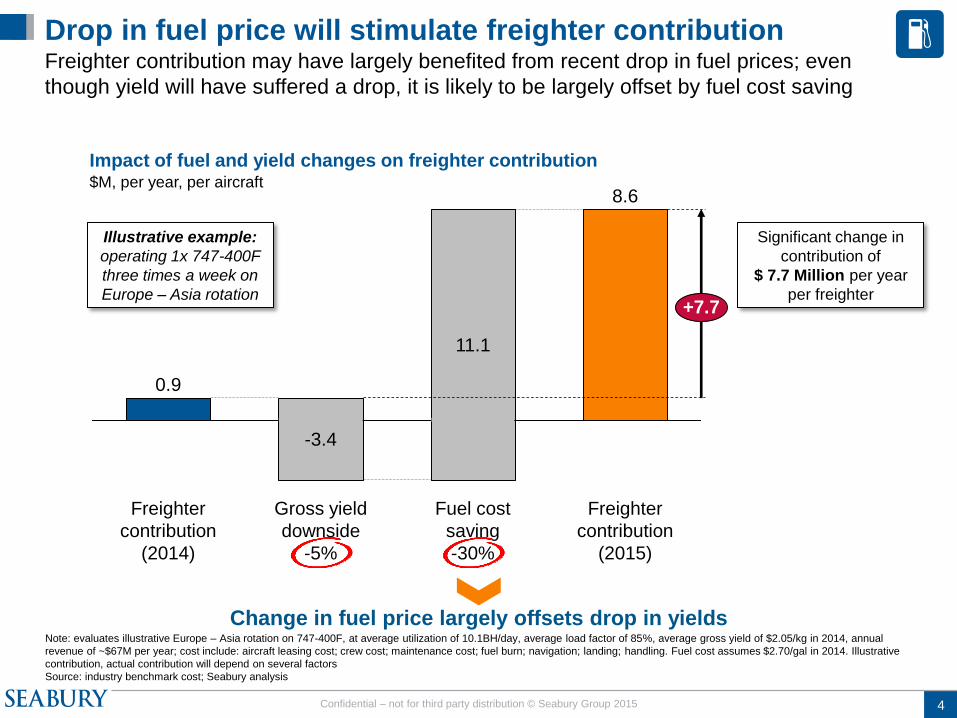
Drop in fuel price will stimulate freighter contribution Freighter contribution may have largely benefited from recent drop in fuel prices; even
though yield will have suffered a drop, it is likely to be largely offset by fuel cost saving
Impact of fuel and yield changes on freighter contribution $M, per year, per aircraft
Note: evaluates illustrative Europe – Asia rotation on 747-400F, at average utilization of 10.1BH/day, average load factor of 85%, average gross yield of $2.05/kg in 2014, annual
revenue of ~$67M per year; cost include: aircraft leasing cost; crew cost; maintenance cost; fuel burn; navigation; landing; handling. Fuel cost assumes $2.70/gal in 2014. Illustrative
contribution, actual contribution will depend on several factors
Source: industry benchmark cost; Seabury analysis
Gross yield
downside
-5%
Fuel cost
saving
-30%
+7.7
Freighter
contribution
(2015)
Freighter
contribution
(2014)
-3.4
11.1
0.9
8.6
Illustrative example:
operating 1x 747-400F
three times a week on
Europe – Asia rotation
Significant change in
contribution of
$ 7.7 Million per year
per freighter
Change in fuel price largely offsets drop in yields
If needed, can be
changed in aircraft cost
workbook – Tab
“Scenario”
5 Confidential – not for third party distribution © Seabury Group 2015
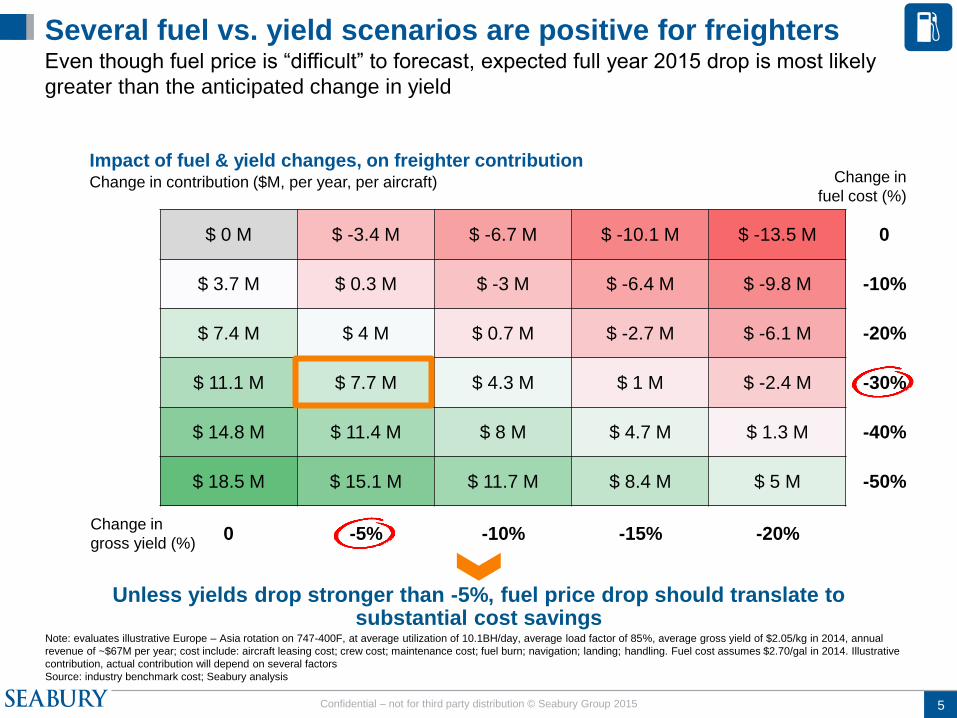
Several fuel vs. yield scenarios are positive for freighters Even though fuel price is “difficult” to forecast, expected full year 2015 drop is most likely
greater than the anticipated change in yield
Impact of fuel & yield changes, on freighter contribution Change in contribution ($M, per year, per aircraft)
Note: evaluates illustrative Europe – Asia rotation on 747-400F, at average utilization of 10.1BH/day, average load factor of 85%, average gross yield of $2.05/kg in 2014, annual
revenue of ~$67M per year; cost include: aircraft leasing cost; crew cost; maintenance cost; fuel burn; navigation; landing; handling. Fuel cost assumes $2.70/gal in 2014. Illustrative
contribution, actual contribution will depend on several factors
Source: industry benchmark cost; Seabury analysis
$ 0 M $ -3.4 M $ -6.7 M $ -10.1 M $ -13.5 M
$ 3.7 M $ 0.3 M $ -3 M $ -6.4 M $ -9.8 M
$ 7.4 M $ 4 M $ 0.7 M $ -2.7 M $ -6.1 M
$ 11.1 M $ 7.7 M $ 4.3 M $ 1 M $ -2.4 M
$ 14.8 M $ 11.4 M $ 8 M $ 4.7 M $ 1.3 M
$ 18.5 M $ 15.1 M $ 11.7 M $ 8.4 M $ 5 M
0
-10%
-20%
-30%
-40%
-50%
0 -5% -10% -15% -20%
Change in
fuel cost (%)
Change in
gross yield (%)
Unless yields drop stronger than -5%, fuel price drop should translate to substantial cost savings
Can be changed in
aircraft cost workbook
– Tab “Matrix”
Change tagline
6 Confidential – not for third party distribution © Seabury Group 2015
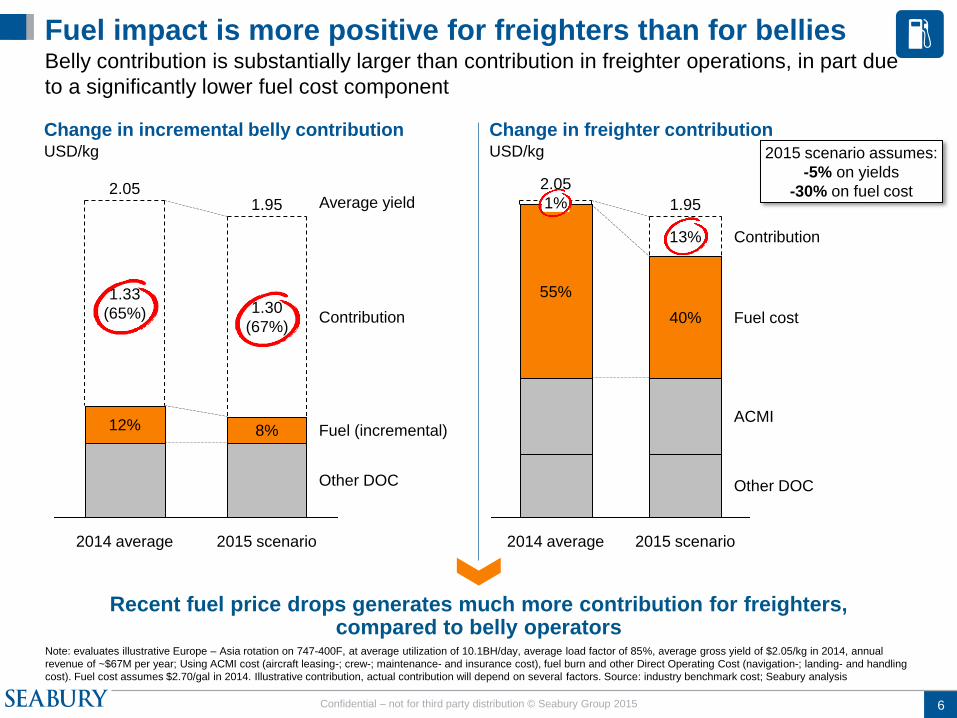
Belly contribution is substantially larger than contribution in freighter operations, in part due
to a significantly lower fuel cost component
Change in incremental belly contribution USD/kg
Change in freighter contribution USD/kg
Note: evaluates illustrative Europe – Asia rotation on 747-400F, at average utilization of 10.1BH/day, average load factor of 85%, average gross yield of $2.05/kg in 2014, annual
revenue of ~$67M per year; Using ACMI cost (aircraft leasing-; crew-; maintenance- and insurance cost), fuel burn and other Direct Operating Cost (navigation-; landing- and handling
cost). Fuel cost assumes $2.70/gal in 2014. Illustrative contribution, actual contribution will depend on several factors. Source: industry benchmark cost; Seabury analysis
Other DOC
Fuel (incremental)
Contribution
2015 scenario
1.95
8%
1.30
(67%)
2014 average
2.05
12%
1.33
(65%)
Average yield 1%
Contribution
1.95
40%
13%
2.05
55%
Fuel cost
Other DOC
ACMI
2015 scenario 2014 average
2015 scenario assumes:
-5% on yields
-30% on fuel cost
Recent fuel price drops generates much more contribution for freighters, compared to belly operators
Can be changed in
aircraft cost workbook
Tab “Belly”
Fuel impact is more positive for freighters than for bellies Change tagline;
original:
Fuel is a significant share of freighter
operations cost (~50-55%)and creates
significant upside in case of drop in prices
– more so than for belly
7 Confidential – not for third party distribution © Seabury Group 2015
Air cargo back
to growth
What are the drivers
of recent growth?
What was the impact
on the market?
Sustainable growth,
or temporary peak?
Freighters
back to service
What capacity was
added to market?
What if parked
freighters return?
How is it affected by
demand growth?
Drop in
fuel prices
How are costs (and
yields) affected?
How does it affect
freighters vs. belly?
What dynamics to
expect in 2015?
Three things the industry may be thinking about... Last few months saw a sharp drop in fuel prices, a resilient air cargo capacity and a strong
market recovery; what is the impact of these changes and what does it mean for 2015?
How will these trends fare in 2015?
P
8 Confidential – not for third party distribution © Seabury Group 2015
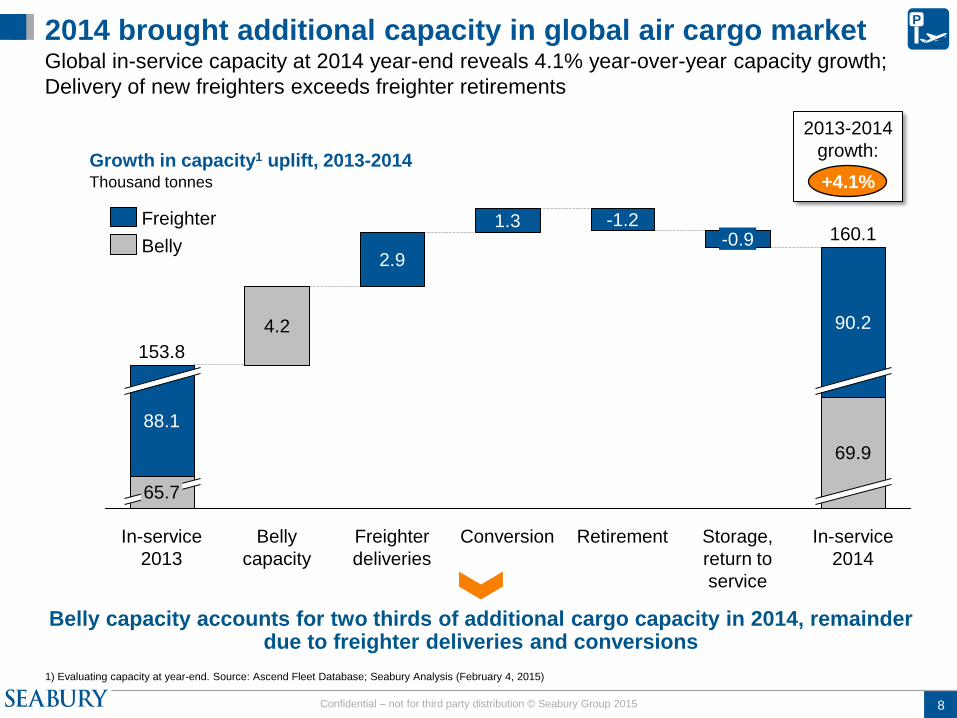
Growth in capacity1 uplift, 2013-2014
2014 brought additional capacity in global air cargo market Global in-service capacity at 2014 year-end reveals 4.1% year-over-year capacity growth;
Delivery of new freighters exceeds freighter retirements
Thousand tonnes
1) Evaluating capacity at year-end. Source: Ascend Fleet Database; Seabury Analysis (February 4, 2015)
2013-2014
growth:
+4.1%
P
Belly capacity accounts for two thirds of additional cargo capacity in 2014, remainder due to freighter deliveries and conversions
90.2
69.9
-0.9 160.1
2.9
Belly
capacity
4.2
Freighter
deliveries
1.3
Conversion In-service
2014
Storage,
return to
service
88.1
65.7
153.8
In-service
2013
-1.2
Retirement
Belly
Freighter
IATA: Market AFTK YoY
2014-2013: 4.2%
(international, NB+WB)
9 Confidential – not for third party distribution © Seabury Group 2015
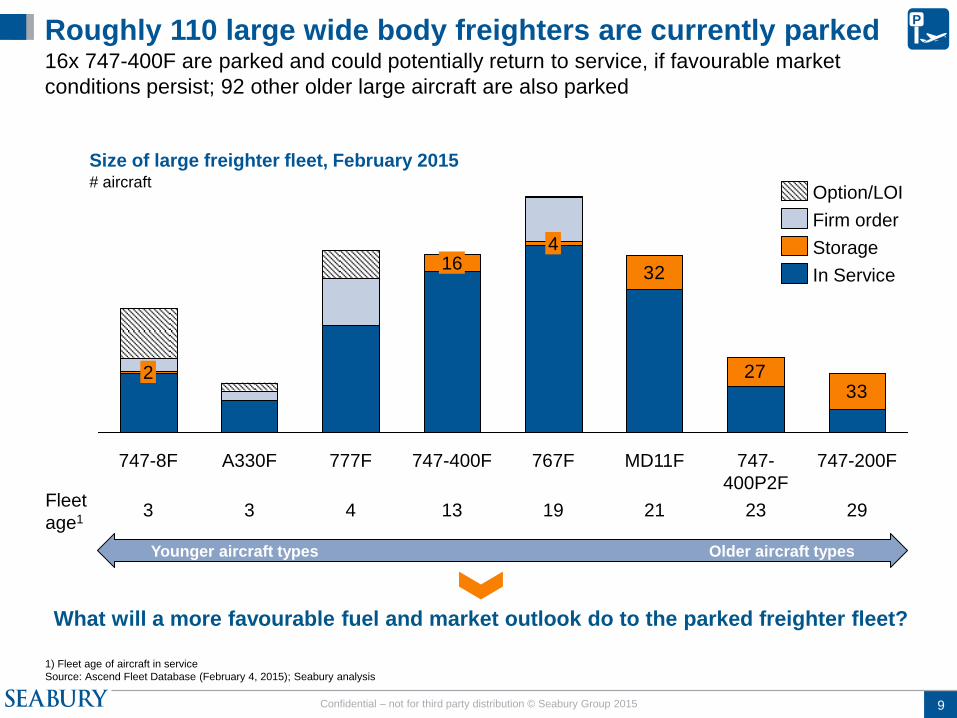
Roughly 110 large wide body freighters are currently parked 16x 747-400F are parked and could potentially return to service, if favourable market
conditions persist; 92 other older large aircraft are also parked
Size of large freighter fleet, February 2015 # aircraft
1) Fleet age of aircraft in service
Source: Ascend Fleet Database (February 4, 2015); Seabury analysis
3327
32
747-200F 747-
400P2F
MD11F 767F
4
747-400F
16
777F A330F 747-8F
2
What will a more favourable fuel and market outlook do to the parked freighter fleet?
In Service
Storage
Firm order
Option/LOI
Fleet
age1 3 3 4 13 21 29 19 23
P
Using figures from
David’s slide
(Freighters are sticky)
Younger aircraft types Older aircraft types
Owners 2x 747-8:
Operator Cargolux Boeing
AircraftManufacturer Boeing Boeing
AircraftType 747 747
AircraftSeries 8 8
AircraftVariant 8F (GE) 8F (GE)
Registration LX-VCC N770BA
SerialNumber 35807 37564
BuildYear 2010 2013
StorageLocation
Luxembourg -
Findel,
Luxembourg
Marana - Pinal
Airpark, AZ, USA
OriginalOperator Cargolux
NextOperator
ExpectedLeaseSaleDate
SaleOrLease
Manager Cargolux Boeing
Owner VCC Lease Sarl Boeing
EngineType GEnx GEnx
EngineVariant 2B67 2B67
AircraftAge 5 2
OrderDate 38671
DeliveryDate 40991
AircraftUsage Freight / Cargo Freight / Cargo
AircraftUsage2
MinorVariant 8R7F 87UF
NoiseCategory
FAA FAR Part 36
Stage 3/ICAO
Annex 16 Vol.1
Chapter 3
FAA FAR Part 36
Stage 3/ICAO Annex
16 Vol.1 Chapter 3
StorageDate 41975 41821
StoragePeriod(Years) 0.25 0.67
10 Confidential – not for third party distribution © Seabury Group 2015
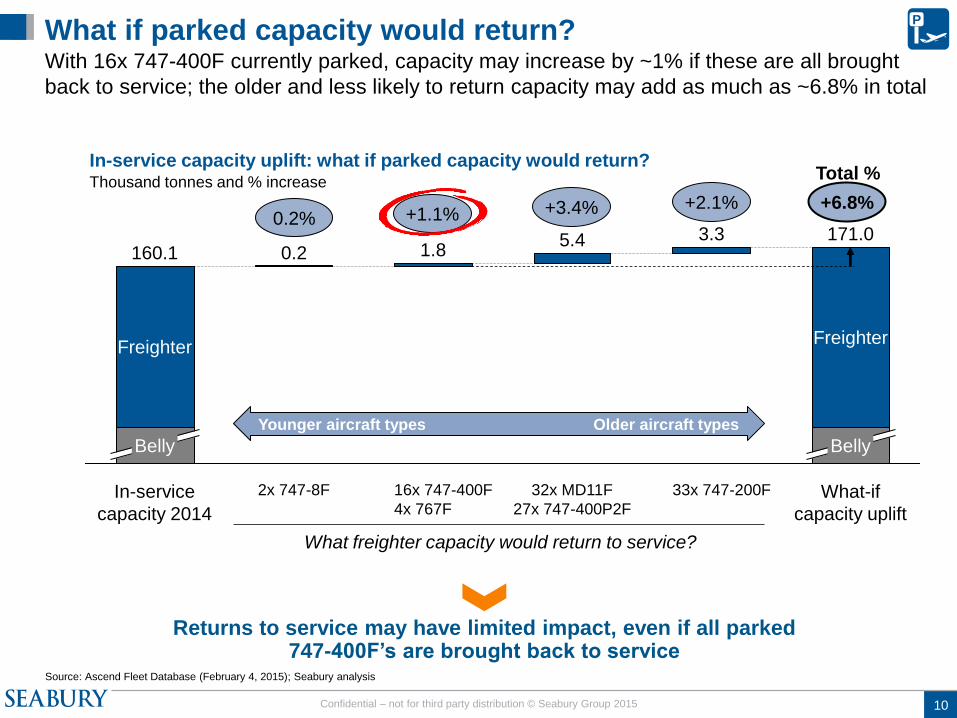
What if parked capacity would return? With 16x 747-400F currently parked, capacity may increase by ~1% if these are all brought
back to service; the older and less likely to return capacity may add as much as ~6.8% in total
In-service capacity uplift: what if parked capacity would return? Thousand tonnes and % increase
Source: Ascend Fleet Database (February 4, 2015); Seabury analysis
What-if
capacity uplift
171.0
Belly
Freighter
33x 747-200F
3.3
32x MD11F
27x 747-400P2F
5.4
16x 747-400F
4x 767F
1.8
2x 747-8F
0.2
In-service
capacity 2014
160.1
Belly
Freighter
+1.1%
What freighter capacity would return to service?
+3.4% +2.1%
P
0.2%
Returns to service may have limited impact, even if all parked 747-400F’s are brought back to service
+6.8%
Younger aircraft types Older aircraft types
Total %
Ascend data workbook
Tab:
ParkedCapacity-ByType
2015-2014 Jan-Aug Belly
growth YoY: 5.6% or
1,247,429 tonnes; from
(cap.leg database - planned
belly)
Add one decimal in graph
(otherwise 1+3+2=7)
11 Confidential – not for third party distribution © Seabury Group 2015
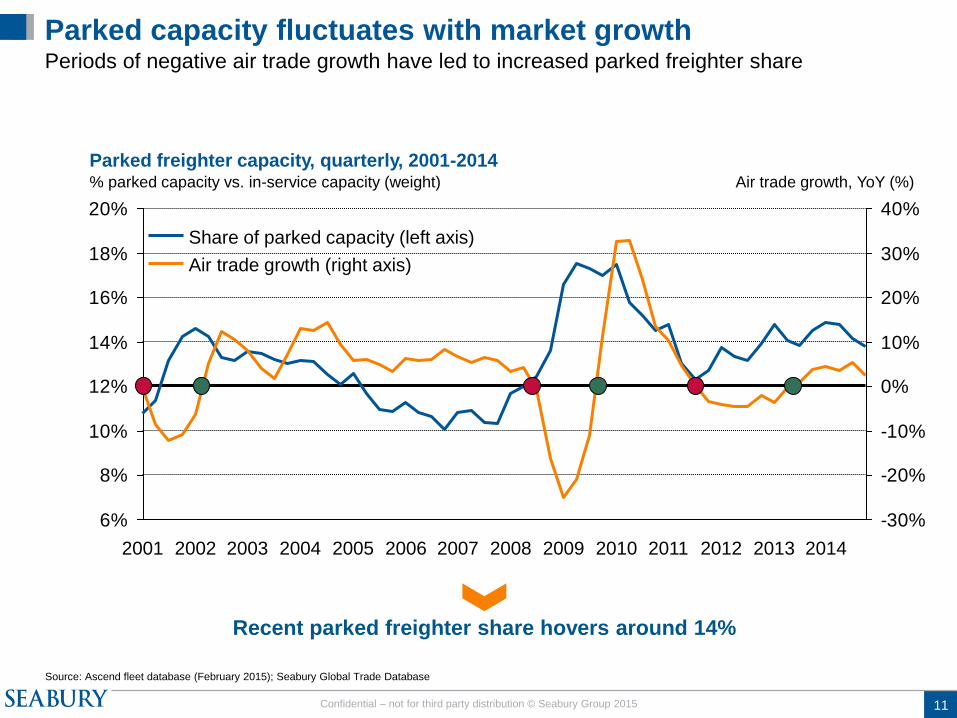
Parked capacity fluctuates with market growth Periods of negative air trade growth have led to increased parked freighter share
Parked freighter capacity, quarterly, 2001-2014 % parked capacity vs. in-service capacity (weight)
Source: Ascend fleet database (February 2015); Seabury Global Trade Database
6%
8%
10%
12%
14%
16%
18%
20%
-30%
-20%
-10%
0%
10%
20%
30%
40%
2010 2009 2008 2011 2013 2012 2014 2001 2006 2005 2007 2004 2002 2003
Share of parked capacity (left axis)
Air trade growth (right axis)
Air trade growth, YoY (%)
Recent parked freighter share hovers around 14%
Tab:
ParkedCapacity-LongerHistory
2014 parked capacity
increase during air trade
growth: belly?
Red-green: increase in
parked freighters
Green-red: decrease in
parked freighters
12 Confidential – not for third party distribution © Seabury Group 2015
Drop in
fuel prices
How are costs (and
yields) affected?
How does it affect
freighters vs. belly?
What dynamics to
expect in 2015?
Three things the industry may be thinking about... Last few months saw a sharp drop in fuel prices, a resilient air cargo capacity and a strong
market recovery; what is the impact of these changes and what does it mean for 2015?
How will these trends fare in 2015?
Air cargo back
to growth
What are the drivers
of recent growth?
What was the impact
on the market?
Sustainable growth,
or temporary peak?
Freighters
back to service
What capacity was
added to market?
What if parked
freighters return?
How is it affected by
demand growth?
P
13 Confidential – not for third party distribution © Seabury Group 2015
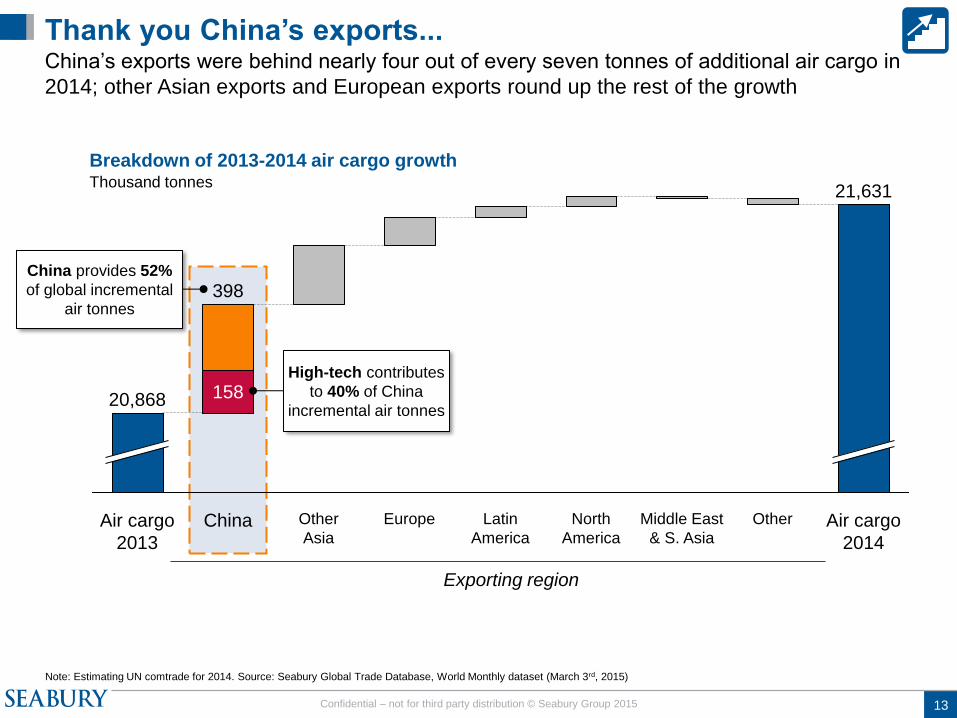
Thank you China’s exports... China’s exports were behind nearly four out of every seven tonnes of additional air cargo in
2014; other Asian exports and European exports round up the rest of the growth
Breakdown of 2013-2014 air cargo growth Thousand tonnes
Note: Estimating UN comtrade for 2014. Source: Seabury Global Trade Database, World Monthly dataset (March 3rd, 2015)
Middle East
& S. Asia
21,631
Europe
158
Air cargo
2013
China Air cargo
2014
398
Other Latin
America
North
America
20,868
Other
Asia
Exporting region
Updated with 2014
full year
- Increment of
UN comtrade
estimated
High-tech contributes
to 40% of China
incremental air tonnes
China provides 52%
of global incremental
air tonnes
Take out numbers of
other regions except
China and totals for
2013 and 2014
14 Confidential – not for third party distribution © Seabury Group 2015
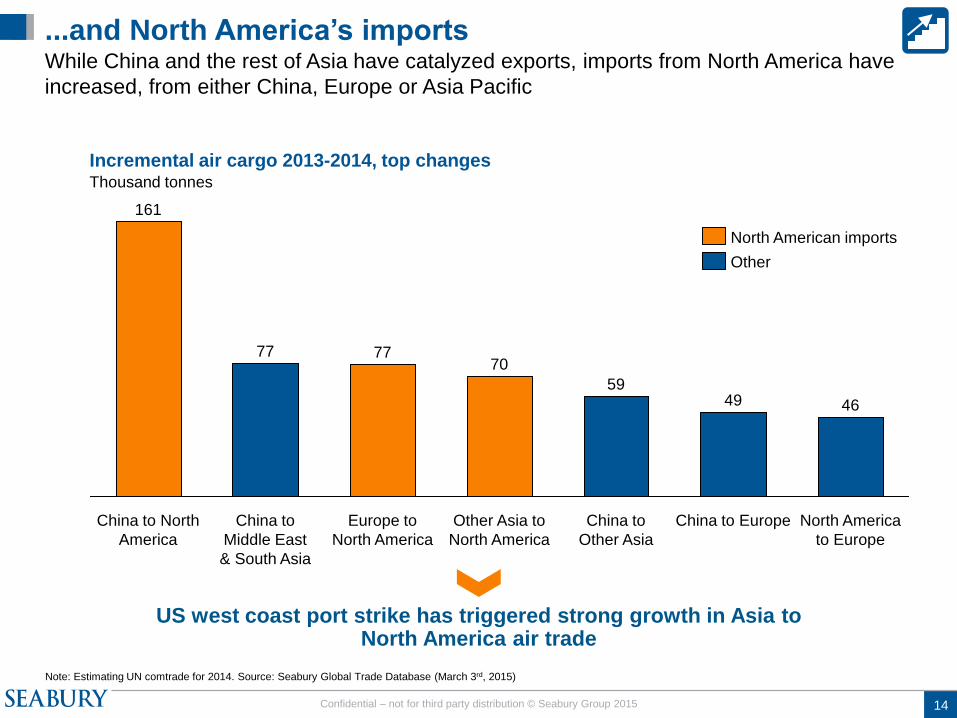
...and North America’s imports While China and the rest of Asia have catalyzed exports, imports from North America have
increased, from either China, Europe or Asia Pacific
Incremental air cargo 2013-2014, top changes Thousand tonnes
Note: Estimating UN comtrade for 2014. Source: Seabury Global Trade Database (March 3rd, 2015)
Europe to
North America
77
China to
Middle East
& South Asia
77
China to North
America
161
North America
to Europe
46
China to Europe
49
China to
Other Asia
59
Other Asia to
North America
70
North American imports
Other
Update with
2014 full year
US west coast port strike has triggered strong growth in Asia to North America air trade
15 Confidential – not for third party distribution © Seabury Group 2015
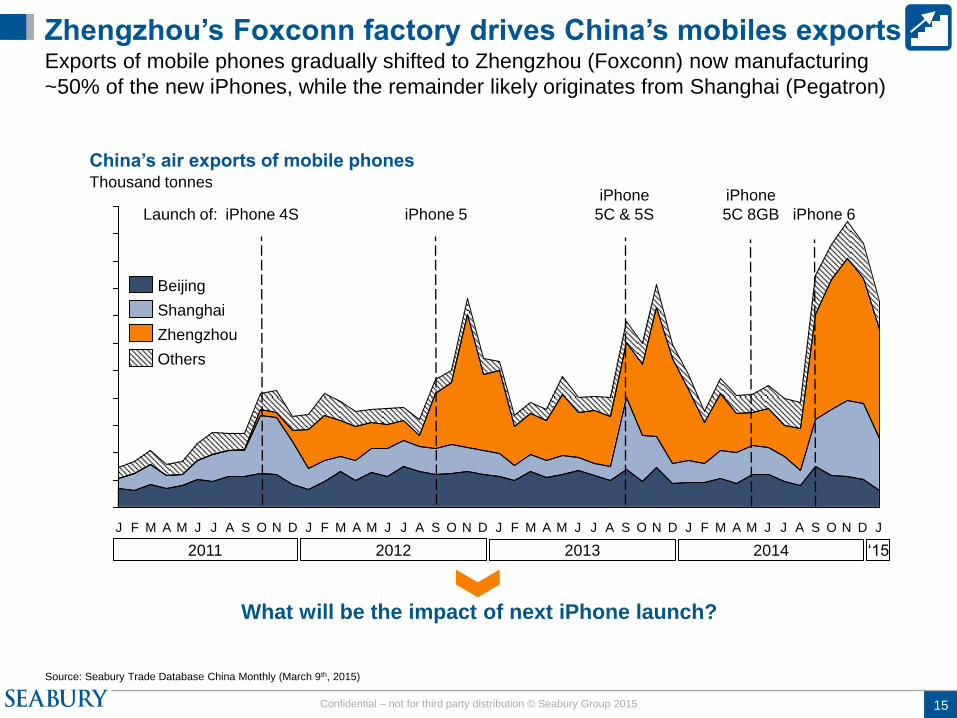
Zhengzhou’s Foxconn factory drives China’s mobiles exports Exports of mobile phones gradually shifted to Zhengzhou (Foxconn) now manufacturing
~50% of the new iPhones, while the remainder likely originates from Shanghai (Pegatron)
China’s air exports of mobile phones Thousand tonnes
Source: Seabury Trade Database China Monthly (March 9th, 2015)
J A M M F J D N O S A J J M O A S J J D N A M F J D N O S A J J M A M F J D N O S A J J M A M F J
2011 2012 2013 2014
iPhone 5
iPhone
5C & 5S
Others
Shanghai
Zhengzhou
Beijing
What will be the impact of next iPhone launch?
iPhone 4S
iPhone
5C 8GB Launch of: iPhone 6
‘15

16 Confidential – not for third party distribution © Seabury Group 2015
Fashion
Each dot is a zip code, size represents amount of air weight traded in 2013-2014
High Tech
Consumer goods
Automotive Capital equipment
Industrial consumables
China shipper data provides new insights Data on individual shippers captures trends to/from regions within China
Note: Using trade (import and export) by air. Source: Seabury Global Trade Database, China shipper dataset (February 23, 2015)
High granularity in shipper data helps to understand the heartbeat of China growth
- High-tech: Most
concentrated, but giant
- Automotive: very much
concentrated, especially
north
- CapEq: Still consolidated,
but not bubble sizes of high-
tech
- Fashion: fragmented,
focused especially along
coastal area
- Consumer goods similar to
fashion, slightly less
fragmented
- Industrial consumables;
quite spread out, with two
main concentration points:
Shanghai & Beijing
17 Confidential – not for third party distribution © Seabury Group 2015
Air cargo back
to growth
What are the drivers
of recent growth?
What was the impact
on the market?
Sustainable growth,
or temporary peak?
Freighters
back to service
What capacity was
added to market?
What if parked
freighters return?
How is it affected by
demand growth?
Drop in
fuel prices
How are costs (and
yields) affected?
How does it affect
freighters vs. belly?
What dynamics to
expect in 2015?
Three things the industry may be thinking about... Last few months saw a sharp drop in fuel prices, a resilient air cargo capacity and a strong
market recovery; what is the impact of these changes and what does it mean for 2015?
P


