22
Sainarayan A Chief, Aviation Data and Analysis Section, ATB Air Connectivity and Competition

Sainarayan A Chief, Aviation Data and Analysis Section, ATB
Air Connectivity and Competition

Concept of Connectivity in Air Transport
Movement of passengers, mail and cargo involving the minimum of transit
points which:
– makes the trip as short as possible;
– with optimal user satisfaction;
– at the minimum price possible.
ECONOMIC DEVELOPMENT

• Airline competition has evolved from an era of economic regulation and intervention to an increasing trend towards liberalization.
• This in turn has resulted in the global air transport network transiting from simple networks structures with limited competition and connectivity options of the past to complex structures of today responding dynamically to the changes in regulations and the business opportunities offered by liberalization.
Airline Competition
ECONOMIC DEVELOPMENT

• The global air transport network is characterized by more connectivity options to customers with a variety of competitive network strategies pursued by the major aviation stakeholders.
• Some of these strategies include decisions related to • point to point versus hub and spoke systems • yield management to respond effectively to demand through pricing and product differentiation and • alliances and mergers.
• These strategies are invariably a trade-off between the most economically efficient path to transport passengers through the various nodes available in the network constrained by real time factors that prevent the network from being the most optimized or efficient
Air Transport Network Characteristics
ECONOMIC DEVELOPMENT

• Size of the market (existing demand) and pricing strategies of existing competitors
• Policy factors –air carrier ownership and control, liberalization and regulation of traffic rights to fly (market access), cross ownerships of aviation verticals, taxation and charging policies.
• Slot availability and other restrictions like lack of infrastructure, night and noise curfews
• Presence of alternative models on a route i.e. low cost carriers versus legacy carriers
Factors Impacting Route Network
ECONOMIC DEVELOPMENT

Air Transport Diagnostics Project
ECONOMIC DEVELOPMENT

ICAO ICM Joint Project on Air Connectivity and Competition
• ICAO and the Interdisciplinary Centre for Mathematical and Computational Modelling (ICM) of the University of Warsaw have initiated a joint air transport diagnostics project.
• The project aims to better understand the complex dynamics and interlinkages between the various policy factors and market realities that influence the competitive strategies of the aviation stakeholders and the optimization of the global air transport network.
• Outcome of this study could assist policymakers in optimizing connectivity and maintaining sustainable growth of air transport.
Introduction
ECONOMIC DEVELOPMENT

• A visual interactive decision support system (DSS) to ICAO Member States and other stakeholders.
• Indicates areas where the market forces provide potential opportunities to States to further increase connectivity and optimization of the air transport network though appropriate policy initiatives and addresses of constraining factors.
Concept of the Project (1) Decision Support Systems for Informed Policy Making
ICAO ICM Joint Project on Air Connectivity and Competition ECONOMIC DEVELOPMENT

• The application leverages nearly four decades of ICAO data in its Enterprise Wide Data Management (EDM) repository supplemented with external data sources.
• The Big Data so available is being processed by ICAO and ICM using contemporary ICT applications and sophisticated statistical models.
• The DSS will be a single platform where States have the information to better gauge the valuation of their granting of traffic rights to fly and the opportunity costs associated with their policy initiatives.
Concept of the Project (2) Decision Support Systems for Informed Policy Making
ICAO ICM Joint Project on Air Connectivity and Competition ECONOMIC DEVELOPMENT

• ICAO and ICM have initially analyzed as a prerequisite for this project, the two major existing factors namely demand and price that influence competitive strategies of the aviation stakeholders and the optimization of the global air transport network.
• A segment of the preliminary analysis based on most recently available data for the year 2015 is presented in the Appendix and includes the following – • Global passenger flows to true origin-destination going direct and indirect (via connecting nodes) • Direct and indirect passenger flows by region of departure and by route groups. • Direct and indirect connectivity ratios for region and route group pairs along with average fare in US
dollars. The fare used is average of discount economy round trip fare and excludes taxes and charges not retained by the air carrier.
Preliminary Analysis Results
ICAO ICM Joint Project on Air Connectivity and Competition ECONOMIC DEVELOPMENT

880.2 (69%)
391.8 (31%)
Global Passenger Flow 2015 (In millions)
Direct Flights Passengers
Connecting Flights Passengers
Total Passengers : 1271.9
0 50 100 150 200 250 300 350 400 450
North America
Latin America/Caribbean
Africa
Middle East
Asia/Pacific
Europe
Passengers (millions)
Passengers Flow by Region of Departure 2015
Direct Flights Passengers Connecting Flights Passengers
Global Passenger Flow ECONOMIC DEVELOPMENT

12
Regional Passenger Flow
0 2 4 6 8 10 12 14 16 18 20
Latin America/Caribbean > Africa
Africa > Latin America/Caribbean
Africa > North America
Asia/Pacific > Africa
Africa > Middle East
North America > Africa
Africa > Asia/Pacific
Africa > Africa
Middle East > Africa
Africa > Europe
Passengers (millions)
Region Pair Passenger Flow (Africa)
Direct Flights Indirect Flights
ECONOMIC DEVELOPMENT
239
0 5 10 15 20 25 30 35 40 45 50
Latin America/Caribbean > Asia/Pacific
Asia/Pacific > Latin America/Caribbean
Asia/Pacific > Africa
Africa > Asia/Pacific
Asia/Pacific > Middle East
Asia/Pacific > North America
Asia/Pacific > Europe
North America > Asia/Pacific
Europe > Asia/Pacific
Middle East > Asia/Pacific
Asia/Pacific > Asia/Pacific
Passengers (millions)
Region Pair Passenger Flow (Asia/Pacific)
Direct Flights Indirect Flights

13
Regional Passenger Flow (continued)
0 5 10 15 20 25 30 35 40 45 50
Latin America/Caribbean > Europe
Europe > North America
Middle East > Europe
Europe > Middle East
Europe > Latin America/Caribbean
Africa > Europe
Europe > Africa
Asia/Pacific > Europe
Europe > Asia/Pacific
North America > Europe
Europe > Europe
Passengers (millions)
Region Pair Passenger Flow (Europe)
Direct Flights Indirect Flights
0 5 10 15 20 25 30 35 40
Latin America/Caribbean > Middle East
Middle East > Latin America/Caribbean
Middle East > North America
Africa > Middle East
Asia/Pacific > Middle East
North America > Middle East
Middle East > Europe
Middle East > Africa
Europe > Middle East
Middle East > Middle East
Middle East > Asia/Pacific
Passengers (millions)
Region Pair Passenger Flow (Middle East)
Direct Flights Indirect Flights
ECONOMIC DEVELOPMENT
394

14
Regional Passenger Flow (continued)
0 10 20 30 40 50 60 70 80
Latin America/Caribbean > Middle East
Latin America/Caribbean > Africa
Middle East > Latin America/Caribbean
Africa > Latin America/Caribbean
Latin America/Caribbean > Asia/Pacific
Asia/Pacific > Latin America/Caribbean
Latin America/Caribbean > Europe
Latin America/Caribbean > North America
Europe > Latin America/Caribbean
Latin America/Caribbean > Latin America/Caribbean
North America > Latin America/Caribbean
Passengers (millions)
Region Pair Passenger Flow (Latin America/Caribbean)
Direct Flights Indirect Flights
0 10 20 30 40 50 60 70 80
Africa > North America
Middle East > North America
North America > Africa
North America > Middle East
Asia/Pacific > North America
Europe > North America
Latin America/Caribbean > North America
North America > North America
North America > Asia/Pacific
North America > Europe
North America > Latin America/Caribbean
Passengers (millions)
Region Pair Passenger Flow (North America)
Direct Flights Indirect Flights
ECONOMIC DEVELOPMENT
0 10 20 30 40 50 60 70 80
Intra Africa
Central South West Asia - Europe
Europe - Sub Saharan Africa
North America - South America
Africa - Middle East
Europe - South West Asia
Europe - Pacific South East Asia
Intra North America
Intra Middle East
Europe - North Africa
North Asia - Pacific South East Asia
Europe - Middle East
Middle East - South West Asia
Intra Central South West Asia
Central South West Asia - North Asia
Intra Pacific South East Asia
Europe - North America
Central South West Asia - Pacific South East Asia
Central America/Caribbean - North America
Intra Europe
Passengers (millions)
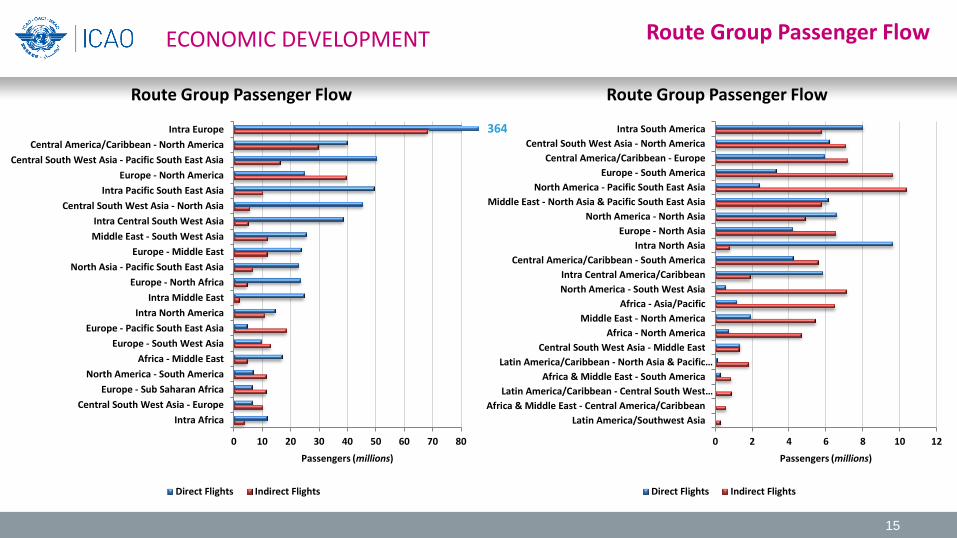
Route Group Passenger Flow
Direct Flights Indirect Flights
15
Route Group Passenger Flow ECONOMIC DEVELOPMENT
364
0 2 4 6 8 10 12
Latin America/Southwest Asia
Africa & Middle East - Central America/Caribbean
Latin America/Caribbean - Central South West…
Africa & Middle East - South America
Latin America/Caribbean - North Asia & Pacific…
Central South West Asia - Middle East
Africa - North America
Middle East - North America
Africa - Asia/Pacific
North America - South West Asia
Intra Central America/Caribbean
Central America/Caribbean - South America
Intra North Asia
Europe - North Asia
North America - North Asia
Middle East - North Asia & Pacific South East Asia
North America - Pacific South East Asia
Europe - South America
Central America/Caribbean - Europe
Central South West Asia - North America
Intra South America
Passengers (millions)
Route Group Passenger Flow
Direct Flights Indirect Flights

16
0% 10% 20% 30% 40% 50% 60% 70% 80% 90% 100%
Central America/Caribbean - Europe
Central South West Asia - North America
Central South West Asia - Middle East
Middle East - North Asia & Pacific South East Asia
Intra North America
Central America/Caribbean - North America
North America - North Asia
Intra South America
Europe - Middle East
Middle East - South West Asia
Intra Africa
Intra Central America/Caribbean
Central South West Asia - Pacific South East Asia
North Asia - Pacific South East Asia
Africa - Middle East
Intra Pacific South East Asia
Europe - North Africa
Intra Europe
Intra Central South West Asia
Central South West Asia - North Asia
Intra Middle East
Intra North Asia
% of Total Passengers
Route Group Connectivity (Inclusive of Domestic Connections in International Trips)
% Direct Passengers % Indirect Passengers
0 100 200 300 400 500 600 700
Average Fare (USD)
Average Fares (Inclusive of Domestic Connections in International Trips)
Average All Flights Fare Average Direct Fare Average Indirect Fare
Route Group Average Fares ECONOMIC DEVELOPMENT

17
0% 10% 20% 30% 40% 50% 60% 70% 80% 90% 100%
Latin America/Southwest Asia
Africa & Middle East - Central America/Caribbean
Latin America/Caribbean - Central South West Asia
Latin America/Caribbean - North Asia & Pacific South East Asia
North America - South West Asia
Africa - North America
Africa - Asia/Pacific
North America - Pacific South East Asia
Europe - Pacific South East Asia
Africa & Middle East - South America
Europe - South America
Middle East - North America
Europe - Sub Saharan Africa
North America - South America
Europe - North America
Europe - North Asia
Central South West Asia - Europe
Central America/Caribbean - South America
Europe - South West Asia
% of Total Passenger
Route Group Connectivity (Inclusive of Domestic Connections in International Trips)
% Direct Passengers % Indirect Passengers
0 100 200 300 400 500 600 700 800 900 1000
Average Fare (USD)
Route Group Average Fare (Inclusive of Domestic Connections in International Trips)
Average All Flights Fare Average Direct Fare Average Indirect Fare
Route Group Average Fares (continued) ECONOMIC DEVELOPMENT

18
Route Group Average Fares (continued) ECONOMIC DEVELOPMENT
0% 10% 20% 30% 40% 50% 60% 70% 80% 90% 100%
Europe - North America
Europe - Middle East
Middle East - South West Asia
North America - South America
Central South West Asia - North America
Intra Central America/Caribbean
Africa - Middle East
Intra Africa
Central South West Asia - Pacific South East Asia
North Asia - Pacific South East Asia
Intra South America
Europe - North Africa
Intra Europe
North America - North Asia
Intra Central South West Asia
Intra Pacific South East Asia
Intra Middle East
Central South West Asia - North Asia
Central America/Caribbean - North America
Intra North Asia
Intra North America
% of Total Passengers
Route Group Connectivity (Exclusive of Domestic Connections in International Trips)
% Direct Passengers % Indirect Passengers
0 100 200 300 400 500 600 700
Average Fare (USD)
Route Group Average Fare (Exclusive of Domestic Connections in International Trips)
Average All Flights Fare Average Direct Fare Average Indirect Fare

19
Route Group Average Fares (continued) ECONOMIC DEVELOPMENT
0% 10% 20% 30% 40% 50% 60% 70% 80% 90% 100%
Latin America/Southwest Asia
Africa & Middle East - Central America/Caribbean
Latin America/Caribbean - Central South West Asia
Latin America/Caribbean - North Asia & Pacific South…
North America - South West Asia
Africa - Asia/Pacific
Europe - Pacific South East Asia
Africa - North America
Africa & Middle East - South America
Middle East - North America
North America - Pacific South East Asia
Europe - Sub Saharan Africa
Europe - South America
Europe - North Asia
Europe - South West Asia
China - Europe
Central America/Caribbean - South America
Central America/Caribbean - Europe
Central South West Asia - Middle East
Middle East - North Asia & Pacific South East Asia
% of Total Passengers
Route Group Connectivity (Exclusive of Domestic Connections in International Trips)
% Direct Passengers % Indirect Passengers
0 200 400 600 800 1000 1200 1400 1600
Average Fare (USD)
Route Group Average Fare (Exclusive of Domestic Connections in International Trips)
Average All Flights Fare Average Direct Fare Average Indirect Fare

• The results of the preliminary analysis encompassing the entire big data set leads to the following overarching observations–
• With the inclusion of domestic legs on international trips 69% of the passengers in 2015 flew direct to their destination and 31% flew though connecting nodes in the air transport network. Around half of indirect passengers include domestic connections on the international trip.
• There exists differences in the direct and indirect connectivity at the country pair level which
when summarized is reflected at the region pair or route group pair level. • Inclusion of domestic legs on the international trip results in higher average indirect fares
compared to average direct fares.
Observations of Preliminary Analysis
ICAO ICM Joint Project on Air Connectivity and Competition ECONOMIC DEVELOPMENT

• Market forces primarily the presence of demand or otherwise on a route determines the competitive strategies and economic efficiencies of providing direct or indirect routes in the global air transport network.
• Poor Demand translates to poor connectivity and optimization is achieved through indirect flights. Lack of policy initiatives in
many cases act as a constraint in achieving an optimized indirect route flow network. • Fare levels are deeply influenced by the competition between carriers on a route. Average direct fares appear to have a
premium over indirect fares on long haul routes. On the rest of the routes, the spread between average direct and indirect fares reflects a degree of competitive advantage of hubs on routes in the air transport network.
• Significant demand on some long haul routes and forecasted strong growth rates along with new aircraft technologies has
resulted in traditional hubs that have been existing over several decades competing with more recent hubs leading to increasing connectivity and more nodes being introduced in the air transport network.
• Demand exists on some high density long haul routes that could make it more efficient for air carriers to fly direct routes or
integrate it with their existing network or alliances. A trend in this direction could suggest the potential of further optimizing the global air transport network impacting infrastructure development in the different regions as well as capacity available through traditional and new hubs.
Preliminary Conclusions from the Observations
ICAO ICM Joint Project on Air Connectivity and Competition ECONOMIC DEVELOPMENT

Air Connectivity and Competition
THANK YOU
Sainarayan A Chief, Aviation Data and Analysis Section, ATB


