Air Dispersion Modeling Analysis For Verifying Compliance of Permitted Emissions with the One-Hour SO 2 and NO 2 NAAQS: Suncor Refinery Commerce City, Colorado Prepared by: Lindsey Meyers May 10, 2021
Transcript
Air Dispersion Modeling Analysis
For Verifying Compliance of Permitted Emissions
with the One-Hour SO2 and NO2 NAAQS:
Suncor Refinery
Commerce City, Colorado
Prepared by:
Lindsey Meyers
May 10, 2021
Suncor Permitted One-Hour SO2 and NO2 NAAQS Analysis
Suncor Permitted One-Hour SO2 and NO2 NAAQS Analysis
May 10, 2021
Page - 4
Figure 1: Suncor Refinery
Suncor Permitted One-Hour SO2 and NO2 NAAQS Analysis
May 10, 2021
Page - 5
2. Modeling Methodology
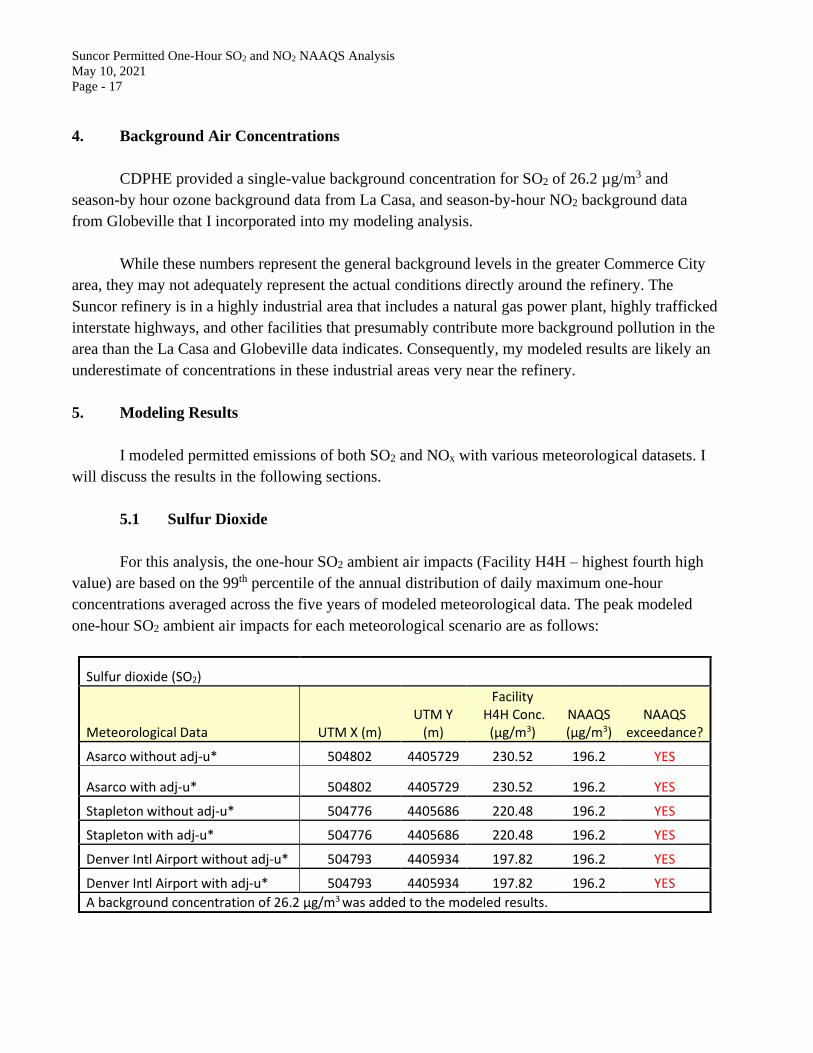
The 2010 one-hour SO2 NAAQS takes the form of a three-year average of the 99th-percentile
of the annual distribution of daily maximum one-hour concentrations, which cannot exceed 75 ppb.1
This standard is to be verified using USEPA’s AERMOD air dispersion model, which produces air
concentrations in units of µg/m3. The one-hour SO2 NAAQS of 75 ppb equals 196.2 µg/m3, and this
is the value I used for determining whether modeled permitted impacts from Suncor’s operations
exceed the one-hour SO2 NAAQS. The 99th-percentile of the annual distribution of daily maximum
one-hour concentrations corresponds to the fourth-highest value at each receptor for a given year.
The 2010 one-hour NO2 NAAQS takes the form of a three-year average of the 98th-percentile
of the annual distribution of daily maximum one-hour concentrations, which cannot exceed 100
ppb.2 The one-hour NO2 NAAQS of 100 ppb equals 188 µg/m3. This is the value I used to determine
Suncor’s compliance with the one-hour NO2 NAAQS. The 98th-percentile of the annual distribution
of daily maximum one-hour concentrations corresponds to the eighth-highest value at each receptor
for a given year.
This section describes the dispersion model, control options, and output options I used in my
modeling analysis.
2.1 Air Dispersion Model
I performed one-hour SO2 and NO2 NAAQS modeling with USEPA’s AERMOD program,
version 19191, obtained from the Support Center for Regulatory Atmospheric Modeling (SCRAM)
website. AERMOD is the USEPA preferred air dispersion model for determining air impacts within
50 kilometers of air pollution emission sources.3 Version 19191 is the latest version of the
AERMOD model.
2.2 AERMOD Input Control Options
I ran AERMOD with the following control options:
• One-hour average air concentrations
1 USEPA, Applicability of Appendix W Modeling Guidance for the 1-hour SO2 National Ambient Air Quality Standard,
August 23, 2010. 2 USEPA, Additional Clarification Regarding Application of Appendix W Modeling Guidance for the 1-hour NO2 National
Ambient Air Quality Standard, March 1, 2011. 3 USEPA, Revision to the Guideline on Air Quality Models: Adoption of a Preferred General Purpose (Flat and Complex
Terrain) Dispersion Model and Other Revisions, Appendix W to 40 CFR Part 51, November 9, 2005.
Suncor Permitted One-Hour SO2 and NO2 NAAQS Analysis
May 10, 2021
Page - 6
• Regulatory defaults
• Urban dispersion coefficients
These input control options are consistent with previous modeling analyses performed by the
Colorado Department of Public Health and Environment (CDPHE). They are appropriate input
options for one-hour SO2 and NO2 NAAQS modeling in the area surrounding Suncor.
The Suncor refinery is located in a highly industrialized area. Methodology outlined in
Section 7.2.3 of the Guideline on Air Quality Models4 indicates that facilities in industrial areas
should be classified as urban if more than 50% of the area within a three-kilometer radius of the
facility is considered to be built upon. According to an analysis of 2016 National Landcover
Database (NLCD) data, 62% of the area within a three-kilometer radius of the Suncor refinery is
identified as “impervious surface.” Accordingly, I used urban dispersion coefficients when running
AERMOD, with an URBANOPT population of 441,603 (the 2010 population of Adams County,
Colorado).
2.3 Output Options
My AERMOD modeling analysis of the Suncor facility includes three different five-year
meteorological data scenarios, both with and without adj-u*. Meteorological data will be discussed
further in section 3.5.
I generated tables, plot files, and summary files appropriate for one-hour SO2 and NO2
NAAQS modeling.
2.4 NO2 Modeling Methodology
NO2 NAAQS modeling involves a three-tiered approach, as described by USEPA5:
“Tier 1 – assume full conversion of NO to NO2, where total NOx concentrations are
computed with a refined modeling technique specified in Section 4.2.2 of Appendix
W.
Tier 2 – multiply Tier 1 results by empirically derived NO2/NOx ratios, with 0.75 as
the national default ratio for annual NO2 (Chu and Meyer, 1991) and 0.80 as the
4 USEPA, Applicability of Appendix W Modeling Guidance for the 1-hour SO2 National Ambient Air Quality Standard,
August 23, 2010, Section 7.2.3. 5 USEPA, Memorandum: Applicability of Appendix W Modeling Guidance for the 1-hour NO2 National Ambient Air
Quality Standard, June 28, 2010, pp. 1-2
Suncor Permitted One-Hour SO2 and NO2 NAAQS Analysis
May 10, 2021
Page - 7
national default ratio for hourly NO2 (Want, et al, 2011; Janssen, et al, 1991), as
recommended in U.S. EPA, 2011.
Tier 3 – detailed screening methods may be used on a case-by-cases basis. At this time,
OLM (Cole and Summerhays, 1979) and the PVMRM (Hanrahan, 1999) are considered
to be appropriate as detailed screening techniques.”
In this modeling analysis, I modeled using both the Tier 3 Ozone Limiting Method (OLM)
and Plume Volume Molar Ratio Method (PVMRM) to evaluate NO2 NAAQS compliance. I used the
AERMOD default value for the ambient equilibrium NO2/NOx ratio (NO2EQUIL = 0.9).6 And
since there were no in-stack NO2/NOx ratio data available for modeling the Suncor facility, I used
the USEPA default value of NO2STACK = 0.5 for all sources.7
3. Model inputs
The AERMOD air dispersion model requires a lengthy list of input values. Key inputs to this
dispersion model include local geography, air emission rates of the released pollutant, source
parameters (how and where the material is released to the air), receptors (locations where the offsite
concentrations are calculated), and meteorological data (determines how and where the material is
dispersed in the air). Each of these inputs is discussed below.
3.1 Geographical Inputs
The “ground floor” of all air dispersion modeling analyses is establishing a coordinate
system for identifying the geographical location of emission sources and receptors. These
geographical locations are used to determine local characteristics (such as land use and elevation),
and also to ascertain source to receptor distances and relationships.
I used the Universal Transverse Mercator (UTM) NAD83 zone 13 coordinate system for
identifying the easting (x) and northing (y) coordinates of the modeled sources and receptors. I
obtained the source locations from the facility APENs.
3.2 Emission Rates and Source Parameters
My modeling analyses are limited to SO2 and NOx permitted emissions for the Suncor
6 USEPA, User's Guide for the AMS/EPA Regulatory Model (AERMOD), EPA-454/B-19-027, August, 2019, p.
3-66. 7 USEPA, Clarification on the Use of AERMOD Dispersion Modeling for Demonstrating Compliance with the NO2
National Ambient Air Quality Standard, September 40, 2014, p. 8.
Suncor Permitted One-Hour SO2 and NO2 NAAQS Analysis
May 10, 2021
Page - 8
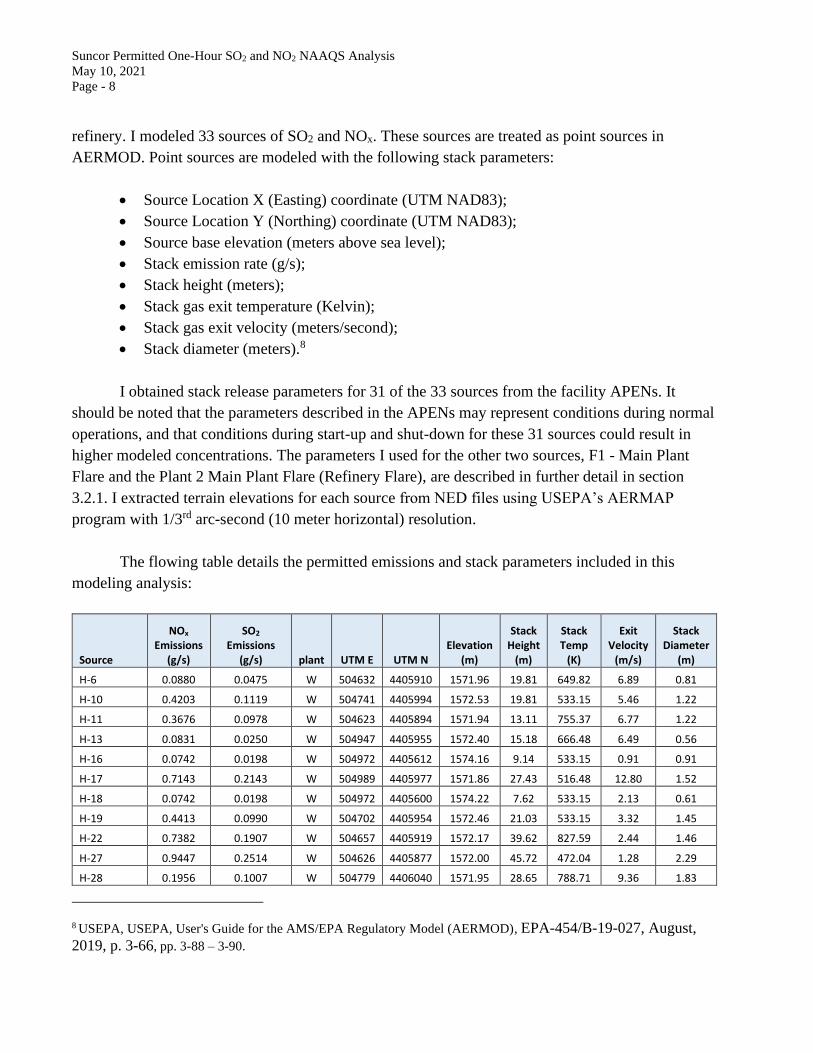
refinery. I modeled 33 sources of SO2 and NOx. These sources are treated as point sources in
AERMOD. Point sources are modeled with the following stack parameters:
• Source Location X (Easting) coordinate (UTM NAD83);
• Source Location Y (Northing) coordinate (UTM NAD83);
• Source base elevation (meters above sea level);
• Stack emission rate (g/s);
• Stack height (meters);
• Stack gas exit temperature (Kelvin);
• Stack gas exit velocity (meters/second);
• Stack diameter (meters).8
I obtained stack release parameters for 31 of the 33 sources from the facility APENs. It
should be noted that the parameters described in the APENs may represent conditions during normal
operations, and that conditions during start-up and shut-down for these 31 sources could result in
higher modeled concentrations. The parameters I used for the other two sources, F1 - Main Plant
Flare and the Plant 2 Main Plant Flare (Refinery Flare), are described in further detail in section
3.2.1. I extracted terrain elevations for each source from NED files using USEPA’s AERMAP
program with 1/3rd arc-second (10 meter horizontal) resolution.
The flowing table details the permitted emissions and stack parameters included in this
Suncor Permitted One-Hour SO2 and NO2 NAAQS Analysis
May 10, 2021
Page - 10
3.2.1 Flare Stack Parameters
Flare emissions are not associated with a measured stack diameter and stack velocity. This is
because during flaring, the volume of gas is combusted outside of the physical flare stack. The
AERMOD air dispersion model, however, requires specific inputs of stack diameter and stack
velocity to calculate volumetric flow rate, which is necessary for calculating buoyancy flux and
plume rise in the model.
The Texas Commission on Environmental Quality (TCEQ) has developed procedures for
assisting in calculating the buoyancy flux from flare stack emissions.9 This appears to be the
approach CDPHE has taken in previous modeling analyses. In essence, the TCEQ procedures
calculate equivalent stack parameters (temperature, exit velocity, and diameter) for input to
AERMOD. These equivalent stack parameters are used by AERMOD for determining buoyancy flux
and plume rise for flare emissions. It is important to note that flares are not the same as incinerators
or thermal oxidizers.10
As a first step, the TCEQ procedures specify a fixed flare stack gas temperature of 1273
Kelvin (K) and a set flare gas exit velocity of 20 meters/second (m/s). An equivalent stack diameter
(in meters) is then calculated using the net heat release of the flare (in calories/second) and the
estimated mean molecular weight of the gas being flared. Since a mean molecular weight of the gas
being flared was not provided in the permit documents, an estimated value of 20 g/mol was used for
this calculation (for comparison, the molecular weight of methane is 16.04 g/mol).
The two main flares at the Suncor facility were modeled for this analysis, namely the
F1 - Main Plant Flare and the Plant 2 Main Plant Flare (Refinery Flare). For each of these flares, the
gross heat release (q, in calories/second) was calculated using data provided on the source air
pollution emission notice (APEN) forms.
The next step in the TCEQ procedures is to calculate the net heat release (qn, in
calories/second) using the following equation:
qn = q * (1-0.048 * SQRT (MW)), where:
q = gross heat release (calories/second)
9 Texas Commission on Environmental Quality, Technical Basis for Flare Parameters, September 10, 2004. Available at:
https://www.tceq.texas.gov/assets/public/permitting/air/memos/flareparameters.pdf. 10 USEPA, VOC Controls, Chapter 1: Flares, August 2019, p. 1-3. Available at:
Suncor Permitted One-Hour SO2 and NO2 NAAQS Analysis
May 10, 2021
Page - 11
qn = net heat release (calories/second)
MW = estimated mean molecular weight of the gas being flared
SQRT = square root
The equivalent flare stack diameter (DS, in meters) is then calculated as:
DS = 0.001 * SQRT (qn)
For flare the F1 Main Plant Flare, the calculated equivalent stack diameter is 2.08 meters; for
the Plant 2 Main Plant Flare (Refinery Flare), the calculated equivalent stack diameter is 1.76 meters.
The physical stack height for these two flares was obtained from the applicable APEN forms.
3.2.2. Sources not Modeled in this Analysis
Four additional smaller flares were considered, but were omitted from this modeling analysis
(the four flares are: F2-Asphalt Unit Flare, F3-GBR Unit Flare, Truck loading docks w/flare, and
Rail Track Flare). These sources were not modeled due to one or more of the following reasons: the
lack of a source APEN, the lack of flare gas heat release information, or the flare was a very small
contributor to the overall facility emissions.
In addition, two other sources were omitted from this modeling analysis due to the lack of an
associated source APEN (the two sources are: H-20 and the Thermal Oxidizer for Tank Cleaning).
3.3 Building Dimensions for Downwash
Adjacent buildings and other structures may cause plume downwash, a condition where
plumes can be dispersed towards the ground in the downwind wake-effect from these buildings.
USEPA’s Building Profile Input Program (BPIPPRM v. 04274 with Plume Rise Model
Enhancement (PRIME)) is used to determine stack-specific good engineering practice (GEP) values
and wind direction-specific building downwash parameters for each 10-degree azimuth.11
CDPHE provided me with several BPIPPRM input files with building heights and locations
for structures within the Suncor facility. I verified the data within the input files using ArcGIS Pro
and Google Earth and found that many of the older BPIPPRM input files included severely flawed
data including incorrect building location coordinates and incorrect building heights. However, there
11 USEPA, User’s Guide to the Building Profile Input Program, EPA-454/R-93-038, April 21, 2004.
Suncor Permitted One-Hour SO2 and NO2 NAAQS Analysis
May 10, 2021
Page - 12
was one more recent input file associated with the CDPHE’s HCN analysis that included accurate
building heights and locations for 31 structures located centrally to the sources I modeled. I used the
data in this file to run BPIPPRM and calculate building downwash parameters for my 33 modeled
sources and included those parameters in my own modeling analysis.
3.4 Receptors
I modeled a grid of 10,306 receptors with 100-meter spacing centered at the refinery and
extending 5 km in each direction. Receptors are not included for the facility property, and fenceline
receptors are included at 50-meter intervals (Figure 2). I verified fenceline locations based on the
point locations of fenceline monitors that were previously set up to sample benzene.
Modeled receptor locations require terrain elevation data, in meters above sea level. I
obtained terrain elevation data for these locations using National Elevation Dataset (NED) GeoTiff
data for the area encompassing the refinery and the modeled receptors. GeoTiff is a binary file that
includes data descriptors and geo-referencing information necessary for extracting terrain elevations.
I extracted terrain elevations from the NED files using USEPA’s AERMAP program with 1/3rd arc-
second (10 meter horizontal) resolution.
Suncor Permitted One-Hour SO2 and NO2 NAAQS Analysis
May 10, 2021
Page - 13
Figure 2: Modeled Receptors
Suncor Permitted One-Hour SO2 and NO2 NAAQS Analysis
May 10, 2021
Page - 14
3.5 Meteorological Data
CDPHE provided two sets of meteorological data for me to model. One set includes data
from 1990-1994 from the Denver Stapleton International Airport, about 7 kilometers southeast of the
Suncor refinery. The other includes onsite data for 1993, 1994, 1998, 1999, and 2000 from the
Asarco facility about 3 kilometers to the west of the refinery. I was given data both with and without
adj-u*. The data was processed with AERMET v. 19191, which is currently the most recent version
of AERMET. When considering results from both sets of data, CDPHE’s meteorological
determination process states that “the design concentration will be ascertained from the modeled
meteorological data set with the highest impacts using the form of the NAAQS for the pollutant and
averaging period being modeled.” 12
USEPA’s definition of preferred meteorological data includes the most recent five years of
National Weather Service (NWS) data.13 Currently, this condition is satisfied using 2016 through
2020 Automated Surface Observing Station (ASOS) data collected at the most site-appropriate
airport. I processed my own meteorological data for this timespan from Denver International Airport
(KDEN). For comparison, I modeled all three meteorological datasets (2016-2020 from KDEN,
1993-1994 and 1998-2000 from Asarco, and 1990-1994 from Denver Stapleton International
Airport) both with and without adj-u*.
The meteorological data required by AERMOD is prepared by AERMET. Required data
inputs to AERMET are: surface meteorological data, twice-daily soundings of upper air data, and the
micrometeorological parameters surface roughness, albedo, and Bowen ratio.14 AERMET creates the
model-ready surface and profile data files required by AERMOD. Using AERMET v. 19191, I
created an AERMOD-ready meteorological data set to model permitted emissions from the Suncor
refinery. This data set covers five years, 2016 through 2020, and is summarized as follows:
12 CDPHE, Meteorological Determinations and Application of Dispersion Models, available here:
https://www.colorado.gov/airquality/permits/MeteorologicalDetermination.pdf 13 USEPA, Revision to the Guideline on Air Quality Models: Adoption of a Preferred General Purpose (Flat and
Complex Terrain) Dispersion Model and Other Revisions, Appendix W to 40 CFR Part 51, November 9, 2005. 14 Albedo is the fraction of total incident solar radiation reflected by the surface back to space (whiter surfaces have higher
albedo). The Bowen ratio is an indicator of surface moisture. It is the ratio of sensible heat flux to latent heat flux and
drier areas have a higher Bowen ratio. Surface roughness, shown in shorthand as (“z0”), is an essential parameter in
estimating turbulence and diffusion. Technically, it’s the height above the ground that the log wind law extrapolates
to zero. For our purposes, z0 can be thought of as a measure of how much the surface characteristics interfere with
the wind flow. Very smooth surfaces, like short grass or calm ponds, have very low values of z0 -- on the order of
0.01 meter or less. Tall and irregular surfaces, which are a greater obstacle to wind flow, have higher values of z0 –