14
PERSONNEL AND READINESS Air Force by Gender, Race and Ethnicity Office of Diversity Management and Equal Opportunity

PERSONNEL AND READINESS
Air Force
by Gender, Race and Ethnicity
Office of Diversity Management and Equal
Opportunity

PERSONNEL AND READINESS
Air Force
Officers
by Race, Ethnicity

PERSONNEL AND READINESS
USAF Officer Race Data - All Officers (Hispanic Ethnicity Included as Reference Only)
Year
American Indian/ Alaskan Native Asian
Black or African American Multi Racial Pacific Islander White Unknown Total
Count
Hispanic Ethnicity
Count % Count % Count % Count % Count % Count % Count % Count %
2006 262 0.4% 1,853 2.6% 4,466 6.3% 644 0.9% 160 0.2% 58,193 82.5% 4,961 7.0% 70,539 2,689 4.0%
2007 248 0.4% 1,858 2.8% 3,985 6.1% 643 1.0% 169 0.3% 53,766 81.8% 5,049 7.7% 65,718 2,468 3.8%
2008 255 0.4% 1,923 3.0% 3,838 5.9% 714 1.1% 184 0.3% 52,556 81.1% 5,335 8.2% 64,805 2,379 3.7%
2009 277 0.4% 2,082 3.2% 3,804 5.8% 764 1.2% 203 0.3% 52,848 80.7% 5,518 8.4% 65,496 2,345 3.6%
2010 304 0.5% 2,191 3.3% 3,831 5.8% 847 1.3% 219 0.3% 53,102 80.2% 5,707 8.6% 66,201 2,336 3.5%
2011 302 0.5% 2,331 3.6% 3,734 5.7% 874 1.3% 236 0.4% 52,129 79.6% 5,872 9.0% 65,478 2,269 3.5%
2012 309 0.5% 2,626 4.0% 3,853 5.9% 1,019 1.6% 273 0.4% 53,190 81.8% 3,742 5.8% 65,012 2,180 3.4%
2013 303 0.5% 2,623 4.0% 3,815 5.9% 1,098 1.7% 287 0.4% 52,551 81.1% 4,121 6.4% 64,798 2,162 3.3%
2014 296 0.5% 2,693 4.3% 3,706 5.9% 1,197 1.9% 288 0.5% 50,476 81.0% 3,693 5.9% 62,349 2,023 3.2%
2015 296 0.5% 2,704 4.4% 3,634 6.0% 1,309 2.1% 284 0.5% 48,923 80.2% 3,854 6.3% 61,004 1,919 3.1%
2016 304 0.5% 2,790 4.6% 3,628 6.0% 1,416 2.3% 291 0.5% 48,512 79.8% 3,888 6.4% 60,829 3,973 6.5%
Air Force
Officers O1-O10
0
20,000
40,000
60,000
80,000
2006 2007 2008 2009 2010 2011 2012 2013 2014 2015 2016
USAF O1-O10 Population by Race
American Indian/ Alaskan Native Asian
Black or African American Multi Racial
Pacific Islander White
Unknown
0
2,000
4,000
6,000
8,000
2006 2007 2008 2009 2010 2011 2012 2013 2014 2015 2016
USAF O1-O10 Population by Race Racial Populations of fewer than 7,000
American Indian/ Alaskan Native Asian
Black or African American Multi Racial
Pacific Islander Unknown
*DMDC defines ethnicity as Hispanic or non-Hispanic; do not consider Hispanic ethnicity by race.

PERSONNEL AND READINESS
USAF O1-O3 Race Data (Hispanic Ethnicity Included as Reference Only)
Year
American Indian/ Alaskan Native Asian
Black or African American Multi Racial Pacific Islander White Unknown Total
Count
Hispanic Ethnicity
Count % Count % Count % Count % Count % Count % Count % Count %
2006 186 0.5% 1,288 3.2% 2,724 6.7% 494 1.2% 128 0.3% 31,906 78.7% 3,811 9.4% 40,537 1,678 4.5%
2007 175 0.5% 1,260 3.4% 2,319 6.2% 477 1.3% 128 0.3% 29,072 78.0% 3,817 10.2% 37,248 1,461 3.9%
2008 177 0.5% 1,291 3.5% 2,214 6.0% 532 1.4% 137 0.4% 28,391 77.2% 4,031 11.0% 36,773 1,345 3.7%
2009 188 0.5% 1,397 3.7% 2,166 5.8% 560 1.5% 153 0.4% 28,735 76.9% 4,179 11.2% 37,378 1,321 3.5%
2010 200 0.5% 1,485 4.0% 2,116 5.6% 616 1.6% 162 0.4% 28,718 76.6% 4,214 11.2% 37,511 1,246 3.3%
2011 194 0.5% 1,609 4.3% 2,091 5.6% 626 1.7% 182 0.5% 28,263 76.0% 4,204 11.3% 37,169 1,155 3.1%
2012 198 0.5% 1,776 4.9% 2,127 5.8% 741 2.0% 201 0.6% 29,085 79.6% 2,413 6.6% 36,541 1,027 2.8%
2013 188 0.5% 1,775 4.8% 2,140 5.8% 792 2.2% 205 0.6% 29,020 78.8% 2,714 7.4% 36,834 991 2.7%
2014 186 0.5% 1,848 5.2% 2,088 5.8% 861 2.4% 200 0.6% 28,216 79.0% 2,297 6.4% 35,696 890 2.5%
2015 192 0.5% 1,854 5.2% 2,083 5.9% 946 2.7% 193 0.5% 27,700 78.2% 2,433 6.9% 35,401 825 2.3%
2016 198 0.6% 1,850 5.3% 2,080 6.0% 1,022 2.9% 193 0.6% 26,992 77.9% 2,329 6.7% 34,664 2,554 7.3%
Air Force
Officers O1-O3
0
10,000
20,000
30,000
40,000
2006 2007 2008 2009 2010 2011 2012 2013 2014 2015 2016
USAF O1-O3 Population by Race
American Indian/ Alaskan Native Asian
Black or African American Multi Racial
Pacific Islander White
Unknown
0
1,000
2,000
3,000
4,000
5,000
2006 2007 2008 2009 2010 2011 2012 2013 2014 2015 2016
USAF O1-O3 Population by Race Racial Populations of fewer than 5,000
American Indian/ Alaskan Native Asian
Black or African American Multi Racial
Pacific Islander Unknown
*DMDC defines ethnicity as Hispanic or non-Hispanic; do not consider Hispanic ethnicity by race.

PERSONNEL AND READINESS
USAF O4-O6 Race Data (Hispanic Ethnicity Included as Reference Only)
Year
American Indian/ Alaskan Native Asian
Black or African American Multi Racial Pacific Islander White Unknown Total
Count
Hispanic Ethnicity
Count % Count % Count % Count % Count % Count % Count % Count %
2006 76 0.3% 564 1.9% 1,734 5.8% 150 0.5% 32 0.1% 26,009 87.5% 1,150 3.9% 29,715 1,007 3.5%
2007 73 0.3% 597 2.1% 1,654 5.9% 166 0.6% 41 0.1% 24,421 86.6% 1,232 4.4% 28,184 1,003 3.6%
2008 78 0.3% 631 2.3% 1,613 5.8% 182 0.7% 47 0.2% 23,884 86.1% 1,304 4.7% 27,739 1,030 3.7%
2009 89 0.3% 683 2.5% 1,626 5.8% 204 0.7% 50 0.2% 23,812 85.6% 1,339 4.8% 27,803 1,020 3.7%
2010 104 0.4% 704 2.5% 1,700 6.0% 230 0.8% 57 0.2% 24,087 84.9% 1,493 5.3% 28,375 1,086 3.8%
2011 108 0.4% 720 2.6% 1,628 5.8% 248 0.9% 54 0.2% 23,566 84.2% 1,668 6.0% 27,992 1,110 4.0%
2012 111 0.4% 849 3.0% 1,710 6.1% 278 1.0% 71 0.3% 23,819 84.6% 1,329 4.7% 28,167 1,149 4.1%
2013 115 0.4% 846 3.1% 1,660 6.0% 306 1.1% 81 0.3% 23,244 84.0% 1,407 5.1% 27,659 1,168 4.2%
2014 110 0.4% 843 3.2% 1,605 6.1% 336 1.3% 87 0.3% 21,988 83.4% 1,395 5.3% 26,364 1,131 4.3%
2015 104 0.4% 848 3.4% 1,536 6.1% 363 1.4% 90 0.4% 20,948 82.8% 1,418 5.6% 25,307 1,092 4.3%
2016 106 0.4% 938 3.6% 1,533 5.9% 394 1.5% 97 0.4% 21,244 82.1% 1,555 6.0% 25,867 1,416 5.4%
Air Force
Officers O4-O6
0
10,000
20,000
30,000
2006 2007 2008 2009 2010 2011 2012 2013 2014 2015 2016
USAF O4-O6 Population by Race
American Indian/ Alaskan Native Asian
Black or African American Multi Racial
Pacific Islander White
Unknown
0
500
1,000
1,500
2,000
2006 2007 2008 2009 2010 2011 2012 2013 2014 2015 2016
USAF O4-O6 Population by Race Racial Populations of fewer than 2,000
American Indian/ Alaskan Native Asian
Black or African American Multi Racial
Pacific Islander Unknown
*DMDC defines ethnicity as Hispanic or non-Hispanic; do not consider Hispanic ethnicity by race.

PERSONNEL AND READINESS
USAF O7-O10 Race Data (Hispanic Ethnicity Included as Reference Only)
Year
American Indian/ Alaskan Native Asian
Black or African American Multi Racial Pacific Islander White Unknown Total
Count
Hispanic Ethnicity
Count % Count % Count % Count % Count % Count % Count % Count %
2006 0 0.0% 1 0.3% 8 2.8% 0 0.0% 0 0.0% 278 96.9% 0 0.0% 287 4 1.4%
2007 0 0.0% 1 0.3% 12 4.2% 0 0.0% 0 0.0% 273 95.5% 0 0.0% 286 4 1.4%
2008 0 0.0% 1 0.3% 11 3.8% 0 0.0% 0 0.0% 281 95.9% 0 0.0% 293 4 1.4%
2009 0 0.0% 2 0.6% 12 3.8% 0 0.0% 0 0.0% 301 95.6% 0 0.0% 315 4 1.3%
2010 0 0.0% 2 0.6% 15 4.8% 1 0.3% 0 0.0% 297 94.3% 0 0.0% 315 4 1.3%
2011 0 0.0% 2 0.6% 15 4.7% 0 0.0% 0 0.0% 300 94.6% 0 0.0% 317 4 1.3%
2012 0 0.0% 1 0.3% 16 5.3% 0 0.0% 1 0.3% 286 94.1% 0 0.0% 304 4 1.3%
2013 0 0.0% 2 0.7% 15 4.9% 0 0.0% 1 0.3% 287 94.1% 0 0.0% 305 3 1.0%
2014 0 0.0% 2 0.7% 13 4.5% 0 0.0% 1 0.3% 272 94.1% 1 0.3% 289 2 0.7%
2015 0 0.0% 2 0.7% 15 5.1% 0 0.0% 1 0.3% 275 92.9% 3 1.0% 296 2 0.7%
2016 0 0.0% 2 0.7% 15 5.0% 0 0.0% 1 0.3% 276 92.6% 4 1.3% 298 3 1.0%
Air Force
Officers O7-O10
0
100
200
300
400
2006 2007 2008 2009 2010 2011 2012 2013 2014 2015 2016
USAF O7-O10 Population by Race
American Indian/ Alaskan Native Asian
Black or African American Multi Racial
Pacific Islander White
Unknown
0
5
10
15
20
2006 2007 2008 2009 2010 2011 2012 2013 2014 2015 2016
USAF O7-O10 Population by Race Racial Populations of fewer than 20
American Indian/ Alaskan Native Asian
Black or African American Multi Racial
Pacific Islander Unknown
*DMDC defines ethnicity as Hispanic or non-Hispanic; do not consider Hispanic ethnicity by race.
PERSONNEL AND READINESS
US Air Force
Enlisted
by Race, Ethnicity

PERSONNEL AND READINESS
USAF Enlisted Race Data (Hispanic Ethnicity Included as Reference Only)
Year
American Indian/ Alaskan Native Asian
Black or African American Multi Racial Pacific Islander White Unknown Total
Count
Hispanic Ethnicity
Count % Count % Count % Count % Count % Count % Count % Count %
2006 1,688 0.6% 5,948 2.2% 46,280 16.9% 4,540 1.7% 2,447 0.9% 196,988 71.9% 16,093 5.9% 273,984 15,954 5.8%
2007 1,738 0.7% 6,064 2.3% 44,288 16.8% 4,909 1.9% 2,758 1.0% 188,797 71.7% 14,816 5.6% 263,370 14,794 5.6%
2008 1,755 0.7% 6,071 2.4% 43,566 16.9% 5,401 2.1% 2,929 1.1% 184,503 71.5% 13,867 5.4% 258,092 14,137 5.5%
2009 1,831 0.7% 6,396 2.4% 44,327 16.8% 6,163 2.3% 3,165 1.2% 188,278 71.5% 13,187 5.0% 263,347 13,756 5.2%
2010 1,861 0.7% 6,537 2.5% 44,011 16.7% 6,794 2.6% 3,240 1.2% 188,460 71.5% 12,532 4.8% 263,435 13,485 5.1%
2011 1,882 0.7% 6,829 2.6% 43,330 16.5% 7,660 2.9% 3,280 1.2% 187,949 71.4% 12,413 4.7% 263,343 13,073 5.0%
2012 1,853 0.7% 7,078 2.7% 43,496 16.5% 8,480 3.2% 3,277 1.2% 187,844 71.1% 12,098 4.6% 264,126 12,495 4.7%
2013 1,769 0.7% 7,295 2.8% 42,495 16.2% 9,212 3.5% 3,254 1.2% 185,791 71.0% 11,959 4.6% 261,775 12,124 4.6%
2014 1,684 0.7% 7,391 3.0% 40,620 16.2% 9,505 3.8% 3,133 1.3% 176,791 70.7% 10,980 4.4% 250,104 11,360 4.5%
2015 1,692 0.7% 7,647 3.1% 40,033 16.2% 9,743 3.9% 3,073 1.2% 174,151 70.6% 10,402 4.2% 246,741 10,899 4.4%
2016 1,713 0.7% 8,458 3.4% 41,332 16.4% 10,557 4.2% 3,197 1.3% 176,763 70.2% 9,935 3.9% 251,955 37,824 15.1%
Air Force
Enlisted E1-E9
0
50,000
100,000
150,000
200,000
250,000
2006 2007 2008 2009 2010 2011 2012 2013 2014 2015 2016
USAF E1-E9 Population by Race
American Indian/ Alaskan Native Asian
Black or African American Multi Racial
Pacific Islander White
Unknown
0
10,000
20,000
30,000
40,000
50,000
2006 2007 2008 2009 2010 2011 2012 2013 2014 2015 2016
USAF E1-E9 Population by Race Racial Populations of fewer than 50,000
American Indian/ Alaskan Native Asian
Black or African American Multi Racial
Pacific Islander Unknown
*DMDC defines ethnicity as Hispanic or non-Hispanic; do not consider Hispanic ethnicity by race.

PERSONNEL AND READINESS
USAF E1-E3 Race Data (Hispanic Ethnicity Included as Reference Only)
Year
American Indian/ Alaskan Native Asian
Black or African American Multi Racial Pacific Islander White Unknown Total
Count
Hispanic Ethnicity
Count % Count % Count % Count % Count % Count % Count % Count %
2006 456 0.7% 1,754 2.8% 9,157 14.8% 1,362 2.2% 982 1.6% 46,643 75.4% 1,506 2.4% 61,860 969 1.6%
2007 503 0.8% 1,791 2.8% 9,748 15.4% 1,554 2.5% 1,102 1.7% 47,316 74.9% 1,187 1.9% 63,201 945 1.5%
2008 522 0.8% 1,734 2.7% 10,553 16.3% 1,737 2.7% 1,059 1.6% 48,151 74.5% 846 1.3% 64,602 1,013 1.6%
2009 530 0.8% 1,770 2.6% 11,120 16.6% 2,036 3.0% 1,031 1.5% 50,005 74.6% 543 0.8% 67,035 836 1.2%
2010 533 0.8% 1,805 2.7% 11,042 16.3% 2,333 3.4% 972 1.4% 50,698 74.7% 475 0.7% 67,858 919 1.4%
2011 483 0.7% 1,850 2.8% 10,430 15.6% 2,683 4.0% 843 1.3% 49,489 74.2% 912 1.4% 66,690 798 1.2%
2012 440 0.7% 1,826 2.8% 10,430 16.0% 2,949 4.5% 709 1.1% 47,522 73.1% 1,133 1.7% 65,009 555 0.9%
2013 392 0.6% 1,907 3.0% 9,875 15.8% 3,141 5.0% 618 1.0% 45,356 72.4% 1,339 2.1% 62,628 622 1.0%
2014 373 0.6% 1,940 3.4% 9,164 15.9% 2,982 5.2% 573 1.0% 41,483 72.2% 980 1.7% 57,495 584 1.0%
2015 384 0.7% 2,084 3.8% 8,943 16.3% 2,747 5.0% 565 1.0% 39,506 72.0% 622 1.1% 54,851 509 0.9%
2016 440 0.7% 2,617 4.3% 10,463 17.1% 2,908 4.8% 683 1.1% 43,459 71.1% 543 0.9% 61,113 10,146 17.2%
Air Force
Enlisted E1-E3
0
20,000
40,000
60,000
2006 2007 2008 2009 2010 2011 2012 2013 2014 2015 2016
USAF E1-E3 Population by Race
American Indian/ Alaskan Native Asian
Black or African American Multi Racial
Pacific Islander White
Unknown
0
5,000
10,000
15,000
2006 2007 2008 2009 2010 2011 2012 2013 2014 2015 2016
USAF E1-E3 Population by Race Racial Populations of fewer than 12,000
American Indian/ Alaskan Native Asian
Black or African American Multi Racial
Pacific Islander Unknown
*DMDC defines ethnicity as Hispanic or non-Hispanic; do not consider Hispanic ethnicity by race.

PERSONNEL AND READINESS
USAF E4-E6 Race Data (Hispanic Ethnicity Included as Reference Only)
Year
American Indian/ Alaskan Native Asian
Black or African American Multi Racial Pacific Islander White Unknown Total
Count
Hispanic Ethnicity
Count % Count % Count % Count % Count % Count % Count % Count %
2006 1,113 0.6% 3,738 2.1% 29,952 17.1% 2,959 1.7% 1,322 0.8% 123,694 70.5% 12,670 7.2% 175,448 13,261 7.6%
2007 1,111 0.7% 3,772 2.3% 28,009 16.9% 3,113 1.9% 1,507 0.9% 116,658 70.3% 11,758 7.1% 165,928 12,139 7.3%
2008 1,104 0.7% 3,795 2.4% 26,803 16.8% 3,388 2.1% 1,722 1.1% 111,665 70.0% 11,073 6.9% 159,550 11,334 7.1%
2009 1,163 0.7% 4,067 2.5% 27,175 16.7% 3,824 2.4% 1,985 1.2% 113,466 69.9% 10,653 6.6% 162,333 11,089 6.8%
2010 1,177 0.7% 4,150 2.6% 27,179 16.8% 4,112 2.5% 2,120 1.3% 112,632 69.8% 9,945 6.2% 161,315 10,607 6.6%
2011 1,235 0.8% 4,389 2.7% 27,608 16.9% 4,594 2.8% 2,288 1.4% 113,775 69.7% 9,257 5.7% 163,146 10,161 6.2%
2012 1,235 0.7% 4,615 2.8% 27,731 16.8% 5,081 3.1% 2,396 1.5% 115,410 69.9% 8,534 5.2% 165,002 9,630 5.8%
2013 1,199 0.7% 4,732 2.9% 27,216 16.5% 5,564 3.4% 2,428 1.5% 115,604 70.2% 7,942 4.8% 164,685 9,004 5.5%
2014 1,129 0.7% 4,803 3.0% 26,107 16.4% 6,003 3.8% 2,329 1.5% 111,964 70.2% 7,231 4.5% 159,566 8,195 5.1%
2015 1,126 0.7% 4,927 3.1% 26,048 16.2% 6,482 4.0% 2,276 1.4% 112,823 70.2% 7,041 4.4% 160,723 7,843 4.9%
2016 1,092 0.7% 5,121 3.2% 25,699 16.2% 7,006 4.4% 2,212 1.4% 111,209 70.0% 6,480 4.1% 158,819 24,463 15.4%
Air Force
Enlisted E4-E6
0
50,000
100,000
150,000
2006 2007 2008 2009 2010 2011 2012 2013 2014 2015 2016
USAF E4-E6 Population by Race
American Indian/ Alaskan Native Asian
Black or African American Multi Racial
Pacific Islander White
Unknown
0
10,000
20,000
30,000
40,000
2006 2007 2008 2009 2010 2011 2012 2013 2014 2015 2016
USAF E4-E6 Population by Race Racial Populations of fewer than 35,000
American Indian/ Alaskan Native Asian
Black or African American Multi Racial
Pacific Islander Unknown
*DMDC defines ethnicity as Hispanic or non-Hispanic; do not consider Hispanic ethnicity by race.
PERSONNEL AND READINESS
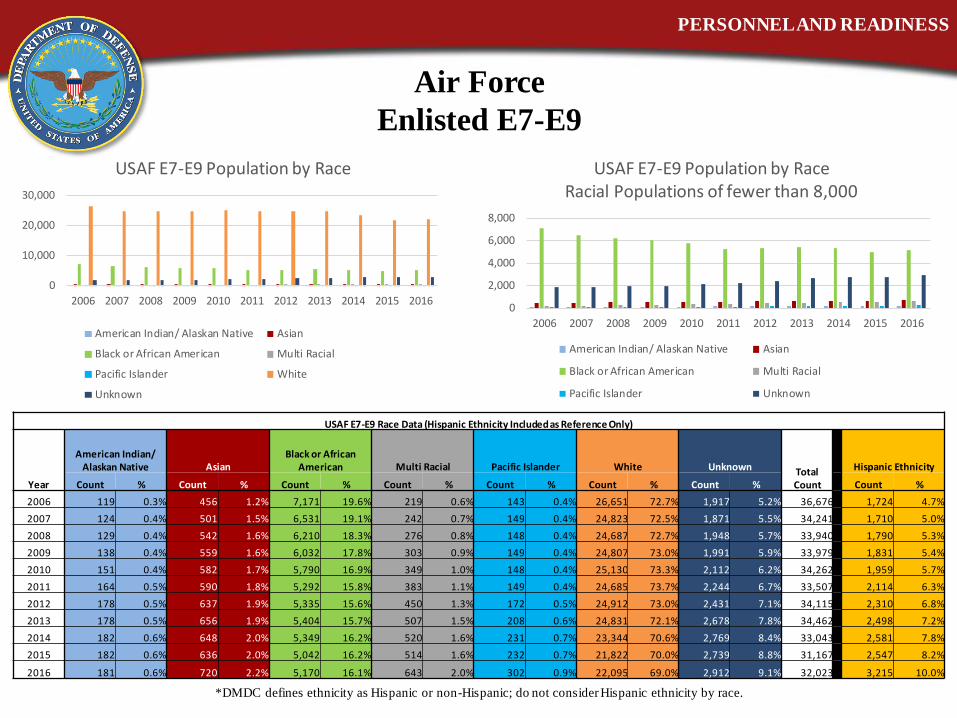
USAF E7-E9 Race Data (Hispanic Ethnicity Included as Reference Only)
Year
American Indian/ Alaskan Native Asian
Black or African American Multi Racial Pacific Islander White Unknown Total
Count
Hispanic Ethnicity
Count % Count % Count % Count % Count % Count % Count % Count %
2006 119 0.3% 456 1.2% 7,171 19.6% 219 0.6% 143 0.4% 26,651 72.7% 1,917 5.2% 36,676 1,724 4.7%
2007 124 0.4% 501 1.5% 6,531 19.1% 242 0.7% 149 0.4% 24,823 72.5% 1,871 5.5% 34,241 1,710 5.0%
2008 129 0.4% 542 1.6% 6,210 18.3% 276 0.8% 148 0.4% 24,687 72.7% 1,948 5.7% 33,940 1,790 5.3%
2009 138 0.4% 559 1.6% 6,032 17.8% 303 0.9% 149 0.4% 24,807 73.0% 1,991 5.9% 33,979 1,831 5.4%
2010 151 0.4% 582 1.7% 5,790 16.9% 349 1.0% 148 0.4% 25,130 73.3% 2,112 6.2% 34,262 1,959 5.7%
2011 164 0.5% 590 1.8% 5,292 15.8% 383 1.1% 149 0.4% 24,685 73.7% 2,244 6.7% 33,507 2,114 6.3%
2012 178 0.5% 637 1.9% 5,335 15.6% 450 1.3% 172 0.5% 24,912 73.0% 2,431 7.1% 34,115 2,310 6.8%
2013 178 0.5% 656 1.9% 5,404 15.7% 507 1.5% 208 0.6% 24,831 72.1% 2,678 7.8% 34,462 2,498 7.2%
2014 182 0.6% 648 2.0% 5,349 16.2% 520 1.6% 231 0.7% 23,344 70.6% 2,769 8.4% 33,043 2,581 7.8%
2015 182 0.6% 636 2.0% 5,042 16.2% 514 1.6% 232 0.7% 21,822 70.0% 2,739 8.8% 31,167 2,547 8.2%
2016 181 0.6% 720 2.2% 5,170 16.1% 643 2.0% 302 0.9% 22,095 69.0% 2,912 9.1% 32,023 3,215 10.0%
Air Force
Enlisted E7-E9
0
10,000
20,000
30,000
2006 2007 2008 2009 2010 2011 2012 2013 2014 2015 2016
USAF E7-E9 Population by Race
American Indian/ Alaskan Native Asian
Black or African American Multi Racial
Pacific Islander White
Unknown
0
2,000
4,000
6,000
8,000
2006 2007 2008 2009 2010 2011 2012 2013 2014 2015 2016
USAF E7-E9 Population by Race Racial Populations of fewer than 8,000
American Indian/ Alaskan Native Asian
Black or African American Multi Racial
Pacific Islander Unknown
*DMDC defines ethnicity as Hispanic or non-Hispanic; do not consider Hispanic ethnicity by race.

PERSONNEL AND READINESS
US Air Force
by Gender

PERSONNEL AND READINESS
O1-O10
Year
Count %
Male Female Male Female
2006 54,934 11,822 82.3% 17.7%
2007 53,887 11,831 82.0% 18.0%
2008 52,936 11,869 81.7% 18.3%
2009 53,399 12,097 81.5% 18.5%
2010 53,838 12,363 81.3% 18.7%
2011 53,187 12,291 81.2% 18.8%
2012 52,525 12,487 80.8% 19.2%
2013 52,106 12,692 80.4% 19.6%
2014 49,945 12,404 80.1% 19.9%
2015 48,637 12,367 79.7% 20.3%
2016 48,827 12,617 79.5% 20.5%
Air Force
Officers by Gender
O1-O3
Year
Count %
Male Female Male Female
2006 29,860 7,720 79.5% 20.5%
2007 29,528 7,720 79.3% 20.7%
2008 29,046 7,727 79.0% 21.0%
2009 29,449 7,929 78.8% 21.2%
2010 29,424 8,087 78.4% 21.6%
2011 29,133 8,036 78.4% 21.6%
2012 28,397 8,144 77.7% 22.3%
2013 28,463 8,371 77.3% 22.7%
2014 27,492 8,204 77.0% 23.0%
2015 27,283 8,118 77.1% 22.9%
2016 27,023 8,093 77.0% 23.0%
O4-O6
Year
Count %
Male Female Male Female
2006 24,811 4,078 85.9% 14.1%
2007 24,094 4,090 85.5% 14.5%
2008 23,624 4,115 85.2% 14.8%
2009 23,663 4,140 85.1% 14.9%
2010 24,125 4,250 85.0% 15.0%
2011 23,765 4,227 84.9% 15.1%
2012 23,853 4,314 84.7% 15.3%
2013 23,365 4,294 84.5% 15.5%
2014 22,188 4,176 84.2% 15.8%
2015 21,077 4,230 83.3% 16.7%
2016 21,533 4,503 82.7% 17.3%
O7-O10
Year
Count %
Male Female Male Female
2006 263 24 91.6% 8.4%
2007 265 21 92.7% 7.3%
2008 266 27 90.8% 9.2%
2009 287 28 91.1% 8.9%
2010 289 26 91.7% 8.3%
2011 289 28 91.2% 8.8%
2012 275 29 90.5% 9.5%
2013 278 27 91.1% 8.9%
2014 265 24 91.7% 8.3%
2015 277 19 93.6% 6.4%
2016 271 21 92.8% 7.2%

PERSONNEL AND READINESS
E1-E9
Year
Count %
Male Female Male Female
2006 219,027 54,957 79.9% 20.1%
2007 210,775 52,595 80.0% 20.0%
2008 206,689 51,403 80.1% 19.9%
2009 211,382 51,965 80.3% 19.7%
2010 212,489 50,946 80.7% 19.3%
2011 213,042 50,301 80.9% 19.1%
2012 214,048 49,751 81.1% 18.9%
2013 212,664 49,111 81.2% 18.8%
2014 203,408 46,696 81.3% 18.7%
2015 200,431 46,310 81.2% 18.8%
2016 202,552 47,532 81.0% 19.0%
Air Force
Enlisted by Gender
E1-E3
Year
Count %
Male Female Male Female
2006 48,299 13,561 78.1% 21.9%
2007 49,485 13,716 78.3% 21.7%
2008 50,727 13,875 78.5% 21.5%
2009 53,424 13,611 79.7% 20.3%
2010 54,860 12,998 80.8% 19.2%
2011 54,687 12,003 82.0% 18.0%
2012 53,283 11,399 82.4% 17.6%
2013 51,319 11,309 81.9% 18.1%
2014 46,801 10,694 81.4% 18.6%
2015 44,514 10,337 81.2% 18.8%
2016 47,173 11,817 80.0% 20.0%
E4-E6
Year
Count %
Male Female Male Female
2006 138,625 36,823 79.0% 21.0%
2007 131,422 34,506 79.2% 20.8%
2008 126,595 32,955 79.3% 20.7%
2009 128,789 33,544 79.3% 20.7%
2010 128,355 32,960 79.6% 20.4%
2011 130,204 32,942 79.8% 20.2%
2012 132,456 32,546 80.3% 19.7%
2013 133,004 31,681 80.8% 19.2%
2014 129,523 30,043 81.2% 18.8%
2015 130,591 30,132 81.3% 18.7%
2016 129,641 29,353 81.5% 18.5%
E7-E9
Year
Count %
Male Female Male Female
2006 32,103 4,573 87.5% 12.5%
2007 29,868 4,373 87.2% 12.8%
2008 29,367 4,573 86.5% 13.5%
2009 29,169 4,810 85.8% 14.2%
2010 29,274 4,988 85.4% 14.6%
2011 28,151 5,356 84.0% 16.0%
2012 28,309 5,806 83.0% 17.0%
2013 28,341 6,121 82.2% 17.8%
2014 27,084 5,959 82.0% 18.0%
2015 25,326 5,841 81.3% 18.7%
2016 25,738 6,362 80.2% 19.8%


