1 Integrity Service Excellence Energetic Particle Sensors for Anomaly Attribution and Environmental Specification (CEASE & RHAS) 20 November 2014 Chad Lindstrom 1 , Stuart Huston 2 , W. Robert Johnston 1 1. Air Force Research Laboratory, Space Vehicles Directorate. 2. Atmospheric and Environmental Research, Inc. Air Force Research Laboratory
Transcript
1
Integrity Service Excellence
Energetic Particle Sensors for
Anomaly Attribution and
Environmental Specification
(CEASE & RHAS)
20 November 2014
Chad Lindstrom1,
Stuart Huston2 ,
W. Robert Johnston1
1. Air Force Research Laboratory, Space Vehicles Directorate.
Various Ways Space Particle Environment Can Affect Satellites Current Approach:
1. Design for Robustness • Designs and components have
heritage and/or testing to env. specifications
• Requires good environmental models – what do we design to?
Most of the time this works, but occasionally the space particle environment still causes anomalies
2. Anomaly Attribution • Isolate anomaly to particular subsystem • Determine source of anomaly based on
understanding of subsystem that is affected • Particle environment is often not
considered until source of last resort
First time occurrences
3. Impact to Operations & Mitigation • Accurate knowledge of cause enables best assessment and mitigation strategy
Can be time critical!
Often we don’t have actionable data on the particle environment
Motivation
3
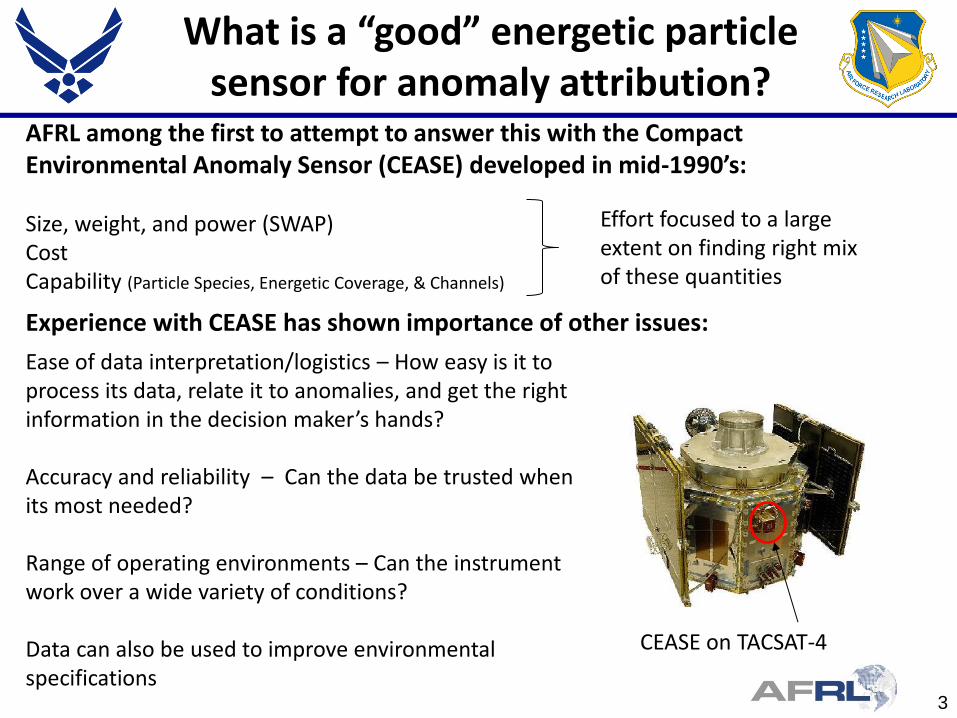
What is a “good” energetic particle sensor for anomaly attribution?
AFRL among the first to attempt to answer this with the Compact Environmental Anomaly Sensor (CEASE) developed in mid-1990’s: Size, weight, and power (SWAP) Cost Capability (Particle Species, Energetic Coverage, & Channels)
Effort focused to a large extent on finding right mix of these quantities
Experience with CEASE has shown importance of other issues:
Ease of data interpretation/logistics – How easy is it to process its data, relate it to anomalies, and get the right information in the decision maker’s hands? Accuracy and reliability – Can the data be trusted when its most needed? Range of operating environments – Can the instrument work over a wide variety of conditions? Data can also be used to improve environmental specifications
CEASE on TACSAT-4
4
Particle Detectors • 2 Dosimeters (Heavy and Light Shielded)
• Two element particle telescope • SEE sensor
• Nominally 1-80 MeV protons, 0.05-3 MeV e-
• CEASE II adds electrostatic analyzer for low energy electrons
Vital Statistics • Mass: 1 kg • Power: 1.2 W • Size: 10 x 10 x 8 cm
CEASE Instrument Functions • Provide real-time warning of space environmental hazards • Assist satellite operators in investigating anomalies • If spacecraft resources allow, collect detailed radiation environment data for research and input to specification and forecast models
Particle
Telescope
DFT
DFB
Compact Environmental Anomaly Sensor (CEASE)
5
Mission Orbit Launch Status Notes
TSX-5 LEO (410 x 1710 km, 69° inc)
Jun 2000 Ended in 2006 B.K. Dichter et. al demonstrated excellent correlation between SEE type anomalies and CEASE data; Data has been extensively used in AE9/AP9 v1.0.
DSP-21 GEO Aug 2001 10+ years in operation
First CEASE II with electrostatic analyzer; Used in AE9/AP9 validation
SES-12 GEO Activated Jun 2010
Operational CEASE II
First commercial operation of CEASE
TACSAT-4 HEO (700 x 12050 km, 63°)
Sep 2011 Completed mission in 2013
Identified elevated proton levels responsible for accelerated solar degradation; Proton data is one of key upgrades in AP9 v1.2
DSX MEO (6000 x 12000 km, 45° inc)
Late 2015 CEASE I Integrated
Final CEASE I unit will be part of comprehensive science suite to measure MEO particle populations
CEASE Flight History
Extensive flight history has provided AFRL and its partners with a unique perspective TACSAT-4 in particular is an important example of anomaly attribution
6
SCE #1 : Emcore BTJM (3J) 3-cell string w/ 6 mil CMG coverglass (full IV curves)
Power Array : Emcore ATJ (3J) w/ 6 mil CMG coverglass (current at load only)
TACSAT-4 Solar Cell Degradation (Effects of 1-10 MeV Slot Protons)
Mission planned using AP8min
Voc
Isc
• Rapid degradation cause for alarm! • SCREAM w/CEASE explained results and enabled projections of effects on ops
1. P.P Jenkins et al., “TACSAT-4 Solar Cell Experiment: Two Years in Orbit.” 10th European Space Power Conference, Noordwijkerhout, NL, 14 Apr 2014.
7
Timeline Showing Challenges of Attribution
Launch
Sep. 2011
Oct. 2011
AFRL notices apparent enhanced proton flux at L~ 2.5-3.1 but questions exist because CEASE response historically was not trusted below proton energies of 15 MeV. NRL operations team notified about this finding.
Nov. 2011
NRL SCE scientists contact AFRL with questions about environment. Crash effort begun to provide proton spectra required to drive SCREAM
Dec.-Jan. 2011
Initial results from CEASE proton spectra appear promising. However, a new problem appears of a strong dropout in proton fluence. Speculation is it is associated with sensor look direction.
Speculation that dip is associated with look direction is confirmed. AFRL unfolds effects of look direction on fluence spectra and first quantitative estimates show good agreement with SCE #1.
Feb.- June 2012
TACSAT-4 operations begins limited usage of SCREAM/CEASE results to estimate potential impact on future operations. Results are first presented to community at NSREC.
Sep. 2012
AP9 version 1.2 released with fully cleaned and cross-calibrated CEASE data from TACSAT-4 among improvements
TACSAT-4 successfully ends its mission after 2 years on orbit
Sep. 2013
Jul. 2014
What have we learned from this experience about what makes a good energetic particle sensor for anomaly attribution?
8
Importance of Accuracy &
Reliability of Particle Data
1 10 100 1000
0.0001
0.001
0.01
0.1
1
G(E
) [c
m2
sr]
Proton Energy, MeV
0
)()( dEEjEGC isoi
CEASE response for 1-10 MeV protons Significant concerns existed about CEASE’s ability to measure 1-10 MeV protons
CEASE observes counts
Proton flux Response
CEASE channels at these energies required careful analysis since they respond most strongly to high energy protons
Ultimately, excellent performance achieved for soft spectra
• Biggest factor in slowing down confidence in attribution analysis • Understand limitations of the sensor (models and calibrations critical to achieving this)
Cross-calibration with ACE/GOES
9
Logistics and Ease of Data
Interpretation
NRL’s SCREAM (Solar Cell Radiation Environment Analysis Models) required spectra to do assessment
• Understand what is required to drive attribution software from sensor • Be able to quickly generate particle spectra as it is the basis for most advanced analysis
0° 90° 180° 360° 270°
Proton flux during 0.5°/s roll
Problems existed in initially getting attitude data but ultimately proved critical in analysis
• Information flow both from and to the spacecraft operations center is critical to performing timely anomaly attribution
10
CEASE III/RR Instrument Overview
LEPET HEPET
ESA
Focus has been on extending CEASE capabilities, accuracy, and reliability – not reducing SWAP and risk reduction unit’s first planned flight is to GEO in 2017 (delivery early 2016)
2 solid-state detectors measure incident proton fluxes from 3 – 12 MeV; electron fluxes from 0.05- 1 MeV
5 solid-state detectors measure incident proton fluxes from 15 – 200 MeV; electron fluxes from 1- 4 MeV
Two cylindrical ESAs measure electrons and ions from 100 eV to 50 keV
Dimensions: 10x10x25 cm Weight: 3.3kg Power: 8 W max avg; 10 W peak
Designed to minimize changes necessary for follow on Class A operational instrument
CEASE III/RR Solid Model
(Low Energy Proton Electron Telescope)
(High Energy Proton Electron Telescope)
RR = Risk Reduction
(Electrostatic analyzer)
11
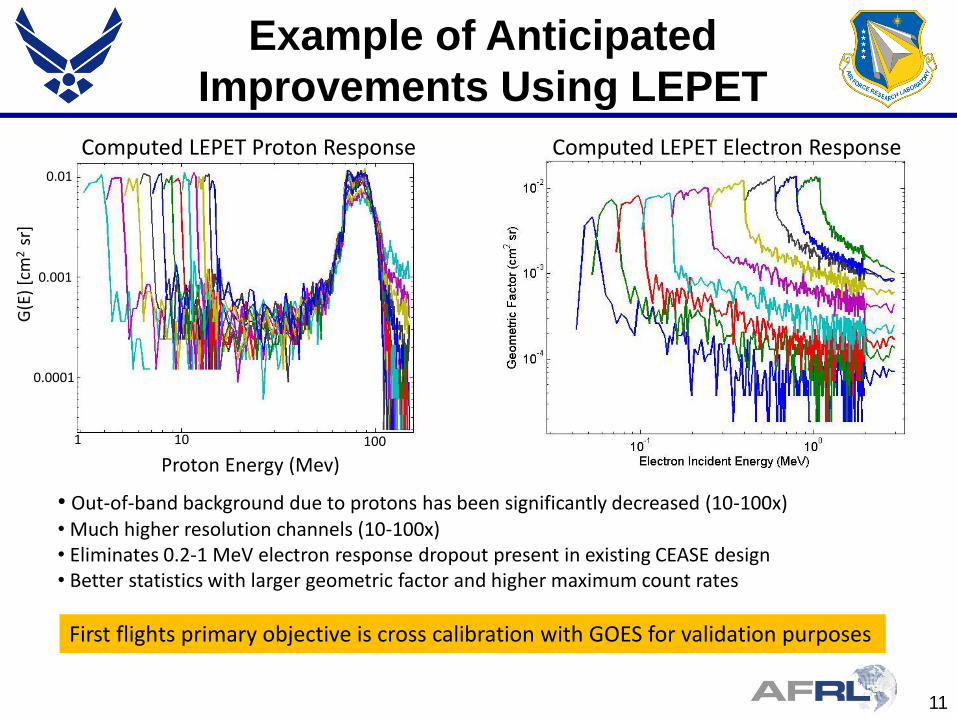
Example of Anticipated
Improvements Using LEPET
1 10 100
0.0001
0.001
0.01
Computed LEPET Proton Response
G(E
) [c
m2
sr]
Proton Energy (Mev)
Computed LEPET Electron Response
• Out-of-band background due to protons has been significantly decreased (10-100x) • Much higher resolution channels (10-100x) • Eliminates 0.2-1 MeV electron response dropout present in existing CEASE design • Better statistics with larger geometric factor and higher maximum count rates
First flights primary objective is cross calibration with GOES for validation purposes
Mechanical • 490 grams • 5”x5.375”x1” External Dimensions • Al case – serves as camera lid as well as
instrument • Stainless steel lid and spacecraft wall used for
differential shielding (mounted inside wall)
Radiation Hazard Awareness Sensor (RHAS)
Diagnostics: • Temperature monitors (one for each dosimeter) • On-orbit calibration • Multiple data acquisition modes
Sensor emphasizes SWAP and cost over capability, accuracy, and reliability – question is whether the data is sufficient for simple, correlative type anomaly attribution?
Manifested on 2 identical GEO satellites intended for launch in 2017
13
Conclusion
Successful use of space particle detectors as hosted payloads for anomaly attribution requires designing sensors with an appropriate balance between:
Cost Size, Weight, and Power Capability Establishing trust in data
These principles as well as experience with CEASE I & II are guiding the development of AFRL’s CEASE RR/III and RHAS sensors