NC STATE UNIVERSITY. U.A.S.L.P. Process Integration for Environmental Control in Engineering Curricula. “AIR POLLUTION”. I. Q. Francisco Gómez Rivera. Universidad Autónoma de San Luis Potosí. Dr. John Heitmann Jr. North Carolina State University. Dr. Pedro Medellín Milán - PowerPoint PPT Presentation
“ “ AIR POLLUTION” AIR POLLUTION” NC STATE UNIVERSITY Process Integration for Process Integration for Environmental Control in Environmental Control in Engineering Curricula Engineering Curricula I. Q. Francisco Gómez Rivera I. Q. Francisco Gómez Rivera Dr. Pedro Medellín Milán Dr. Pedro Medellín Milán Universidad Autónoma de San Luis Universidad Autónoma de San Luis Potosí Potosí Dr. John Heitmann Jr. Dr. John Heitmann Jr. North Carolina State Universi North Carolina State Universi January-May 2005 January-May 2005 U.A.S.L.P. U.A.S.L.P. Universidad Autónoma de San Luis Potosí Universidad Autónoma de San Luis Potosí
Transcript
““AIR POLLUTION”AIR POLLUTION”
NC STATEUNIVERSITY
Process Integration for Environmental Control Process Integration for Environmental Control in Engineering Curriculain Engineering Curricula
I. Q. Francisco Gómez RiveraI. Q. Francisco Gómez Rivera
Dr. Pedro Medellín MilánDr. Pedro Medellín MilánUniversidad Autónoma de San Luis PotosíUniversidad Autónoma de San Luis Potosí
Dr. John Heitmann Jr.Dr. John Heitmann Jr.North Carolina State UniversityNorth Carolina State University
January-May 2005January-May 2005
U.A.S.L.P.U.A.S.L.P.
Universidad Autónoma de San Luis PotosíUniversidad Autónoma de San Luis Potosí
David T. Allen; David R. Shonnard GREEN ENGINEERING. Environmentally Conscious Design of Chemical Processes Pg: 11-12
destroys
precipitates
6.45 BILLION 9.22 BILLION 2005 2050
U.S. Census Bureau, International Data BaseData updated 4-26-2005http://www.census.gov/ipc/www/worldpop.html
COMMON POLLUTANTSCOMMON POLLUTANTS Sulfur oxides
Nitrogen oxide
Carbon monoxide
Chlorine and fluorine compounds
Hydrocarbons
Organic compounds
MAIN SOURCES OF AIR POLLUTIONMAIN SOURCES OF AIR POLLUTION
ENERGY PRODUCTION
CHEMICAL PROCESSES
TRANSPORTATION
Particulate Material
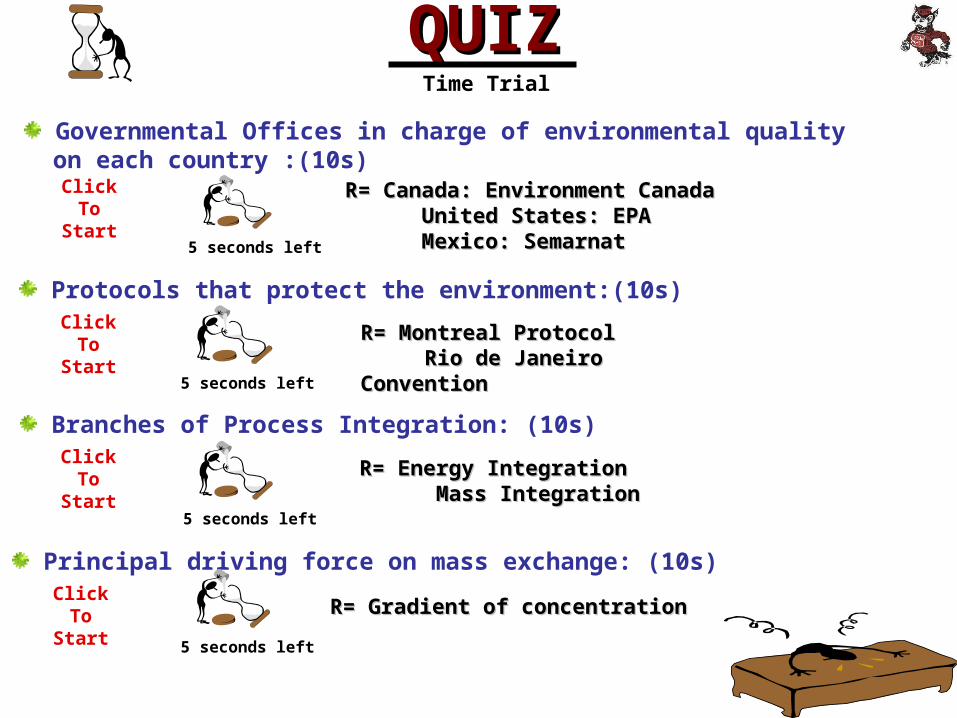
QUIZQUIZ
Percentage that CO2 increases each year:
Time Trial
Main sources of air pollution:(10s)ClickTo
Start5 seconds left
R= Energy ProductionR= Energy Production Chemical ProcessesChemical Processes TransportationTransportation
Mention 3 common pollutants of the atmosphere: (10s)ClickTo
Start
R= Sulfur oxidesR= Sulfur oxides Nitrogen oxidesNitrogen oxides Carbon monoxideCarbon monoxide HydrocarbonsHydrocarbons Organic compoundsOrganic compounds Particle materialParticle material Chlorine and fluorine compoundsChlorine and fluorine compounds
a) 5%a) 5% b) 10%b) 10% c) 15%c) 15% d) 20%d) 20%
5 seconds left
ENERGY PRODUCTION ENERGY PRODUCTION SITUATIONSITUATION
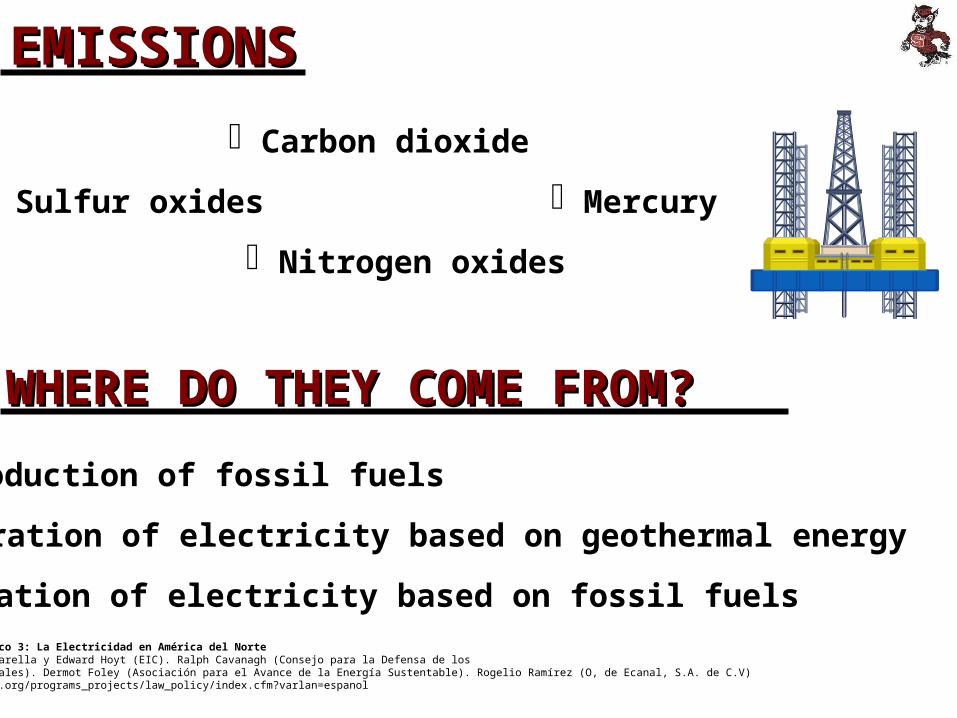
Sulfur oxides
Nitrogen oxides
Carbon dioxide
Mercury
Production of fossil fuels
Generation of electricity based on fossil fuels
Generation of electricity based on geothermal energy
EMISSIONSEMISSIONS
WHERE DO THEY COME FROM?WHERE DO THEY COME FROM?
Estudio Temático 3: La Electricidad en América del NorteJohn Paul Moscarella y Edward Hoyt (EIC). Ralph Cavanagh (Consejo para la Defensa de losRecursos Naturales). Dermot Foley (Asociación para el Avance de la Energía Sustentable). Rogelio Ramírez (O, de Ecanal, S.A. de C.V)http://www.cec.org/programs_projects/law_policy/index.cfm?varlan=espanol
PERCENTAGE OF POLLUTANTS RELEASED BY PERCENTAGE OF POLLUTANTS RELEASED BY THE PRODUCTION OF ENERGY (1995)THE PRODUCTION OF ENERGY (1995)
NONOxxMexico: 15%
United States: 33% = 6.4 millions tons
Canada: 10% = 186,000 tons
SOSO22Mexico: 48%
United States: 70% = 10,519 tons
Canada: 22% = 524,000 tons
COCO22Mexico: 25% = 73 millions tons
United States: 33% = 17 billions tons
Canada: 16.6% = 103 million tons
North America = 33%
Comisión para la Cooperación Ambiental (1997), Continental Pollutant Pathways: An Agenda for Cooperation to Address Long-Range Transport of Air Pollutionin North America (Montreal: CEC).
Coal
Hydroelectric
Natural Gas
Nuclear
Petroleum
Renewable
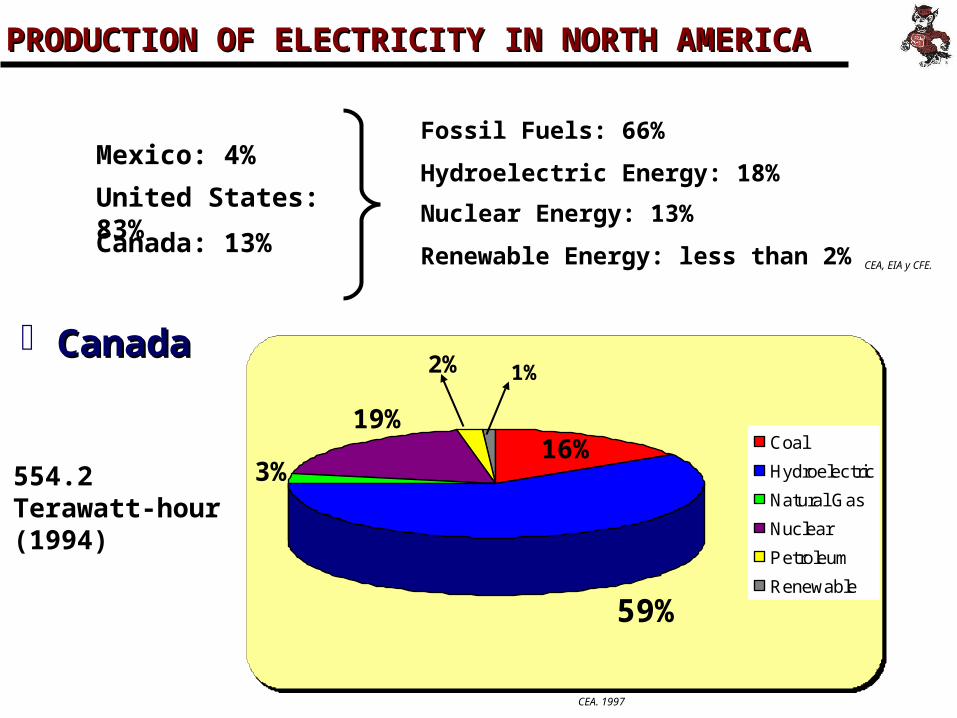
PRODUCTION OF ELECTRICITY IN NORTH AMERICAPRODUCTION OF ELECTRICITY IN NORTH AMERICA
Mexico: 4%
United States: 83%
Canada: 13%
Fossil Fuels: 66%
Hydroelectric Energy: 18%
Nuclear Energy: 13%
Renewable Energy: less than 2%
CanadaCanada
554.2 Terawatt-hour (1994)
CEA, EIA y CFE.
CEA. 1997
59%
19%16%
3%
2% 1%
Coal
Hydroelectric
Natural Gas
Nuclear
Petroleum
Renewable
United StatesUnited States
3,473.6 Terawatt-hour (1994)
MexicoMexico
147.9 Terawatt-hour (1994)
53%
21%
14%
8%
3% 1%
EIA, 1998.
CFE, 1995.
Coal
Hydroelectric
Natural Gas
Nuclear
Petroleum
Renewable
59%
14%
12%
9%
4%
2%
GROWTHGROWTHThe consumption of electricity is growing. Between 1997 and 2005 the growth in North America has been:
Mexico:Mexico: 4.5% per year
United States:United States: 1.7% per year
Canada:Canada: 1.6% per year
OTHER TECHNOLOGIES?OTHER TECHNOLOGIES?
In order to supply the new necessities of electricity technologies based in natural gas and hydroelectric energy are the main sources
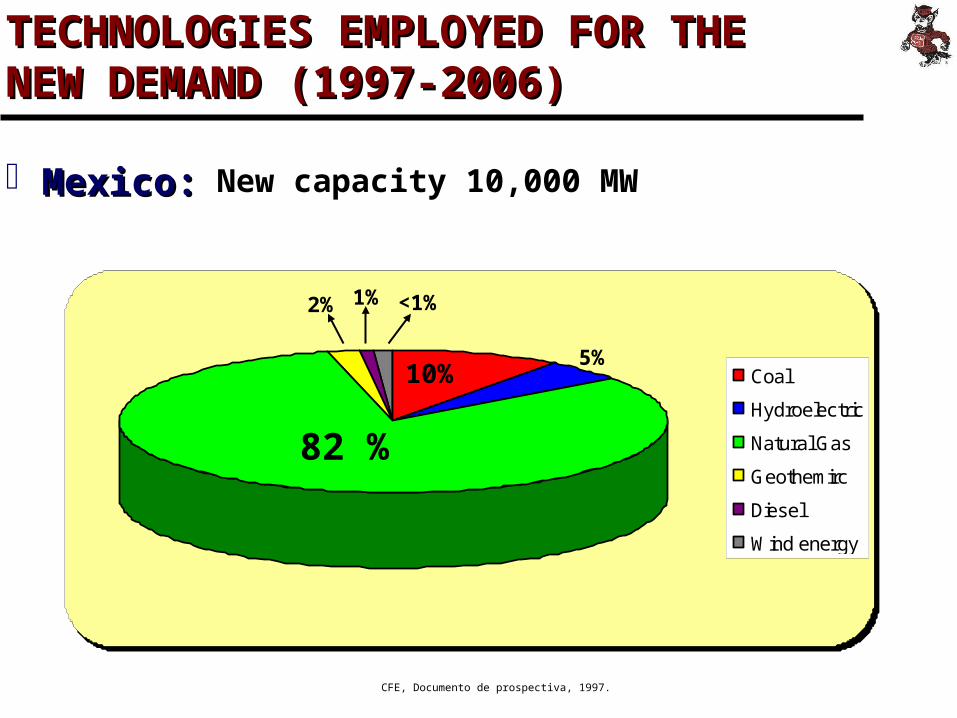
Coal
Hydroelectric
Natural Gas
Geothemirc
Diesel
Wind energy
Mexico:Mexico:
TECHNOLOGIES EMPLOYED FOR THE TECHNOLOGIES EMPLOYED FOR THE NEW DEMAND (1997-2006) NEW DEMAND (1997-2006)
New capacity 10,000 MW
82 %
10% 5%
2% 1% <1%
CFE, Documento de prospectiva, 1997.
Hydroelectric
Natural Gas
Others
Coal
Hydroelectric
Natural Gas
Nuclear
Petroleum
Renewable
United United States:States:
Canada:Canada:
8,212 MW in 2010
69%
15% 11%
3% 1%
1%
75% 22%
3%
Departamento de Energía de Estados Unidos, EIA.
CEA, Electric Power in Canada, 1995.
REGULATIONSREGULATIONS
Mexico:Mexico:
NOM-ECOL-085-1994
NOM-ECOL-086-1994
Permissible emissions for NOx and SOx in
point and mobile sources
Pollutant MZMC (ppm) CZ (ppm) RC (ppm)
SO2 1.13 2.26 4.53
NOx 0.16 0.16 0.55
PM 0.04 0.19 0.27
MZMC: Metropolitan Zone, Mexico City
CZ: Critic Zone. Monterrey, Guadalajara, Ciudad Juarez
RC: Rest of the country
Sources of more than 110,000 MJ/hour
NOM-ECOL-085-1994
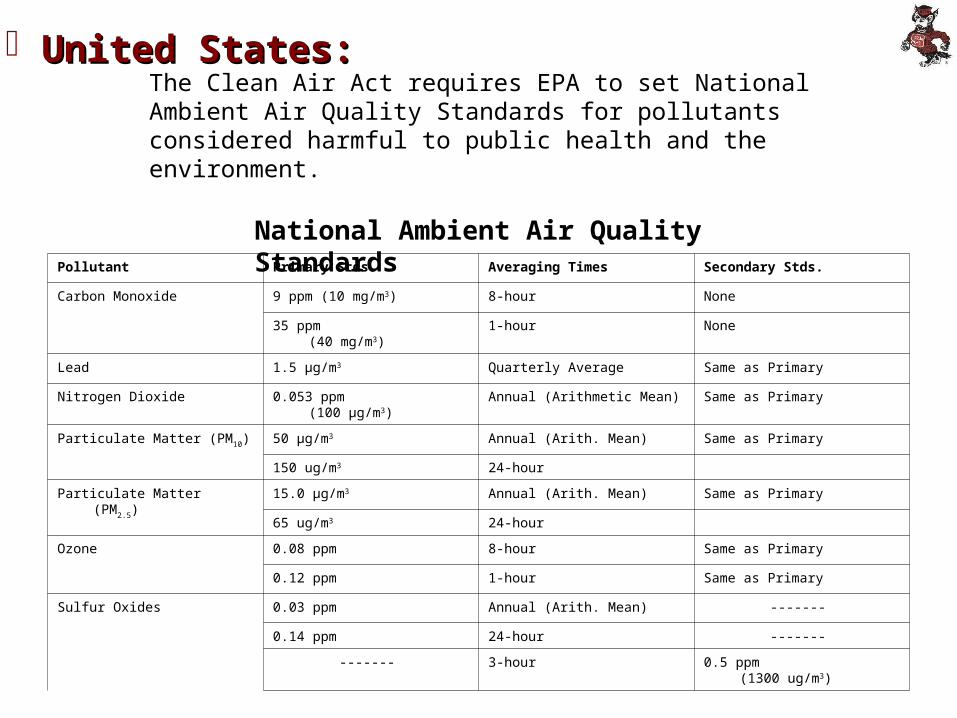
United States:United States:
Pollutant Primary Stds. Averaging Times Secondary Stds.
Carbon Monoxide 9 ppm (10 mg/m3) 8-hour None
35 ppm (40 mg/m3)
1-hour None
Lead 1.5 µg/m3 Quarterly Average Same as Primary
Nitrogen Dioxide 0.053 ppm (100 µg/m3)
Annual (Arithmetic Mean) Same as Primary
Particulate Matter (PM10) 50 µg/m3 Annual (Arith. Mean) Same as Primary
150 ug/m3 24-hour
Particulate Matter (PM2.5) 15.0 µg/m3 Annual (Arith. Mean) Same as Primary
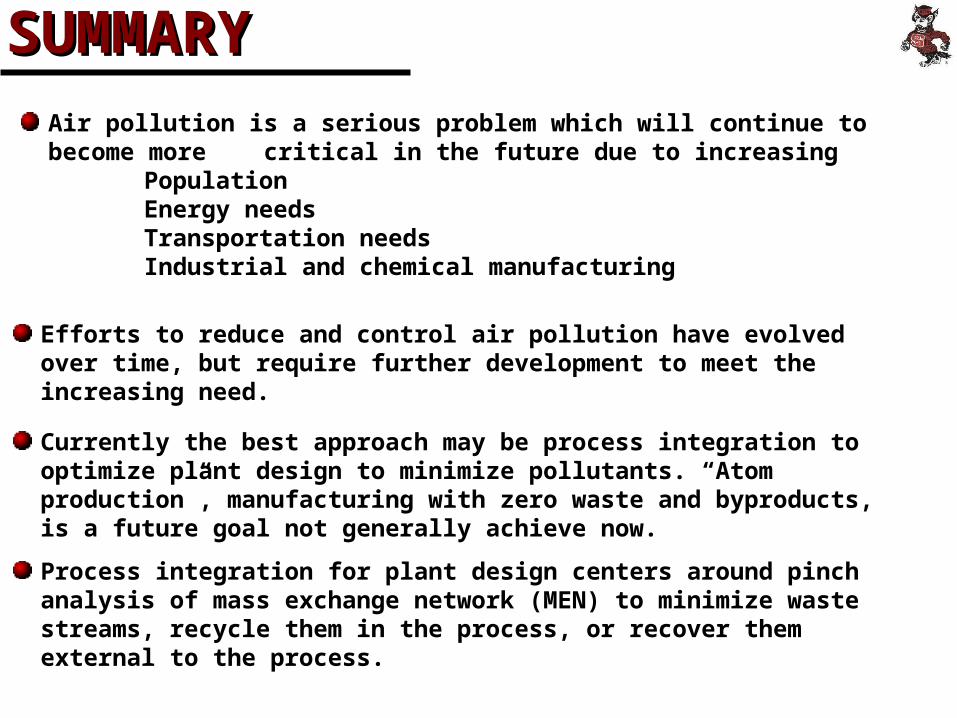
SUMMARYSUMMARYAir pollution is a serious problem which will continue to become more critical in the future due to increasing
PopulationEnergy needsTransportation needsIndustrial and chemical manufacturing
Efforts to reduce and control air pollution have evolved over time, but require further development to meet the increasing need.
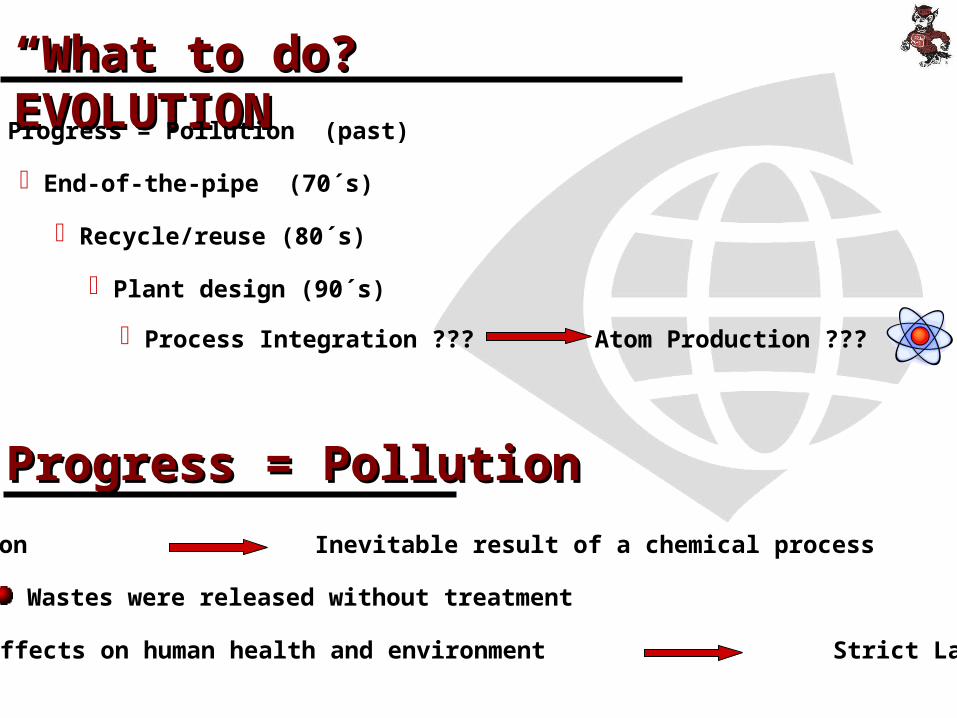
Currently the best approach may be process integration to optimize plant design to minimize pollutants. “Atom production”, manufacturing with zero waste and byproducts, is a future goal not generally achieve now.
Process integration for plant design centers around pinch analysis of mass exchange network (MEN) to minimize waste streams, recycle them in the process, or recover them external to the process.