+ All Categories
Home > Documents > Air quality modelling in the Berlin–Brandenburg region ... S3. Conditional quantile plot of wind...

Air quality modelling in the Berlin–Brandenburg region ... S3. Conditional quantile plot of wind...

Date post: 25-May-2018
Category:
Upload: hoangnhan
View: 215 times
Download: 0 times
Share this document with a friend
19
Supplement of Geosci. Model Dev., 9, 4339–4363, 2016 http://www.geosci-model-dev.net/9/4339/2016/ doi:10.5194/gmd-9-4339-2016-supplement © Author(s) 2016. CC Attribution 3.0 License. Supplement of Air quality modelling in the Berlin–Brandenburg region using WRF-Chem v3.7.1: sensitivity to resolution of model grid and input data Friderike Kuik et al. Correspondence to: Friderike Kuik ([email protected]) The copyright of individual parts of the supplement might differ from the CC-BY 3.0 licence.
Transcript

Supplement of Geosci. Model Dev., 9, 4339–4363, 2016http://www.geosci-model-dev.net/9/4339/2016/doi:10.5194/gmd-9-4339-2016-supplement© Author(s) 2016. CC Attribution 3.0 License.

Supplement of

Air quality modelling in the Berlin–Brandenburg region usingWRF-Chem v3.7.1: sensitivity to resolution of model gridand input dataFriderike Kuik et al.

Correspondence to: Friderike Kuik ([email protected])

The copyright of individual parts of the supplement might differ from the CC-BY 3.0 licence.

S1 Mapping of CORINE land use to USGS land use classes

Table S1. Mapping of CORINE land use to USGS land use classes

CORINE land use type CORINE id USGS land use type USGS id

Continuous urban fabric 1 high intensity residential 32

Discontinuous urban fabric 2 low intensity residential 31

Industry, airports, dump sites, constructions, etc. 3-9 commercial, industry, transport 33

Green urban areas, sport and leisure facilities 10-11 low intensity residential 31

Non-irrigated arable land 12 dryland cropland and pasture 2

Permanently irrigated land, rice fields 13-14 irrigated cropland and pasture 3

Vineyards, fruit/berry/olive plantations 15-17 cropland/woodland mosaic 6

Pastures 18 Dryland cropland and pasture 2

Annual crops, complex cultivation, etc. 19-22 Cropland/woodland mosaic 6

Broad-leaf forest 23 Deciduous broadleaf forest 11

Coniferous forest 24 Evergreen needle leaf forest 14

Mixed forest 25 Mixed forest 15

Natural grasslands 26 Grassland 7

Moors and heathland, sclerophyllos vegetation, etc. 27-29 Mixed shrubland/grassland 9

Beaches, bare rocks, sparse vegetation, burns 30-33 Barren or sparsely vegetated 19

Glaciers and perpetual snow 24 snow or ice 24

Marshes, peat bogs, salines, intertidal flats 35-39 herbaceous wetland 17

Water 40-43 inland water bodies 28

Sea and ocean 44 water bodies 16

Unclassified 48-50 unclassified 0

1

S2 Supplementary figures and tables

Figure S1. JJA mean profiles of observed and modeled (base run, 15kmx15km horizontal resolution) temperature at Lindenberg at 00:00,06:00, 12:00 and 18:00 UTC. Error bars show the 25th and 75th percentiles of temperature and geopotential height.

Figure S2. JJA mean profiles of observed and modeled (base run, 3kmx3km horizontal resolution) temperature at Lindenberg at 00:00,06:00, 12:00 and 18:00 UTC. Error bars show the 25th and 75th percentiles of temperature and geopotential height.

2

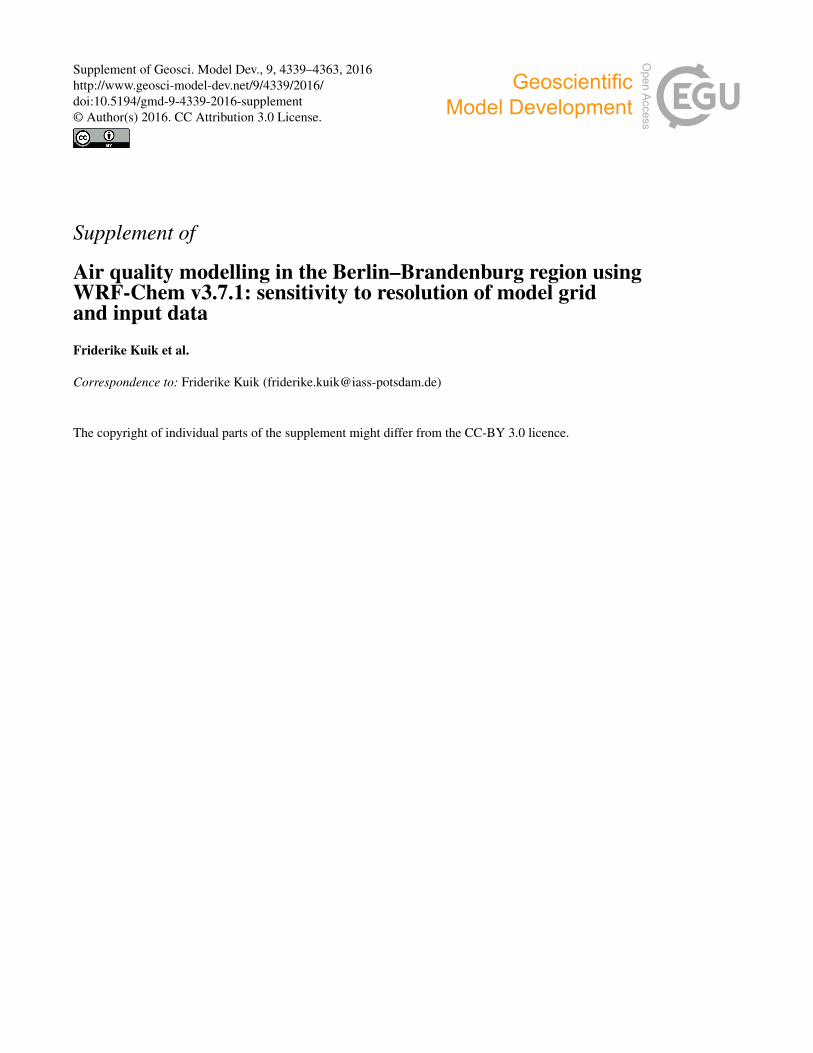
Figure S3. Conditional quantile plot of wind speed, split by modeled wind direction. Observations at Tempelhof, Schöneberg and Tegel arecompared to model results extracted for the respective grid cells, 1km horizontal resolution, base run.

Figure S4. Conditional quantile plot of wind speed, split by modeled wind direction. Observations at Tempelhof, Schöneberg and Tegel arecompared to model results extracted for the respective grid cells,1km horizontal resolution, S1_urb.

3

Figure S5. Conditional quantile plot of wind speed, split by modeled wind direction. Observations at Tempelhof, Schöneberg and Tegel arecompared to model results extracted for the respective grid cells, 1km horizontal resolution, S2_mos.

4

Figure S6. Mean diurnal cycles of NO, NO2, NOx and O3 for all Berlin and Potsdam urban background stations as observed and modeledby the base run, S1_urb, S2_mos and S3_emi. The diurnal cycle is averaged over three stations for NO, NO2 and NOx and three stations ofO3. The grey shaded areas represent the variability between the different stations’ diurnal cycles, showing 25th and 75th percentiles.

5

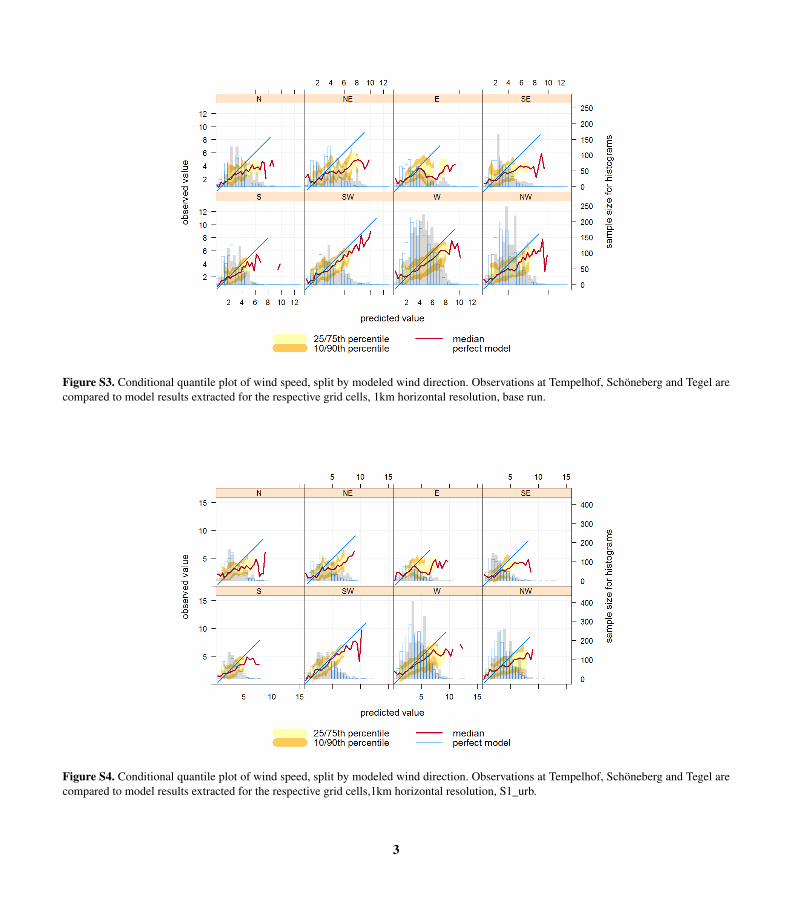
Figure S7. Mean diurnal cycles of NO, NO2, NOx and O3 for all Berlin and Potsdam urban background stations as observed and modeledby the base run, S1_urb, S2_mos and S3_emi. The diurnal cycle is averaged over four stations for NO, NO2 and NOx and four stations ofO3. The grey shaded areas represent the variability between the different stations’ diurnal cycles, showing 25th and 75th percentiles.

6

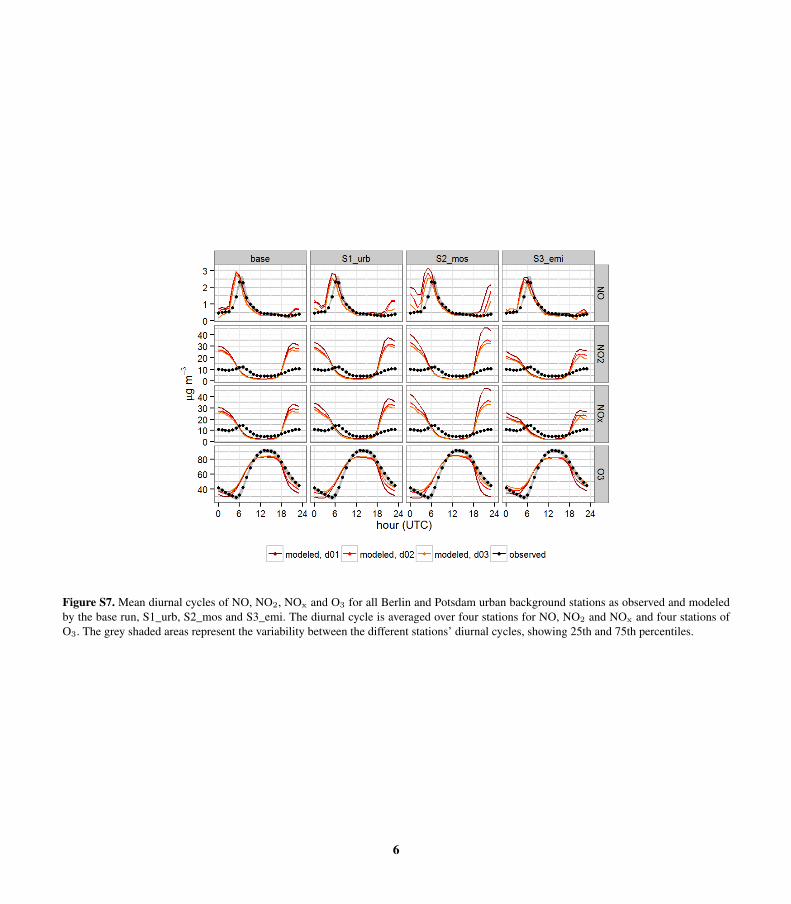
Figure S8. Prescribed diurnal traffic emission factors and factors calculated from JJA 2014 traffic counts at five stations in Berlin, taking intoaccount weekday car traffic in both directions. A factor of one corresponds to the mean over the whole day, a larger factor points to higheremissions/number of cars counted than on average during one day.

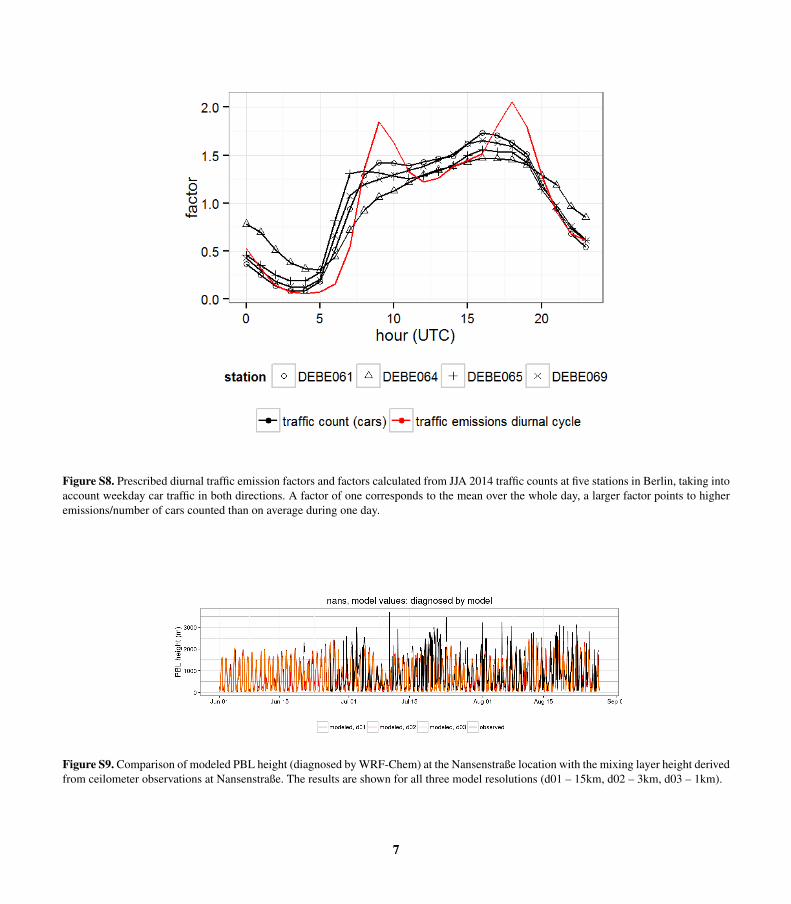
Figure S9. Comparison of modeled PBL height (diagnosed by WRF-Chem) at the Nansenstraße location with the mixing layer height derivedfrom ceilometer observations at Nansenstraße. The results are shown for all three model resolutions (d01 – 15km, d02 – 3km, d03 – 1km).

7

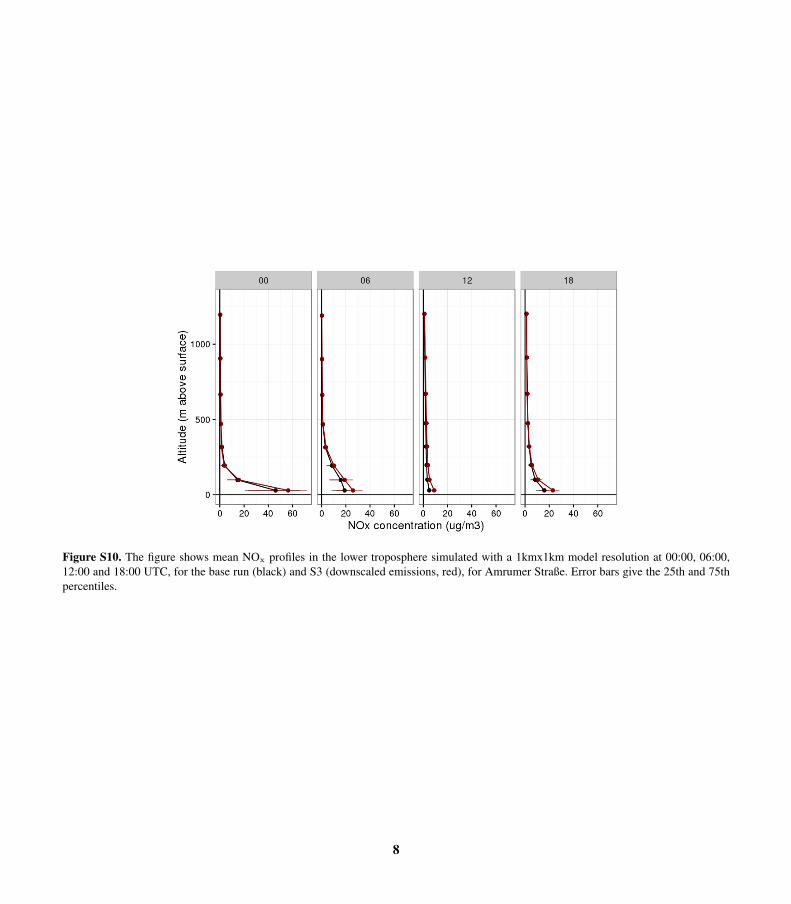
Figure S10. The figure shows mean NOx profiles in the lower troposphere simulated with a 1kmx1km model resolution at 00:00, 06:00,12:00 and 18:00 UTC, for the base run (black) and S3 (downscaled emissions, red), for Amrumer Straße. Error bars give the 25th and 75thpercentiles.

8

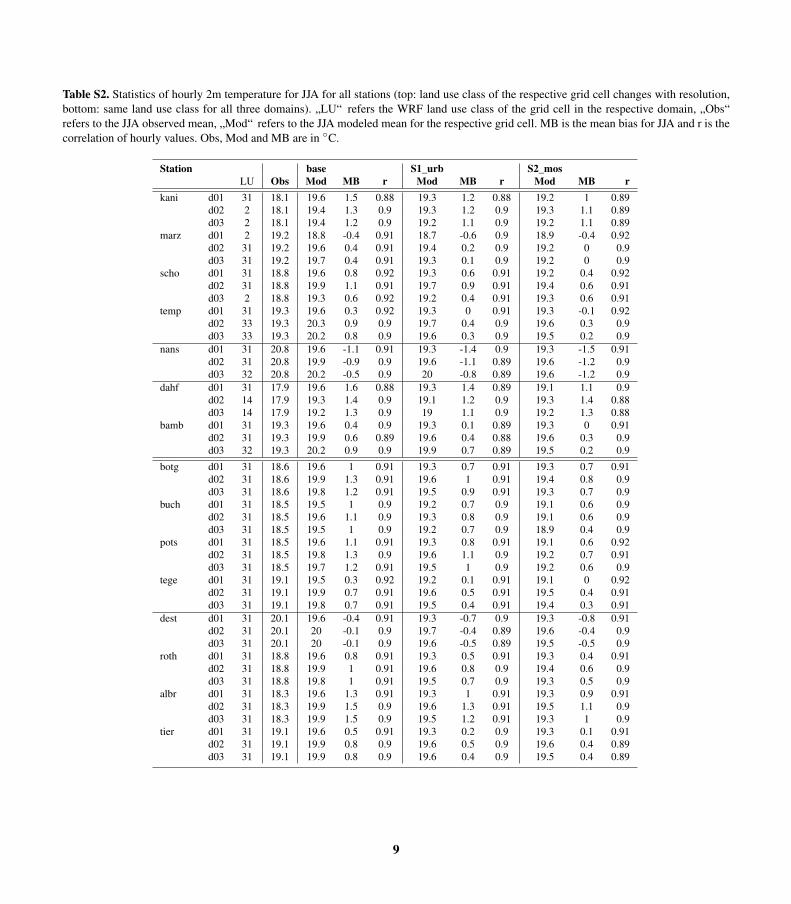
Table S2. Statistics of hourly 2m temperature for JJA for all stations (top: land use class of the respective grid cell changes with resolution,bottom: same land use class for all three domains). „LU“ refers the WRF land use class of the grid cell in the respective domain, „Obs“refers to the JJA observed mean, „Mod“ refers to the JJA modeled mean for the respective grid cell. MB is the mean bias for JJA and r is thecorrelation of hourly values. Obs, Mod and MB are in ◦C.

Station base S1_urb S2_mosLU Obs Mod MB r Mod MB r Mod MB r

kani d01 31 18.1 19.6 1.5 0.88 19.3 1.2 0.88 19.2 1 0.89d02 2 18.1 19.4 1.3 0.9 19.3 1.2 0.9 19.3 1.1 0.89d03 2 18.1 19.4 1.2 0.9 19.2 1.1 0.9 19.2 1.1 0.89

marz d01 2 19.2 18.8 -0.4 0.91 18.7 -0.6 0.9 18.9 -0.4 0.92d02 31 19.2 19.6 0.4 0.91 19.4 0.2 0.9 19.2 0 0.9d03 31 19.2 19.7 0.4 0.91 19.3 0.1 0.9 19.2 0 0.9

scho d01 31 18.8 19.6 0.8 0.92 19.3 0.6 0.91 19.2 0.4 0.92d02 31 18.8 19.9 1.1 0.91 19.7 0.9 0.91 19.4 0.6 0.91d03 2 18.8 19.3 0.6 0.92 19.2 0.4 0.91 19.3 0.6 0.91

temp d01 31 19.3 19.6 0.3 0.92 19.3 0 0.91 19.3 -0.1 0.92d02 33 19.3 20.3 0.9 0.9 19.7 0.4 0.9 19.6 0.3 0.9d03 33 19.3 20.2 0.8 0.9 19.6 0.3 0.9 19.5 0.2 0.9

nans d01 31 20.8 19.6 -1.1 0.91 19.3 -1.4 0.9 19.3 -1.5 0.91d02 31 20.8 19.9 -0.9 0.9 19.6 -1.1 0.89 19.6 -1.2 0.9d03 32 20.8 20.2 -0.5 0.9 20 -0.8 0.89 19.6 -1.2 0.9

dahf d01 31 17.9 19.6 1.6 0.88 19.3 1.4 0.89 19.1 1.1 0.9d02 14 17.9 19.3 1.4 0.9 19.1 1.2 0.9 19.3 1.4 0.88d03 14 17.9 19.2 1.3 0.9 19 1.1 0.9 19.2 1.3 0.88

bamb d01 31 19.3 19.6 0.4 0.9 19.3 0.1 0.89 19.3 0 0.91d02 31 19.3 19.9 0.6 0.89 19.6 0.4 0.88 19.6 0.3 0.9d03 32 19.3 20.2 0.9 0.9 19.9 0.7 0.89 19.5 0.2 0.9

botg d01 31 18.6 19.6 1 0.91 19.3 0.7 0.91 19.3 0.7 0.91d02 31 18.6 19.9 1.3 0.91 19.6 1 0.91 19.4 0.8 0.9d03 31 18.6 19.8 1.2 0.91 19.5 0.9 0.91 19.3 0.7 0.9

buch d01 31 18.5 19.5 1 0.9 19.2 0.7 0.9 19.1 0.6 0.9d02 31 18.5 19.6 1.1 0.9 19.3 0.8 0.9 19.1 0.6 0.9d03 31 18.5 19.5 1 0.9 19.2 0.7 0.9 18.9 0.4 0.9

pots d01 31 18.5 19.6 1.1 0.91 19.3 0.8 0.91 19.1 0.6 0.92d02 31 18.5 19.8 1.3 0.9 19.6 1.1 0.9 19.2 0.7 0.91d03 31 18.5 19.7 1.2 0.91 19.5 1 0.9 19.2 0.6 0.9

tege d01 31 19.1 19.5 0.3 0.92 19.2 0.1 0.91 19.1 0 0.92d02 31 19.1 19.9 0.7 0.91 19.6 0.5 0.91 19.5 0.4 0.91d03 31 19.1 19.8 0.7 0.91 19.5 0.4 0.91 19.4 0.3 0.91

dest d01 31 20.1 19.6 -0.4 0.91 19.3 -0.7 0.9 19.3 -0.8 0.91d02 31 20.1 20 -0.1 0.9 19.7 -0.4 0.89 19.6 -0.4 0.9d03 31 20.1 20 -0.1 0.9 19.6 -0.5 0.89 19.5 -0.5 0.9

roth d01 31 18.8 19.6 0.8 0.91 19.3 0.5 0.91 19.3 0.4 0.91d02 31 18.8 19.9 1 0.91 19.6 0.8 0.9 19.4 0.6 0.9d03 31 18.8 19.8 1 0.91 19.5 0.7 0.9 19.3 0.5 0.9

albr d01 31 18.3 19.6 1.3 0.91 19.3 1 0.91 19.3 0.9 0.91d02 31 18.3 19.9 1.5 0.9 19.6 1.3 0.91 19.5 1.1 0.9d03 31 18.3 19.9 1.5 0.9 19.5 1.2 0.91 19.3 1 0.9

tier d01 31 19.1 19.6 0.5 0.91 19.3 0.2 0.9 19.3 0.1 0.91d02 31 19.1 19.9 0.8 0.9 19.6 0.5 0.9 19.6 0.4 0.89d03 31 19.1 19.9 0.8 0.9 19.6 0.4 0.9 19.5 0.4 0.89

9

Table S3. Statistics of daily maximum 2m temperature for JJA for all stations (top: land use class of the respective grid cell changes withresolution, bottom: same land use class for all three domains). „LU“ refers the WRF land use class of the grid cell in the respective domain,„Obs“ refers to the JJA observed mean, „Mod“ refers to the JJA modeled mean for the respective grid cell. MB is the mean bias for JJA andr is the correlation of hourly values. Obs, Mod and MB are in ◦C.

Station base S1_urb S2_mosLU Obs Mod MB r Mod MB r Mod MB r

kani d01 31 24.2 23.8 -0.4 0.88 23.6 -0.6 0.87 23.3 -0.9 0.89d02 2 24.2 24.4 0.2 0.9 24.3 0.1 0.87 23.9 -0.3 0.9d03 2 24.2 24.3 0.1 0.9 24.2 0 0.87 23.8 -0.4 0.89

marz d01 2 23.9 23.4 -0.5 0.88 23.2 -0.8 0.86 23 -1 0.9d02 31 23.9 24.2 0.2 0.89 24 0 0.87 23.5 -0.4 0.9d03 31 23.9 24.1 0.2 0.89 23.9 0 0.87 23.5 -0.5 0.9

scho d01 31 23.8 23.8 0 0.88 23.6 -0.3 0.87 23.3 -0.5 0.9d02 31 23.8 24.4 0.6 0.9 24.3 0.5 0.88 23.8 0 0.91d03 2 23.8 24.3 0.5 0.9 24.1 0.3 0.88 23.7 -0.1 0.9

temp d01 31 24.1 23.8 -0.3 0.88 23.5 -0.6 0.87 23.3 -0.8 0.89d02 33 24.1 24.5 0.3 0.9 24.3 0.2 0.87 23.8 -0.3 0.9d03 33 24.1 24.4 0.2 0.9 24.2 0 0.87 23.6 -0.5 0.91

nans d01 31 25.5 23.8 -1.7 0.86 23.5 -1.9 0.85 23.3 -2.2 0.88d02 31 25.5 24.4 -1.1 0.87 24.2 -1.3 0.85 23.8 -1.7 0.88d03 32 25.5 24.5 -1 0.87 24.2 -1.3 0.85 23.6 -1.8 0.88

dahf d01 31 23.8 23.7 -0.1 0.89 23.5 -0.3 0.88 23.3 -0.5 0.9d02 14 23.8 24.1 0.3 0.9 24 0.2 0.88 23.7 -0.1 0.9d03 14 23.8 24 0.2 0.9 23.8 0 0.88 23.5 -0.3 0.9

bamb d01 31 22.9 23.8 0.9 0.88 23.5 0.7 0.87 23.3 0.4 0.9d02 31 22.9 24.4 1.5 0.89 24.2 1.3 0.87 23.8 0.9 0.9d03 32 22.9 24.4 1.5 0.9 24.1 1.2 0.87 23.6 0.7 0.9

botg d01 31 23.6 23.8 0.1 0.89 23.5 -0.1 0.88 23.3 -0.3 0.9d02 31 23.6 24.4 0.8 0.9 24.2 0.5 0.88 23.7 0.1 0.9d03 31 23.6 24.3 0.6 0.9 24.1 0.4 0.88 23.6 -0.1 0.9

buch d01 31 23.9 23.6 -0.3 0.89 23.4 -0.6 0.88 23.1 -0.8 0.9d02 31 23.9 24.1 0.1 0.9 23.8 -0.1 0.88 23.5 -0.5 0.9d03 31 23.9 24 0 0.9 23.7 -0.2 0.87 23.3 -0.6 0.9

pots d01 31 23.6 23.7 0.2 0.89 23.5 -0.1 0.87 23.3 -0.3 0.89d02 31 23.6 24.5 0.9 0.89 24.2 0.7 0.87 23.8 0.2 0.89d03 31 23.6 24.3 0.7 0.89 24 0.4 0.87 23.5 0 0.9

tege d01 31 23.7 23.6 -0.1 0.89 23.4 -0.3 0.87 23.1 -0.6 0.9d02 31 23.7 24.4 0.6 0.9 24.2 0.5 0.88 23.7 0 0.9d03 31 23.7 24.3 0.6 0.9 24 0.3 0.88 23.5 -0.2 0.9

dest d01 31 24.2 23.8 -0.4 0.88 23.5 -0.7 0.87 23.3 -0.9 0.9d02 31 24.2 24.4 0.2 0.9 24.2 0 0.87 23.8 -0.4 0.9d03 31 24.2 24.4 0.2 0.9 24.1 -0.1 0.87 23.7 -0.5 0.9

roth d01 31 23.5 23.8 0.3 0.89 23.5 0 0.87 23.3 -0.2 0.89d02 31 23.5 24.4 0.9 0.89 24.2 0.7 0.88 23.7 0.2 0.9d03 31 23.5 24.3 0.8 0.9 24.1 0.6 0.87 23.6 0.1 0.9

albr d01 31 23.6 23.8 0.8 0.89 23.5 0 0.87 23.3 -0.3 0.89d02 31 23.6 24.4 0.8 0.9 24.2 0.6 0.88 23.8 0.2 0.89d03 31 23.6 24.3 0.7 0.9 24.1 0.5 0.87 23.6 0.1 0.9

tier d01 31 24.6 23.8 -0.8 0.88 23.5 -1.1 0.87 23.3 -1.3 0.89d02 31 24.6 24.4 -0.2 0.89 24.2 -0.4 0.87 23.8 -0.9 0.89d03 31 24.6 24.4 -0.2 0.89 24.1 -0.5 0.86 23.7 -0.9 0.89

10

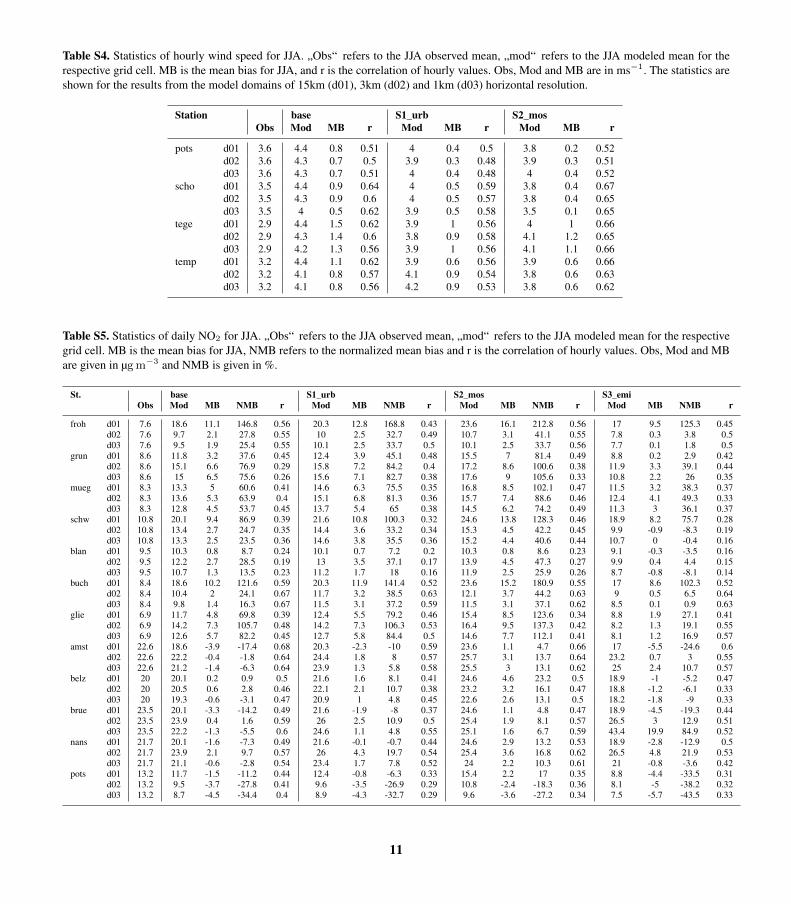
Table S4. Statistics of hourly wind speed for JJA. „Obs“ refers to the JJA observed mean, „mod“ refers to the JJA modeled mean for therespective grid cell. MB is the mean bias for JJA, and r is the correlation of hourly values. Obs, Mod and MB are in ms−1. The statistics areshown for the results from the model domains of 15km (d01), 3km (d02) and 1km (d03) horizontal resolution.

Station base S1_urb S2_mosObs Mod MB r Mod MB r Mod MB r

pots d01 3.6 4.4 0.8 0.51 4 0.4 0.5 3.8 0.2 0.52d02 3.6 4.3 0.7 0.5 3.9 0.3 0.48 3.9 0.3 0.51d03 3.6 4.3 0.7 0.51 4 0.4 0.48 4 0.4 0.52

scho d01 3.5 4.4 0.9 0.64 4 0.5 0.59 3.8 0.4 0.67d02 3.5 4.3 0.9 0.6 4 0.5 0.57 3.8 0.4 0.65d03 3.5 4 0.5 0.62 3.9 0.5 0.58 3.5 0.1 0.65

tege d01 2.9 4.4 1.5 0.62 3.9 1 0.56 4 1 0.66d02 2.9 4.3 1.4 0.6 3.8 0.9 0.58 4.1 1.2 0.65d03 2.9 4.2 1.3 0.56 3.9 1 0.56 4.1 1.1 0.66

temp d01 3.2 4.4 1.1 0.62 3.9 0.6 0.56 3.9 0.6 0.66d02 3.2 4.1 0.8 0.57 4.1 0.9 0.54 3.8 0.6 0.63d03 3.2 4.1 0.8 0.56 4.2 0.9 0.53 3.8 0.6 0.62

Table S5. Statistics of daily NO2 for JJA. „Obs“ refers to the JJA observed mean, „mod“ refers to the JJA modeled mean for the respectivegrid cell. MB is the mean bias for JJA, NMB refers to the normalized mean bias and r is the correlation of hourly values. Obs, Mod and MBare given in µgm−3 and NMB is given in %.

St. base S1_urb S2_mos S3_emiObs Mod MB NMB r Mod MB NMB r Mod MB NMB r Mod MB NMB r

froh d01 7.6 18.6 11.1 146.8 0.56 20.3 12.8 168.8 0.43 23.6 16.1 212.8 0.56 17 9.5 125.3 0.45d02 7.6 9.7 2.1 27.8 0.55 10 2.5 32.7 0.49 10.7 3.1 41.1 0.55 7.8 0.3 3.8 0.5d03 7.6 9.5 1.9 25.4 0.55 10.1 2.5 33.7 0.5 10.1 2.5 33.7 0.56 7.7 0.1 1.8 0.5

grun d01 8.6 11.8 3.2 37.6 0.45 12.4 3.9 45.1 0.48 15.5 7 81.4 0.49 8.8 0.2 2.9 0.42d02 8.6 15.1 6.6 76.9 0.29 15.8 7.2 84.2 0.4 17.2 8.6 100.6 0.38 11.9 3.3 39.1 0.44d03 8.6 15 6.5 75.6 0.26 15.6 7.1 82.7 0.38 17.6 9 105.6 0.33 10.8 2.2 26 0.35

mueg d01 8.3 13.3 5 60.6 0.41 14.6 6.3 75.5 0.35 16.8 8.5 102.1 0.47 11.5 3.2 38.3 0.37d02 8.3 13.6 5.3 63.9 0.4 15.1 6.8 81.3 0.36 15.7 7.4 88.6 0.46 12.4 4.1 49.3 0.33d03 8.3 12.8 4.5 53.7 0.45 13.7 5.4 65 0.38 14.5 6.2 74.2 0.49 11.3 3 36.1 0.37

schw d01 10.8 20.1 9.4 86.9 0.39 21.6 10.8 100.3 0.32 24.6 13.8 128.3 0.46 18.9 8.2 75.7 0.28d02 10.8 13.4 2.7 24.7 0.35 14.4 3.6 33.2 0.34 15.3 4.5 42.2 0.45 9.9 -0.9 -8.3 0.19d03 10.8 13.3 2.5 23.5 0.36 14.6 3.8 35.5 0.36 15.2 4.4 40.6 0.44 10.7 0 -0.4 0.16

blan d01 9.5 10.3 0.8 8.7 0.24 10.1 0.7 7.2 0.2 10.3 0.8 8.6 0.23 9.1 -0.3 -3.5 0.16d02 9.5 12.2 2.7 28.5 0.19 13 3.5 37.1 0.17 13.9 4.5 47.3 0.27 9.9 0.4 4.4 0.15d03 9.5 10.7 1.3 13.5 0.23 11.2 1.7 18 0.16 11.9 2.5 25.9 0.26 8.7 -0.8 -8.1 0.14

buch d01 8.4 18.6 10.2 121.6 0.59 20.3 11.9 141.4 0.52 23.6 15.2 180.9 0.55 17 8.6 102.3 0.52d02 8.4 10.4 2 24.1 0.67 11.7 3.2 38.5 0.63 12.1 3.7 44.2 0.63 9 0.5 6.5 0.64d03 8.4 9.8 1.4 16.3 0.67 11.5 3.1 37.2 0.59 11.5 3.1 37.1 0.62 8.5 0.1 0.9 0.63

glie d01 6.9 11.7 4.8 69.8 0.39 12.4 5.5 79.2 0.46 15.4 8.5 123.6 0.34 8.8 1.9 27.1 0.41d02 6.9 14.2 7.3 105.7 0.48 14.2 7.3 106.3 0.53 16.4 9.5 137.3 0.42 8.2 1.3 19.1 0.55d03 6.9 12.6 5.7 82.2 0.45 12.7 5.8 84.4 0.5 14.6 7.7 112.1 0.41 8.1 1.2 16.9 0.57

amst d01 22.6 18.6 -3.9 -17.4 0.68 20.3 -2.3 -10 0.59 23.6 1.1 4.7 0.66 17 -5.5 -24.6 0.6d02 22.6 22.2 -0.4 -1.8 0.64 24.4 1.8 8 0.57 25.7 3.1 13.7 0.64 23.2 0.7 3 0.55d03 22.6 21.2 -1.4 -6.3 0.64 23.9 1.3 5.8 0.58 25.5 3 13.1 0.62 25 2.4 10.7 0.57

belz d01 20 20.1 0.2 0.9 0.5 21.6 1.6 8.1 0.41 24.6 4.6 23.2 0.5 18.9 -1 -5.2 0.47d02 20 20.5 0.6 2.8 0.46 22.1 2.1 10.7 0.38 23.2 3.2 16.1 0.47 18.8 -1.2 -6.1 0.33d03 20 19.3 -0.6 -3.1 0.47 20.9 1 4.8 0.45 22.6 2.6 13.1 0.5 18.2 -1.8 -9 0.33

brue d01 23.5 20.1 -3.3 -14.2 0.49 21.6 -1.9 -8 0.37 24.6 1.1 4.8 0.47 18.9 -4.5 -19.3 0.44d02 23.5 23.9 0.4 1.6 0.59 26 2.5 10.9 0.5 25.4 1.9 8.1 0.57 26.5 3 12.9 0.51d03 23.5 22.2 -1.3 -5.5 0.6 24.6 1.1 4.8 0.55 25.1 1.6 6.7 0.59 43.4 19.9 84.9 0.52

nans d01 21.7 20.1 -1.6 -7.3 0.49 21.6 -0.1 -0.7 0.44 24.6 2.9 13.2 0.53 18.9 -2.8 -12.9 0.5d02 21.7 23.9 2.1 9.7 0.57 26 4.3 19.7 0.54 25.4 3.6 16.8 0.62 26.5 4.8 21.9 0.53d03 21.7 21.1 -0.6 -2.8 0.54 23.4 1.7 7.8 0.52 24 2.2 10.3 0.61 21 -0.8 -3.6 0.42

pots d01 13.2 11.7 -1.5 -11.2 0.44 12.4 -0.8 -6.3 0.33 15.4 2.2 17 0.35 8.8 -4.4 -33.5 0.31d02 13.2 9.5 -3.7 -27.8 0.41 9.6 -3.5 -26.9 0.29 10.8 -2.4 -18.3 0.36 8.1 -5 -38.2 0.32d03 13.2 8.7 -4.5 -34.4 0.4 8.9 -4.3 -32.7 0.29 9.6 -3.6 -27.2 0.34 7.5 -5.7 -43.5 0.33

11

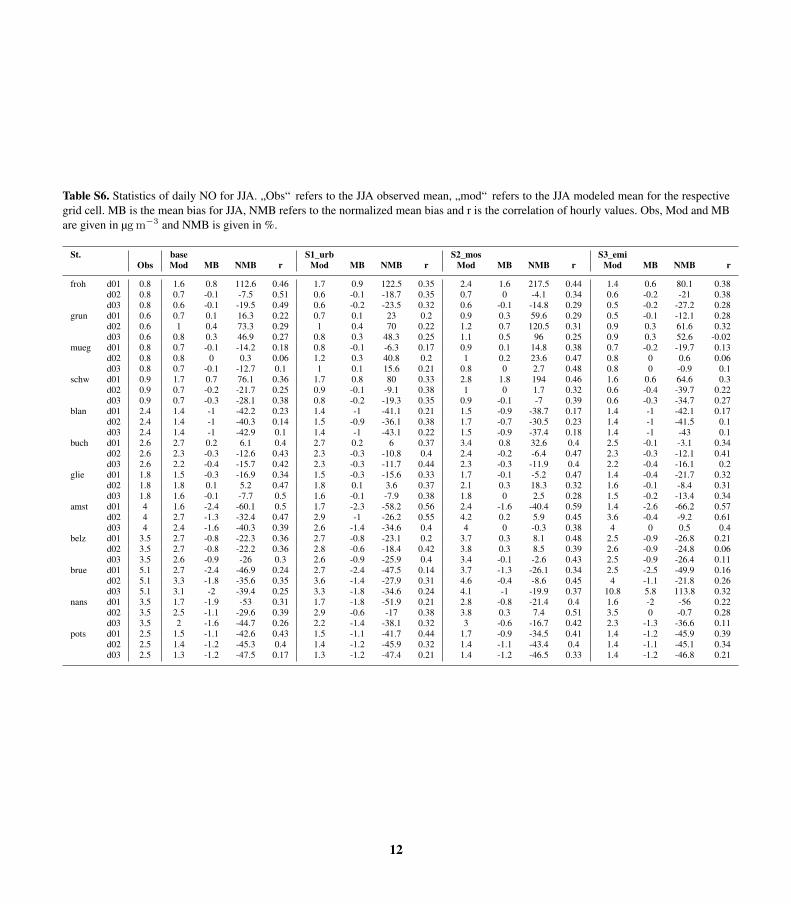
Table S6. Statistics of daily NO for JJA. „Obs“ refers to the JJA observed mean, „mod“ refers to the JJA modeled mean for the respectivegrid cell. MB is the mean bias for JJA, NMB refers to the normalized mean bias and r is the correlation of hourly values. Obs, Mod and MBare given in µgm−3 and NMB is given in %.

St. base S1_urb S2_mos S3_emiObs Mod MB NMB r Mod MB NMB r Mod MB NMB r Mod MB NMB r

froh d01 0.8 1.6 0.8 112.6 0.46 1.7 0.9 122.5 0.35 2.4 1.6 217.5 0.44 1.4 0.6 80.1 0.38d02 0.8 0.7 -0.1 -7.5 0.51 0.6 -0.1 -18.7 0.35 0.7 0 -4.1 0.34 0.6 -0.2 -21 0.38d03 0.8 0.6 -0.1 -19.5 0.49 0.6 -0.2 -23.5 0.32 0.6 -0.1 -14.8 0.29 0.5 -0.2 -27.2 0.28

grun d01 0.6 0.7 0.1 16.3 0.22 0.7 0.1 23 0.2 0.9 0.3 59.6 0.29 0.5 -0.1 -12.1 0.28d02 0.6 1 0.4 73.3 0.29 1 0.4 70 0.22 1.2 0.7 120.5 0.31 0.9 0.3 61.6 0.32d03 0.6 0.8 0.3 46.9 0.27 0.8 0.3 48.3 0.25 1.1 0.5 96 0.25 0.9 0.3 52.6 -0.02

mueg d01 0.8 0.7 -0.1 -14.2 0.18 0.8 -0.1 -6.3 0.17 0.9 0.1 14.8 0.38 0.7 -0.2 -19.7 0.13d02 0.8 0.8 0 0.3 0.06 1.2 0.3 40.8 0.2 1 0.2 23.6 0.47 0.8 0 0.6 0.06d03 0.8 0.7 -0.1 -12.7 0.1 1 0.1 15.6 0.21 0.8 0 2.7 0.48 0.8 0 -0.9 0.1

schw d01 0.9 1.7 0.7 76.1 0.36 1.7 0.8 80 0.33 2.8 1.8 194 0.46 1.6 0.6 64.6 0.3d02 0.9 0.7 -0.2 -21.7 0.25 0.9 -0.1 -9.1 0.38 1 0 1.7 0.32 0.6 -0.4 -39.7 0.22d03 0.9 0.7 -0.3 -28.1 0.38 0.8 -0.2 -19.3 0.35 0.9 -0.1 -7 0.39 0.6 -0.3 -34.7 0.27

blan d01 2.4 1.4 -1 -42.2 0.23 1.4 -1 -41.1 0.21 1.5 -0.9 -38.7 0.17 1.4 -1 -42.1 0.17d02 2.4 1.4 -1 -40.3 0.14 1.5 -0.9 -36.1 0.38 1.7 -0.7 -30.5 0.23 1.4 -1 -41.5 0.1d03 2.4 1.4 -1 -42.9 0.1 1.4 -1 -43.1 0.22 1.5 -0.9 -37.4 0.18 1.4 -1 -43 0.1

buch d01 2.6 2.7 0.2 6.1 0.4 2.7 0.2 6 0.37 3.4 0.8 32.6 0.4 2.5 -0.1 -3.1 0.34d02 2.6 2.3 -0.3 -12.6 0.43 2.3 -0.3 -10.8 0.4 2.4 -0.2 -6.4 0.47 2.3 -0.3 -12.1 0.41d03 2.6 2.2 -0.4 -15.7 0.42 2.3 -0.3 -11.7 0.44 2.3 -0.3 -11.9 0.4 2.2 -0.4 -16.1 0.2

glie d01 1.8 1.5 -0.3 -16.9 0.34 1.5 -0.3 -15.6 0.33 1.7 -0.1 -5.2 0.47 1.4 -0.4 -21.7 0.32d02 1.8 1.8 0.1 5.2 0.47 1.8 0.1 3.6 0.37 2.1 0.3 18.3 0.32 1.6 -0.1 -8.4 0.31d03 1.8 1.6 -0.1 -7.7 0.5 1.6 -0.1 -7.9 0.38 1.8 0 2.5 0.28 1.5 -0.2 -13.4 0.34

amst d01 4 1.6 -2.4 -60.1 0.5 1.7 -2.3 -58.2 0.56 2.4 -1.6 -40.4 0.59 1.4 -2.6 -66.2 0.57d02 4 2.7 -1.3 -32.4 0.47 2.9 -1 -26.2 0.55 4.2 0.2 5.9 0.45 3.6 -0.4 -9.2 0.61d03 4 2.4 -1.6 -40.3 0.39 2.6 -1.4 -34.6 0.4 4 0 -0.3 0.38 4 0 0.5 0.4

belz d01 3.5 2.7 -0.8 -22.3 0.36 2.7 -0.8 -23.1 0.2 3.7 0.3 8.1 0.48 2.5 -0.9 -26.8 0.21d02 3.5 2.7 -0.8 -22.2 0.36 2.8 -0.6 -18.4 0.42 3.8 0.3 8.5 0.39 2.6 -0.9 -24.8 0.06d03 3.5 2.6 -0.9 -26 0.3 2.6 -0.9 -25.9 0.4 3.4 -0.1 -2.6 0.43 2.5 -0.9 -26.4 0.11

brue d01 5.1 2.7 -2.4 -46.9 0.24 2.7 -2.4 -47.5 0.14 3.7 -1.3 -26.1 0.34 2.5 -2.5 -49.9 0.16d02 5.1 3.3 -1.8 -35.6 0.35 3.6 -1.4 -27.9 0.31 4.6 -0.4 -8.6 0.45 4 -1.1 -21.8 0.26d03 5.1 3.1 -2 -39.4 0.25 3.3 -1.8 -34.6 0.24 4.1 -1 -19.9 0.37 10.8 5.8 113.8 0.32

nans d01 3.5 1.7 -1.9 -53 0.31 1.7 -1.8 -51.9 0.21 2.8 -0.8 -21.4 0.4 1.6 -2 -56 0.22d02 3.5 2.5 -1.1 -29.6 0.39 2.9 -0.6 -17 0.38 3.8 0.3 7.4 0.51 3.5 0 -0.7 0.28d03 3.5 2 -1.6 -44.7 0.26 2.2 -1.4 -38.1 0.32 3 -0.6 -16.7 0.42 2.3 -1.3 -36.6 0.11

pots d01 2.5 1.5 -1.1 -42.6 0.43 1.5 -1.1 -41.7 0.44 1.7 -0.9 -34.5 0.41 1.4 -1.2 -45.9 0.39d02 2.5 1.4 -1.2 -45.3 0.4 1.4 -1.2 -45.9 0.32 1.4 -1.1 -43.4 0.4 1.4 -1.1 -45.1 0.34d03 2.5 1.3 -1.2 -47.5 0.17 1.3 -1.2 -47.4 0.21 1.4 -1.2 -46.5 0.33 1.4 -1.2 -46.8 0.21

12

Table S7. Statistics of daily O3 for JJA. „Obs“ refers to the JJA observed mean, „mod“ refers to the JJA modeled mean for the respectivegrid cell. MB is the mean bias for JJA, NMB refers to the normalized mean bias and r is the correlation of hourly values. Obs, Mod and MBare given in µgm−3 and NMB is given in %.

St. base S1_urb S2_mos S3_emiObs Mod MB NMB r Mod MB NMB r Mod MB NMB r Mod MB NMB r

froh d01 59 54.9 -4 -6.8 0.42 53.6 -5.4 -9.1 0.44 53.6 -5.3 -9 0.42 55.4 -3.5 -6 0.42d02 59 61.2 2.3 3.9 0.36 61 2 3.4 0.35 62.2 3.2 5.4 0.39 62.1 3.1 5.3 0.41d03 59 62.7 3.8 6.4 0.25 62.2 3.2 5.5 0.29 63.6 4.6 7.9 0.34 63.5 4.6 7.7 0.29

grun d01 55.4 58.7 3.3 5.9 0.38 58.1 2.7 4.9 0.38 57.6 2.2 4 0.37 60.3 4.8 8.7 0.37d02 55.4 58.1 2.6 4.8 0.37 57.6 2.2 4 0.37 58.5 3.1 5.6 0.34 60 4.6 8.2 0.28d03 55.4 60.2 4.8 8.7 0.34 59.6 4.2 7.6 0.33 59.9 4.5 8.1 0.26 62.7 7.3 13.2 0.24

mueg d01 69.2 58.6 -10.5 -15.2 0.53 57.5 -11.7 -16.9 0.56 57.7 -11.4 -16.5 0.59 59.2 -10 -14.4 0.52d02 69.2 60.1 -9 -13 0.5 58.9 -10.3 -14.9 0.57 60.2 -9 -13 0.5 60.3 -8.8 -12.8 0.49d03 69.2 62.7 -6.4 -9.3 0.45 61.6 -7.5 -10.9 0.5 62.6 -6.5 -9.4 0.44 63 -6.1 -8.8 0.47

schw d01 65 54.5 -10.5 -16.1 0.5 53.2 -11.8 -18.2 0.52 53.7 -11.3 -17.3 0.48 54.7 -10.3 -15.9 0.48d02 65 58.9 -6.1 -9.4 0.53 58.2 -6.8 -10.4 0.59 59 -6 -9.2 0.53 60.8 -4.2 -6.4 0.51d03 65 61.9 -3.1 -4.8 0.46 60.8 -4.2 -6.5 0.53 62.1 -2.9 -4.5 0.42 63.1 -1.9 -2.9 0.46

blan d01 61.9 57.4 -4.6 -7.4 0.56 57.4 -4.5 -7.3 0.61 58.4 -3.5 -5.7 0.57 57.6 -4.3 -7 0.54d02 61.9 59.4 -2.5 -4.1 0.55 58.6 -3.3 -5.3 0.62 59.2 -2.7 -4.3 0.53 60.4 -1.5 -2.4 0.52d03 61.9 62.5 0.6 1 0.52 62 0 0.1 0.58 62.5 0.6 1 0.47 63.4 1.5 2.3 0.49

buch d01 64.1 54.9 -9.2 -14.3 0.52 53.6 -10.5 -16.4 0.53 53.6 -10.5 -16.3 0.51 55.4 -8.7 -13.6 0.53d02 64.1 60.8 -3.3 -5.2 0.52 60 -4.1 -6.4 0.53 61.2 -2.9 -4.5 0.55 61.4 -2.7 -4.3 0.54d03 64.1 63.1 -1 -1.6 0.45 62 -2.1 -3.3 0.47 63.3 -0.9 -1.3 0.52 63.6 -0.5 -0.8 0.49

glie d01 60.9 58.6 -2.3 -3.8 0.53 58 -2.9 -4.7 0.52 57.5 -3.4 -5.5 0.49 60.1 -0.7 -1.2 0.52d02 60.9 57.2 -3.6 -6 0.54 57.3 -3.5 -5.8 0.5 57.4 -3.5 -5.7 0.43 60.8 -0.1 -0.1 0.54d03 60.9 60.6 -0.3 -0.4 0.48 60.4 -0.4 -0.7 0.48 60.5 -0.4 -0.7 0.38 63.1 2.2 3.6 0.49

amst d01 61.7 54.9 -6.8 -11 0.52 53.6 -8.1 -13.2 0.55 53.6 -8.1 -13.1 0.52 55.4 -6.3 -10.2 0.55d02 61.7 54.7 -6.9 -11.3 0.48 53.1 -8.6 -14 0.44 55.4 -6.3 -10.3 0.42 54 -7.7 -12.5 0.46d03 61.7 57.6 -4.1 -6.6 0.43 55.5 -6.2 -10.1 0.43 57 -4.7 -7.5 0.38 55 -6.7 -10.8 0.43

nans d01 61.1 54.5 -6.5 -10.7 0.55 53.2 -7.9 -12.9 0.57 53.7 -7.3 -12 0.51 54.7 -6.4 -10.5 0.54d02 61.1 54 -7.1 -11.6 0.53 52.5 -8.6 -14.1 0.52 55.9 -5.2 -8.4 0.46 52.1 -8.9 -14.6 0.46d03 61.1 58 -3.1 -5.1 0.45 56.1 -5 -8.2 0.47 58.1 -3 -4.9 0.39 57.6 -3.5 -5.7 0.41

pots d01 64.1 58.6 -5.6 -8.7 0.51 58 -6.1 -9.6 0.52 57.5 -6.6 -10.3 0.45 60.1 -4 -6.2 0.52d02 64.1 61.3 -2.8 -4.4 0.5 61.3 -2.9 -4.5 0.48 62.1 -2.1 -3.2 0.46 62.2 -1.9 -3 0.5d03 64.1 64.1 0 0 0.46 63.8 -0.4 -0.6 0.45 64.8 0.7 1 0.38 64.6 0.5 0.8 0.45

13

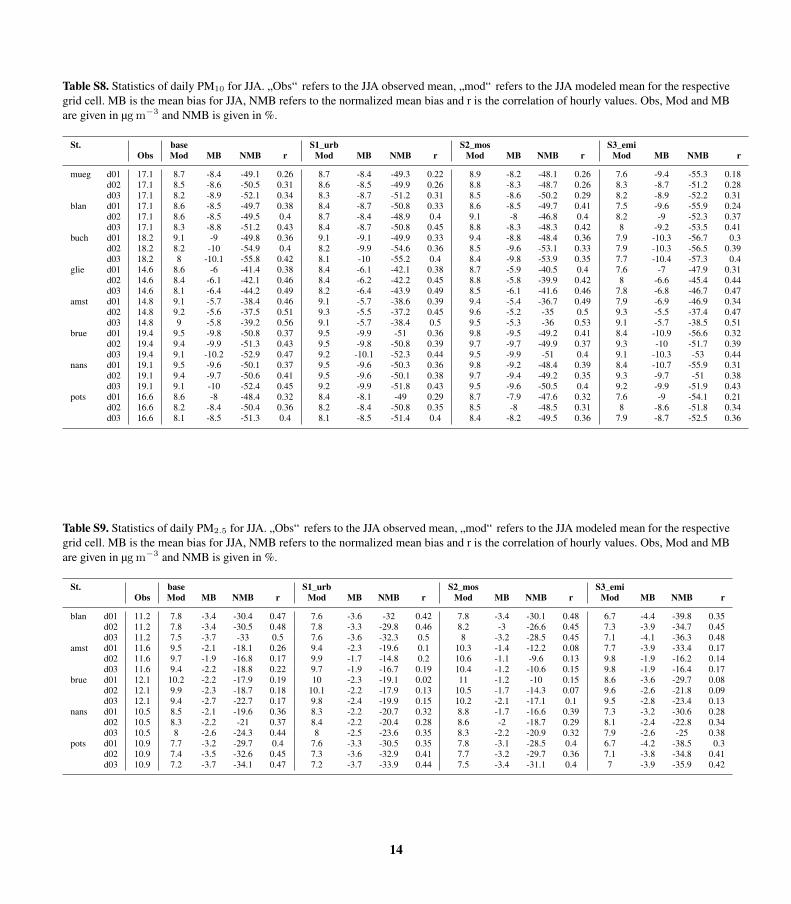
Table S8. Statistics of daily PM10 for JJA. „Obs“ refers to the JJA observed mean, „mod“ refers to the JJA modeled mean for the respectivegrid cell. MB is the mean bias for JJA, NMB refers to the normalized mean bias and r is the correlation of hourly values. Obs, Mod and MBare given in µgm−3 and NMB is given in %.

St. base S1_urb S2_mos S3_emiObs Mod MB NMB r Mod MB NMB r Mod MB NMB r Mod MB NMB r

mueg d01 17.1 8.7 -8.4 -49.1 0.26 8.7 -8.4 -49.3 0.22 8.9 -8.2 -48.1 0.26 7.6 -9.4 -55.3 0.18d02 17.1 8.5 -8.6 -50.5 0.31 8.6 -8.5 -49.9 0.26 8.8 -8.3 -48.7 0.26 8.3 -8.7 -51.2 0.28d03 17.1 8.2 -8.9 -52.1 0.34 8.3 -8.7 -51.2 0.31 8.5 -8.6 -50.2 0.29 8.2 -8.9 -52.2 0.31

blan d01 17.1 8.6 -8.5 -49.7 0.38 8.4 -8.7 -50.8 0.33 8.6 -8.5 -49.7 0.41 7.5 -9.6 -55.9 0.24d02 17.1 8.6 -8.5 -49.5 0.4 8.7 -8.4 -48.9 0.4 9.1 -8 -46.8 0.4 8.2 -9 -52.3 0.37d03 17.1 8.3 -8.8 -51.2 0.43 8.4 -8.7 -50.8 0.45 8.8 -8.3 -48.3 0.42 8 -9.2 -53.5 0.41

buch d01 18.2 9.1 -9 -49.8 0.36 9.1 -9.1 -49.9 0.33 9.4 -8.8 -48.4 0.36 7.9 -10.3 -56.7 0.3d02 18.2 8.2 -10 -54.9 0.4 8.2 -9.9 -54.6 0.36 8.5 -9.6 -53.1 0.33 7.9 -10.3 -56.5 0.39d03 18.2 8 -10.1 -55.8 0.42 8.1 -10 -55.2 0.4 8.4 -9.8 -53.9 0.35 7.7 -10.4 -57.3 0.4

glie d01 14.6 8.6 -6 -41.4 0.38 8.4 -6.1 -42.1 0.38 8.7 -5.9 -40.5 0.4 7.6 -7 -47.9 0.31d02 14.6 8.4 -6.1 -42.1 0.46 8.4 -6.2 -42.2 0.45 8.8 -5.8 -39.9 0.42 8 -6.6 -45.4 0.44d03 14.6 8.1 -6.4 -44.2 0.49 8.2 -6.4 -43.9 0.49 8.5 -6.1 -41.6 0.46 7.8 -6.8 -46.7 0.47

amst d01 14.8 9.1 -5.7 -38.4 0.46 9.1 -5.7 -38.6 0.39 9.4 -5.4 -36.7 0.49 7.9 -6.9 -46.9 0.34d02 14.8 9.2 -5.6 -37.5 0.51 9.3 -5.5 -37.2 0.45 9.6 -5.2 -35 0.5 9.3 -5.5 -37.4 0.47d03 14.8 9 -5.8 -39.2 0.56 9.1 -5.7 -38.4 0.5 9.5 -5.3 -36 0.53 9.1 -5.7 -38.5 0.51

brue d01 19.4 9.5 -9.8 -50.8 0.37 9.5 -9.9 -51 0.36 9.8 -9.5 -49.2 0.41 8.4 -10.9 -56.6 0.32d02 19.4 9.4 -9.9 -51.3 0.43 9.5 -9.8 -50.8 0.39 9.7 -9.7 -49.9 0.37 9.3 -10 -51.7 0.39d03 19.4 9.1 -10.2 -52.9 0.47 9.2 -10.1 -52.3 0.44 9.5 -9.9 -51 0.4 9.1 -10.3 -53 0.44

nans d01 19.1 9.5 -9.6 -50.1 0.37 9.5 -9.6 -50.3 0.36 9.8 -9.2 -48.4 0.39 8.4 -10.7 -55.9 0.31d02 19.1 9.4 -9.7 -50.6 0.41 9.5 -9.6 -50.1 0.38 9.7 -9.4 -49.2 0.35 9.3 -9.7 -51 0.38d03 19.1 9.1 -10 -52.4 0.45 9.2 -9.9 -51.8 0.43 9.5 -9.6 -50.5 0.4 9.2 -9.9 -51.9 0.43

pots d01 16.6 8.6 -8 -48.4 0.32 8.4 -8.1 -49 0.29 8.7 -7.9 -47.6 0.32 7.6 -9 -54.1 0.21d02 16.6 8.2 -8.4 -50.4 0.36 8.2 -8.4 -50.8 0.35 8.5 -8 -48.5 0.31 8 -8.6 -51.8 0.34d03 16.6 8.1 -8.5 -51.3 0.4 8.1 -8.5 -51.4 0.4 8.4 -8.2 -49.5 0.36 7.9 -8.7 -52.5 0.36

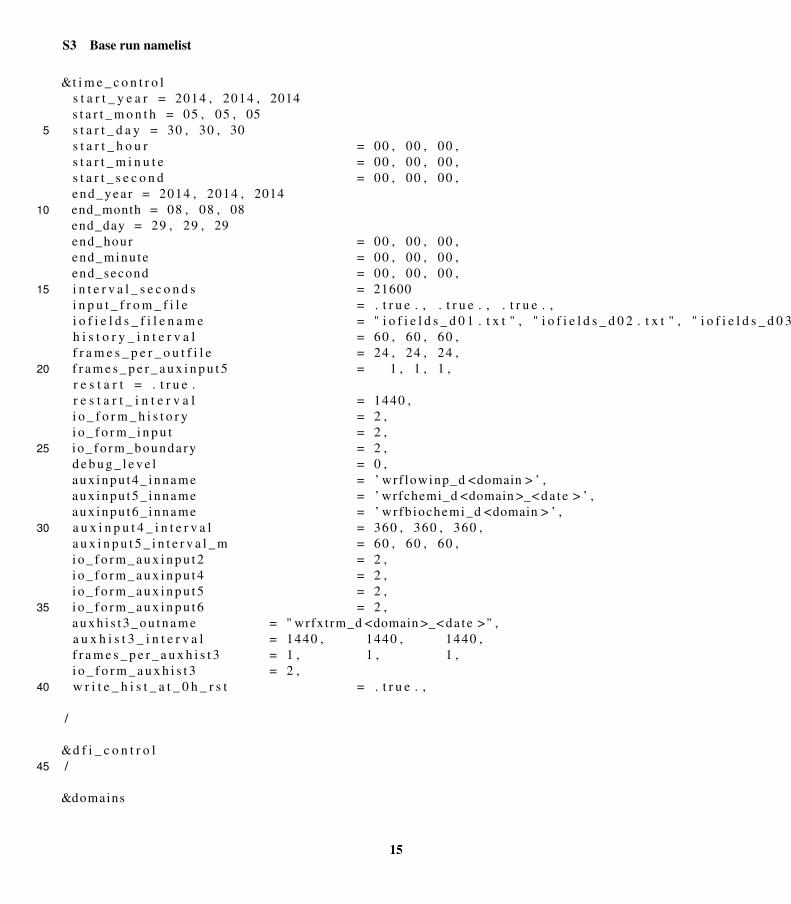
Table S9. Statistics of daily PM2.5 for JJA. „Obs“ refers to the JJA observed mean, „mod“ refers to the JJA modeled mean for the respectivegrid cell. MB is the mean bias for JJA, NMB refers to the normalized mean bias and r is the correlation of hourly values. Obs, Mod and MBare given in µgm−3 and NMB is given in %.

St. base S1_urb S2_mos S3_emiObs Mod MB NMB r Mod MB NMB r Mod MB NMB r Mod MB NMB r

blan d01 11.2 7.8 -3.4 -30.4 0.47 7.6 -3.6 -32 0.42 7.8 -3.4 -30.1 0.48 6.7 -4.4 -39.8 0.35d02 11.2 7.8 -3.4 -30.5 0.48 7.8 -3.3 -29.8 0.46 8.2 -3 -26.6 0.45 7.3 -3.9 -34.7 0.45d03 11.2 7.5 -3.7 -33 0.5 7.6 -3.6 -32.3 0.5 8 -3.2 -28.5 0.45 7.1 -4.1 -36.3 0.48

amst d01 11.6 9.5 -2.1 -18.1 0.26 9.4 -2.3 -19.6 0.1 10.3 -1.4 -12.2 0.08 7.7 -3.9 -33.4 0.17d02 11.6 9.7 -1.9 -16.8 0.17 9.9 -1.7 -14.8 0.2 10.6 -1.1 -9.6 0.13 9.8 -1.9 -16.2 0.14d03 11.6 9.4 -2.2 -18.8 0.22 9.7 -1.9 -16.7 0.19 10.4 -1.2 -10.6 0.15 9.8 -1.9 -16.4 0.17

brue d01 12.1 10.2 -2.2 -17.9 0.19 10 -2.3 -19.1 0.02 11 -1.2 -10 0.15 8.6 -3.6 -29.7 0.08d02 12.1 9.9 -2.3 -18.7 0.18 10.1 -2.2 -17.9 0.13 10.5 -1.7 -14.3 0.07 9.6 -2.6 -21.8 0.09d03 12.1 9.4 -2.7 -22.7 0.17 9.8 -2.4 -19.9 0.15 10.2 -2.1 -17.1 0.1 9.5 -2.8 -23.4 0.13

nans d01 10.5 8.5 -2.1 -19.6 0.36 8.3 -2.2 -20.7 0.32 8.8 -1.7 -16.6 0.39 7.3 -3.2 -30.6 0.28d02 10.5 8.3 -2.2 -21 0.37 8.4 -2.2 -20.4 0.28 8.6 -2 -18.7 0.29 8.1 -2.4 -22.8 0.34d03 10.5 8 -2.6 -24.3 0.44 8 -2.5 -23.6 0.35 8.3 -2.2 -20.9 0.32 7.9 -2.6 -25 0.38

pots d01 10.9 7.7 -3.2 -29.7 0.4 7.6 -3.3 -30.5 0.35 7.8 -3.1 -28.5 0.4 6.7 -4.2 -38.5 0.3d02 10.9 7.4 -3.5 -32.6 0.45 7.3 -3.6 -32.9 0.41 7.7 -3.2 -29.7 0.36 7.1 -3.8 -34.8 0.41d03 10.9 7.2 -3.7 -34.1 0.47 7.2 -3.7 -33.9 0.44 7.5 -3.4 -31.1 0.4 7 -3.9 -35.9 0.42

14

S3 Base run namelist

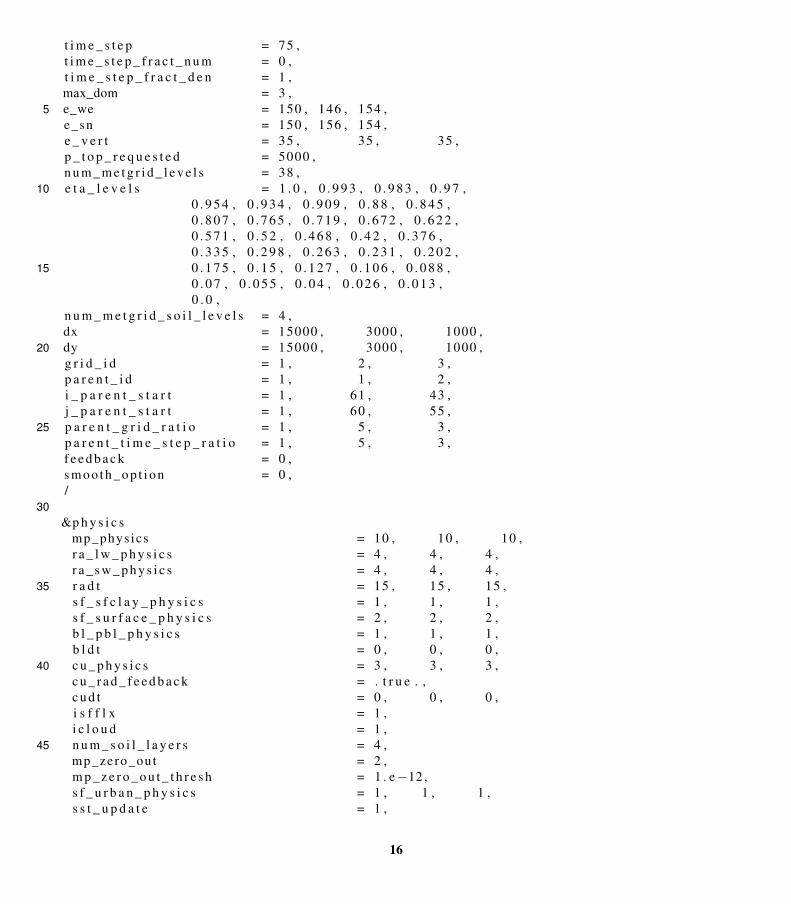
&t i m e _ c o n t r o ls t a r t _ y e a r = 2014 , 2014 , 2014s t a r t _ m o n t h = 05 , 05 , 05s t a r t _ d a y = 30 , 30 , 305s t a r t _ h o u r = 00 , 00 , 00 ,s t a r t _ m i n u t e = 00 , 00 , 00 ,s t a r t _ s e c o n d = 00 , 00 , 00 ,e n d _ y e a r = 2014 , 2014 , 2014end_month = 08 , 08 , 0810end_day = 29 , 29 , 29end_hour = 00 , 00 , 00 ,end_minu te = 00 , 00 , 00 ,end_second = 00 , 00 , 00 ,i n t e r v a l _ s e c o n d s = 2160015i n p u t _ f r o m _ f i l e = . t r u e . , . t r u e . , . t r u e . ,i o f i e l d s _ f i l e n a m e = " i o f i e l d s _ d 0 1 . t x t " , " i o f i e l d s _ d 0 2 . t x t " , " i o f i e l d s _ d 0 3 . t x t " ,h i s t o r y _ i n t e r v a l = 60 , 60 , 60 ,f r a m e s _ p e r _ o u t f i l e = 24 , 24 , 24 ,f r a m e s _ p e r _ a u x i n p u t 5 = 1 , 1 , 1 ,20r e s t a r t = . t r u e .r e s t a r t _ i n t e r v a l = 1440 ,i o _ f o r m _ h i s t o r y = 2 ,i o _ f o r m _ i n p u t = 2 ,i o_ fo rm_bounda ry = 2 ,25d e b u g _ l e v e l = 0 ,a u x i n p u t 4 _ i n n a m e = ’ wrf lowinp_d <domain > ’ ,a u x i n p u t 5 _ i n n a m e = ’ wrfchemi_d <domain >_< da te > ’ ,a u x i n p u t 6 _ i n n a m e = ’ wrfb iochemi_d <domain > ’ ,a u x i n p u t 4 _ i n t e r v a l = 360 , 360 , 360 ,30a u x i n p u t 5 _ i n t e r v a l _ m = 60 , 60 , 60 ,i o _ f o r m _ a u x i n p u t 2 = 2 ,i o _ f o r m _ a u x i n p u t 4 = 2 ,i o _ f o r m _ a u x i n p u t 5 = 2 ,i o _ f o r m _ a u x i n p u t 6 = 2 ,35a u x h i s t 3 _ o u t n a m e = " wrfxtrm_d <domain >_< da te >" ,a u x h i s t 3 _ i n t e r v a l = 1440 , 1440 , 1440 ,f r a m e s _ p e r _ a u x h i s t 3 = 1 , 1 , 1 ,i o _ f o r m _ a u x h i s t 3 = 2 ,w r i t e _ h i s t _ a t _ 0 h _ r s t = . t r u e . ,40

/

&d f i _ c o n t r o l/45

&domains

15

t i m e _ s t e p = 75 ,t i m e _ s t e p _ f r a c t _ n u m = 0 ,t i m e _ s t e p _ f r a c t _ d e n = 1 ,max_dom = 3 ,e_we = 150 , 146 , 154 ,5e_sn = 150 , 156 , 154 ,e _ v e r t = 35 , 35 , 35 ,p _ t o p _ r e q u e s t e d = 5000 ,n u m _ m e t g r i d _ l e v e l s = 38 ,e t a _ l e v e l s = 1 . 0 , 0 . 9 9 3 , 0 . 9 8 3 , 0 . 9 7 ,10

0 . 9 5 4 , 0 . 9 3 4 , 0 . 9 0 9 , 0 . 8 8 , 0 . 8 4 5 ,0 . 8 0 7 , 0 . 7 6 5 , 0 . 7 1 9 , 0 . 6 7 2 , 0 . 6 2 2 ,0 . 5 7 1 , 0 . 5 2 , 0 . 4 6 8 , 0 . 4 2 , 0 . 3 7 6 ,0 . 3 3 5 , 0 . 2 9 8 , 0 . 2 6 3 , 0 . 2 3 1 , 0 . 2 0 2 ,0 . 1 7 5 , 0 . 1 5 , 0 . 1 2 7 , 0 . 1 0 6 , 0 . 0 8 8 ,150 . 0 7 , 0 . 0 5 5 , 0 . 0 4 , 0 . 0 2 6 , 0 . 0 1 3 ,0 . 0 ,

n u m _ m e t g r i d _ s o i l _ l e v e l s = 4 ,dx = 15000 , 3000 , 1000 ,dy = 15000 , 3000 , 1000 ,20g r i d _ i d = 1 , 2 , 3 ,p a r e n t _ i d = 1 , 1 , 2 ,i _ p a r e n t _ s t a r t = 1 , 61 , 43 ,j _ p a r e n t _ s t a r t = 1 , 60 , 55 ,p a r e n t _ g r i d _ r a t i o = 1 , 5 , 3 ,25p a r e n t _ t i m e _ s t e p _ r a t i o = 1 , 5 , 3 ,f e e d b a c k = 0 ,s m o o t h _ o p t i o n = 0 ,/

30&p h y s i c s

mp_phys ics = 10 , 10 , 10 ,r a _ l w _ p h y s i c s = 4 , 4 , 4 ,r a _ s w _ p h y s i c s = 4 , 4 , 4 ,r a d t = 15 , 15 , 15 ,35s f _ s f c l a y _ p h y s i c s = 1 , 1 , 1 ,s f _ s u r f a c e _ p h y s i c s = 2 , 2 , 2 ,b l _ p b l _ p h y s i c s = 1 , 1 , 1 ,b l d t = 0 , 0 , 0 ,c u _ p h y s i c s = 3 , 3 , 3 ,40c u _ r a d _ f e e d b a c k = . t r u e . ,c u d t = 0 , 0 , 0 ,i s f f l x = 1 ,i c l o u d = 1 ,n u m _ s o i l _ l a y e r s = 4 ,45mp_zero_out = 2 ,m p _ z e r o _ o u t _ t h r e s h = 1 . e−12 ,s f _ u r b a n _ p h y s i c s = 1 , 1 , 1 ,s s t _ u p d a t e = 1 ,

16

s f _ u r b a n _ p h y s i c s = 1 , 1 , 1 ,usemonalb = . t r u e . ,p rogn = 1 , 1 , 1 ,c u _ d i a g = 1 , 1 , 1 ,num_land_ca t = 33 ,5

/

&fdda/

10&dynamicsr k _ o r d = 3 ,w_damping = 0 ,d i f f _ o p t = 1 , 1 , 1 ,km_opt = 4 , 4 , 4 ,15d i f f _ 6 t h _ o p t = 0 , 0 , 0 ,d i f f _ 6 t h _ f a c t o r = 0 . 1 2 , 0 . 1 2 , 0 . 1 2 ,base_ temp = 2 9 0 .damp_opt = 0 ,zdamp = 5 0 0 0 . , 5 0 0 0 . , 5 0 0 0 . ,20dampcoef = 0 . 0 1 , 0 . 0 1 , 0 . 0 1k h d i f = 0 , 0 , 0 ,k v d i f = 0 , 0 , 0 ,n o n _ h y d r o s t a t i c = . t r u e . , . t r u e . , . t r u e . ,m o i s t _ a d v _ o p t = 2 , 2 , 2 ,25s c a l a r _ a d v _ o p t = 2 , 2 , 2 ,chem_adv_opt = 2 , 2 , 2 ,t k e _ a d v _ o p t = 2 , 2 , 2 ,t i m e _ s t e p _ s o u n d = 4 , 4 , 4 ,h_mom_adv_order = 5 , 5 , 5 ,30v_mom_adv_order = 3 , 3 , 3 ,h _ s c a _ a d v _ o r d e r = 5 , 5 , 5 ,v _ s c a _ a d v _ o r d e r = 3 , 3 , 3 ,/

35&b d y _ c o n t r o lspec_bdy_wid th = 5 ,spec_zone = 1 ,r e l a x _ z o n e = 4 ,s p e c i f i e d = . t r u e . , . f a l s e . , . f a l s e . ,40n e s t e d = . f a l s e . , . t r u e . , . t r u e . ,/

&g r i b 2/45

&n a m e l i s t _ q u i l tn i o _ t a s k s _ p e r _ g r o u p = 0 ,n i o _ g r o u p s = 1 ,

17

/

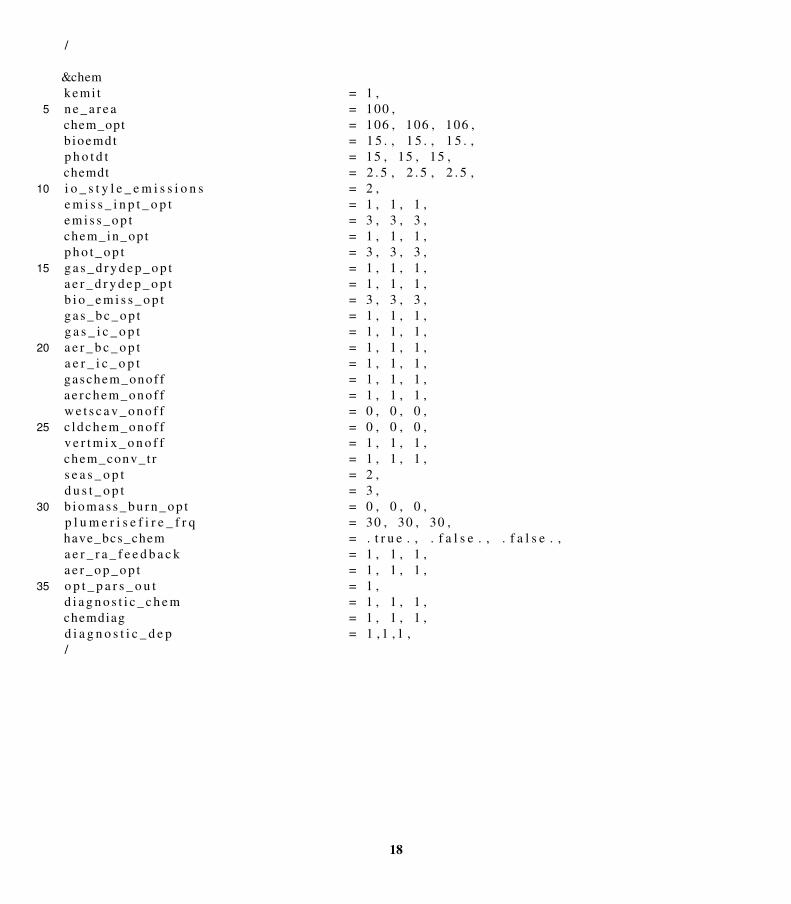
&chemkemi t = 1 ,n e _ a r e a = 100 ,5chem_opt = 106 , 106 , 106 ,b ioemdt = 1 5 . , 1 5 . , 1 5 . ,p h o t d t = 15 , 15 , 15 ,chemdt = 2 . 5 , 2 . 5 , 2 . 5 ,i o _ s t y l e _ e m i s s i o n s = 2 ,10e m i s s _ i n p t _ o p t = 1 , 1 , 1 ,e m i s s _ o p t = 3 , 3 , 3 ,chem_in_opt = 1 , 1 , 1 ,p h o t _ o p t = 3 , 3 , 3 ,g a s _ d r y d e p _ o p t = 1 , 1 , 1 ,15a e r _ d r y d e p _ o p t = 1 , 1 , 1 ,b i o _ e m i s s _ o p t = 3 , 3 , 3 ,g a s _ b c _ o p t = 1 , 1 , 1 ,g a s _ i c _ o p t = 1 , 1 , 1 ,a e r _ b c _ o p t = 1 , 1 , 1 ,20a e r _ i c _ o p t = 1 , 1 , 1 ,gaschem_onof f = 1 , 1 , 1 ,ae r chem_onof f = 1 , 1 , 1 ,w e t s c a v _ o n o f f = 0 , 0 , 0 ,c ldchem_onof f = 0 , 0 , 0 ,25v e r t m i x _ o n o f f = 1 , 1 , 1 ,chem_conv_t r = 1 , 1 , 1 ,s e a s _ o p t = 2 ,d u s t _ o p t = 3 ,b i o m a s s _ b u r n _ o p t = 0 , 0 , 0 ,30p l u m e r i s e f i r e _ f r q = 30 , 30 , 30 ,have_bcs_chem = . t r u e . , . f a l s e . , . f a l s e . ,a e r _ r a _ f e e d b a c k = 1 , 1 , 1 ,a e r _ o p _ o p t = 1 , 1 , 1 ,o p t _ p a r s _ o u t = 1 ,35d i a g n o s t i c _ c h e m = 1 , 1 , 1 ,chemdiag = 1 , 1 , 1 ,d i a g n o s t i c _ d e p = 1 , 1 , 1 ,/

18


Recommended