39
Personal Exposure to Hazardous Air Pollutants in Minneapolis and St. Paul John L. Adgate Division of Environmental and Occupational Health University of Minnesota School of Public Health
Personal Exposure to Hazardous Air Pollutants in
Minneapolis and St. Paul
John L. Adgate
Division of Environmental and Occupational Health
University of Minnesota School of Public Health
Outline
• HAPS: PM2.5 and VOCs• Study design• Communities and Sources• Personal (P), Indoor (I), and Outdoor (O)
VOC results• PIO PM2.5 results• Risks, Summary, & Conclusions
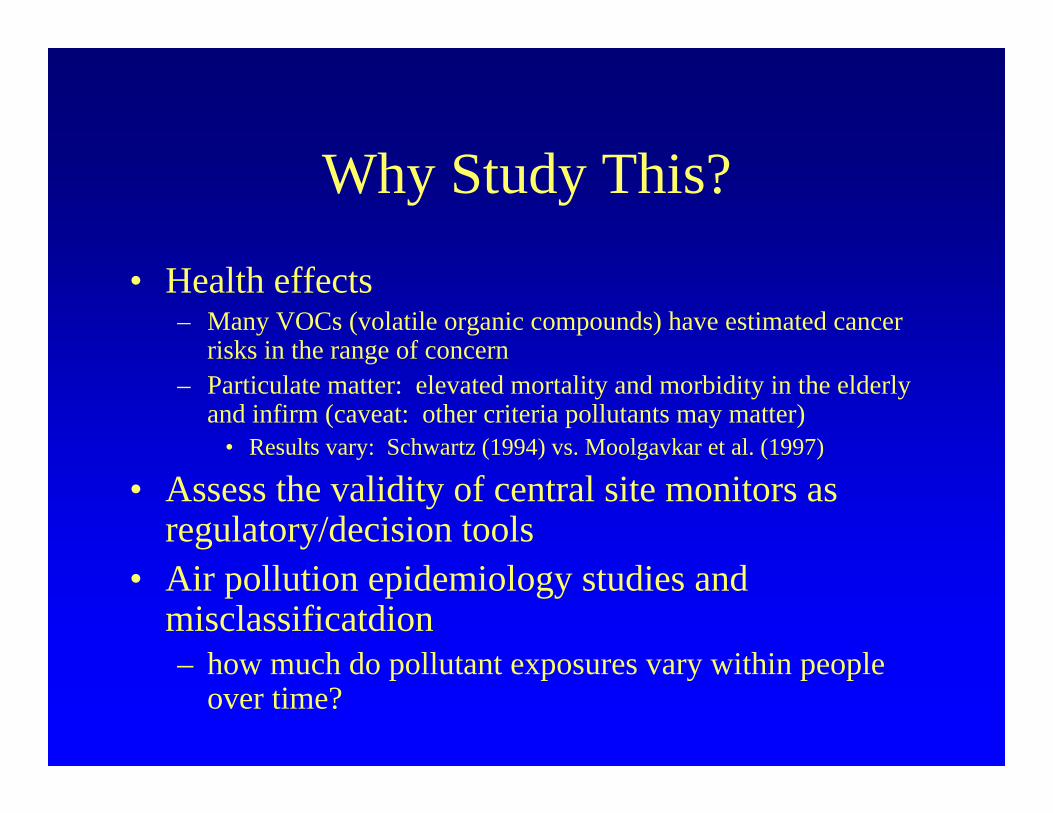
Why Study This?
• Health effects– Many VOCs (volatile organic compounds) have estimated cancer
risks in the range of concern– Particulate matter: elevated mortality and morbidity in the elderly
and infirm (caveat: other criteria pollutants may matter)• Results vary: Schwartz (1994) vs. Moolgavkar et al. (1997)
• Assess the validity of central site monitors as regulatory/decision tools
• Air pollution epidemiology studies and misclassificatdion– how much do pollutant exposures vary within people
over time?
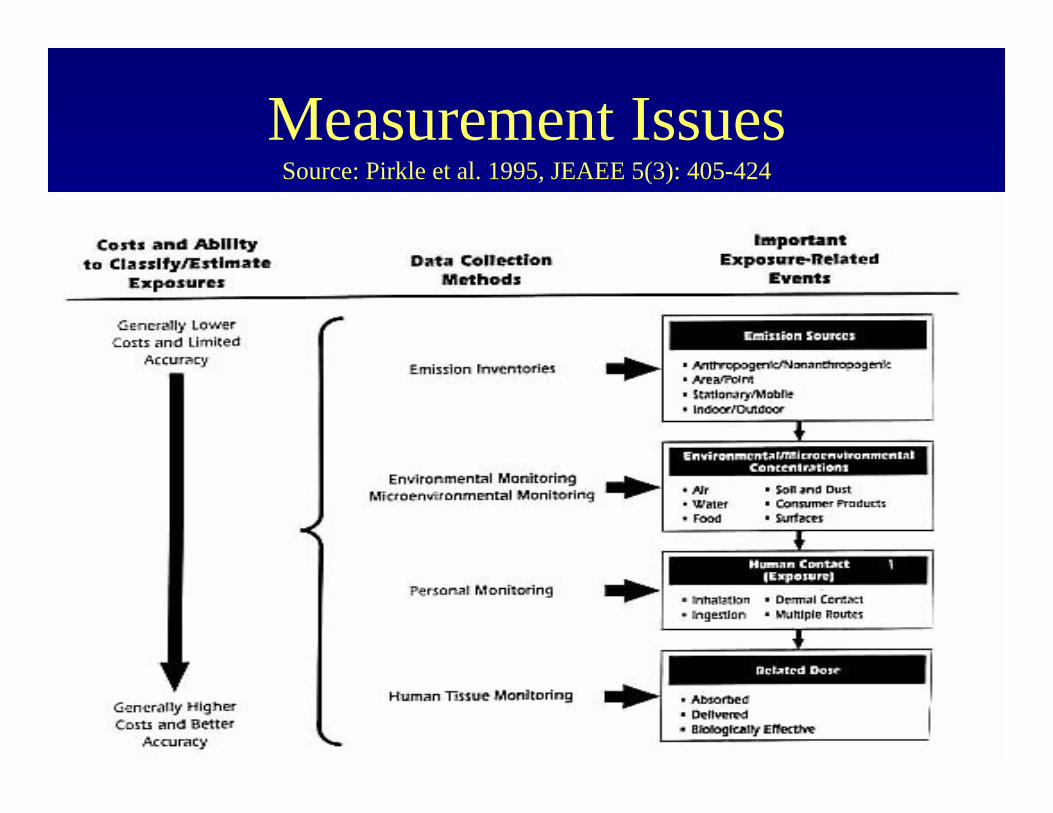
Measurement IssuesSource: Pirkle et al. 1995, JEAEE 5(3): 405-424
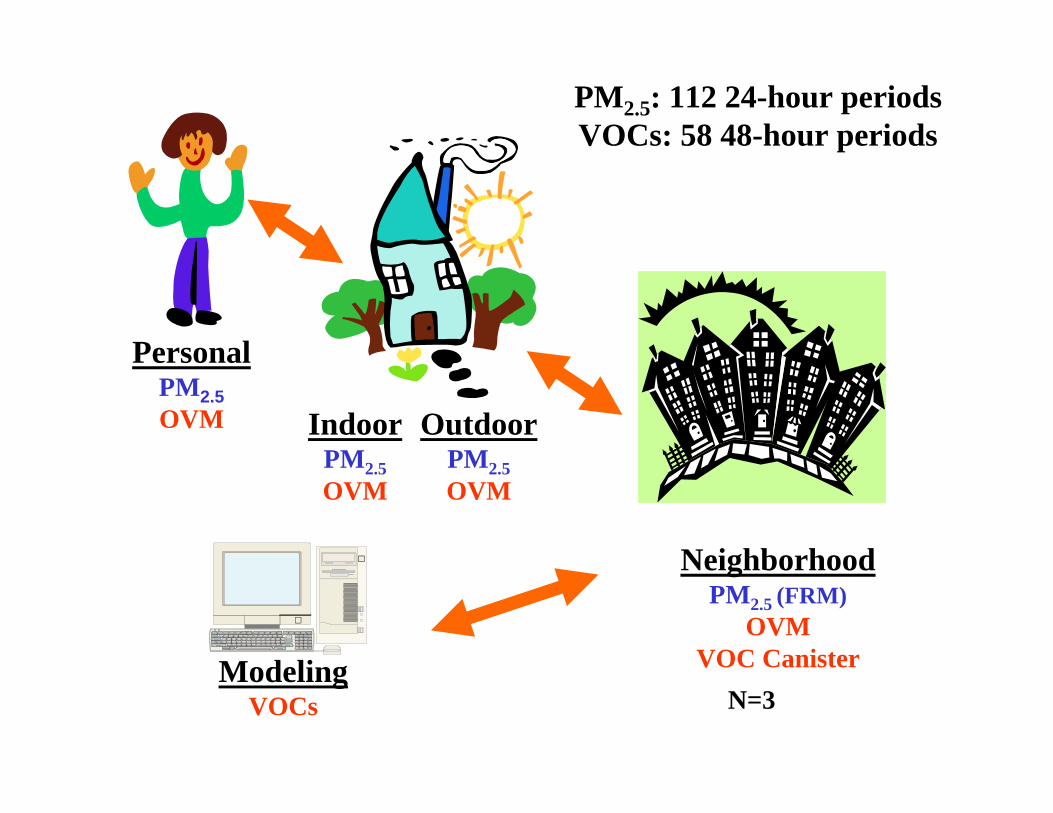
PersonalPM2.5OVM Indoor
PM2.5OVM
OutdoorPM2.5OVM
NeighborhoodPM2.5 (FRM)
OVMVOC CanisterModeling
VOCs N=3
PM2.5: 112 24-hour periodsVOCs: 58 48-hour periods
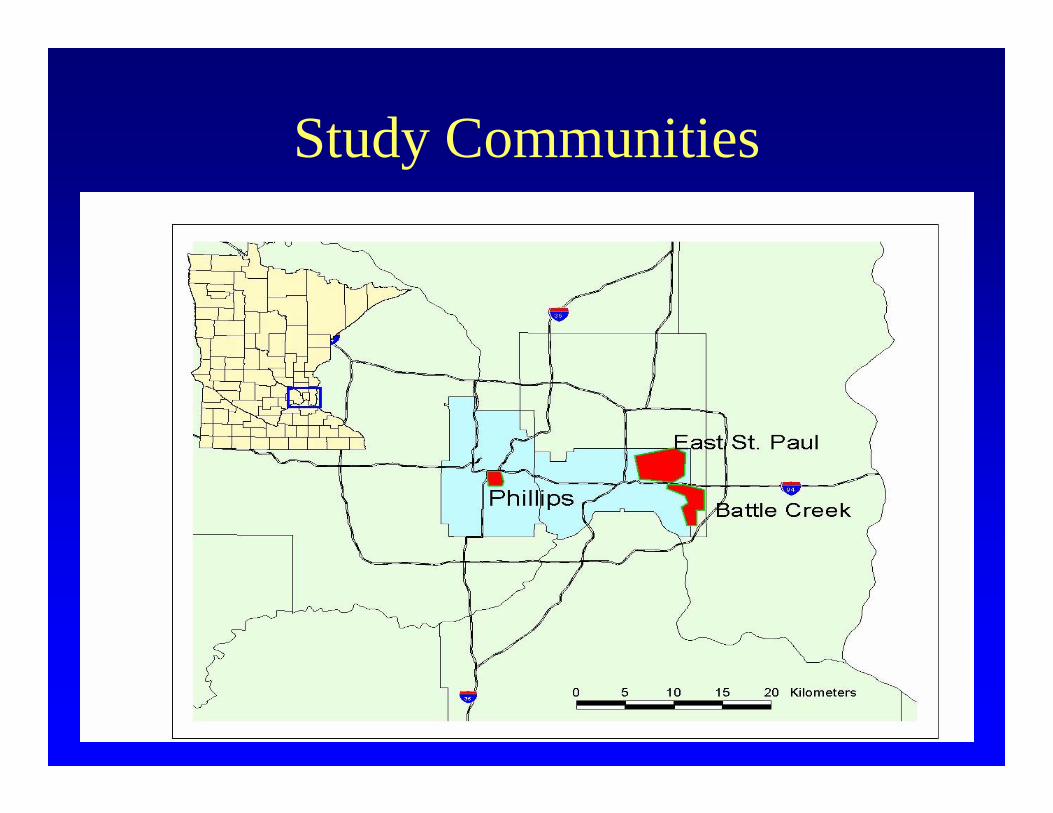
Study Communities
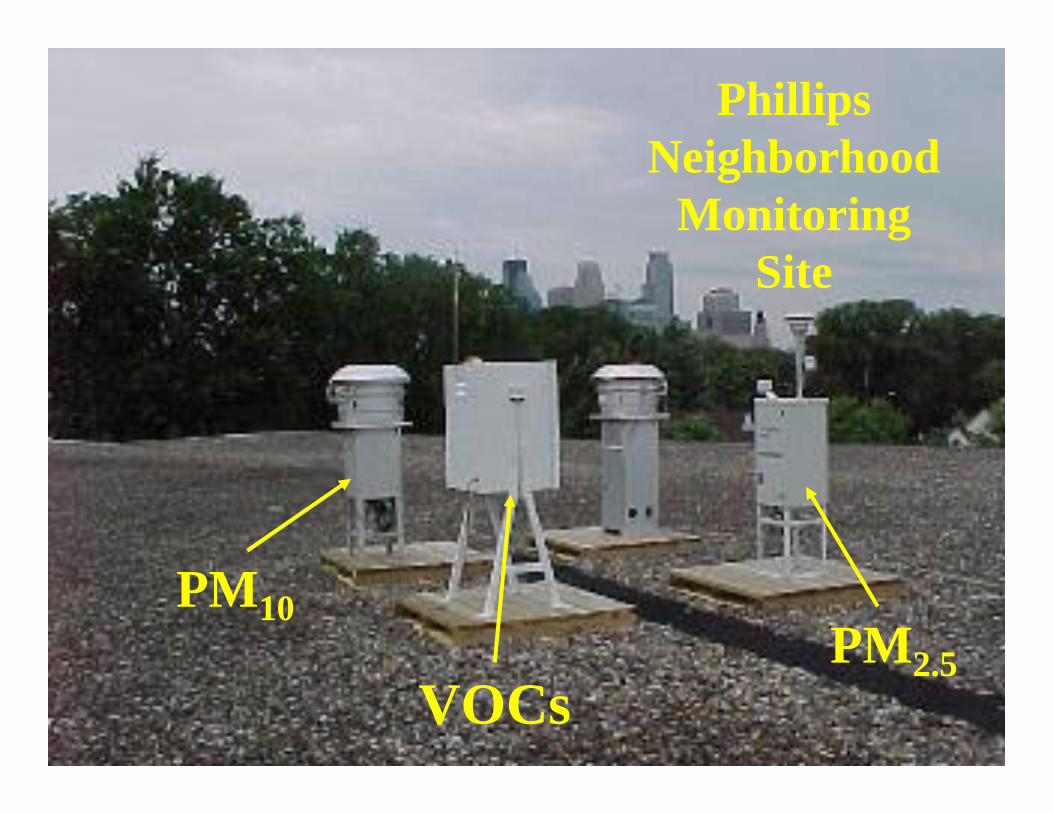
Phillips Neighborhood
Monitoring Site
PM10PM2.5
VOCs
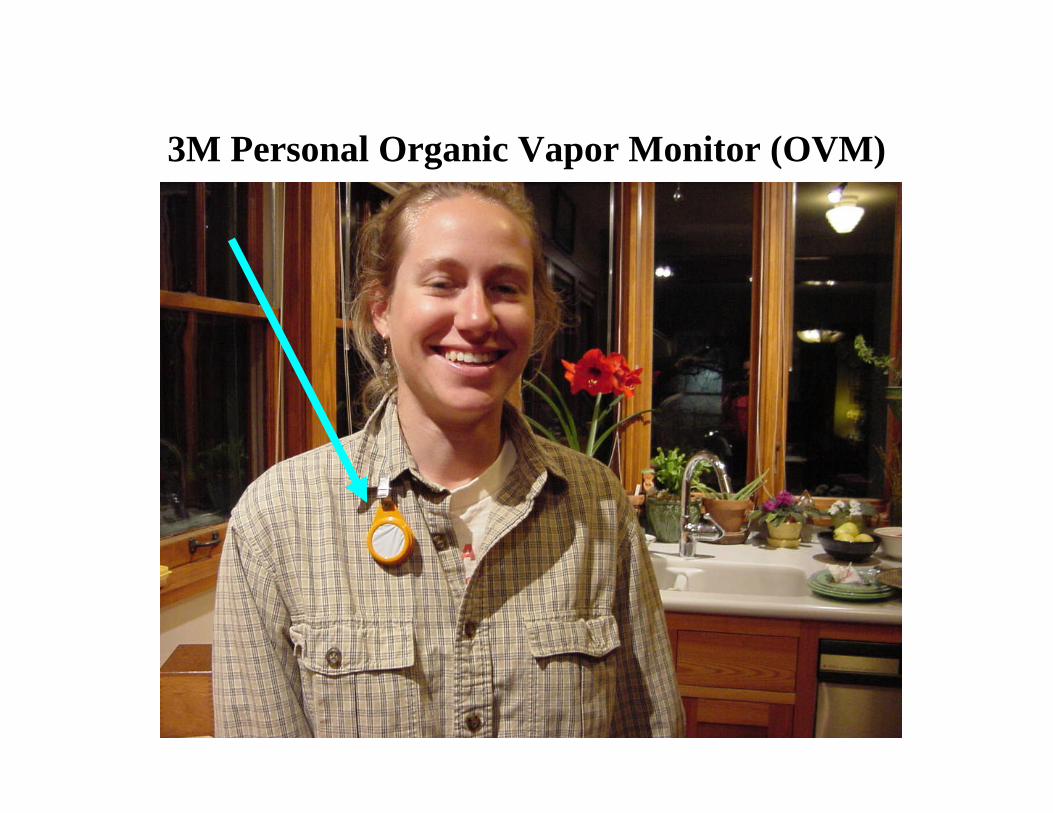
3M Personal Organic Vapor Monitor (OVM)
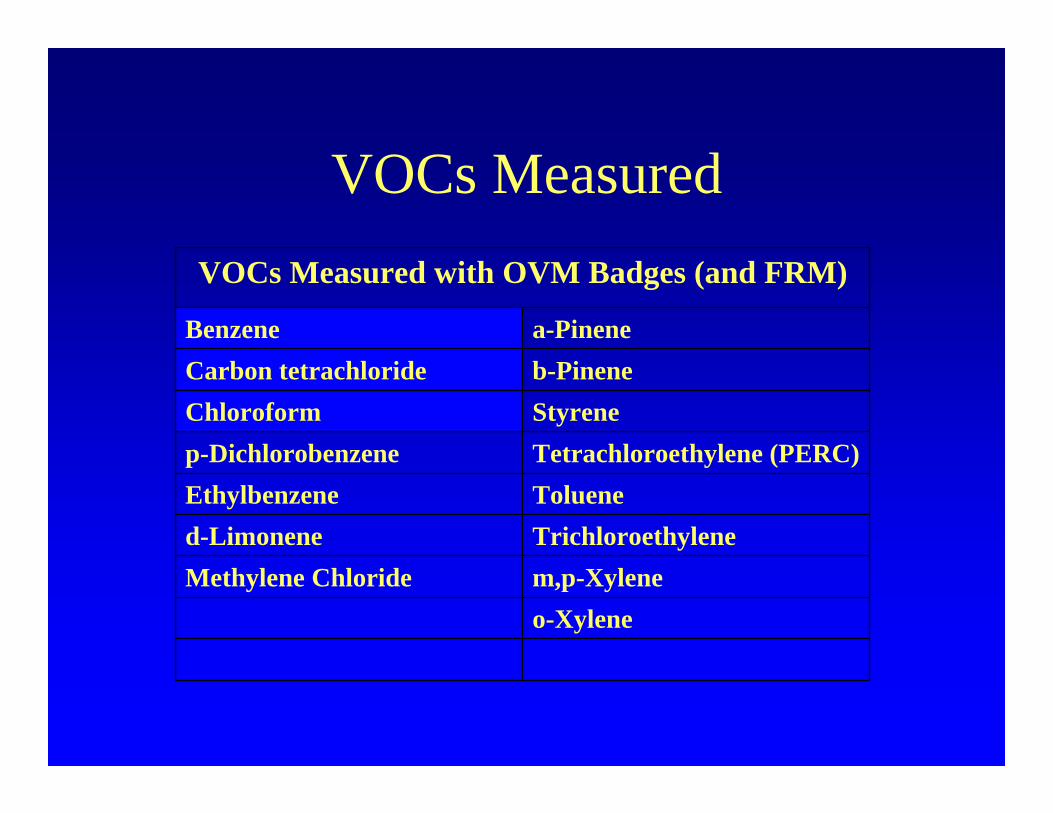
VOCs Measured
o-Xylenem,p-XyleneMethylene ChlorideTrichloroethylene d-LimoneneTolueneEthylbenzeneTetrachloroethylene (PERC)p-DichlorobenzeneStyreneChloroformb-Pinene Carbon tetrachloridea-PineneBenzene
VOCs Measured with OVM Badges (and FRM)
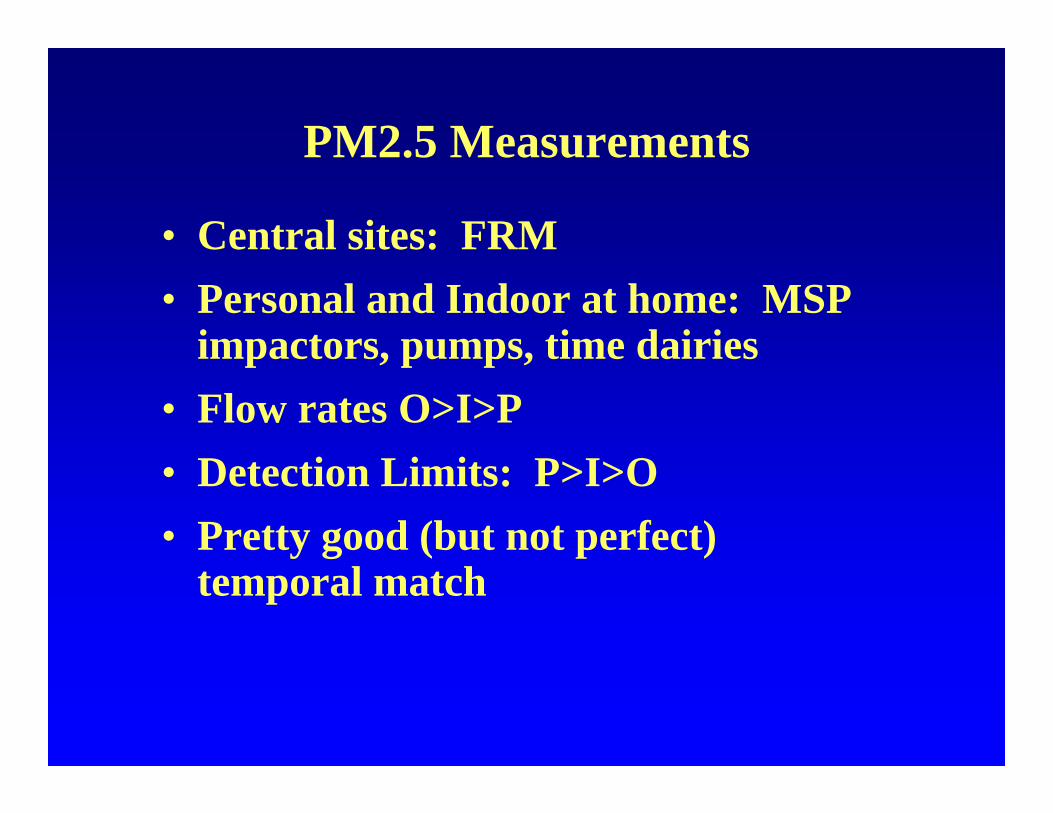
PM2.5 Measurements
• Central sites: FRM• Personal and Indoor at home: MSP
impactors, pumps, time dairies• Flow rates O>I>P• Detection Limits: P>I>O• Pretty good (but not perfect)
temporal match
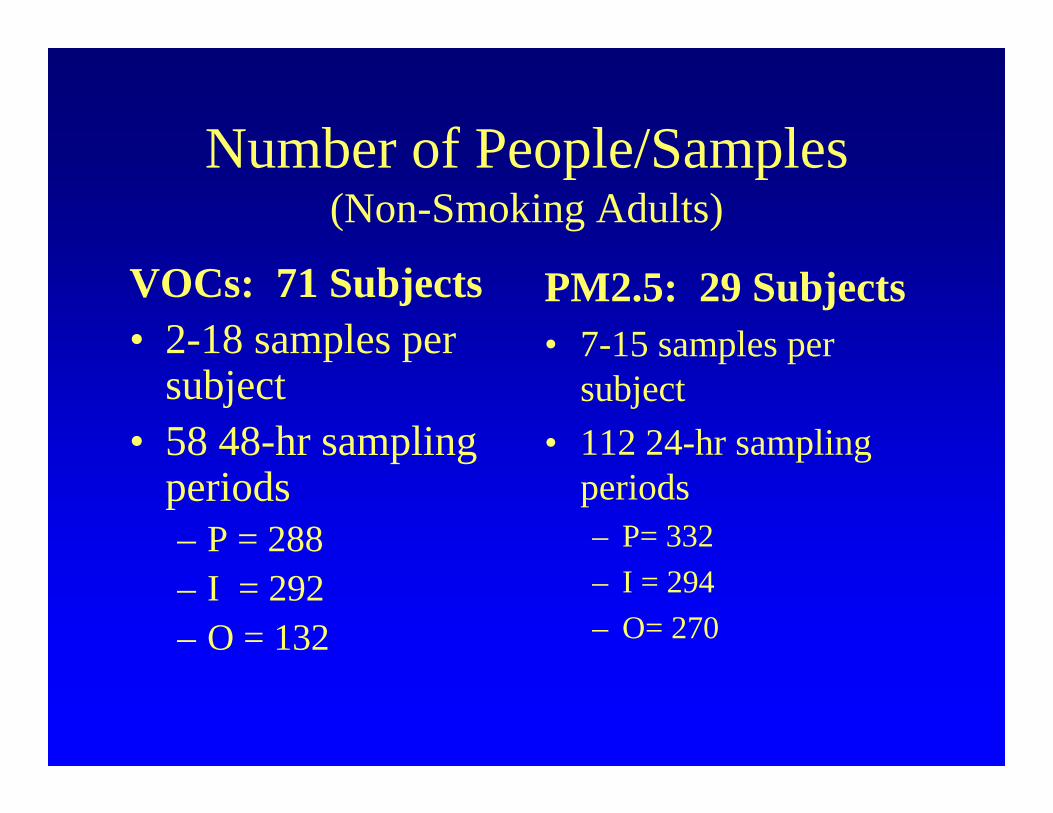
Number of People/Samples(Non-Smoking Adults)
VOCs: 71 Subjects• 2-18 samples per
subject• 58 48-hr sampling
periods– P = 288 – I = 292– O = 132
PM2.5: 29 Subjects• 7-15 samples per
subject• 112 24-hr sampling
periods– P= 332– I = 294– O= 270

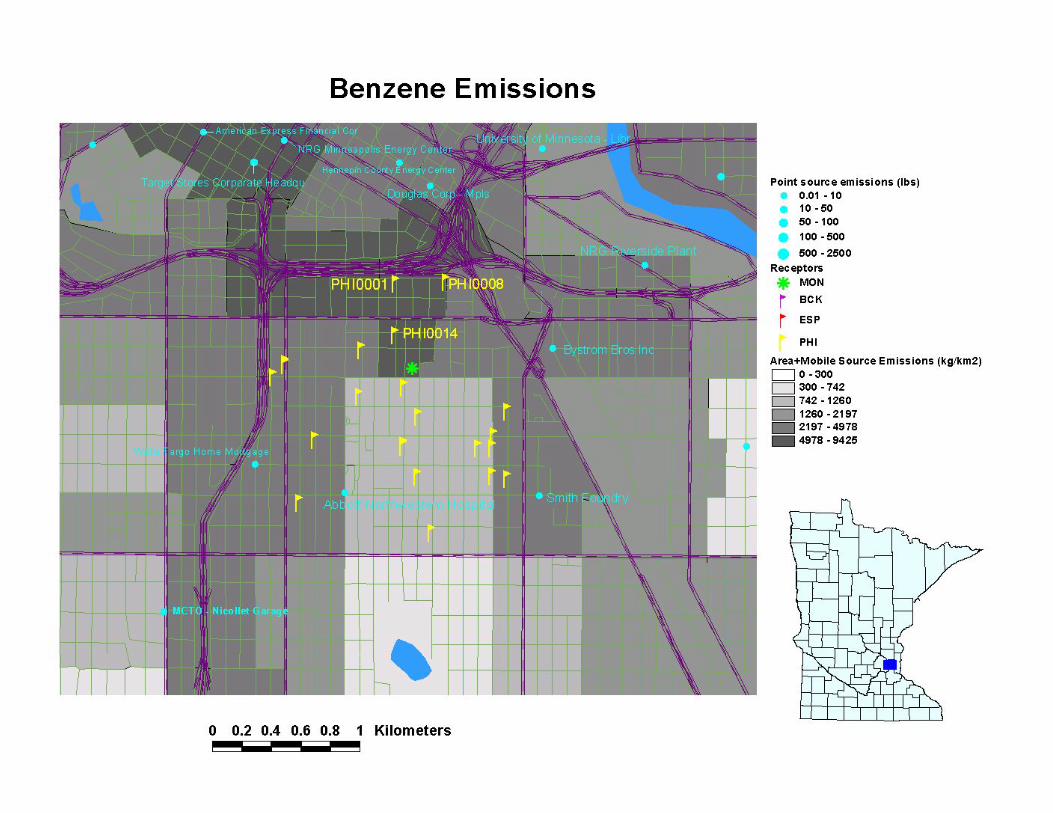
VOC Sources and Emissions
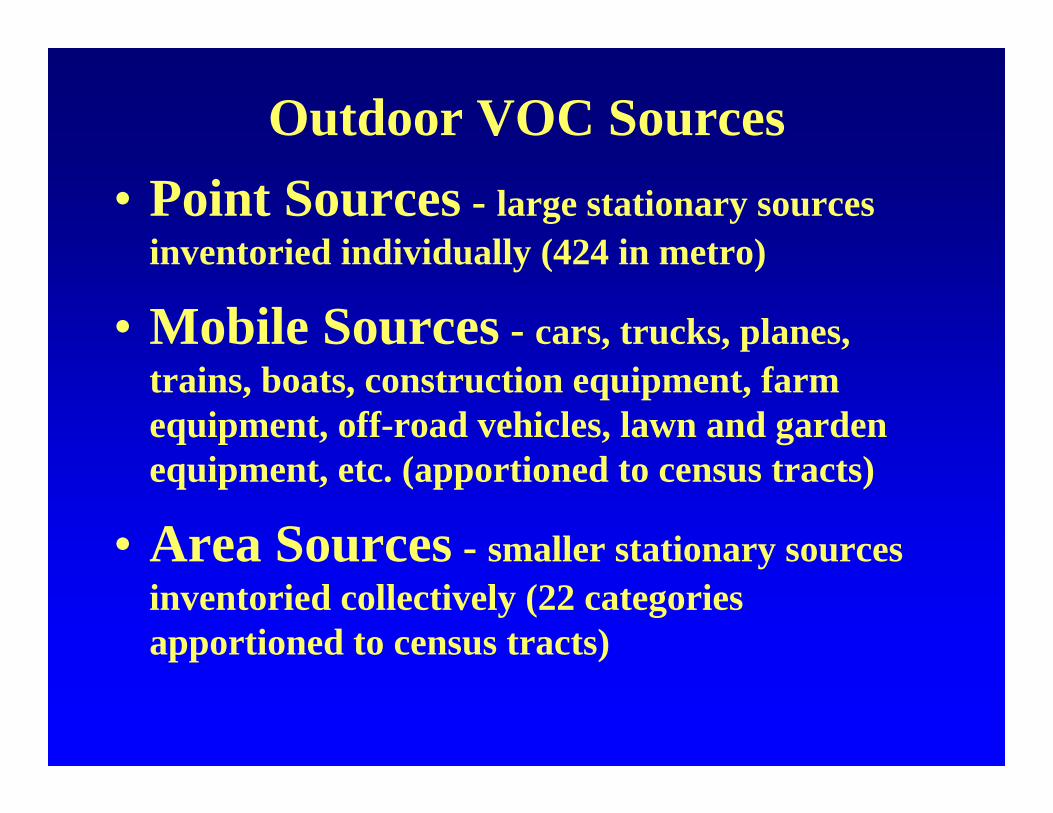
Outdoor VOC Sources• Point Sources - large stationary sources
inventoried individually (424 in metro)
• Mobile Sources - cars, trucks, planes, trains, boats, construction equipment, farm equipment, off-road vehicles, lawn and garden equipment, etc. (apportioned to census tracts)
• Area Sources - smaller stationary sources inventoried collectively (22 categories apportioned to census tracts)
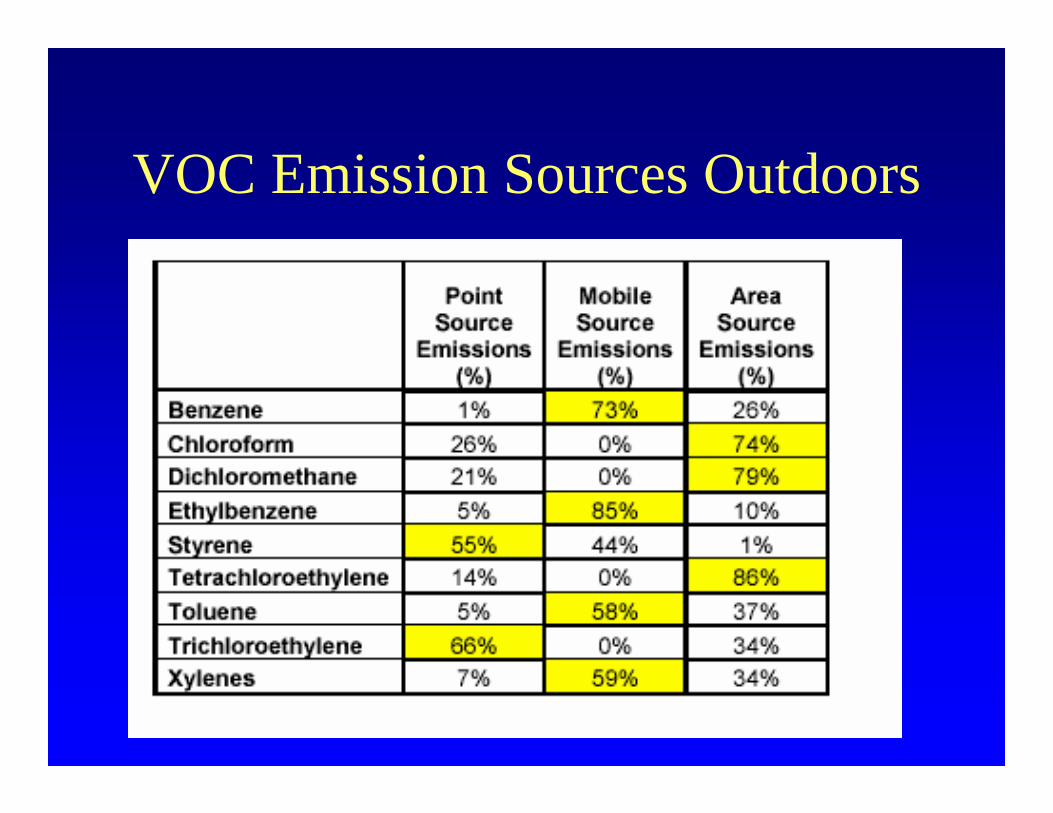
VOC Emission Sources Outdoors
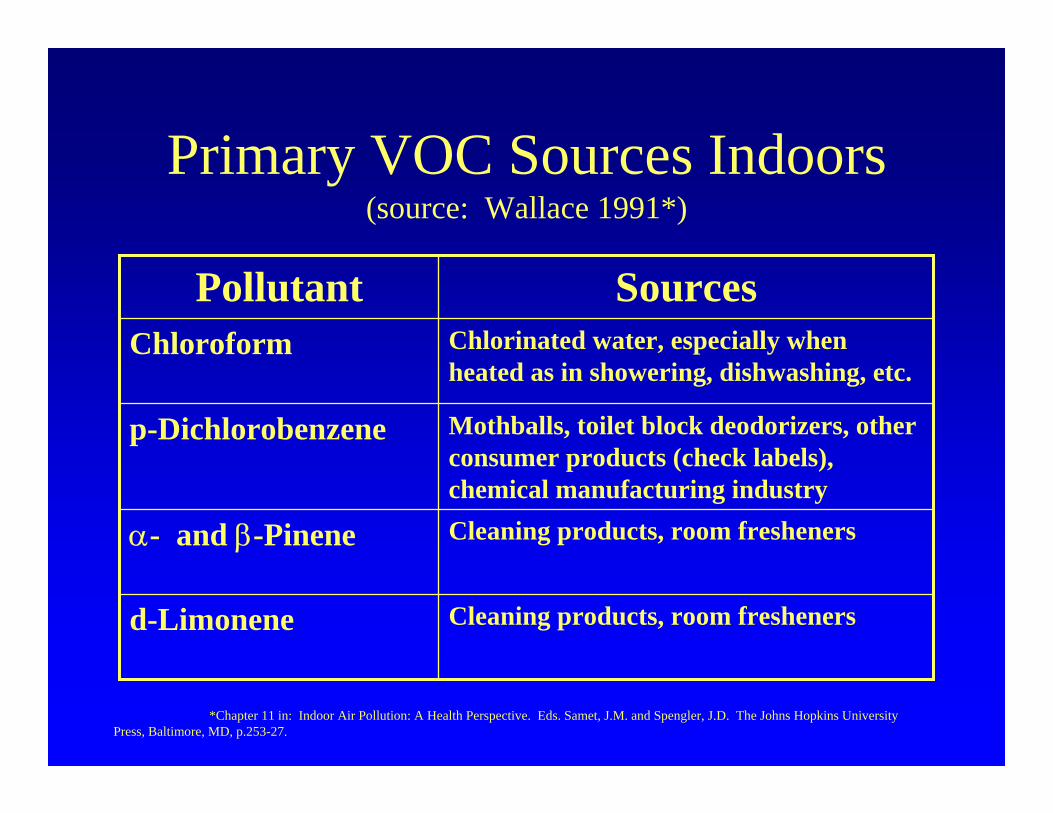
Primary VOC Sources Indoors(source: Wallace 1991*)
Cleaning products, room freshenersd-Limonene
Cleaning products, room freshenersα- and β-Pinene
Mothballs, toilet block deodorizers, other consumer products (check labels), chemical manufacturing industry
p-Dichlorobenzene
Chlorinated water, especially when heated as in showering, dishwashing, etc.
Chloroform
SourcesPollutant
*Chapter 11 in: Indoor Air Pollution: A Health Perspective. Eds. Samet, J.M. and Spengler, J.D. The Johns Hopkins University Press, Baltimore, MD, p.253-27.
VOC Measurement Results:P, I, O

Personal VOC Range Plots
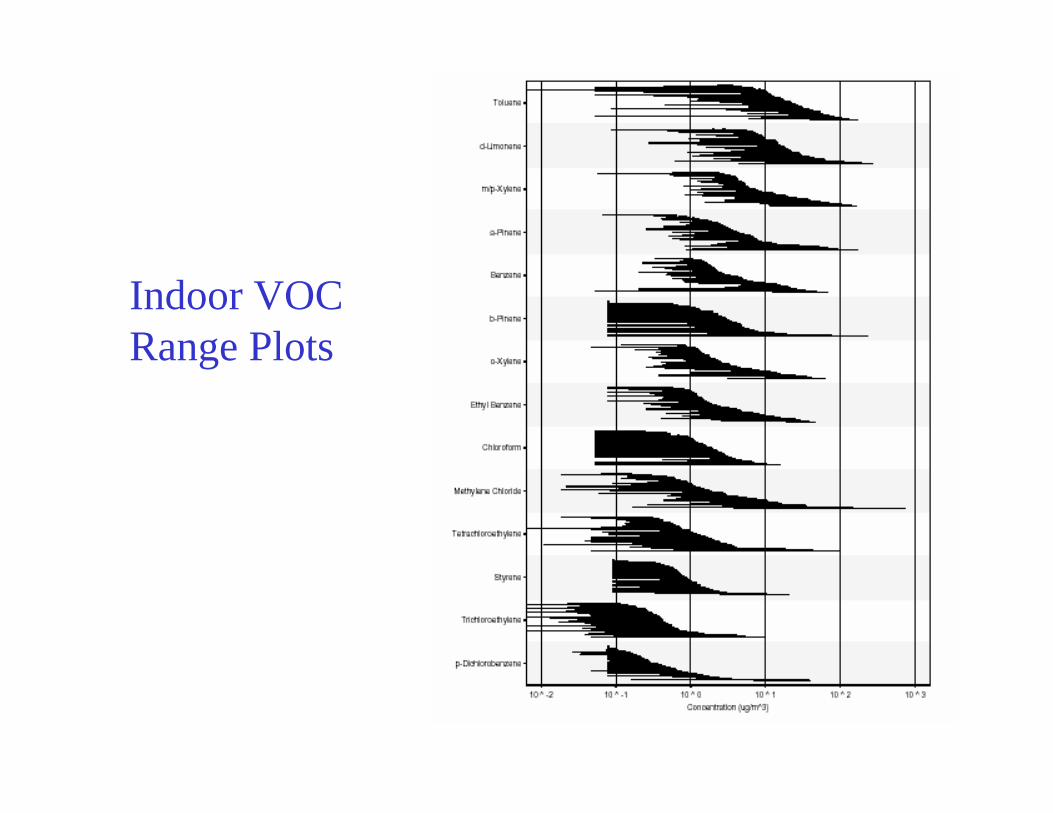
Indoor VOC Range Plots
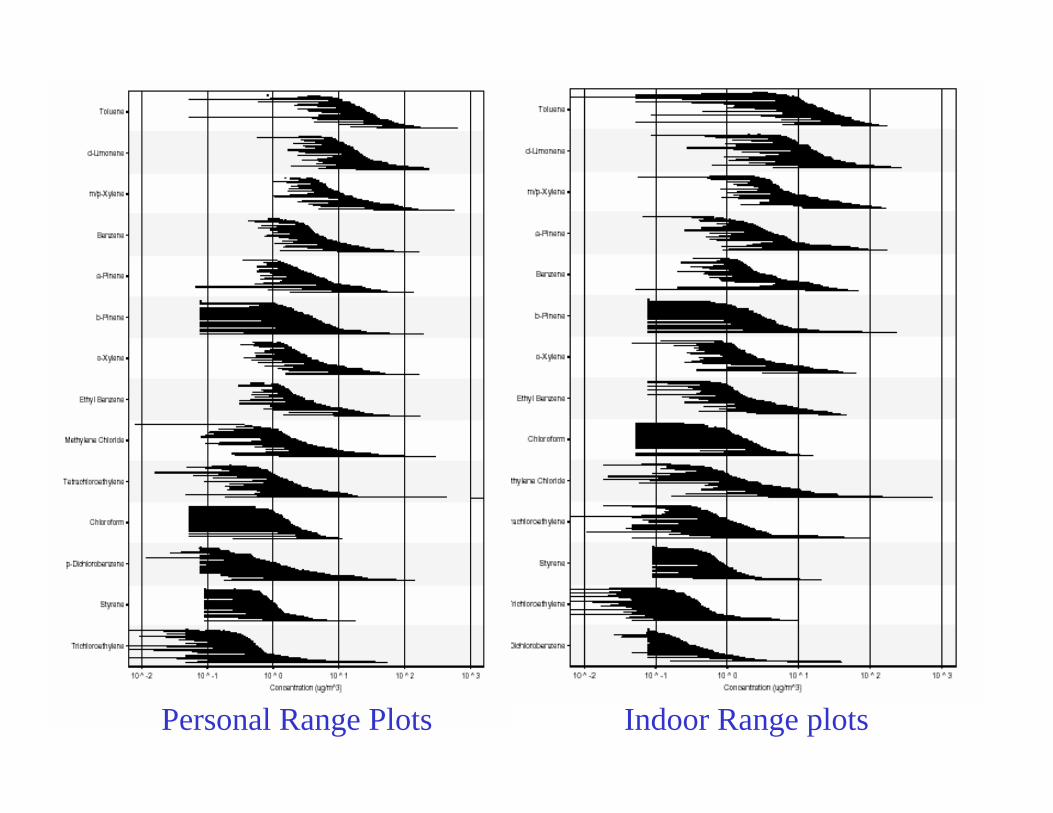
Indoor Range plotsPersonal Range Plots
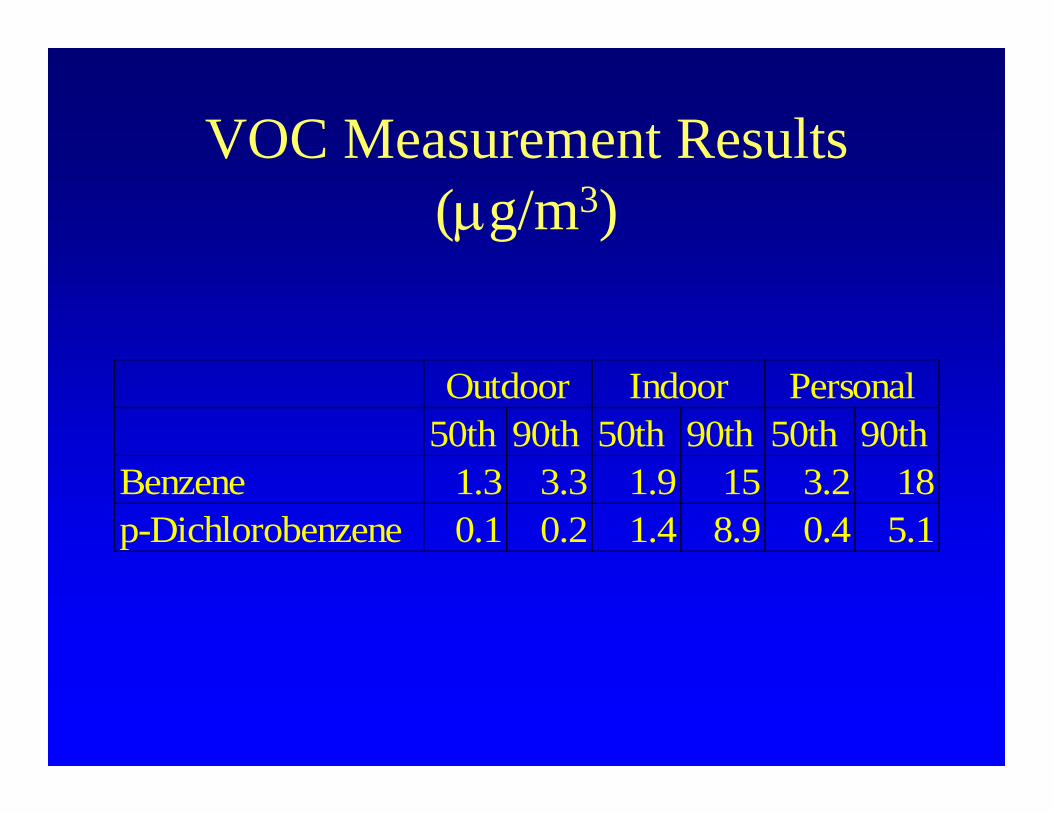
VOC Measurement Results (µg/m3)
50th 90th 50th 90th 50th 90thBenzene 1.3 3.3 1.9 15 3.2 18p-Dichlorobenzene 0.1 0.2 1.4 8.9 0.4 5.1
Outdoor Indoor Personal
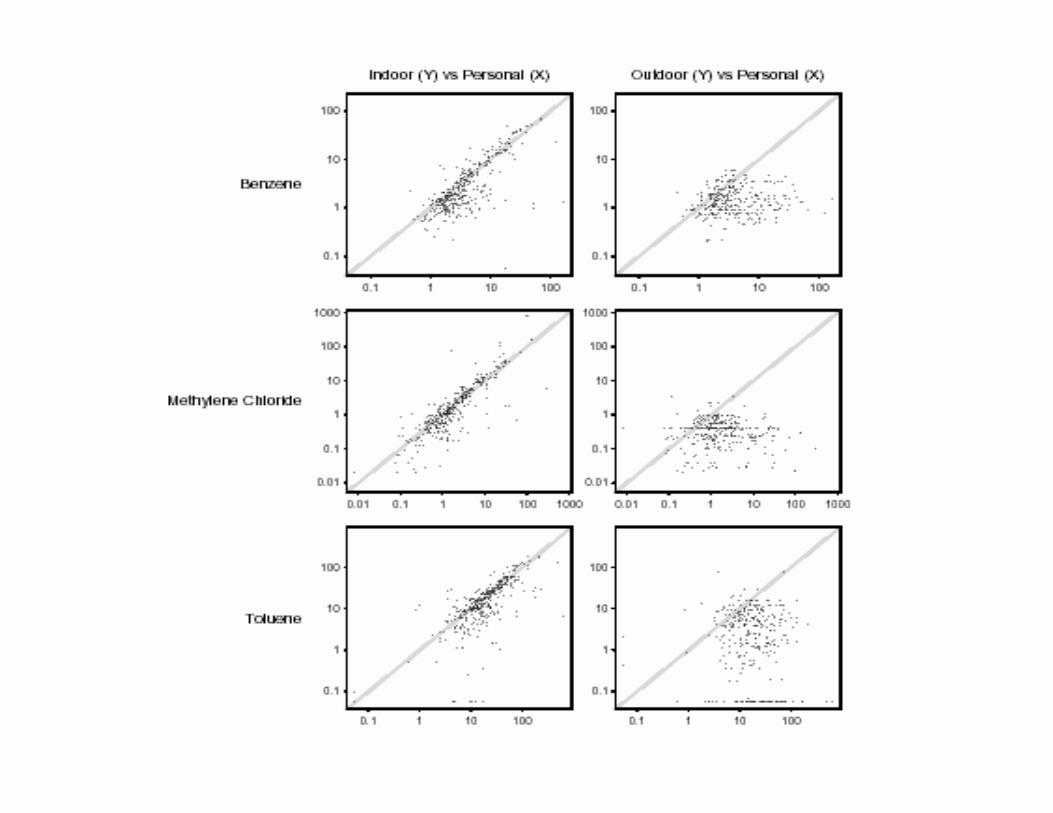
How well do Outdoor and Personal Agree?
How well do Indoor and Personal Agree?
VOC Results: PIO
• Consistent P>I>O observed for 13 of 15 chemicals– Exceptions: Carbon Tetrachloride, Chloroform
• I does better than O• Underestimation is greater at the upper end of the
exposure distribution• Central sites under estimate actual exposures for
urban residents even when measured in their own community
Longitudinal VOC Results
• How well do O levels predict I and P within people over time?
• Mixed model approach: – Adjust for season and community effects– Address issue of within person and within
monitoring period autocorrelation
Longitudinal VOC Results
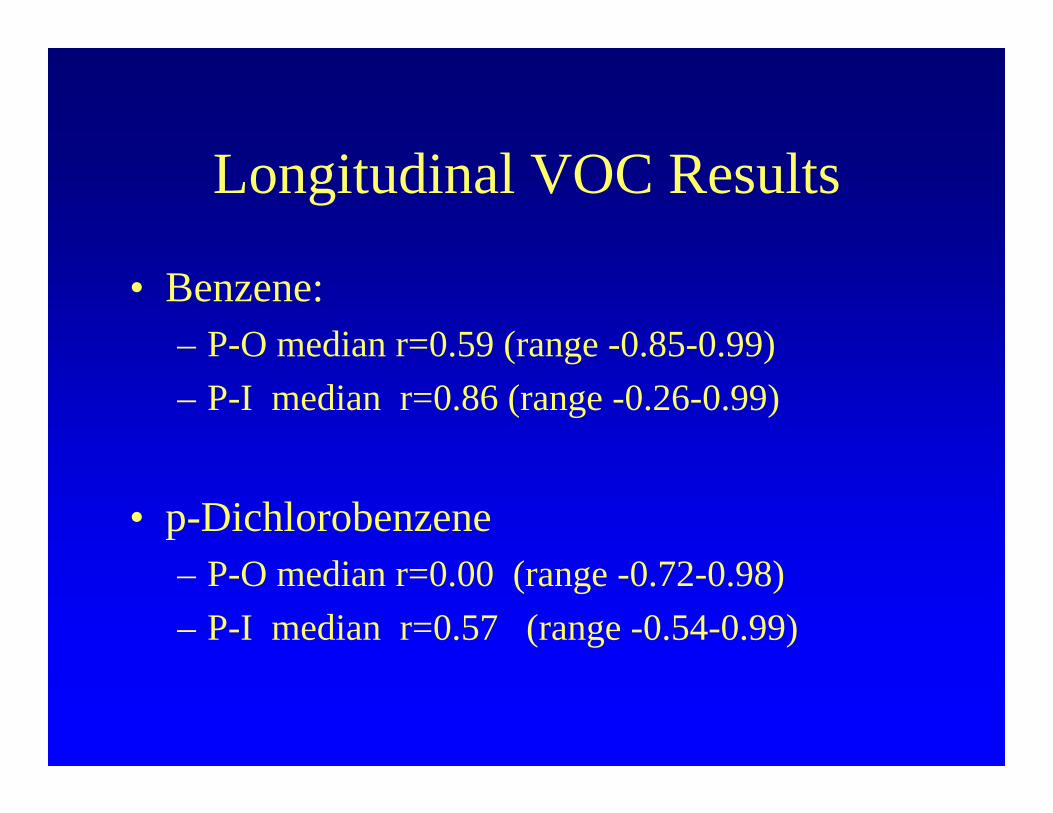
• Benzene: – P-O median r=0.59 (range -0.85-0.99)– P-I median r=0.86 (range -0.26-0.99)
• p-Dichlorobenzene– P-O median r=0.00 (range -0.72-0.98)– P-I median r=0.57 (range -0.54-0.99)
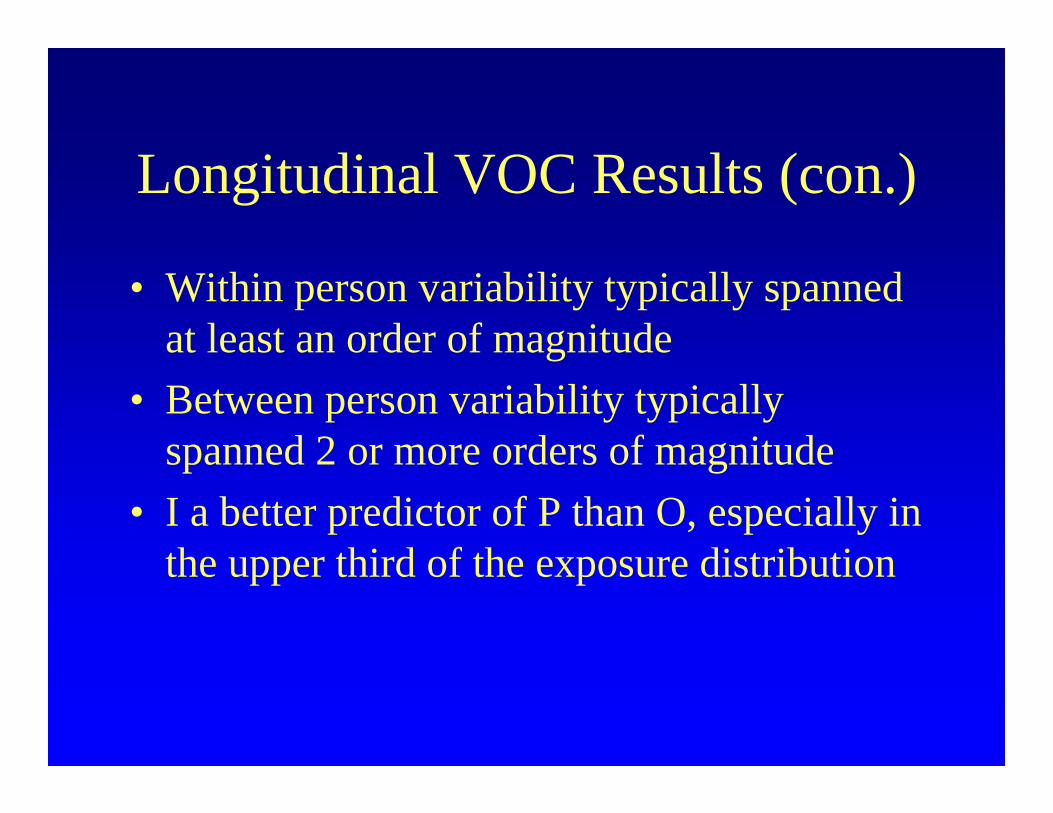
Longitudinal VOC Results (con.)
• Within person variability typically spanned at least an order of magnitude
• Between person variability typically spanned 2 or more orders of magnitude
• I a better predictor of P than O, especially in the upper third of the exposure distribution
PM2.5 Measurement Results:
P, I, O
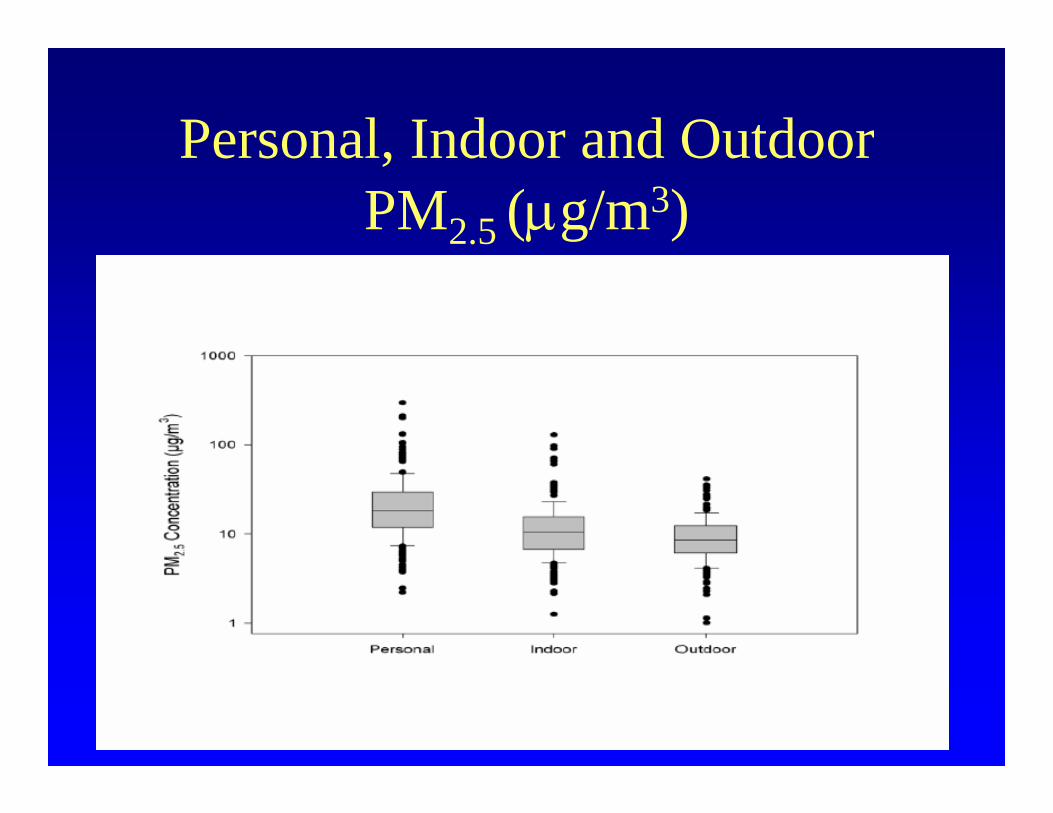
Personal, Indoor and Outdoor PM2.5 (µg/m3)
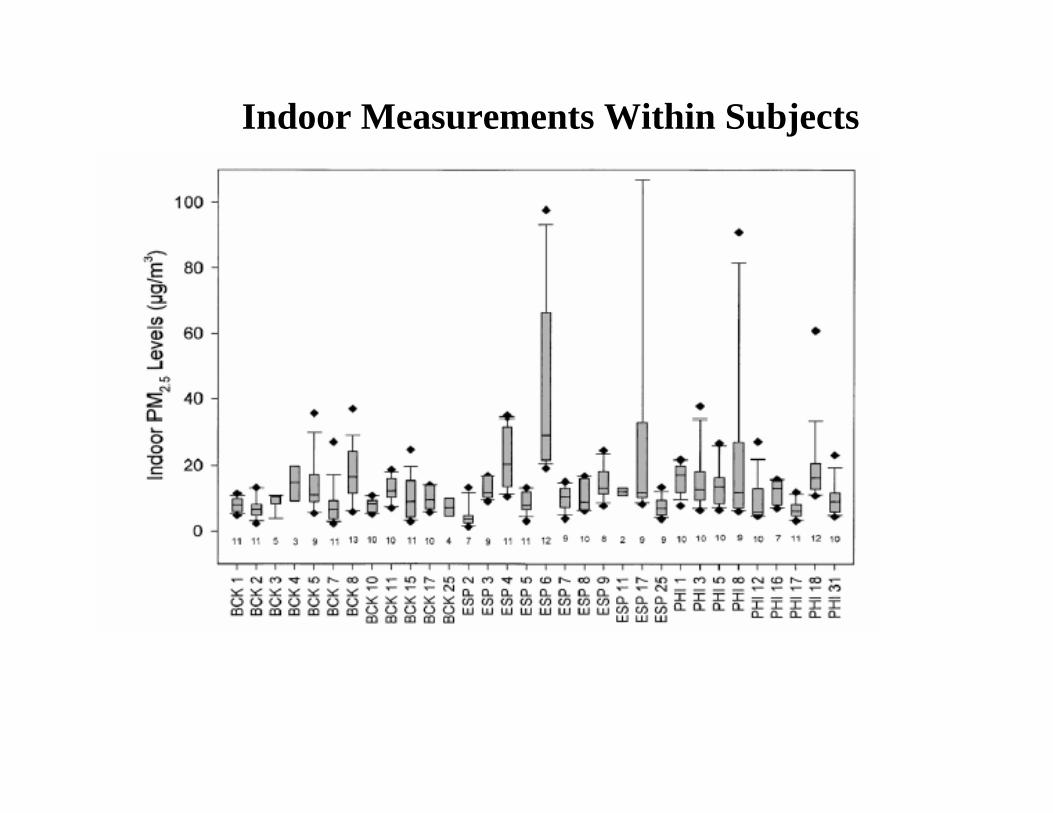
Indoor Measurements Within Subjects
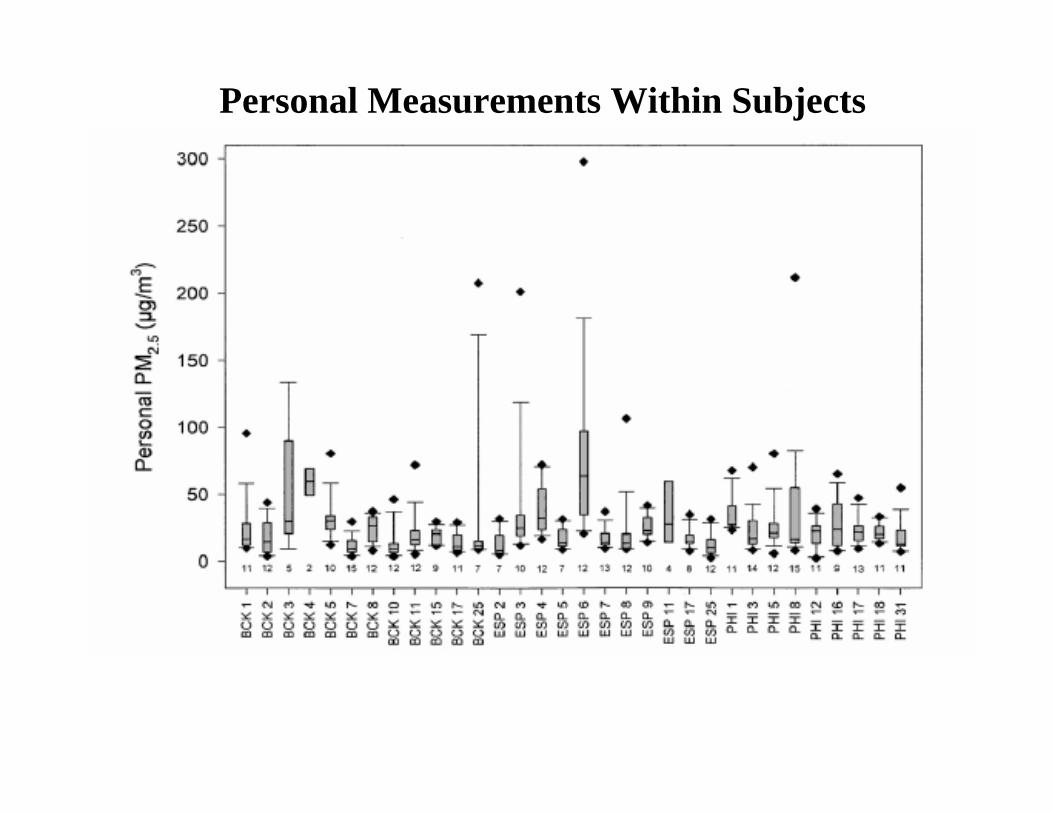
Personal Measurements Within Subjects
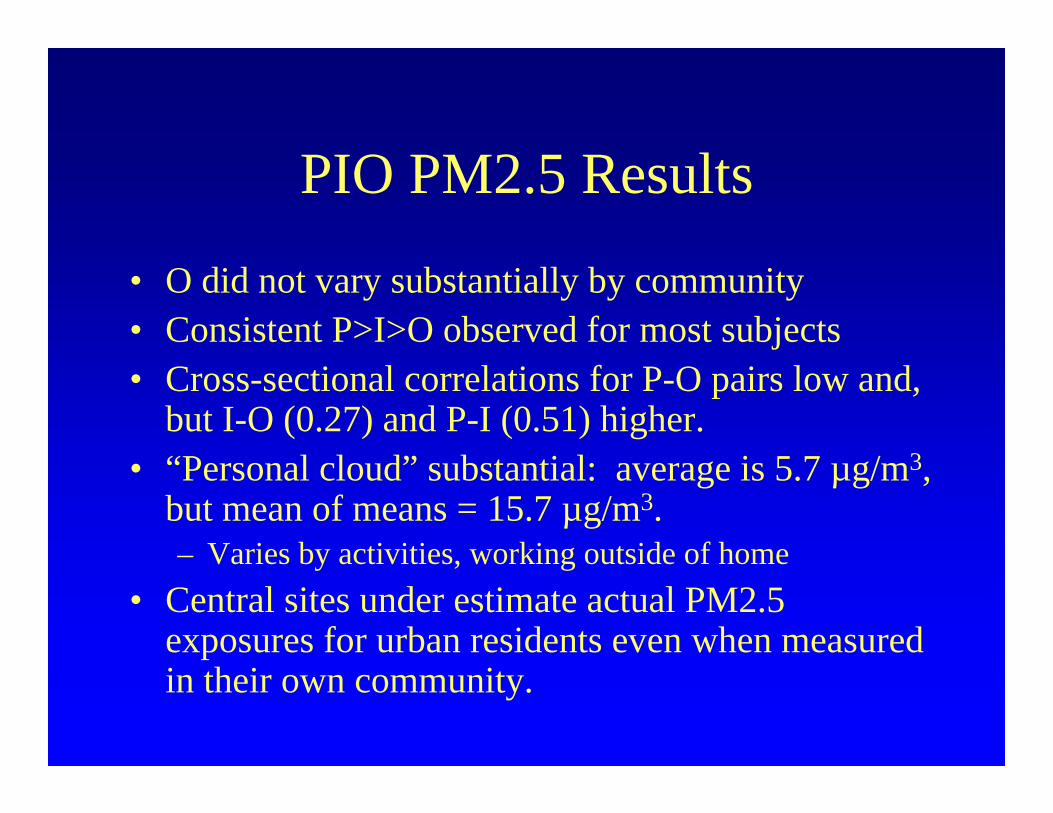
PIO PM2.5 Results
• O did not vary substantially by community• Consistent P>I>O observed for most subjects• Cross-sectional correlations for P-O pairs low and,
but I-O (0.27) and P-I (0.51) higher.• “Personal cloud” substantial: average is 5.7 µg/m3,
but mean of means = 15.7 µg/m3.– Varies by activities, working outside of home
• Central sites under estimate actual PM2.5 exposures for urban residents even when measured in their own community.
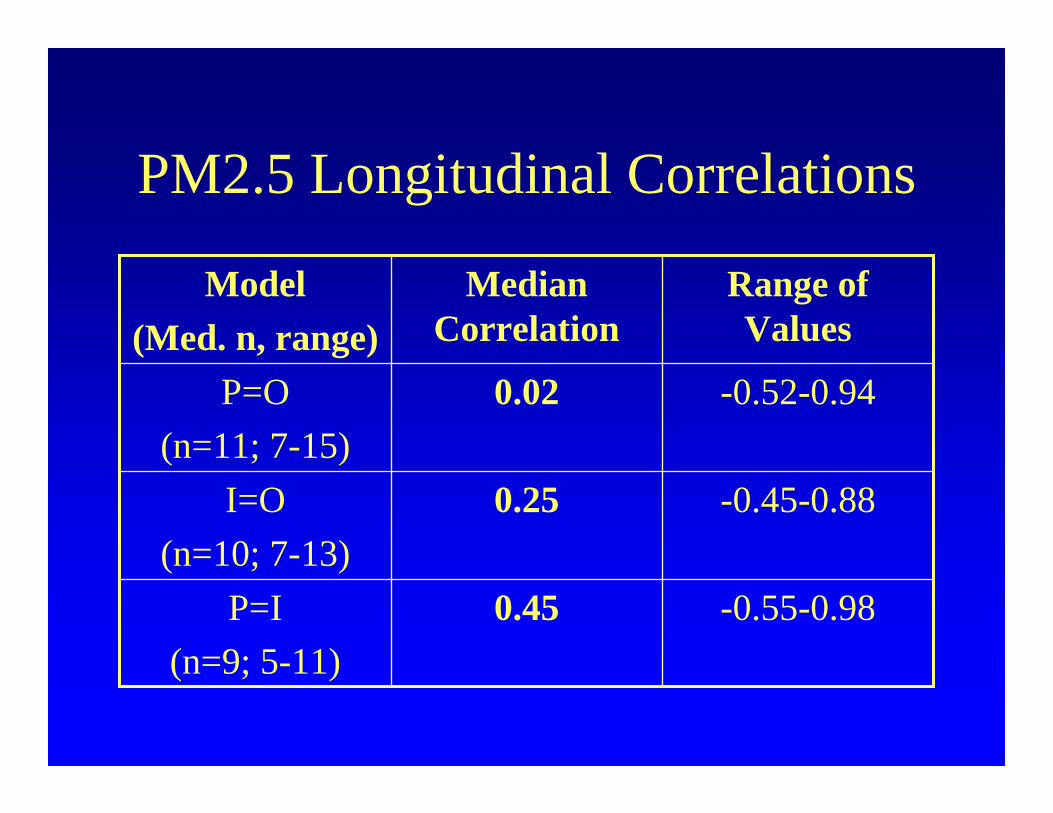
PM2.5 Longitudinal Correlations
-0.55-0.980.45P=I(n=9; 5-11)
-0.45-0.880.25I=O(n=10; 7-13)
-0.52-0.940.02P=O(n=11; 7-15)
Range of Values
Median Correlation
Model(Med. n, range)
0%
2%
4%
6%
8%
10%
12%
14%
16%
18%
20%
<-0.
9
-0.8
-0.6
-0.4
-0.2 0
0.2
0.4
0.6
0.8
>0.9
Pearson's r Midpoint
Perc
enta
ge o
f Sub
ject
s
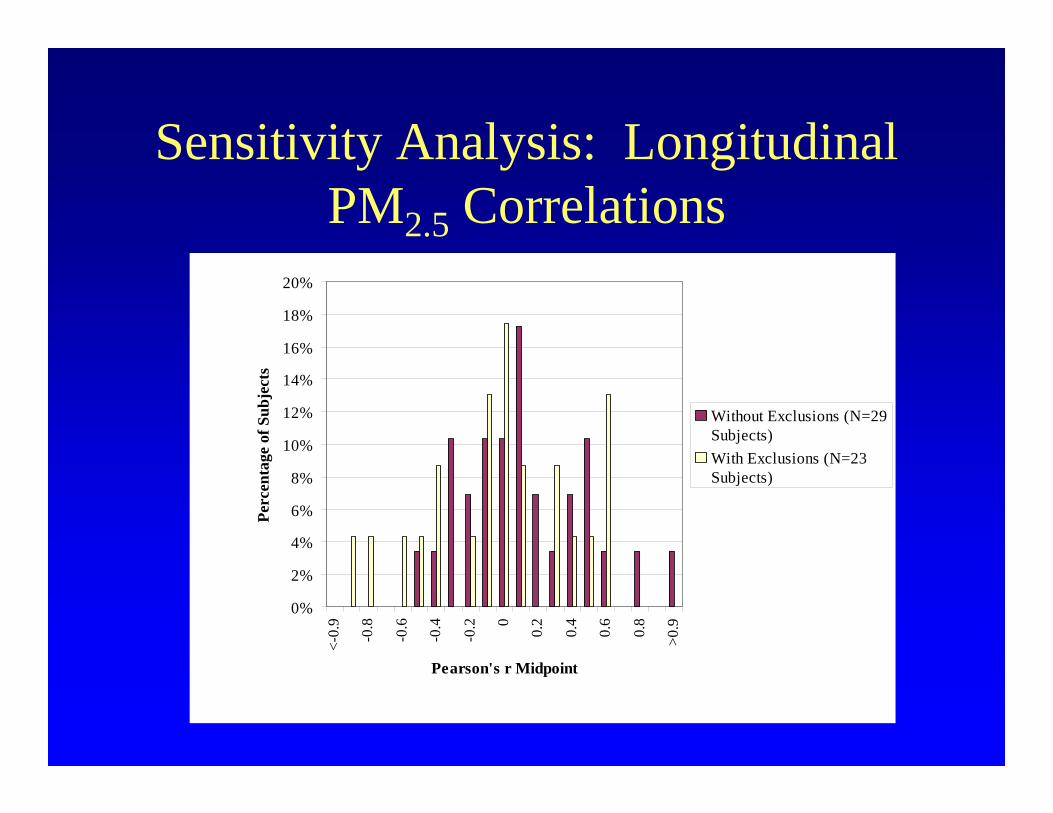
Without Exclusions (N=29Subjects)With Exclusions (N=23Subjects)
Sensitivity Analysis: Longitudinal PM2.5 Correlations
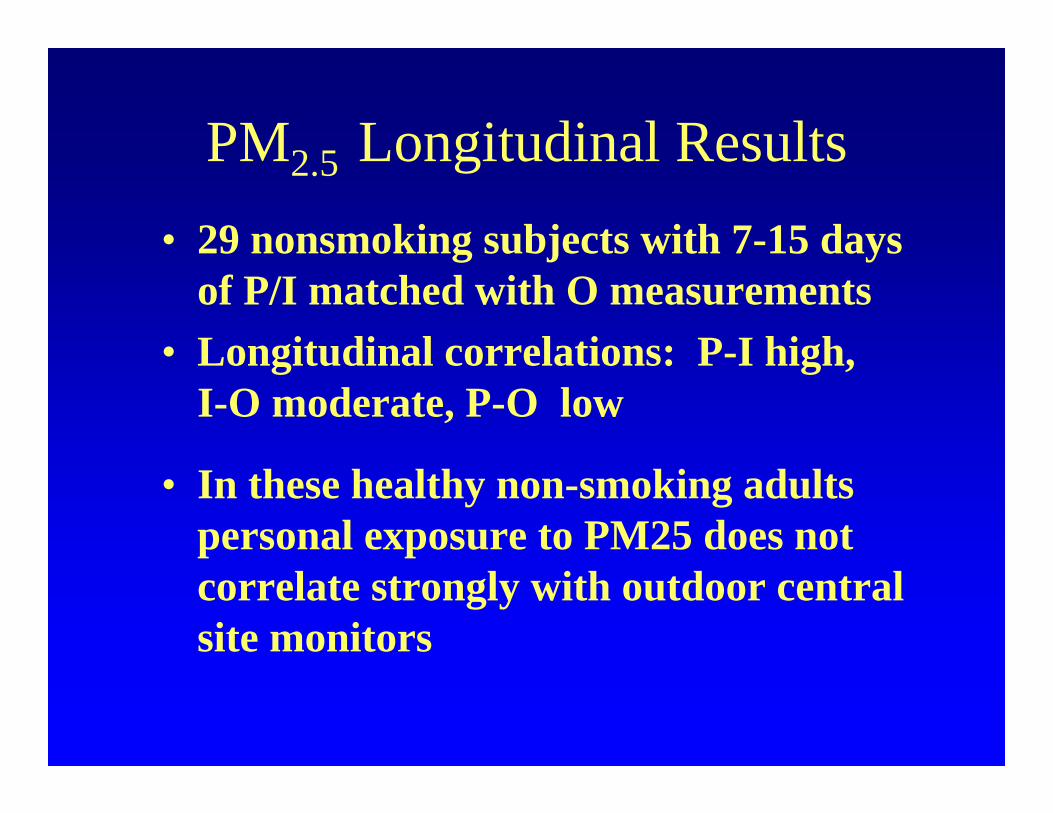
PM2.5 Longitudinal Results• 29 nonsmoking subjects with 7-15 days
of P/I matched with O measurements• Longitudinal correlations: P-I high,
I-O moderate, P-O low
• In these healthy non-smoking adults personal exposure to PM25 does not correlate strongly with outdoor central site monitors
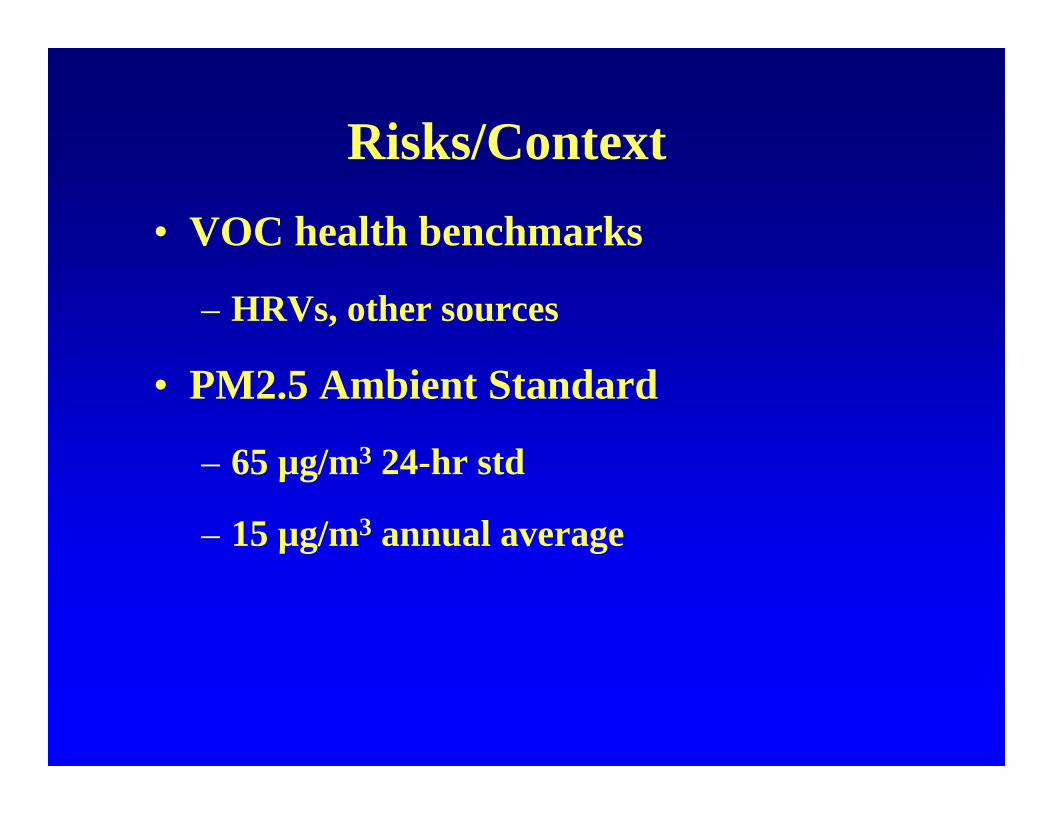
Risks/Context• VOC health benchmarks
– HRVs, other sources
• PM2.5 Ambient Standard
– 65 µg/m3 24-hr std
– 15 µg/m3 annual average
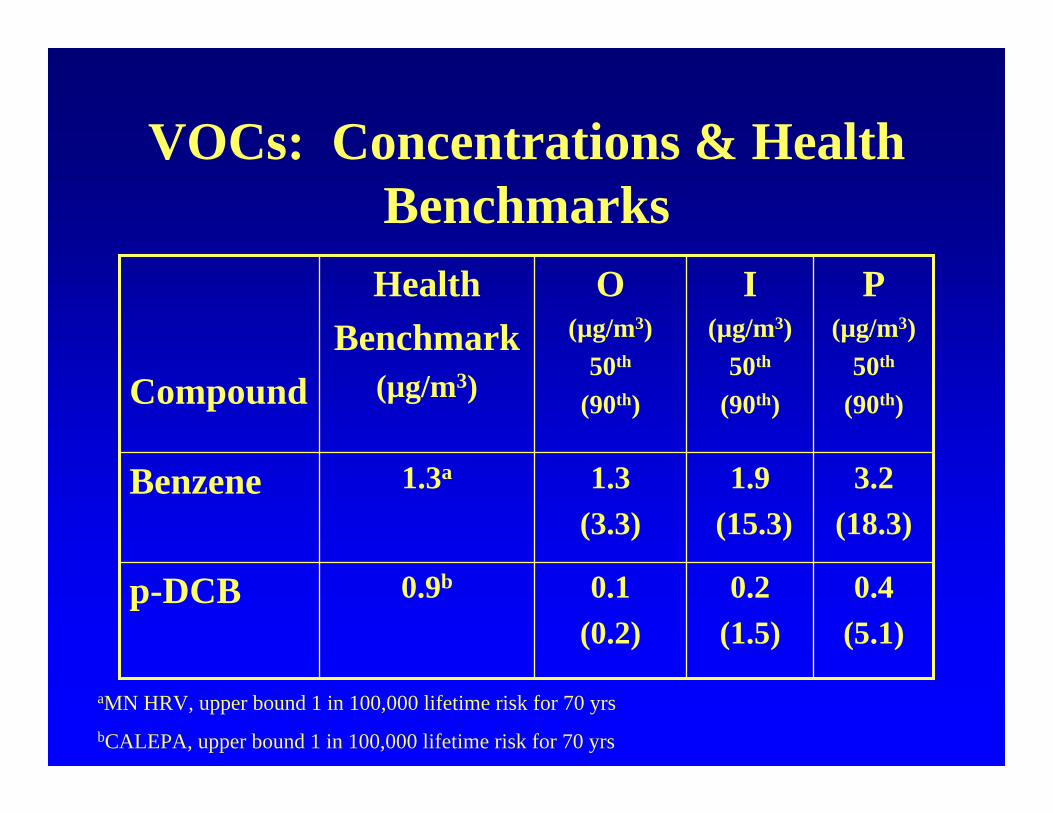
VOCs: Concentrations & Health Benchmarks
0.4 (5.1)
0.2 (1.5)
0.1(0.2)
0.9bp-DCB
3.2(18.3)
1.9(15.3)
1.3 (3.3)
1.3aBenzene
P(µg/m3)
50th
(90th)
I(µg/m3)
50th
(90th)
O(µg/m3)
50th
(90th)
HealthBenchmark
(µg/m3)Compound
aMN HRV, upper bound 1 in 100,000 lifetime risk for 70 yrsbCALEPA, upper bound 1 in 100,000 lifetime risk for 70 yrs

Summary/Conclusions:• Generally for measured VOCs/PM2.5:
P > I > O
• Relatively high P-O/P-I longitudinal correlation coefficients mean that in healthy adults the variability in VOC exposures can be reasonably predicted within individuals over time.
• This was not true for PM2.5, probably because of low outdoor variability and activity patterns of the working adult population
• Risk assessments based on outdoor VOC measures appear to seriously underestimate lifetime cancer risks from these compounds
Acknowledgements• HAPs Study participants and field staff• Funding Sources: EPA STAR Grants R825241-01-0
and R827928-010, and a faculty development grant from the Academic Health Center, University of Minnesota
• Ken Sexton , Gurumurthy Ramachandran, and Steve Mongin, University of Minnesota School of Public Health
• Greg Pratt, Don Bock, Chun Yi Wu, Minnesota Pollution Control Agency
• Tom Stock & Maria Morandi, University of Texas, Houston


