US Army Corps of Engineers – Baltimore District US Department of the Treasury Proposed Currency Production Facility November 6, 2020 I 1 Air Quality Technical Memorandum Air Quality 1 1.1 Introduction 2 This Technical Memorandum describes the existing air quality in the Proposed Action’s Region of Influence 3 (ROI) and potential impacts on air quality from the Proposed Action (i.e., Preferred Alternative) and No 4 Action Alternative. Measures to reduce potential adverse air quality effects from the Proposed Action are 5 identified. 6 Air pollutants may be naturally occurring or emitted from stationary (e.g., permanent fuel-burning 7 equipment) or mobile (e.g., vehicles) human-activity sources. 8 The Clean Air Act (CAA) of 1970 and its amendments required the United States Environmental Protection 9 Agency (USEPA) to establish National Ambient Air Quality Standards (NAAQS) for ambient air pollutants 10 considered harmful to public health and the environment. These are known as “criteria pollutants” (USEPA, 11 2018a). States have the authority to adopt stricter criteria pollutant standards; however, Maryland has 12 adopted the USEPA standards (Code of Maryland Regulations [COMAR] 26.11.04). 13 The USEPA uses geographic regions to designate the NAAQS attainment status of an area. As defined by 14 the CAA, for a given pollutant, an attainment area is one in compliance with the NAAQS, while a non- 15 attainment area does not meet one or more of the NAAQS. A maintenance area is an area that was 16 previously in non-attainment but has since come into compliance with the NAAQS. Areas are also often 17 classified by a category or level of attainment or non-attainment, such as “severe,” “marginal,” or “moderate” 18 (USEPA, 2018a; USEPA, 2016). 19 In addition to criteria air pollutants, the USEPA also regulates hazardous air pollutants (HAPs) and 20 greenhouse gases (GHGs). Furthermore, the state of Maryland regulates pollutants referred to as toxic air 21 pollutants (TAPs). These pollutants are defined and described in Table 1. 22 This Technical Memorandum reviews criteria pollutants and HAPs within the Proposed Action’s ROI based 23 on federal, state, and local (i.e., Prince George’s County) requirements. Since GHGs are relatively stable 24 in the atmosphere and are essentially uniformly mixed throughout the troposphere and stratosphere, GHG 25 emissions are reviewed on a broader scale at the state (i.e., regional) level. 26 Treasury received comments related to air quality from stakeholders during the public scoping period. 27 These comments primarily concerned the potential impacts of air pollution from the currency manufacturing 28 process. Multiple stakeholders commented regarding potential climate change impacts. One comment 29 noted that Treasury should complete a General Conformity Analysis. Please refer to Treasury’s Public 30 Scoping Report for further details on the comments received during the scoping period. Each of these 31 comments is considered and addressed in this analysis. 32 1.2 Affected Environment 33 1.2.1 Region of Influence 34 The ROI for this analysis is Prince George’s County and the National Capital Region (NCR) (see Figure 35 1). The USEPA uses regional, contiguous geographic areas to determine an area’s NAAQS compliance, 36 such as a county, city, or other regionally connected areas. The USEPA includes the Project Site within 37 Prince George’s County to determine the area’s NAAQS attainment status (USEPA, 2019c). Further, the 38 CAA defines larger regional, contiguous geographic areas that have relatively uniform air quality conditions 39 as Air Quality Control Regions (AQCRs). Both the Project Site and the Bureau of Engraving and Printing’s 40 (BEP’s) Washington, DC Facility (DC Facility) are in the “National Capital Interstate” AQCR, which is 41 equivalent to the NCR (40 Code of Federal Regulations [CFR] 81.12). 42
Transcript
US Army Corps of Engineers – Baltimore District US Department of the Treasury
Proposed Currency Production Facility November 6, 2020 I 1 Air Quality Technical Memorandum
Air Quality 1
1.1 Introduction 2
This Technical Memorandum describes the existing air quality in the Proposed Action’s Region of Influence 3 (ROI) and potential impacts on air quality from the Proposed Action (i.e., Preferred Alternative) and No 4 Action Alternative. Measures to reduce potential adverse air quality effects from the Proposed Action are 5 identified. 6
Air pollutants may be naturally occurring or emitted from stationary (e.g., permanent fuel-burning 7 equipment) or mobile (e.g., vehicles) human-activity sources. 8
The Clean Air Act (CAA) of 1970 and its amendments required the United States Environmental Protection 9 Agency (USEPA) to establish National Ambient Air Quality Standards (NAAQS) for ambient air pollutants 10 considered harmful to public health and the environment. These are known as “criteria pollutants” (USEPA, 11 2018a). States have the authority to adopt stricter criteria pollutant standards; however, Maryland has 12 adopted the USEPA standards (Code of Maryland Regulations [COMAR] 26.11.04). 13
The USEPA uses geographic regions to designate the NAAQS attainment status of an area. As defined by 14 the CAA, for a given pollutant, an attainment area is one in compliance with the NAAQS, while a non-15 attainment area does not meet one or more of the NAAQS. A maintenance area is an area that was 16 previously in non-attainment but has since come into compliance with the NAAQS. Areas are also often 17 classified by a category or level of attainment or non-attainment, such as “severe,” “marginal,” or “moderate” 18 (USEPA, 2018a; USEPA, 2016). 19
In addition to criteria air pollutants, the USEPA also regulates hazardous air pollutants (HAPs) and 20 greenhouse gases (GHGs). Furthermore, the state of Maryland regulates pollutants referred to as toxic air 21 pollutants (TAPs). These pollutants are defined and described in Table 1. 22
This Technical Memorandum reviews criteria pollutants and HAPs within the Proposed Action’s ROI based 23 on federal, state, and local (i.e., Prince George’s County) requirements. Since GHGs are relatively stable 24 in the atmosphere and are essentially uniformly mixed throughout the troposphere and stratosphere, GHG 25 emissions are reviewed on a broader scale at the state (i.e., regional) level. 26
Treasury received comments related to air quality from stakeholders during the public scoping period. 27 These comments primarily concerned the potential impacts of air pollution from the currency manufacturing 28 process. Multiple stakeholders commented regarding potential climate change impacts. One comment 29 noted that Treasury should complete a General Conformity Analysis. Please refer to Treasury’s Public 30 Scoping Report for further details on the comments received during the scoping period. Each of these 31 comments is considered and addressed in this analysis. 32
1.2 Affected Environment 33
1.2.1 Region of Influence 34
The ROI for this analysis is Prince George’s County and the National Capital Region (NCR) (see Figure 35
1). The USEPA uses regional, contiguous geographic areas to determine an area’s NAAQS compliance, 36
such as a county, city, or other regionally connected areas. The USEPA includes the Project Site within 37
Prince George’s County to determine the area’s NAAQS attainment status (USEPA, 2019c). Further, the 38
CAA defines larger regional, contiguous geographic areas that have relatively uniform air quality conditions 39
as Air Quality Control Regions (AQCRs). Both the Project Site and the Bureau of Engraving and Printing’s 40
(BEP’s) Washington, DC Facility (DC Facility) are in the “National Capital Interstate” AQCR, which is 41
equivalent to the NCR (40 Code of Federal Regulations [CFR] 81.12). 42
US Army Corps of Engineers – Baltimore District US Department of the Treasury
Proposed Currency Production Facility November 6, 2020 I 2 Air Quality Technical Memorandum
43
Figure 1: Air Quality ROI 44
US Army Corps of Engineers – Baltimore District US Department of the Treasury
Proposed Currency Production Facility November 6, 2020 I 3 Air Quality Technical Memorandum
Table 1: Air Quality Pollutants Relevant to the Proposed Action 45
Pollutant Definition/Description Notability
Criteria Pollutants
Ambient air pollutants that are considered harmful to public health, the environment, and welfare, and regulated under the NAAQS.
Primary NAAQS protect general public health and the health of sensitive populations, which includes children, the elderly, and the infirmed. Secondary NAAQS protect public welfare as it depends on such things as visibility changes and damage to crops, vegetation, and buildings (40 CFR Part 50).
Ozone (O3)
Criteria pollutant that results from a chemical reaction of volatile organic compounds (VOCs) and oxides of nitrogen (NOx) in the presence of sunlight.
Breathing O3 can trigger health issues in humans, such as asthma, chest pain, coughing, and throat irritation or inflammation. Ground-level O3 can also cause or contribute to problems in natural ecosystems through vegetation disease, decreased plant growth, and reduced photosynthesis by hindering sunlight.
Volatile Organic Compounds
(VOCs)
Emitted as off-gases from certain solids and liquids with varying VOC contents, such as inks, cleaning solvents, paints, paint thinners, diesel fuel, and other oil-based and chemical solvents and solutions.
VOCs and NOx are O3 precursors because their presence, along with sunlight, is necessary for the creation of O3 in the atmosphere.
Nitrogen Oxides (NOx)
Emitted from fuel-burning equipment and sources, such as vehicles, boilers, and power plants.
Nitrogen Dioxide (NO2)
Criteria pollutant that is primarily emitted from stationary sources and can be a major concern at large stationary point sources, such as fossil fuel power plants or other heavy industrial sources.
Can cause or contribute to adverse effects in humans when inhaled, such as asthma and other respiratory problems.
Sulfur Dioxide (SO2)
Criteria pollutant that is primarily emitted from stationary sources that use sulfur-containing fuels, such as oil and coal.
Can cause or contribute to respiratory problems in humans when inhaled, can damage or decrease the growth of vegetation, and can cause a reduced visibility in the atmosphere through haze.
Carbon Monoxide (CO)
Criteria pollutant that is primarily emitted by fuel combustion of stationary and mobile sources.
Can cause or contribute to serious health effects by decreasing oxygen delivery throughout the body (when breathed in by humans). If inhaled at extremely high levels, CO can cause death.
Particulate Matter less than 10 microns in
diameter (PM10)
Criteria pollutant emitted from both stationary and mobile sources and may be either in the form of liquid droplets or solids suspended in the atmosphere. Heavy duty diesel-powered vehicles, such as buses and large construction equipment and trucks, are a significant source of fine particulate matter.
Can cause or contribute to serious respiratory problems in humans when breathed in and is the main cause of reduced visibility in the atmosphere through haze. Can also be a part of “fugitive emissions”, which are emissions that do not pass through a stack or vent, such as non-contained dust outdoors (40 CFR 70.2). Fugitive dust emissions are typically temporary (i.e., only generated during a project’s construction phase).
US Army Corps of Engineers – Baltimore District US Department of the Treasury
Proposed Currency Production Facility November 6, 2020 I 4 Air Quality Technical Memorandum
Pollutant Definition/Description Notability
Lead (Pb)1
Criteria pollutant typically associated with industrial sources and vehicles that use leaded fuel. (Note: The CAA banned the sale of leaded fuel in 1996.)
Can cause or contribute to adverse effects to humans’ internal organs and functions, most commonly neurological effects in children and cardiovascular effects in adults. Pb in the environment can contaminate soil and water, resulting in decreased growth and reproductive issues in plants and animals.
HAPs
Under Section 112 of the CAA, the USEPA regulates 187 HAPs (42 US Code [USC] 7412). Examples include benzene (found in gasoline), perchloroethlyene (emitted from some dry-cleaning facilities), and methylene chloride (used as a solvent and paint stripper).
Known or suspected to cause cancer or other serious health effects, such as reproductive effects or birth defects, or have adverse environmental and ecological effects.
TAPs
Under COMAR 26.11.16.07, the state includes as TAPs all 187 HAPs and any of the listed pollutants in COMAR 26.11.16.06 and .07, plus any other air pollutant that is considered a health hazard as defined by the Occupational Safety and Health Administration (OSHA). Examples of TAPs that are not considered HAPs by the USEPA include ethyl oxalate (used in pharmaceutical manufacturing), diethyl ketone (used in paint production), and dichlorophen (used as an antimicrobial agent).
Can cause cancer or other serious health effects or have adverse environmental and ecological effects. Of the state-listed TAPs, 259 are listed as known, probable, or potentially carcinogenic pollutants (COMAR 26.11.16.06). If not considered exempt as a small emitter, emissions of TAPs could require an ambient impact analysis based on screening levels described in COMAR 26.11.16.03.
GHGs
Gas emissions from natural processes (e.g., water vapor) and human activities that trap heat in the atmosphere. Human-activity GHG emissions include carbon dioxide (CO2), methane, nitrous oxide, hydrofluorocarbons, perfluorocarbons, sulfur hexafluoride, and other fluorinated gases.
Scientific evidence indicates that GHGs in the Earth’s atmosphere are accelerating a rise in global temperature and affecting global climate patterns.
Table 2 identifies federal, state, and local guidance and regulations relevant and applicable to this analysis. 49 Treasury would comply with all federal, state, and local air quality laws and regulations while constructing 50 and operating the Proposed Action. 51
1 No significant sources of Pb are associated with the Proposed Action; therefore, Pb emissions are not considered in this analysis.
US Army Corps of Engineers – Baltimore District US Department of the Treasury
Proposed Currency Production Facility November 6, 2020 I 5 Air Quality Technical Memorandum
Table 2: Air Quality Applicable Guidance and Regulations 52
Guidance/Regulation Description/Applicability to Proposed Action
Federal
Anti-backsliding rules (80 Federal Register [FR] 12264 and 81 FR 58010)
Ensures that areas previously designated as non-attainment do not reverse air quality improvement progress by removing certain emission controls and standards in place, even after a non-attainment status or NAAQS standard is revoked.
General Conformity Rule (40 CFR 51 and 93)
Requires federal actions or federally funded actions planned to occur in a non-attainment or maintenance area to be reviewed prior to their implementation to ensure that the actions would not interfere with state’s plans to meet or maintain the NAAQS. Considers the total direct and indirect emissions of a proposed action under a General Conformity Analysis. Requires a General Conformity Determination if the projected air emissions are not below de minimis levels specified in 40 CFR 93.153. De minimis levels are minimum thresholds for criteria pollutants in non-attainment and maintenance areas.
Ozone Transport Region (42 USC 7511c)
Designates a region from Northern Virginia to Maine where there may be stricter ozone standards. 40 CFR 93.153 of the General Conformity Rule establishes de minimis levels for ozone precursors (i.e., VOC and NOx) that may be more restrictive in this region.
New Source Performance Standards (NSPS)
(40 CFR 60)
Establishes standards to minimize emissions of criteria pollutants and HAPs from specific types of man-made, stationary emission sources (USEPA, 2019d). Applies to sources that are new, reconstructed, or modified. Authorized under Section 111 of the CAA.
National Emission Standards for Hazardous Air Pollutants
(NESHAP) (40 CFR 63)
Establishes standards for various HAPs and standard source categories according to Maximum Achievable Control Technology (MACT) or Generally Available Control Technology (GACT) requirements (USEPA, 2019e). Authorized under Section 112 of the CAA.
Prevention of Significant Deterioration (PSD)
(40 CFR 51.166 and 52.21)
Establishes requirements for new major sources in attainment areas, such as installing Best Available Control Technology (BACT). Major sources are stationary sources, or groups of stationary sources, with a potential to emit (PTE)2 more than major source thresholds specified in 40 CFR 70.2. Aims to protect public health and welfare, air quality in areas of special value, and economic growth that is consistent with existing air quality preservation (USEPA, 2019f). Includes regulations on GHGs.
Federal Mobile Emission Standards
(42 USC 7521-7590)
Establishes emission standards for manufactures and operators of mobile sources, such as engine and fuel requirements to reduce mobile sources pollution. Include regulations on GHGs. Authorized under Section 202 of the CAA.
Title V Permit Program (40 CFR 71 and COMAR
26.11.03)
Requires major sources to obtain a federal Title V operating permit (as specified in Title V of the CAA) (USEPA, 2018c). Includes regulations on GHGs. Authorized under Section 112 of the CAA and enforced under Section 502 of the CAA.
State Implementation Plan (SIP)
(40 CFR 51 and 52)
Requires each state to submit a SIP that supports the implementation, maintenance, and enforcement of air quality standards. Authorized under Section 110 of the CAA.
2 The USEPA defines PTE as the maximum capacity of a source to emit when considered with its physical and operational design, including any limitations on the source that are enforceable by the USEPA, such as air pollution controls, operational restrictions, and regulatory requirements (USEPA, 1998). Permitting requirements, such as under Title V, are based on a source’s PTE. A source’s “actual” emissions, or those emissions actually emitted under normal operating conditions, are typically lower.
US Army Corps of Engineers – Baltimore District US Department of the Treasury
Proposed Currency Production Facility November 6, 2020 I 6 Air Quality Technical Memorandum
Guidance/Regulation Description/Applicability to Proposed Action
Maryland
Maryland Air Quality Permits (COMAR 26.11.02)
Maryland Department of Environmental (MDE) requires permits for the construction and operation of non-exempt emission sources and fuel-burning equipment, such as boilers and emergency generators (MDE, 2019b).
Maryland Particulate Matter Standards from Materials
Handling and Construction (COMAR 26.11.06.3D)
Establishes a requirement that reasonable precautions must be taken during materials handling and construction that prevent PM from becoming airborne (i.e., fugitive dust). Reasonable precautions may include covering stockpiles and spraying water on surfaces.
Maryland Stationary Source Standards
(COMAR 26.11.06 and 26.11.09)
Establishes standards on the construction and use of stationary emission sources such as fuel-burning equipment and internal combustion engines. Includes controls on visible emissions, sulfur oxides, and NOx emissions from major stationary sources.
Maryland Asphalt Paving Standards
(COMAR 26.11.11.02)
Restricts the use of cutback asphalt (asphalt cement that is blended with VOCs) unless certain provisions are necessary: (1) long-life stockpile storage; (2) the use or application between October 15-April 15; or (3) sole-use as a penetrating prime coat.
Maryland TAPs Regulations (COMAR 26.11.15 and
26.11.16)
Establishes standards and requirements for TAPs. Standards and requirements for applicable stationary sources include quantification of TAP emissions, application of BACT for toxics (T-BACT) on new sources, and performance of an ambient impact analysis for human health using state-established screening levels.
Maryland VOC Emission Control Standards from
Lithographic and Letterpress Printing
(COMAR 26.11.19.11)
Establishes VOC emission standards for operators of lithographic and letterpress presses, including requirements on VOC content in materials used, testing VOC control devices, and record keeping.
Maryland’s GHG Reduction Act of 2009, as updated in
2015
Founded on a Maryland Commission on Climate Change climate action plan, it requires the state to reduce baseline 2006 GHG emission by 25 percent by 2020 in a way that has a positive benefit to the state economy. In 2015, an updated version included a 40 percent reduction from 2006 levels by 2030 (MDE, 2019c).
Prince George’s County
County Code Section 19-101 Prince George’s County adopted MDE’s air quality regulations listed under COMAR 26.11. Summaries of these regulations are shown in the “Maryland” section of this table.
County Code Section 19-104 and 19-105
Establishes open burning regulations for areas outside (19-104) and inside (19-105) the Capital Beltway (Interstate-95). Outside the Capital Beltway, an open fire permit is required for any open burning activity except for recreational cooking fires (e.g., campfires and bonfires), and devices designed for space heating. Inside the Capital Beltway, a permit is required for all open burning activities except for fire prevention, firefighter training, protection of public health (e.g., disposing of hazardous materials if no other means of disposal are available), recreational cooking fires, and agricultural operations (e.g., growing crops or raising livestock).
US Army Corps of Engineers – Baltimore District US Department of the Treasury
Proposed Currency Production Facility November 6, 2020 I 7 Air Quality Technical Memorandum
1.2.3 Existing Conditions 54
Regional Overview 55
Prince George’s County is in marginal non-attainment for 2015 8-hour O3 and in maintenance for 2008 8-56 hour O3 and 1971 CO. Prince George’s County was designated as maintenance for 2008 8-hour O3 and 57 1971 CO in May 2019 and March 1996, respectively. Prince George’s County was previously in 58 maintenance for 1979 1-hour O3, 1997 8-hour O3, and 1997 PM2.5. However, the NAAQS for these three 59 pollutants were revoked in June 2005, April 2015, and October 2016, respectively (USEPA, 2019c). While 60 revoked standards are no longer in effect, anti-backsliding rules could still apply (see Table 2). 61
The MDE maintains an Ambient Air Monitoring Program with 24 air monitors around the state that measure 62 ground-level concentrations of criteria pollutants and HAPs (MDE, 2019d). Three of these stations are in 63 Prince George’s County, with two of those within the unincorporated city of Beltsville: 64
• HU-Beltsville: This station is located north of Odell Road on the Howard University (HU) Beltsville 65 Campus. This station measures all criteria pollutants except for Pb. This station is located 66 approximately 1 mile north of the Project Site. 67
• Beltsville-CASTNET: This station is located on the East Airfield at the Beltsville Agricultural 68 Research Center (BARC). It is part of the USEPA’s Clean Air Status and Trends Network 69 (CASTNET), a national monitoring network of 97 sites that assess pollutant and atmospheric trends 70 and changes across the United States (USEPA, 2019g). This station measures O3. This station is 71 located approximately 3 miles southeast of the Project Site. 72
The MDE reports the daily and annual measurements of these stations to the USEPA’s Air Quality System 73 where the data is accessible on the USEPA’s Air Data website (USEPA, 2019h). The 2019 criteria pollutant 74 measurements (and 2018 and 2017 when applicable for averaging) for HU-Beltsville and Beltsville-75 CASTNET compared to the NAAQS are provided in Table 3. 76
Table 3: 2019 MDE Ambient Air Monitoring Station Measurements Compared to the NAAQS 77
Criteria Pollutant and Station
Station Measurement
P/S1 NAAQS Averaging
Time Type of Measurement
Exceeds NAAQS
CO HU-Beltsville
0.8 parts per million (ppm)
P: 9 ppm 8 hours Not to be exceeded in a year No
1.04 ppm P: 35 ppm 1 hour
SO2 HU-Beltsville
0.003 ppm P: 0.075 ppm 1 hour 99th percentile 3-year average No
0.006 ppm S: 0.5 ppm 3 hours Not to be exceeded in a year
P&S: 150 μg/m3 24 hours Not to be exceeded in a year
on a 3-year average No
PM2.5
HU-Beltsville 6.77 μg/m3 P: 12 μg/m3 1 year Annual mean 3-year average
No 15 μg/m3 P&S: 35 μg/m3 24 hours 98th percentile 3-year average
O3 HU-Beltsville
0.07 ppm P&S: 0.070 ppm 8 hours Annual fourth-highest daily maximum 3-year average
Yes
O3 Beltsville-CASTNET
0.073 ppm P&S: 0.070 ppm 8 hours Annual fourth-highest daily maximum 3-year average
Yes
1. Primary / Secondary NAAQS 78 2. The NAAQS are expressed as a concentration in the air and as a duration of exposure to a criteria pollutant, often 79
including both short-term and long-term exposure. 80
US Army Corps of Engineers – Baltimore District US Department of the Treasury
Proposed Currency Production Facility November 6, 2020 I 8 Air Quality Technical Memorandum
Maryland’s GHG Emission Reduction Act (see Table 2) requires the MDE to inventory statewide GHG 81
emissions on a 3-year cycle. The most recent inventory in 2017 found annual state-wide GHG emissions 82
to be approximately 78,493,210 metric tons of CO2 equivalent (CO2e)3 (not including sinks). 83
In 2017, the sector that contributed the most to GHG emissions in Maryland was transportation at 84 approximately 41 percent of the total GHG emissions. The electricity production sector was approximately 85 30 percent of the total, with other sectors rounding out the total (MDE, 2019e). 86
For comparison, the 2017 GHG emissions in Washington, DC and the United States were approximately 87 7,328,971 and 6,456,700,000 metric tons of CO2e, respectively. As with the state of Maryland, the 88 transportation sector was the largest producer of GHGs in the United States. In Washington, DC, 89 commercial and industrial buildings, and particularly their energy use, were the largest producer of GHGs 90 (USEPA, 2019i; DDOE, 2017). 91
Treasury’s Existing Air Emission Sources and Emissions 92
The BEP’s DC Facility currently holds a Title V permit (Permit Number 035-R1). The Title V permit contains 93 general details such as reporting requirements, fugitive dust control, fuel oil content and quality, and general 94 equipment operation. The Title V permit also contains emission limitations and unit-specific requirements 95 (e.g., monitoring, recordkeeping, testing, maintenance, and reporting) for stationary air emission sources, 96 such as diesel emergency generators, a paint shop, currency presses (e.g., printing – lithographic and 97 letterpress), and plating lines. Treasury submits Semi-Annual Monitoring Reports and Annual Compliance 98 Certifications to the Washington, DC Department of Energy and Environment and the USEPA in accordance 99 with Title V requirements (BEP, 2018). 100
The BEP’s Western Currency Facility (WCF) does not require a Title V permit because its PTE emissions 101 are below the applicable major source thresholds in its region (BEP, 2015). Currently, neither the DC Facility 102 nor the WCF are in violation of the CAA and both facilities have been in CAA compliance for at least the 103 past three years (USEPA, 2019j; USEPA, 2019k). 104
VOCs from inks and cleaning solvents are the main pollutant of concern when operating currency presses. 105 Treasury implements various VOC limitations and operating controls for the presses as required, such as: 106
• Limitations on the VOC content in inks and cleaning solvents in the DC Facility. 107
• Use of a thermal oxidizer in the WCF that breaks down VOCs into CO2 and water. 108
• Limitations on press operating hours. 109
• Implementing technologies and process changes that improve efficiency and reduce consumption 110 of inks and solvents. 111
• Best management practices when using inks and cleaning solvents (e.g., storage of VOC-112 containing materials in a manner that prevents their evaporation, only opening VOC-containing 113 materials containers when necessary, and maintaining ink and cleaning solvent usage records). 114
Besides VOCs, all other criteria pollutants are emitted from natural gas boilers and diesel fuel use in 115 emergency generators and fire pumps at the BEP’s facilities. The majority of PM is produced in the Central 116 Trim Line, which is the collector of the “trim” during paper processing. However, most of the PM produced 117
3 Each GHG is assigned a global warming potential, which refers to the ability of a gas or aerosol to trap heat in the atmosphere. The global warming potential rating system is standardized to CO2, which has a value of one. The equivalent CO2 rate is calculated by multiplying the emissions of each GHG by its global warming potential and adding the results together to produce a single, combined emissions rate representing all GHGs, referred to as the CO2 equivalent (CO2e) (Yale Climate Connections, 2009).
US Army Corps of Engineers – Baltimore District US Department of the Treasury
Proposed Currency Production Facility November 6, 2020 I 9 Air Quality Technical Memorandum
in the Central Trim Line is not directly emitted into the atmosphere; it is exhausted through a mechanical 118 baghouse that collects the dust before it reaches the atmosphere. 119
Table 4 shows the PTE emissions from stationary sources at the DC Facility and WCF (BEP, 2015; BEP, 120 2010). For comparative purposes, Table 4 also shows the actual emissions from stationary sources at the 121 DC Facility in 2018, which are substantially lower than the DC Facility’s PTE emissions (BEP, 2018). 122 Emissions from mobile sources on-site at the DC Facility and WCF, such as from employee’s privately-123 owned vehicles (POVs) and delivery trucks, are intermittent and only generated when vehicles are in 124 operation to comply with vehicle idling restrictions. Emissions data from these intermittent mobile sources 125 are not available. 126
Table 4: Treasury’s Emissions from Current Operations (Current Conditions) 127
Pollutant Sources
DC Facility 2018 Actual (tons per
year [tpy], or metric tons CO2e
for GHGs)
DC Facility PTE (tpy)
WCF PTE (tpy) and 2018 Actual
GHGs (metric tons CO2e)1
VOCs
presses (primary), paint shop, diesel emergency generators, fire pumps, ink
solids handling, and miscellaneous sources2
22.63 83.12 43.70
Combined HAPs
presses (primary), paint shop, diesel emergency generators, fire pumps, and
miscellaneous sources2 0.16 4.61 0.98
HAP: Chromium
plating lines 2.99E-06 8.70E-04 <0.01
HAP: Nickel plating lines 5.59E-05 2.00E-03 0.04
PM Central Trim System (primary), diesel
emergency generators, fire pumps, and ink solids handling
0.06 2.39 2.75
NOx diesel emergency generators and fire
pumps 0.32 7.07 5.13
SO2 diesel emergency generators, fire
pumps, and plating lines 0.00 0.03 0.02
CO diesel emergency generators and fire
pumps 0.02 0.60 10.23
GHGs3 various stationary sources, including
presses, diesel emergency generators, and fire pumps
21,9743 N/A 21,932
Sources: (BEP, 2010; BEP, 2015; BEP, 2018) 128 1. WCF PTE calculations, besides printing operations, include only emissions from the thermal oxidizer and do not 129
include diesel emergency generators or boilers. 130 2. Miscellaneous sources are those considered to be “insignificant activities” in the Title V permit. These include, but 131
are not limited to, small shop operations (e.g., carpentry, electrical, masonry), a small laboratory with fume hoods, 132 and small stationary fuel burning equipment (e.g., kitchen equipment) (BEP, 2018). 133
3. The Landover warehouse contributes 781 metric tons of CO2e to this total. 134
The BEP has been very effective in reducing emissions of HAPs from its production operations through a 135
series of material substitutions, reformulations, and operational controls, and as a result, BEP facilities are 136
minor sources of HAPs. Use of inks and cleaning solvents, paints, and natural gas and diesel fuel generates 137
small amounts of HAP emissions. Trace amounts of glycol ethers and xylenes may be present in inks and 138
cleaning solvents, respectively. The BEP’s paint shops primarily use water-based, HAP-free paints, with 139
the exception of a stain that contains trace quantities of HAPs. Natural gas and diesel fuel may contain 140
trace amounts of HAPs, such as acetaldehyde, benzene, formaldehyde, and propylene (BEP, 2018). 141
US Army Corps of Engineers – Baltimore District US Department of the Treasury
Proposed Currency Production Facility November 6, 2020 I 10 Air Quality Technical Memorandum
Currency press operation emissions do not include formaldehyde, which was eliminated from currency 142
paper in the 1980s (BEP, 2019a). 143
Additionally, HAP emissions in the currency production process include trace amounts of nickel and 144 chromium compounds emitted from the plating lines. Line plating techniques involve forming nickel printing 145 plates in electrolytic tanks, and then placing a thin layer of chromium on the surface of the plates to increase 146 their corrosion and wear resistance. Treasury controls emissions from plating lines with scrubbers. 147
Treasury’s environmental mission strives to reduce regulated air emissions. Since 1999, Treasury has 148
reduced its air emissions from BEP facilities by more than 55 percent by replacing old presses with 149
resource-efficient presses that reduce the overall consumption of inks, solvents, and water; using solvents 150
with lower VOC contents; installing VOC and HAP controls; and eliminating certain processes. Treasury’s 151
emphasis on energy and operational efficiency has reduced the BEP’s GHG emissions by approximately 152
30 percent since 2008 (or 20,000 metric tons of CO2e per year) (BEP, 2019a). 153
Current and planned projects for future emission reductions include replacing nickel plate electroforming 154
with laser engraving, chromium electroplating with an emission-free physical vapor deposition plating 155
process, evaluating the use of additional inks and solvents with low VOC contents (e.g., ultraviolet [UV] 156
inks), evaluating the use of additional emissions and process controls, using electricity from renewable 157
energy sources, and continuing to conduct comprehensive air emission and GHG evaluations (BEP, 158
2019a). 159
Project Site 160
Existing air emissions on the Project Site are minimal; most of the buildings at the site are unused and no 161 longer generate air emissions (e.g., from heating, ventilating, and air conditioning equipment equipment). 162 Minor emissions from mobile sources are present when vehicles are on-site intermittently. No sensitive air 163 quality receptors, including children, the elderly, or the infirm, are present on the Project Site. 164
Off-site sensitive receptors, defined as those within 1,500 feet of the Project Site where localized air quality 165 impacts (e.g., dust) would be most noticeable, include the following (see Figure 2): 166
• Children, elderly, and infirmed persons who may live in the approximately 391 residential properties 167 along Odell Road and in the Vansville community. 168
• Children at Touch of Eden Daycare and Vansville Elementary School (located approximately 1,300 169 and 1,500 feet north of the Project Site, respectively). 170
• Children, elderly, and infirmed users of the Vansville Recreation Center (located approximately 171 1,500 feet north of the Project Site). 172
• Elderly or infirm employees who may work in the approximately 61 BARC facilities west, south, and 173 east of the Project Site in the ROI. 174
For additional information on sensitive receptors in the ROI and region, as well as Environmental Justice 175 populations, please refer to the Socioeconomics and Environmental Justice Technical Memorandum. 176
US Army Corps of Engineers – Baltimore District US Department of the Treasury
Proposed Currency Production Facility November 6, 2020 I 11 Air Quality Technical Memorandum
177
Figure 2: Potential Air Quality Sensitive Receptors 178
US Army Corps of Engineers – Baltimore District US Department of the Treasury
Proposed Currency Production Facility November 6, 2020 I 12 Air Quality Technical Memorandum
1.3 Environmental Effects 179
This section identifies the potential impacts to air quality within the ROI that would occur under the Proposed 180 Action (i.e., Preferred Alternative) and the No Action Alternative. Measures to reduce potential adverse air 181 quality effects from the Proposed Action are identified. 182
1.3.1 Approach to the Analysis 183
Treasury developed preliminary, conservative Proposed Action emission projections for all criteria pollutants 184 (except for Pb, as the Proposed Action would not emit Pb), fugitive dust, HAPs, and GHGs to support this 185 impact analysis. These projections are based on conservative assumptions and best available data, as 186 discussed below. While these projections provide a framework for potential impact analysis, they are subject 187 to change based on the final design of the proposed CPF during the final design and permitting phases. 188
As noted previously, air quality permitting is conducted based on a facility’s PTE emissions, despite these 189 values typically being substantially greater than the facility’s actual emissions. In accordance with this 190 methodology, Treasury estimated PTE emissions for the construction phase of the Proposed Action. These 191 PTE estimates are conservative and are based on both standard construction processes and the 192 assumptions identified in Table 5 and Appendix A. 193
However, since the Proposed Action is still in the early conceptual design process and includes various 194 uncertainties regarding its operational capacity, Treasury determined that developing PTE emissions 195 estimates for operation of the proposed CPF at this stage would be premature. For example, changes to 196 the following factors could substantively affect Treasury’s PTE emissions estimates between the conceptual 197 design phase and the permitting phase: 198
• Currency design. 199
• Amount of printed currency required. 200
• Ink formulations (e.g., use of UV cured inks). 201
• Design of printing presses to achieve printing efficiencies. 202
• Use of additional operational and control measures to minimize ink consumption and VOC 203 emissions. 204
Therefore, instead of PTE emissions estimates, Treasury developed “projected actual” emission estimates 205 on which to base the operational impact analysis. These projected actuals reflect the emissions that 206 Treasury conservatively anticipates the proposed Currency Production Facility (CPF) to actually generate 207 based on its best available data, including the following: 208
• Historical consumption data for printing operations from existing facilities over a 3 year period 209 (calendar years 2017 – 2019). To be conservative, Treasury used average emissions values from 210 this time period even when the data clearly indicate a 3-year downward trend. 211
• Consideration of potential emission increases based on the number of sheets printed per hour or 212 proposed number of presses at the proposed CPF. 213
To analyze the potential impacts of the proposed CPF, Treasury compares these projected actual emissions 214 from the proposed CPF to the historical emissions data for the DC Facility under existing conditions. 215
Additionally, because this is a federal Proposed Action in a non-attainment and maintenance area, Treasury 216 completed a General Conformity Analysis (see Appendix A). For the purposes of the General Conformity 217 Analysis, Treasury compared projected criteria pollutant emissions to the applicable de minimis levels 218 specified in Maryland’s federally enforceable SIP: 25 tpy for VOCs and NOx, and 100 tpy for each other 219
US Army Corps of Engineers – Baltimore District US Department of the Treasury
Proposed Currency Production Facility November 6, 2020 I 13 Air Quality Technical Memorandum
criteria pollutant. Although the conformity analysis is required only for non-attainment or maintenance area 220 pollutants (i.e., O3 in Prince George’s County), the tables present emissions from all pollutants and compare 221 the values with the de minimis levels (major source thresholds). 222
Treasury also compared projected actual HAP emissions for stationary sources to applicable major source 223 thresholds specified in 40 CFR 70.2: 10 tpy for a single HAP or 25 tpy for any combination of HAPs. 224
For this analysis, Treasury assumed that a significant impact would occur if the Proposed Action would 225 generate or induce: 226
• Projected actual criteria pollutant emission levels that exceed NAAQS de minimis levels. 227
• Fugitive dust emissions that would cause substantial long-term visibility or health issues or would 228 substantially adversely affect off-site sensitive receptors in the vicinity of the Project Site. 229
• Projected actual HAP emissions that would exceed major source thresholds. 230
• GHG emissions that would be noticeable on a regional level. 231
Additional detail regarding the specific analyses of criteria pollutants, fugitive dust, HAPs, and GHGs, 232
including Treasury’s assumptions, are provided below. 233
Criteria Pollutant Emissions 234
Treasury estimated criteria pollutant PTE emissions for the proposed construction equipment and related 235 activities. Treasury also calculated projected actual criteria pollutant emissions from permanent stationary 236 equipment associated with operation of the proposed CPF. These calculations, and associated data 237 sources, are provided in Appendix A. Loading factors and emission factors for the proposed construction 238 and stationary equipment are from USEPA’s AP-42 (and subsequent revisions) (USEPA, 1995), the Air 239 Emissions Guide for Air Force Mobile Sources (AFCEC, 2018a), and the Air Emissions Guide for Air Force 240 Stationary Sources (AFCEC, 2018b)4. Treasury’s general assumptions used to conduct this analysis are 241 provided in Table 55. 242
Treasury also considered existing conditions at the DC Facility and WCF when calculating and analyzing 243 the proposed CPF’s projected actual criteria pollutant emissions: 244
• Emergency generators at the proposed CPF would only operate during testing, maintenance, and 245 emergencies (e.g., a power outage). The two emergency generators at the DC Facility ran for a 246 combined total of approximately 121 hours in 2018. Using that number as a basis, Treasury 247 conservatively estimated the proposed CPF’s emergency generators would run for 200 hours per 248 year under actual operations. 249
• The WCF boilers consumed approximately 40 million cubic feet of natural gas in 20186 (BEP, 250 2019c). Using that number as a basis, Treasury estimated the proposed CPF’s natural gas boilers 251 would consume 40 million cubic feet per year under actual operations. 252
• Truck deliveries between the Landover, MD and DC Facilities would be eliminated under the 253 Proposed Action, and full-sized loading docks at the proposed CPF could reduce delivery truck 254 numbers when compared to those associated with the DC Facility. 255
4 The Air Emissions Guide for Air Force Mobile Sources (AFCEC, 2018a) and the Air Emissions Guide for Air Force Stationary Sources (AFCEC, 2018b) are used when emission factors are not readily available in USEPA’s compilation of emission factors (AP-42) (USEPA, 1995). These guides are user-friendly and are comprehensively used by DoD agencies to prepare emissions inventories for facilities across the United States and worldwide. 5 Assumptions on construction equipment (e.g., types, horsepower ratings, and numbers) can be found in the calculations in Appendix A. 6 Natural gas equipment at the DC Facility is sized at less than 5 MMBTU. Operation of this equipment is considered “insignificant activities” in the DC Facility’s Title V and is not included in their emission totals.
US Army Corps of Engineers – Baltimore District US Department of the Treasury
Proposed Currency Production Facility November 6, 2020 I 14 Air Quality Technical Memorandum
Table 5: Air Quality Impact Analysis Assumptions 256
During Construction During Operations
Typical workweek would be Monday through Friday.
Typical workday would be 8 hours.
Twenty construction workers in light-duty gasoline POVs would commute to the construction site per construction workday. Construction workers commute from home locations that are local at an estimated average of 10 miles away (i.e., 20 miles round-trip).
Demolition and site preparation would begin in 2021 and be completed by 2022.
Proposed CPF construction would begin in early 2023 and be completed by late 2025.
Construction equipment would be fueled by diesel.
Rock would not be excavated.
There would be 7,278 dump truck trips during construction. Dump trucks would travel 10 miles roundtrip.
In accordance with the cutback asphalt limitation of COMAR 26.11.11.02 (see Table 2), Treasury assumed that cutback asphalt would not be used and VOC emission from asphalt paving would be negligible.
Typical workweek would be Monday through Friday.
The proposed CPF would operate eight Super Orlof Intaglio (SOI) presses, four Simultan presses, four large examining printing equipment (LEPE) presses, and all of the DC Facility’s miscellaneous printing presses.
Since operations at the proposed CPF would be implemented in a phased approach between 2026 and 2028, Treasury assumed that operations would increase by 25 percent annually until reaching full operations in 2029.
The proposed CPF would operate seven natural gas boilers at 6 million British thermal units (BTU) each that have NOx efficiencies greater than or equal to 90 percent (BEP, 2017).
Emergency power would be provided by two emergency generators (BEP, 2017). Treasury assumed that these generators would each be 1,500 kilowatts (kW). The emergency generators would be expected to meet USEPA Tier II requirements and use ultra-low sulfur diesel (ULSD) fuel (i.e., less than 15 ppm by weight). Treasury used manufacturer information and emission factors for a generator that conforms to these assumptions (i.e., a Caterpillar 3512C) for the calculations.
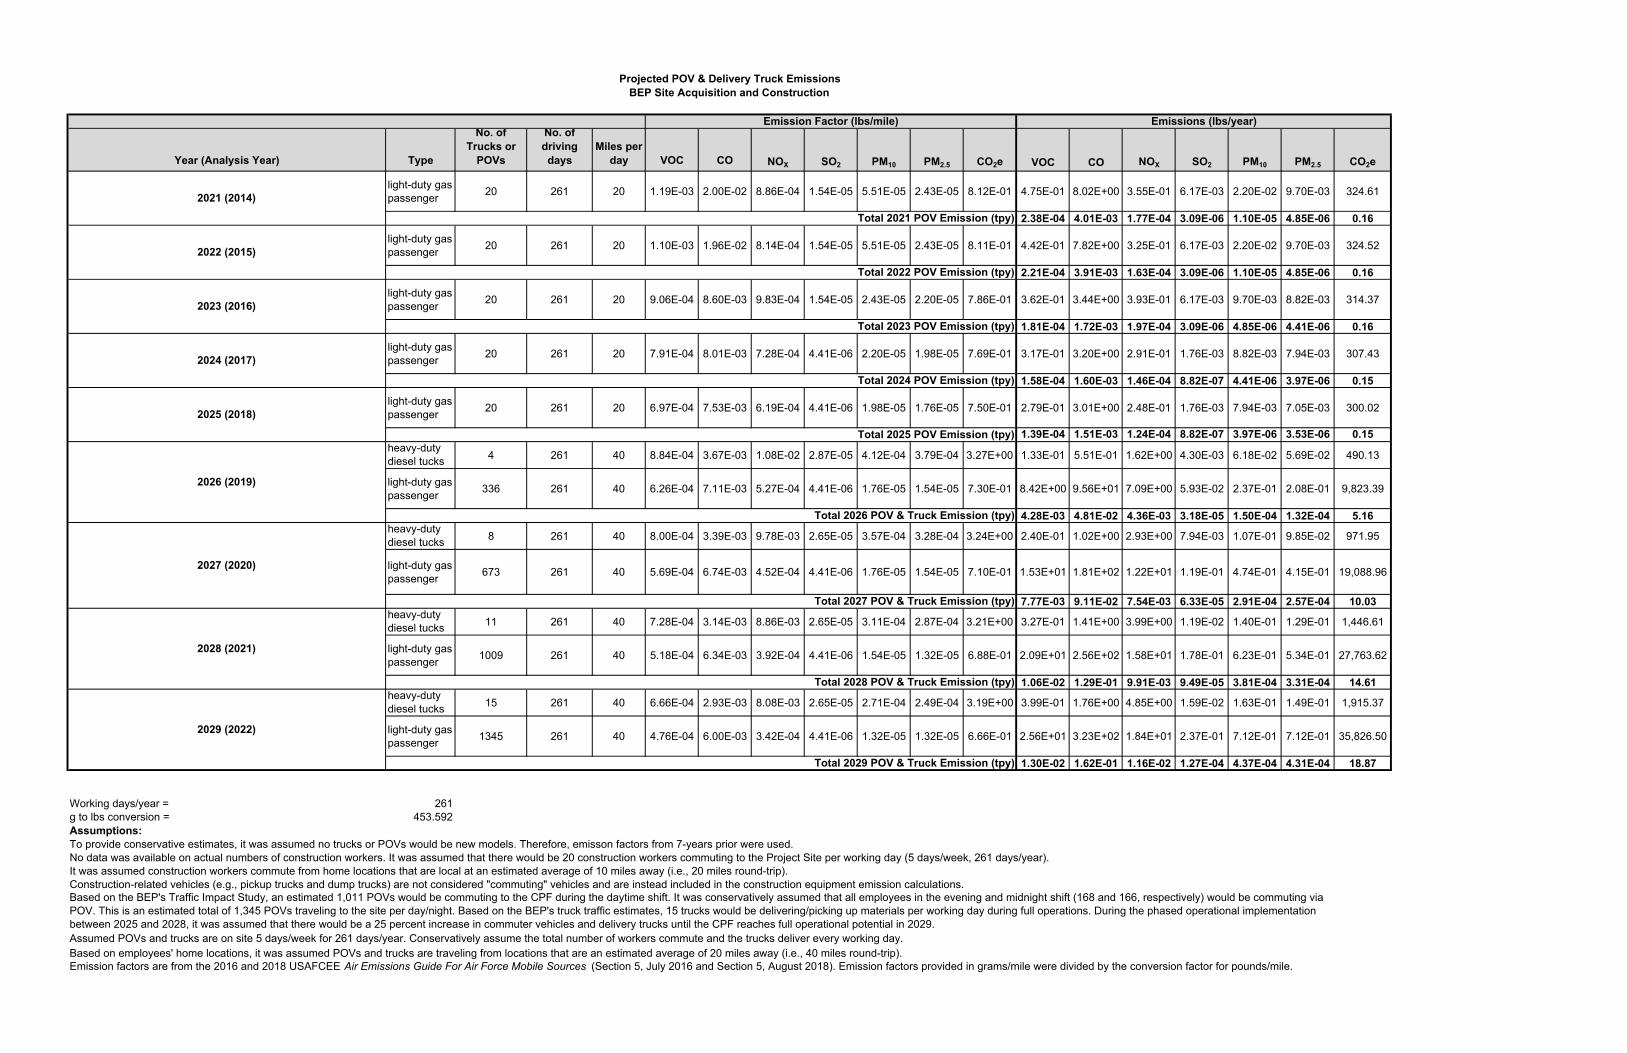
Based on Treasury’s Transportation Impact Study (BEP, 2020), Treasury conservatively assumed 1,345 light duty gasoline POVs would commute per day and night. During the phased operational implementation between 2025 and 2028, Treasury assumes there would be a 25 percent increase annually in commuter POVs until the CPF reaches full operational potential in 2029.
According to Treasury’s truck traffic estimates, an average of 15 heavy-duty diesel trucks would be delivering and/or picking up materials per working day during full operations. During the phased operational implementation between 2025 and 2028, it was assumed that there would be a 25 percent increase annually in delivery trucks until the CPF reaches full operational potential in 2029.
The total number of POVs commute every working day. The total average daily numbers of trucks deliver every working day. POVs and trucks travel from locations that are an estimated average of 20 miles away (i.e., 40 miles round-trip).
Operational GHG emissions from proposed CPF operations were conservatively assumed to be the same as the WCF in 2019 (BEP, 2019b).
US Army Corps of Engineers – Baltimore District US Department of the Treasury
Proposed Currency Production Facility November 6, 2020 I 15 Air Quality Technical Memorandum
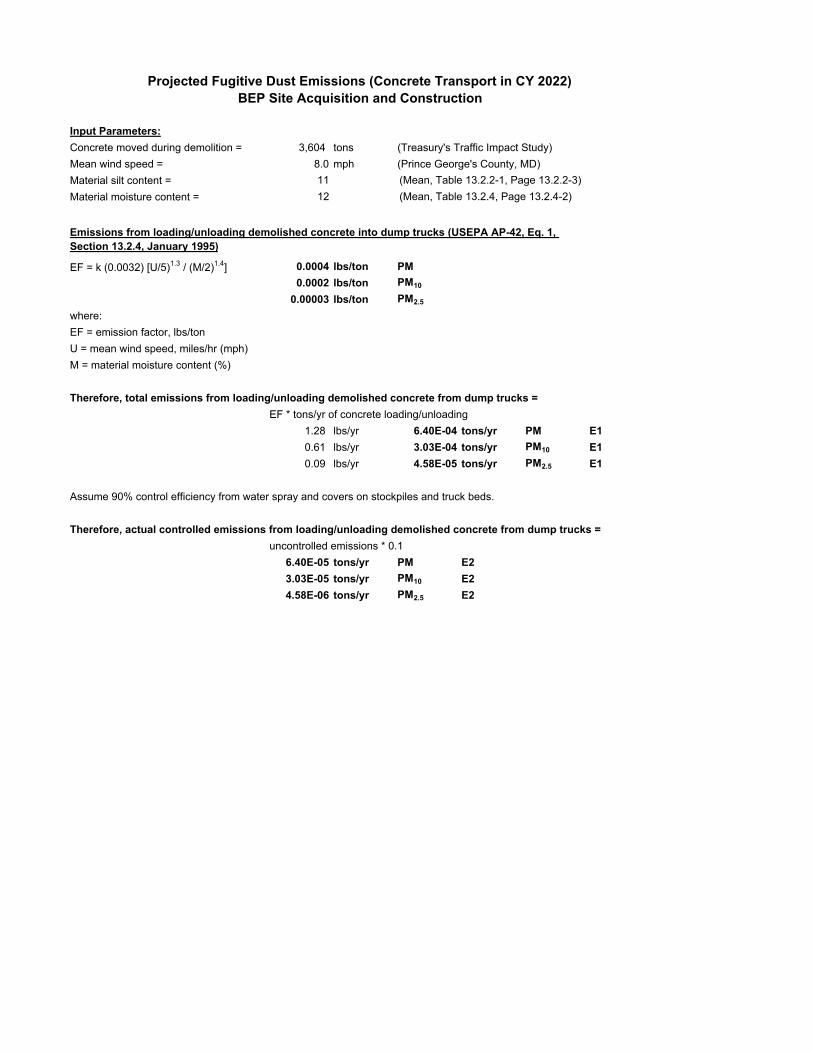
Fugitive Dust Emissions 258
Treasury calculated potential PM10 and PM2.5 emissions for site preparation activities (e.g., vegetation 259 clearing, grading, filling, etc.) and the loading, unloading, and transport of demolished concrete. Treasury’s 260 conservative assumptions for the fugitive dust analysis are as follows: 261
• For site preparation activities, the area of disturbance would be 85 percent of the Project Site. 262
• Site preparation and demolition activities would occur between 2021 and 2022. 263
• Rock would not be excavated. 264
• For PM emissions from demolished concrete and soil transport, a 90 percent control efficiency from 265 water sprays and covers on stockpiles and truck beds would occur. 266
• No heavy truck trips (e.g., dump trucks) would occur on unpaved roads, as the proposed staging 267 areas and transport routes are paved; therefore, PM emissions from heavy trucks travelling on 268 unpaved roads were not incorporated into the emission calculations. 269
Hazardous Air Pollutant Emissions 270
Treasury calculated PTE HAP emissions for proposed construction equipment and related activities 271
associated with the Proposed Action. Treasury also estimated projected actual HAP emissions for 272
permanent stationary equipment associated with operation of the proposed CPF. HAP assumptions used 273
in the analysis are the same as those for criteria pollutants (see Table 5). 274
Greenhouse Gas Emissions 275
Treasury compared projected potential GHG emissions from the Proposed Action against state-wide 2017 276 GHG emissions of 78,493,210 metric tons of CO2e (MDE, 2019e). CO2e emissions were estimated by using 277 emission factors provided by Air Emissions Guide for Air Force Mobile Sources and Air Emissions Guide 278 for Air Force Stationary Sources (AFCEC, 2018a; AFCEC, 2018b). GHG assumptions used in the analysis 279 are the same as those for criteria pollutants (see Table 5). 280
1.3.2 No Action Alternative 281
Under the No Action Alternative, Treasury would not construct or operate the Proposed Action. Treasury 282 would continue to operate the existing DC Facility and the WCF as under current conditions in compliance 283 with air quality regulations (see Section 1.2.2). The Project Site would remain in its current condition. This 284 would not result in the generation of new air pollutant emissions or result in a reduction of existing 285 emissions. Therefore, the No Action Alternative would have no impact on air quality. 286
1.3.3 Preferred Alternative 287
Criteria Pollutant Emissions – Construction 288
Proposed construction activities that would generate criteria pollutant emissions include: 289
• Handling and transport of soil and concrete debris during demolition and site preparation. 290
• Operation of heavy-duty diesel-powered equipment during construction. 291
• Heavy-duty diesel trucks traveling to and from the Project Site to dispose or deliver materials during 292 construction. 293
• POVs used by commuting construction workers. 294
US Army Corps of Engineers – Baltimore District US Department of the Treasury
Proposed Currency Production Facility November 6, 2020 I 16 Air Quality Technical Memorandum
Table 6 shows the estimated criteria pollutant PTE emissions that the Proposed Action would generate 295 during the construction phase would be below the applicable de minimis thresholds. Therefore, potential 296 adverse impacts would remain less-than-significant and a formal General Conformity Determination 297 would not be required for the construction phase. 298
Table 6: Projected PTE Annual Criteria Pollutant Emissions During Construction 299
Emission Source Projected PTE Emissions (tpy) De minimis
Threshold CO NOx VOCs PM10 PM2.5 SO2
Demolition and Site Preparation – 2021
6.67 9.73 1.80 2.82 2.79 0.01
100 tpy for any one criteria pollutant, except for VOCs
and NOx, which is 25 tpy
Demolition and Site Preparation – 2022
5.01 9.35 1.39 2.74 2.72 0.01
Construction – 2023 14.03 19.06 3.46 2.00 1.94 0.02
Construction – 2024 14.04 19.02 3.45 2.01 1.95 0.02
Construction – 2025 12.66 13.78 2.90 1.80 1.75 0.01
Criteria Pollutant Emissions – Operation 300
Proposed operational activities that would generate criteria pollutant emissions include: 301
• Equipment within the CPF, such as currency presses. 302
• Permanent, stationary fuel-burning equipment, such as boilers and emergency generators. 303
• POVs used by commuting employees. 304
• Delivery trucks. 305
Table 7 shows the projected actual criteria pollutant emissions that the Proposed Action would generate 306 during operation7. As the proposed CPF is phased into operation, its criteria pollutant emissions would 307 increase proportionately. Concurrently, the DC Facility would phase out operations, and its criteria pollutant 308 emissions would decrease proportionately. Projected actual emissions of all criteria pollutants from full 309 operation of the Proposed Action would not exceed the NAAQS de minimis levels. As such, the Proposed 310 Action would likely be a minor source of criteria pollutant emissions, not subject to a General Conformity 311 Determination or Title V permit. 312
Table 7: Projected Actual Annual Criteria Pollutant Emissions During Operation 313
Emission Source Projected Actual Emissions (tpy) De minimis and Major
Source Threshold CO NOx VOCs PM10 PM2.5 SO2
Operation – 2026 12.76 11.24 4.60 1.06 1.06 0.04
100 tpy for any one criteria pollutant, except
for VOCs and NOx, which is 25 tpy
Operation – 2027 12.80 11.24 8.75 1.64 1.64 0.04
Operation – 2028 12.84 11.24 12.90 2.23 2.23 0.04
Annual Operations
(full operation) 12.88 11.25 17.06 2.81 2.81 0.04
7 As noted previously, Treasury calculated preliminary projected actual emissions using conservative assumptions based on best available data. These values do not reflect the maximum possible emissions (i.e., PTE emissions), and are subject to change as the design of the proposed CPF progresses.
US Army Corps of Engineers – Baltimore District US Department of the Treasury
Proposed Currency Production Facility November 6, 2020 I 17 Air Quality Technical Memorandum
At the AQCR level, projected actual VOC emissions from the proposed CPF would be lower than those 314 emitted from the DC Facility under existing conditions due to improved controls and efficiencies. Therefore, 315 the Proposed Action would have a beneficial impact on air quality relative to VOC emissions. Emissions 316 of all other criteria pollutants would increase relative to the DC Facility, but remain below applicable major 317 source thresholds, resulting in less-than-significant adverse impacts to the ROI. Near the Project Site 318 (i.e., within 1,500 feet of the proposed CPF), VOC and other criteria pollutant emissions would increase 319 under the Proposed Action, but required construction permits obtained for the emission sources would be 320 in accordance with the Maryland SIP; therefore, any adverse impacts from these emissions would be less-321 than-significant. 322
For permitting purposes, Treasury would likely establish allowable emissions limits of VOCs and NOx 323 pollutants from the proposed CPF at approximately 24 tpy, each, to provide the BEP greater operational 324 flexibility and opportunity to increase emissions from the proposed CPF in the future (while remaining a 325 minor source) if so required to fulfill the BEP’s mission. Each other criteria pollutant has a major source 326 threshold of 100 tpy, which is likely substantially greater than the proposed CPF could potentially emit. 327
Treasury would obtain the required construction and operation permits based on applicability of permit 328 exemptions under COMAR 26.11.02.10. These could include permits to construct and operate boilers, 329 emergency generators, printing operations and miscellaneous sources and associated emission points (i.e., 330 stacks), and certain control equipment (MDE, 2019b). Treasury would also adhere to the applicable federal 331 and state regulations identified in Table 2, such as NSPS, NESHAP, and COMAR 26.11.19.11. 332
As stated earlier, due to uncertainties inherent during the conceptual design phase, the PTE emissions of 333 criteria pollutants from operation of the Proposed Action are difficult to predict at this stage. While Treasury 334 currently believes that operation of the Proposed Action would remain below the applicable major source 335 thresholds in Prince George’s County for all criteria pollutants, it is possible that the BEP could determine 336 during the final design phase that the proposed CPF’s VOC or NOx emissions could exceed the major 337 source thresholds (i.e., 25 tpy for these pollutants). In that case, the proposed CPF would be permitted as 338 a major source in a non-attainment area, and would be subject to stringent requirements under COMAR 339 26.11.17, including a Nonattainment New Source Review analysis and meeting the following requirements: 340
• Certifying that all existing major stationary sources owned or operated by the BEP in the state of 341 Maryland comply with all applicable emission limitations or an approved federally enforceable plan 342 for compliance. 343
• Meeting an emission limitation which specifies the lowest achievable emissions rate. 344
• Obtaining emission offset credits in the area impacted for each criteria pollutant with allowable 345 emissions over the major source threshold (i.e., 25 tpy for VOCs or NOx); 1.3 tpy of emission offset 346 credits must be obtained per 1 tpy of allowable emissions, and they must be obtained and federally 347 enforceable before construction begins. 348
• Performing an analysis of alternative sites, sizes, production processes, and environmental control 349 techniques for the proposed source (i.e., the proposed CPF) to demonstrate that the benefits of the 350 proposed source significantly outweigh the environmental and social costs imposed as a result of 351 its location, construction, or modification. 352
Treasury would comply with these requirements if it determines that the proposed CPF would be a major 353
source of criteria pollutant emissions. Compliance with these requirements would also ensure Treasury 354
abides by General Conformity requirements even if the proposed CPF is permitted as a major source of 355
criteria pollutants. 356
US Army Corps of Engineers – Baltimore District US Department of the Treasury
Proposed Currency Production Facility November 6, 2020 I 18 Air Quality Technical Memorandum
Because Treasury would be required, under this scenario, to obtain emission offset credits at a rate of 1.3:1, 357
the Proposed Action would substantially reduce emissions of those criteria pollutants in the ROI, resulting 358
in a net beneficial impact to air quality in the ROI relative to any pollutants for which it must acquire offsets. 359
Potential impacts from pollutant emissions that do not exceed major source thresholds would be the same 360
as under the minor source scenario. Therefore, even if the Proposed Action is permitted as a major source 361
for one or more pollutants (e.g., VOCs or NOx), potential adverse air quality impacts from criteria pollutants 362
would remain less-than-significant. 363
Finally, if the BEP were to permit the proposed CPF as a major source, the BEP would be required to obtain 364
a Title V operating permit for the facility. A Title V operating permit would require the BEP to submit semi-365
annual monitoring reports for all permitted activities and an annual compliance certification report certifying 366
compliance status of each permit condition. This would ensure that the facility operates in compliance with 367
applicable requirements. 368
Fugitive Dust Emissions 369
Likely sources of fugitive dust during construction of the proposed CPF would include building demolition, 370 handling and transport of demolished materials (e.g., concrete), storage of demolished materials in 371 stockpiles, and site preparation activities (i.e., vegetation clearing, grading, filling, etc.). 372
The fugitive dust emissions analysis (see Table 8) identified that proposed construction PM emissions 373 would be substantially lower than the de minimis threshold. Fugitive dust, however, would be the most likely 374 emission source to travel off-site and potentially affect sensitive receptors near the Project Site (see Figure 375 2) during construction activities. Implementation of the fugitive dust-reduction measures listed in Section 376 1.4 would minimize these emissions. Therefore, a less-than-significant adverse impact to local air quality 377 would be anticipated from fugitive dust emissions during construction. 378
Table 8: Estimated Annual Fugitive Dust Emissions from the Proposed CPF 379
Emission Source Projected Emissions (tpy)
De Minimis Threshold PM10 PM2.5 Total
Demolition – 2021 3.03E-05 4.58E-06 3.48E-05
100 tpy
Site Preparation – 2021 2.08 2.08 4.16
Demolition – 2022 3.03E-05 4.58E-06 3.48E-05
Site Preparation – 2022 2.08 2.08 4.16
Note: The PM10 and PM2.5 values in this table are also included in the criteria pollutant total summary. 380
No fugitive dust emissions would be anticipated during operation of the proposed CPF. All areas of the site 381 would be landscaped, have natural vegetation, or be covered with impervious surfaces (e.g., sidewalks and 382 parking lots); no areas of bare or exposed soil would be present. Therefore, no impacts from fugitive dust 383 emissions are expected during operation of the proposed CPF, including to sensitive receptors. 384
Toxic and Hazardous Air Pollutant Emissions 385
HAP emissions8 associated with construction of the Proposed Action could occur but would be negligible 386 when compared to regional HAP emissions. HAPs emitted during construction would not meet or exceed 387 major source thresholds. 388
8 As noted previously, Treasury calculated preliminary projected actual emissions using conservative assumptions
based on best available data. These values do not reflect the maximum possible emissions (i.e., PTE emissions) that are used for permitting, and are subject to change as the design of the proposed CPF progresses.
US Army Corps of Engineers – Baltimore District US Department of the Treasury
Proposed Currency Production Facility November 6, 2020 I 19 Air Quality Technical Memorandum
HAP emission sources during operation of the proposed CPF would primarily include permanent, stationary 389 equipment, such as currency presses, boilers, and emergency generators. Table 9 shows the projected 390 annual HAP emissions that would occur during operation of the proposed CPF. 391
As with criteria pollutants, the proposed CPF’s operational HAP emissions would increase as the facility 392
phases into operation, and the DC Facility’s HAP emissions (see Table 4) would decrease as it phases out 393
of operation. 394
As shown in Table 9, emission levels of individual and combined HAPs during operation of the proposed 395
CPF would be substantially less than the major source thresholds. While combined HAP emissions would 396
be greater than those from the DC Facility under existing conditions, they would still be very low overall, 397
and chromium and nickel HAPs emissions would be eliminated entirely. Based on the calculated air 398
emission levels and compliance with applicable emission and work practice standards, the impacts of HAPs 399
would be less than significant. Details of HAP-specific emissions are provided in Appendix A. 400
Table 9: Projected Actual Annual HAP Emissions 401
Emission Source Emergency Generators
(tpy)
Boilers (tpy)
Thermal Oxidizer
(tpy)
Currency Production
(tpy) Total (tpy)
Major Source
Thresholds
Operations – 2026 (25%)
4.43E-03 3.70E-02 0.07 7.00E-02 0.18
10 tpy for a single HAP or 25 tpy for
any combination
of HAPs
Operations – 2027 (50%)
4.43E-03 3.70E-02 0.07 0.14 0.25
Operations – 2028 (75%)
4.43E-03 3.70E-02 0.07 0.21 0.32
Annual Operations (100%)
4.43E-03 3.70E-02 0.07 0.28 0.39
As stated in Table 2, the MDE air quality permitting process established under COMAR 26.11.16.07 applies 402
to facilities that may emit TAPs, such as the proposed CPF, and requires quantification of TAP emissions, 403
the application of T-BACT on new sources, and an ambient impact analysis for human health along the 404
property boundary using state-established screening levels. As stated earlier, the proposed activity is 405
currently in the conceptual design phase and all of the equipment, processes, and inks and solvents to be 406
used have not been finalized. Therefore, it would be premature for Treasury to include the TAP analyses in 407
this Environmental Impact Statement (EIS). Overall, considering the conservative assumptions used to 408
estimate the projected actual HAP emissions, it is likely that any TAP emissions generated by the proposed 409
CPF would be less than the values shown in Table 9 and Appendix A and below the MDE’s TAP screening 410
limits, resulting in less-than-significant adverse impacts. 411
Greenhouse Gas Emissions and Climate Change 412
GHGs would be emitted during construction and operation of the proposed CPF from the same sources as 413 those that emit criteria pollutants. Estimated GHG emissions in terms of metric tons of CO2e per year are 414 shown in Table 10 along with the 2017 state-wide inventory for comparison. As shown in Table 10, the 415 Proposed Action’s GHG emissions would be minor relative to those emitted in the state of Maryland in 416 2017. 417
US Army Corps of Engineers – Baltimore District US Department of the Treasury
Proposed Currency Production Facility November 6, 2020 I 20 Air Quality Technical Memorandum
Table 10: Projected Annual Emissions of Greenhouse Gases 418
Emission Source Projected Annual CO2e Emissions
(metric tons)
2017 Statewide
GHGs (metric tons)
Demolition and Site Preparation – 2021 2,182
78,493,210
Demolition and Site Preparation – 2022 2,029
Construction – 2023 3,370
Construction – 2024 3,332
Construction – 2025 1,988
Operations – 2026 5,488
Operations – 2027 10,976
Operations – 2028 16,464
Annual Operations (full operation) 21,9321
1. For this analysis, Treasury conservatively assumed GHG emissions from proposed 419 CPF operations would be the same as from the WCF in 2019 (BEP, 2019b). 420
Currency production operations at the DC Facility would be phased out once the proposed CPF is fully 421 operational. Existing GHG emissions at the DC Facility (i.e., 21,974 metric tons of CO2e, see Table 4) 422 would decrease as the DC Facility phases out; however, they would be offset by GHG emissions from a 423 new similar facility in the same region (i.e., the proposed CPF). Therefore, GHG emissions from the 424 proposed CPF would not have a perceptible impact on a regional level. 425
In reality, annual GHG emissions from the proposed CPF operations would likely be lower than the DC 426 Facility. The proposed CPF would be designed to achieve a Silver Leadership in Energy and Environmental 427 Design (LEED) energy efficiency rating, and would potentially implement renewable energy systems (e.g., 428 solar panels); the Proposed Action would also reduce the BEP’s federal footprint within the NCR by up to 429 approximately 30 percent over the long-term. For additional information on Treasury’s goal for a Silver 430 LEED rating, please refer to the Utilities Technical Memorandum. 431
GHG emission estimates from POVs driven by commuting workers and delivery trucks are included in the 432 operational CO2e values in Table 10. These POVs and delivery trucks would merely change their 433 destination (i.e., from the DC or Landover, MD Facility to the proposed CPF) and would operate within the 434 same ROI as the DC Facility. Furthermore, as described above, operation of the proposed CPF could 435 reduce delivery truck numbers when compared to operation of the DC Facility. Therefore, GHGs from these 436 vehicles would not be “new” regional GHG emission sources and the relocation of employees and their 437 vehicles within the NCR would not result in a perceptible change in regional GHG emissions. As such, 438 the Proposed Action would not have any noticeable regional impact on GHG emissions or climate 439 change. 440
Sensitive Receptors 441
As shown in Figure 2, there are 485 sensitive receptors within 1,500 feet of the Project Site. During 442 construction of the Proposed Action, fugitive dust emissions would be the most likely emission source to 443 travel off-site and potentially affect these sensitive receptors. However, with implementation of the impact-444 reduction measures identified in Section 1.4, fugitive dust emissions would likely be imperceptible for all 445 sensitive receptors, resulting in less-than-significant adverse impacts during construction. No fugitive 446 dust emissions would be anticipated during operation of the Proposed Action. 447
US Army Corps of Engineers – Baltimore District US Department of the Treasury
Proposed Currency Production Facility November 6, 2020 I 21 Air Quality Technical Memorandum
Criteria pollutants and HAPs emitted during operation of the Proposed Action could affect sensitive 448
receptors near the Project Site. However, criteria pollutants would not exceed de minimis levels and HAPs 449
would not exceed major source thresholds. In most cases, these pollutants would be substantially lower 450
than applicable levels/thresholds. Treasury would comply with all applicable federal, state, and local air 451
quality regulations (see Table 2). Furthermore, Treasury would comply with applicable permitting and 452
emission and work practice standards. Therefore, there would be less-than-significant adverse impacts 453
to sensitive receptors during operation of the Proposed Action. 454
1.4 Impact-Reduction Measures 455
As part of the Proposed Action, Treasury would implement the following impact-reduction measures to 456 minimize potential adverse air quality impacts: 457
Construction Phase 458
• Comply with the MDE’s vehicle idling requirements by turning off equipment and vehicles when not 459 in use. 460
• Use ULSD, propane, or natural gas as a fuel-source in equipment and vehicles to the extent 461 possible to minimize SO2 emissions. 462
• Cover beds of dump trucks while they are in transport to minimize fugitive dust emissions. 463
• Cover unpaved roads with gravel to minimize fugitive dust emissions. 464
• Spray water on any stockpiles or unpaved areas to minimize fugitive dust emissions. 465
• Locate equipment and staging zones as far as practicable from sensitive receptors (e.g., on the 466 southern portion of the Project Site). 467
• Obtain the appropriate permits for CPF construction and operation from the MDE. 468
Operational Phase 469
• Properly maintain fuel-burning equipment by monitoring and maintaining the equipment according 470 to manufacturer specifications. 471
• Implement current and planned projects for air emission reductions as practicable, such as 472 replacing nickel plate electroforming with laser engraving, chromium electroplating with an 473 emission-free physical vapor deposition plating process, using UV-cured inks which have a low 474 VOC content, using electricity from renewable energy sources, and continuing to conduct 475 comprehensive air emission and GHG analyses (BEP, 2019a). 476
• Maintain and adhere to the appropriate operating permits from the MDE for the proposed CPF. 477
1.5 Mitigation Measures 478
No project-specific mitigation measures are recommended. 479
1.6 References 480
AFCEC. (2018a). Air Emissions Guide for Air Force Mobile Sources. San Antonio: Air Force Civil 481 Engineer Center. 482
AFCEC. (2018b). Air Emissions Guide for Air Force Stationary Sources. San Antonio: Air Force Civil 483 Engineer Center. 484
US Army Corps of Engineers – Baltimore District US Department of the Treasury
Proposed Currency Production Facility November 6, 2020 I 22 Air Quality Technical Memorandum
BEP. (2015, September). BEP NSR Permit Amendment Air Emission Calcs PTE. Texas Commission on 486 Environmental Quality, Forth Worth, Texas: US Department of the Treasury, Bureau of Engraving 487 & Printing - Western Currency Facility. 488
BEP. (2017). Bureau of Engraving and Printing Facility Feasibility Study. BEP. 489
BEP. (2018). Title V Annual Compliance Certification. 490
BEP. (2019b). BEP Western Currency Facility GHG Report to the Treasury. per FEMP reporting 492 requirements. 493
BEP. (2019c). Utility Information for the New Facility. 494
BEP. (2020). Final Transportation Impact Study. USACE Baltimore District. 495
DDOE. (2017). 2006-2017 Greenhouse Gas Inventory. Retrieved January 3, 2020, from Greenhouse Gas 496 Inventories: https://doee.dc.gov/service/greenhouse-gas-inventories 497
MDE. (2019a). Toxic Air Pollutant Regulations Assistance. Retrieved January 6, 2020, from Air & 498 Radiation Permits: 499 https://mde.maryland.gov/programs/Permits/AirManagementPermits/Pages/ToxicAirPollutantReg500 ulationDocuments.aspx 501
MDE. (2019b). Air and Radiation Permits, Licenses and Approvals. Retrieved January 10, 2020, from Air 502 and Radiation Permits: 503 https://mde.maryland.gov/programs/Permits/AirManagementPermits/Pages/index.aspx 504
MDE. (2019c). Maryland's Greenhouse Gas Emissions Reduction Act (GGRA). Retrieved January 3, 505 2020, from Climate Change Program: 506 https://mde.maryland.gov/programs/Air/ClimateChange/Pages/index.aspx 507
MDE. (2019d, May 17). Ambient Air Monitoring Network Plan for Calendar Year 2020. (A. a. 508 Administration, Ed.) Retrieved January 3, 2020, from Ambient Air Monitoring Program: 509 https://mde.state.md.us/programs/Air/AirQualityMonitoring/Documents/MDNetworkPlanCY2020.p510 df 511
MDE. (2019e, July 26). State of Maryland 2017 Greenhouse Gas Emission Inventory Documentation. 512 Retrieved January 3, 2020, from 513 https://mde.maryland.gov/programs/Air/ClimateChange/Documents/2017%20GHG%20Inventory/514 MD2017PeriodicGHGInventory.pdf 515
USEPA. (1995, January). AP-42: Compilation of Air Emission Factors. Retrieved from 516 https://www.epa.gov/air-emissions-factors-and-quantification/ap-42-compilation-air-emission-517 factors 518
USEPA. (1998, April 14). Memorandum: Potential to Emit (PTE) Guidance for Specific Source 519 Categories. Retrieved April 18, 2020, from Title V Operating Permits: 520 https://www.epa.gov/sites/production/files/2015-08/documents/lowmarch.pdf 521
USEPA. (2016, December 20). NAAQS Table. Retrieved January 2, 2020, from Criteria Air Pollutants: 522 https://www.epa.gov/criteria-air-pollutants/naaqs-table 523
USEPA. (2017a, November 6). Volatile Organic Compounds' Impact on Indoor Air Quality. Retrieved 524 January 6, 2020, from Indoor Air Quality (IAQ): https://www.epa.gov/indoor-air-quality-iaq/volatile-525 organic-compounds-impact-indoor-air-quality 526
US Army Corps of Engineers – Baltimore District US Department of the Treasury
Proposed Currency Production Facility November 6, 2020 I 23 Air Quality Technical Memorandum
USEPA. (2017b, March 16). Initial List of Hazardous Air Pollutants with Modifications. Retrieved January 527 2, 2020, from Hazardous Air Pollutants: https://www.epa.gov/haps/initial-list-hazardous-air-528 pollutants-modifications 529
USEPA. (2018a, March 8). Critieria Air Pollutants. Retrieved January 2, 2020, from 530 https://www.epa.gov/criteria-air-pollutants 531
USEPA. (2018b, September 27). Hazardous Air Pollutants. Retrieved January 2, 2020, from 532 https://www.epa.gov/haps 533
USEPA. (2018c, September 5). Operating Permits Issued under Title V of the Clean Air Act. Retrieved 534 January 2, 2020, from https://www.epa.gov/title-v-operating-permits 535
USEPA. (2019a, October 11). Nitrogen Oxides (NOx) Control Regulations. Retrieved January 6, 2020, 536 from Region 1: EPA New England: https://www3.epa.gov/region1/airquality/nox.html 537
USEPA. (2019b, April 11). Overview of Greenhouse Gases. Retrieved January 2, 2020, from Greenhouse 538 Gas Emissions: https://www.epa.gov/ghgemissions/overview-greenhouse-gases 539
USEPA. (2019c, December 31). Nonattainment Areas for Criteria Pollutants (Green Book). Retrieved 540 January 2, 2020, from https://www.epa.gov/green-book 541
USEPA. (2019d, October 30). New Source Performance Standards. Retrieved January 2, 2020, from 542 https://www.epa.gov/stationary-sources-air-pollution/new-source-performance-standards 543
USEPA. (2019e, October 15). National Emission Standards for Hazardous Air Pollutants (NESHAP). 544 Retrieved January 2, 2020, from https://www.epa.gov/stationary-sources-air-pollution/national-545 emission-standards-hazardous-air-pollutants-neshap-9 546
USEPA. (2019f, February 8). Prevention of Significant Deterioration Basic Information. Retrieved January 547 2, 2020, from New Source Review (NSR) Permitting: https://www.epa.gov/nsr/prevention-548 significant-deterioration-basic-information 549
USEPA. (2019g, September). Clean Air Status Trands Network (CASTNET). Retrieved January 3, 2020, 550 from https://www3.epa.gov/castnet/docs/CASTNET_Factsheet_2019.pdf 551
USEPA. (2019h, November 13). Air Data: Air Quality Data Collected at Outdoor Monitors Across the US. 552 Retrieved January 3, 2020, from https://www.epa.gov/outdoor-air-quality-data 553
USEPA. (2019i). Inventory of US Greenhouse Gas Emission and Sinks 1991-2017. doi:EPA 430-R-19-554 001 555
USEPA. (2019j, December 16). Detailed Facility Report: BUREAU OF ENGRAVING AND PRINTING, 556 301 14TH & C ST. SW, WASHINGTON, DC 20228. Retrieved January 6, 2020, from ECHO: 557 Enforcement and Compliance History Online: https://echo.epa.gov/detailed-facility-558 report?fid=110017347879 559
USEPA. (2019k, December 16). Detailed Facility Report: BEP WESTERN FACILITY, 9000 BLUE 560 MOUND RD, FORT WORTH, TX 76131. Retrieved January 6, 2020, from ECHO: Enforcement 561 and Compliance History Online: https://echo.epa.gov/detailed-facility-report?fid=110000495090 562
Yale Climate Connections. (2009, January 20). Understanding Carbon Dioxide Equivalence. Retrieved 563 January 2, 2020, from https://www.yaleclimateconnections.org/2009/01/common-climate-564 misconceptions-co-equivalence/ 565
566
US Army Corps of Engineers – Baltimore District US Department of the Treasury
Proposed Currency Production Facility November 6, 2020 I 24 Air Quality Technical Memorandum
This page intentionally left blank.567
US Army Corps of Engineers – Baltimore District US Department of the Treasury
Proposed Currency Production Facility November 6, 2020 I Appendix A Air Quality Technical Memorandum
Appendix A: General Conformity Analysis and Other Air Quality Calculations 568
US Army Corps of Engineers – Baltimore District US Department of the Treasury
Proposed Currency Production Facility November 6, 2020 I Appendix A Air Quality Technical Memorandum
Summary Emissions - Regenerative Thermal Oxidizer (RTO)U.S. Department of the Treasury - Bureau of Engraving & Printing
Western Currency FacilityTarrant County, Fort Worth, TX
Source: BEP, 2015September 2015
Fuel Data
Calculated Emissions
Fuel Flow Rate
Hourly Heat Value (MMBtu/hr)
Annual Heat Value (MMBtu/yr)
EPN Pollutant
BEP - Western Currency Facility NSR Permit No. 17994 Amendment Application
September 2015
Example Calculations:NOx Hourly Emissions (lbs/hr) = AP-42 EF (lb/MMBtu) x Hourly Heat Value (MMBtu/hr) = 0.138 lbs/MMBtu x 8.99 MMBtu/hr = 1.24 lbs/hrNOx Annual Emissions (tpy) = AP-42 EF (lb/MMBtu) x Annual Heat Value (MMBtu/yr) / 2000 lbs/ton = 0.138 lbs/MMBtu x 74280.22 MMBtu/hr / 2000 lbs/ton = 5.13 tpy
VOC Hourly Emissions (lbs/hr) = AP-42 EF (lb/MMscf) x Maximum Gas Volume Feed (MMscf/hr) = 5.5 lbs/MMscf x 0.00814 MMscf/hr = 0.04 lbs/hrVOC Annual Emissions (tpy) = AP-42 EF (lb/MMscf) x Maximum Gas Volume Feed (MMscf/yr) / 2000 lbs/ton= 5.5 lbs/MMscf x 70.54 MMscf/yr / 2000 lbs/ton = 0.19 tpy
Note:
3. The emissions for NOx and CO are based upon the emission factors for flares as published in AP-42. The emissions for VOC, PM and SO 2 are based upon the emission factors for external combustion sources as
published in AP-42. 4. The VOCs shown in the table above represent the incomplete combustion of fuel assist gas fed to the RTO. The estimation of the VOCs resulting from the combustion of the waste gas are shown in the Intaglio Printing Press calculations (EPN 16).
2. Heat value data for the waste streams is not available. Thus, an assumed worst-case heat rate of 23,000 Btu/lb was used to determine the total heat value of the waste gas streams routed to the RTO.
1. Volumetric flow rates for the waste streams are not available. Thus, an assumed worst-case vapor density of 3.5 (Air=1) was used to determine the volumetric flow rate for each waste gas stream routed to the RTO.
BEP - Western Currency Facility NSR Permit No. 17994 Amendment Application September 2015
PollutantEstimated CY 2026 Emissions
(tons) - Proposed CPF1
Estimated CY 2027 Emissions (tons)
Proposed CPF1
Estimated CY 2028 Emissions (tons) -
Proposed CPF1
Estimated CY 2029 Annual Emissions
(tons) - Proposed CPF1 2019 GHGs (metric tons)2
PM10 0.58 1.17 1.75 2.33
PM2.5 0.58 1.17 1.75 2.33
VOC 4.15 8.30 12.45 16.60GHGs2
5,483 10,966 16,449 21,932
Total HAPs 0.07 0.14 0.21 0.28 6.39E-02
FY 2019 GHG emissions for WCF was 21,932 metric tons. These data were reported by the BEP to the Treasury in December 2019 per FEMP reporting
requirements.
1. Projected actual emissions for the fully operational proposed CPF were prepard by BEP and sent to AECOM for use in the air quality impact analysis. For purposes of this analysis, it was assumed that the proposed CPF would begin operations at 25% of full capacity in 2026, 50% of full capacity in 2027, 75% of full capacity in 2028, and 100% of full capacity in 2029.
Proposed CPF Operations Projected Actual Emissions
BEP Currency Production
2. For the purposes of conservatively estimating operational GHGs, GHG emissions from proposed CPF operations were assumed to be the same as the WCF. This will be revised if GHG data for the proposed CPF becomes available before the release of the EIS.
Criteria Pollutants and GHGs
HAPs
Emission Unit Name
Number of Presses/Units
Planned at CPF
Press Hours of Operation for
Actual Emissions Calculation lbs/hr lbs/yr tons/yr
Miscellaneous Other Presses & EquipmentMisc. Intaglio 7 1,859 0.03 53 0.03Research Intaglio Test 1 1,000 0.14 138 0.07Flatbed Presses 4 991 0.17 173 0.09Offset Lithographic 2 1,000 1.06 1,060 0.53Misc. Cleaning Processes NA NA NC 5,524 2.76Generators 2 40 0.3 12 0.006Roller MFG NA NA NC 509 0.25
7.90 33,206 16.60Totals:
VOC Estimated Actual Emissions Summary
This page intentionally left blank.
Diesel USAFCEE Average No. of No. of CY 2021 No. of CY 2022 No. of CY 2023 No. of CY 2024 No. of CY 2025Equipment Equivalent Rated HP Units Days (CY 2021) Hours Days (CY 2022) Hours Days (CY 2023) Hours Days (CY 2024) Hours Days (CY 2025) Hours
Paver Diesel Pavers 130 2 0 0 0 0 0 132 2,112Backhoe loader Diesel Tractors/Loaders/Backhoes 48 2 132 2,112 132 2,112 132 2,112 132 2,112 0Chain saws 2 Stroke Chain Saws >6 HP 7 2 66 1,056 0 0 0 0 0Compressor Diesel Air Compressors 90 1 0 0 66 528 132 1,056 66 528 estimated - assumed it is turning on and off when neededConcrete pump Diesel Pumps 53 1 0 0 66 528 66 528 66 528 divided in half - assumed it is turning on and off when neededCrane Diesel Cranes 225 1 0 0 66 528 66 528 66 528Crane Diesel Cranes 175 1 0 0 66 528 66 528 66 528Front end loader Diesel Tractors/Loaders/Backhoes 200 2 66 1,056 66 1,056 0 0 0Welding machine Diesel Welders 30 1 0 0 66 528 66 528 66 528 estimated - no information on welded itemsGrader Diesel Graders 200 1 265 2,120 0 0 0 0 0Hammer, hydraulic Diesel Crushing Equipment 60 1 132 1,056 0 0 0 0 0Loader, skid steer Diesel Skid Steer Loaders 55 1 0 0 66 528 132 1,056 0Cement & morter mixer Diesel Cement & Morter Mixer 470 1 0 0 66 528 66 528 0 divided in half - assumed it is turning on and off when neededWheel Roller Diesel Rollers 100 2 0 0 0 0 132 2,112Water Tank Truck Diesel Dumpers/Tenders 400 2 265 4,240 265 4,240 265 4,240 265 4,240 265 4,240 estimated - assumed it is turning on and off to spray water every now and then for fugitive dust controlDump Truck Diesel Dumpers/Tenders 400 5 265 2,575 132 2,575 265 22,543 265 22,543 265 22,543Forklift Diesel Forklifts 50 2 0 0 265 4,240 66 1,056 66 1,056Manlift Diesel Forklifts 50 1 0 0 132 1,056 132 1,056 66 528Pickup Trucks Diesel Off-Highway Trucks 475 5 265 10,600 265 10,600 265 10,600 265 10,600 132 5,280 estimated - assuming trucks are turned off when not in use and are being used to carry small tools and equipment
Assumptions:As a placeholder, it was assumed that vehicles would operate for 3, 6, or 12 months or 66, 132, 265 days, respectively. This can be revised if new data become available before the release of the EIS.
Typical workday was assumed to be 8-hours of construction.Numbers of equipment was estimated based on quantities and size of Proposed Action.It was assumed as a conservative estimate that the equipment would be diesel.See table below for dump truck data according to Treasury's Traffic Impact Study.Work day assumed to be = 8 hours
New CPF Constrction Materialb 1,000,000 155 77,500 16-ton 6,619 10 66,190 13,238a Total truck trips includes one shipment of ACP wastage (7/1/2020 email from M. Busam). 7,278 72,780 14,556b Total truck trips includes 28 shipments of ACP construction materials and 1,747 shipments of asphalt (7/1/2020 email from M. Busam).
Construction was conservatively projected to start in 2021 and be completed by 2025.
Construction Equipment Projected Hours of OperationDemolition and Construction
BEP Demolition, Site Prep, and Construction
Demolition/Site Prep Demolition/Site Prep Construction Construction Construction
Construction Equipment Air Quality Emission FactorsBEP Site Acquisition and Construction
Working days/year = 261g to lbs conversion = 453.592Assumptions:To provide conservative estimates, it was assumed no trucks or POVs would be new models. Therefore, emisson factors from 7-years prior were used.No data was available on actual numbers of construction workers. It was assumed that there would be 20 construction workers commuting to the Project Site per working day (5 days/week, 261 days/year).It was assumed construction workers commute from home locations that are local at an estimated average of 10 miles away (i.e., 20 miles round-trip).Construction-related vehicles (e.g., pickup trucks and dump trucks) are not considered "commuting" vehicles and are instead included in the construction equipment emission calculations.
Based on employees' home locations, it was assumed POVs and trucks are traveling from locations that are an estimated average of 20 miles away (i.e., 40 miles round-trip).
Total 2028 POV & Truck Emission (tpy)
2029 (2022)
Total 2029 POV & Truck Emission (tpy)
Projected POV & Delivery Truck EmissionsBEP Site Acquisition and Construction
Emission Factor (lbs/mile) Emissions (lbs/year)
2026 (2019)
Total 2026 POV & Truck Emission (tpy)
Based on the BEP's Traffic Impact Study, an estimated 1,011 POVs would be commuting to the CPF during the daytime shift. It was conservatively assumed that all employees in the evening and midnight shift (168 and 166, respectively) would be commuting via POV. This is an estimated total of 1,345 POVs traveling to the site per day/night. Based on the BEP's truck traffic estimates, 15 trucks would be delivering/picking up materials per working day during full operations. During the phased operational implementation between 2025 and 2028, it was assumed that there would be a 25 percent increase in commuter vehicles and delivery trucks until the CPF reaches full operational potential in 2029.
Emission factors are from the 2016 and 2018 USAFCEE Air Emissions Guide For Air Force Mobile Sources (Section 5, July 2016 and Section 5, August 2018). Emission factors provided in grams/mile were divided by the conversion factor for pounds/mile.
2021 (2014)
2022 (2015)
2023 (2016)
2024 (2017)
2025 (2018)
Total 2021 POV Emission (tpy)
Total 2022 POV Emission (tpy)
Total 2023 POV Emission (tpy)
Total 2024 POV Emission (tpy)
Total 2025 POV Emission (tpy)
Assumed POVs and trucks are on site 5 days/week for 261 days/year. Conservatively assume the total number of workers commute and the trucks deliver every working day.
2027 (2020)
Total 2027 POV & Truck Emission (tpy)
2028 (2021)
This page intentionally left blank.
NG Usage InformationFuel Burned: Natural Gas
Quantity of NG burned (cf/yr Estimated Actual)1: 39,215,686NG Heat Content (Btu/cf): 1,020BTUs in One Year 40,000,000,000Total Capacity of NG Boilers (MMBTU/hr) 42Assumed Energy Efficiency of NG Boilers 0.9Hourly NG Consumption (cf/hr) 45,752
Natural Gas Equipment (Boilers) Estimated Actual EmissionsBEP Site Acquisition and Construction
2. Emission Factors from AP-42, Chapter 1.4, Table 1.4-1, Table 1.4-2, Table 1.4-3, and Table 1.4-4.3. Assumed that other HVAC equipment would be electric and therefore have no emissions.
1. NG usage actual estimation for the proposed facility is based on the natural gas usage in the WCF in 2018 as identified in BEP's "Utility Information for the New Facility" (2019).
Equipment InformationNumber of Identicle Units: 2Generator Demand (hp): 2,012
Generator Rating (kW)1: 1,500Fuel Burned: Diesel
Estimated Actual Hours of Operation2: 200Fuel Sulfur Content (wt%): 0.0015Fuel Heat Content (Btu/gal): 137,000
1. Generators conservatively estimated to be 1,500 kW.2. A conservative estimate based on BEP's DC facility's emergency generators' actual hours of operation in 2018 (i.e., 121 hours).3. Criteria pollutant emission factors from manufacture's specifications for a Tier II certified Caterpillar 3512C and converted from g/hp-hrto lb/hp-hr using 453.6 g to lb conversion factor. HAP emission Factors from AP-42, Chapter 3.4, Table 3.4-3, October 1996.HAP emission factors converted from lb/MMBtuusing average brake-specific fuel consumption (BSFC) = 7 MMBtu/1000 hp-hr.4. For inventory purposes, assume PAH is the same as Polycyclic Organic Matter (POM).
Emergency Generator Estimated Actual EmissionsBEP Site Acquisition and Construction