164


AIR-SPARGED HYDROCYCLONE FLOTATION TECHNOLOGY FOR EFFICIENT RECOVERY OF FLORIDA PHOSPHATE MINERALS
FINAL REPORT
Jan D. Miller Principal Investigator
with
Xuming Wang, Di Yin, Yongqiang Lu
THE UNIVERSITY OF UTAH Salt Lake City, Utah 84112
Prepared for
FLORIDA INSTITUTE OF PHOSPHATE RESEARCH 1855 West Main Street Bartow, Florida 33830
Contract Manager: Patrick Zhang FIPR Project Number: 93-02-098
January 2001

DISCLAIMER
The contents of this report are reproduced herein as received from the contractor. The report may have been edited as to format in conformance with the FIPR Style Manual. The opinions, findings and conclusions expressed herein are not necessarily those of the Florida Institute of Phosphate Research, nor does mention of company names or products constitute endorsement by the Florida Institute of Phosphate Research.

iii
PERSPECTIVE
Patrick Zhang, Research Director-Beneficiation & Mining Despite significant improvement in phosphate mining and processing during the last two decades the overall profit margin for the phosphate mining industry has decreased and the cost for phosphate concentration, particularly for the flotation separation, has increased. The mechanical flotation cells contribute a great deal to the cost of phosphate beneficiation due to their low production rate, high energy consumption and non-optimized flotation conditions. Although the production rate has been improved to some extent by increasing the size of the flotation cells, it is often achieved by sacrificing metallurgical recovery. Air-sparged hydrocyclone (ASH) flotation is a new technology developed at the University of Utah during the past decade. It combines the advantages of the conventional hydrocyclone and froth flotation into a single piece of equipment and provides a unique opportunity for improved phosphate flotation separation. The ASH is particularly suitable for handling large volumes of pulp at specific capacities 80 to 200 times greater than that offered by other flotation machines. During the last ten years, both fundamental and applied studies on ASH have been carried out at the University of Utah. As a result of these research efforts, six U.S. patents have been issued. The improved flotation recovery of fine particles and high processing capacities have been successfully demonstrated on pilot-plant scale for several minerals. Preliminary tests have been conducted at the University of Utah to evaluate the ASH technique for the flotation of a western phosphate ore. In the second year of this project, bench scale tests were conducted using a 2-inch ASH to optimize the design parameters and operating variables for both rougher and cleaner flotation. Encouraged by the bench scale test results, the research team built a larger ASH unit (6-inch) and conducted in-plant testing on fine amine flotation feeds. Again the initial results were very encouraging: the 6-inch ASH ran continuously for 2-6 hours generating satisfactory concentrates at reagent cost comparable to plant operations. Unfortunately, the air sparger--the key component of ASH--started plugging after about 10 hours of operation. Therefore, the major hurdle to commercialization of the ASH technology is the sparger-plugging problem, which may only be resolved by replacing the porous tube with a different air bubble generating system.
v
ABSTRACT The most attractive advantage of air-sparged hydrocyclone (ASH), as a flotation device, is its high throughput (the amount of materials processed per unit volume), which could be up to 200 times greater than that offered by other flotation machines. High throughput translates to reduction in both capital and operating costs. Pilot-scale testing in both the lab and plant showed that ASH could achieve comparable or better metallurgical performance on a continuous basis. These tests also demonstrated that ASH may be more suitable for amine flotation. However, the air sparger, a porous tube and the key component of the ASH, started plugging by a crud after about ten days of operation. The crud contained organic reagents and clay minerals. Several different sparger designs as well as some cleaning techniques were tested without dramatic improvement. Perhaps the best chance for the ASH to succeed in phosphate is to replace the porous tube with an external sparger.

vi
ACKNOWLEDGMENTS
The Principal Investigator and all the researchers involved in this project want to express their thanks for the financial and technical support from FIPR, particularly Dr. Patrick Zhang. Thanks are extended to Mr. M.F. “Mike” Dibble and Mr. Julian Hazen of Met Pro for their help in project organization, equipment procurement and installation, plant operation and valuable consultation. Last, but not least, the assistance of Dr. Hassan El-Shall of Global Consulting is recognized for his valuable contributions in sample collection, equipment procurement, organization of plant-site tests, and discussion of experimental results.

vii
TABLE OF CONTENTS PERSPECTIVE............................................................................................................... iii ABSTRACT......................................................................................................................v ACKNOWLEDGMENTS ...............................................................................................vi EXECUTIVE SUMMARY...............................................................................................1 INITIAL RESEARCH EFFORTS ....................................................................................5
Plant Survey and Sample Collection........................................................................5 Sample Preparation and Characterization ................................................................6 Installation of Pilot Plant ASH-2C System...........................................................16 Bench Scale Flotation Experiments .......................................................................16
ROUGHER FLOTATION OF FINE PHOSPHATE FEED WITH THE ASH 2-C SYSTEM-PILOT PLANT STUDIES ....................................................25
Introduction............................................................................................................25 Procedure ...............................................................................................................25 Results....................................................................................................................26 Discussion ..............................................................................................................32
AMINE FLOTATION WITH THE ASH-2C SYSTEM— PILOT-PLANT STUDY........................................................................................37
Introduction............................................................................................................37 Sample-Rougher Phosphate Concentrate...............................................................37 Flotation Experiments............................................................................................37
Bench-Scale Amine Flotation ..........................................................................37 ASH-2C Amine Flotation ................................................................................38
Results....................................................................................................................38
Bench-Scale Amine Flotation ..........................................................................38 ASH-2C Amine Flotation ................................................................................40
Discussion ..............................................................................................................42 Summary ................................................................................................................42

viii
TABLE OF CONTENTS (CONT.) SURFACE CHEMISTRY ASPECTS OF PHOSPHATE FLOTATION.......................47
Materials and Methods...........................................................................................47
Materials ..........................................................................................................47 Methods............................................................................................................47
Surface Tension and Froth Stability Measurements.................................47 Contact Angle Measurements...................................................................48 Pilot-Plant Experiments............................................................................48
Results and Discussion ..........................................................................................48
Surface Tension and Froth Stability.................................................................48 Contact Angle ..................................................................................................50
Summary and Conclusions.....................................................................................62 PLANT-SITE TESTS WITH THE ASH-6C SYSTEM .................................................63
Introduction............................................................................................................63 Scale-up of ASH-2C to ASH-6C ...........................................................................63 Design Variables ...............................................................................................63 Operation Variables ..........................................................................................64
System Set-Up.........................................................................................................64 Results and Discussion ...........................................................................................70 Porous Tube Plugging Problem.........................................................................73
Discussion and Summary ........................................................................................73 CRUD FORMATION AND PLUGGING OF THE POROUS TUBE...........................77
Introduction............................................................................................................77 Crud Identification .................................................................................................77 Laboratory and Pilot Plant Tests............................................................................81
Laboratory Test ................................................................................................81

ix
TABLE OF CONTENTS (CONT.)
Results and Discussion ..........................................................................................82
Initial Tests.................................................................................................82 Plastic Porous Tube--the Effect of Pore Size.............................................83 Stainless Steel Porous Tube.......................................................................83
Stainless Steel Porous Tube with Static Potential .....................................86 Cleaning Test .............................................................................................86
Pilot Plant Crud Formation Test ................................................................92 Porous Tube Plant-Site Test with ASH-2C Systems .............................................92
Method .............................................................................................................97 Results and Discussion ....................................................................................97
Effect of Pore Size .....................................................................................97 Effect of Porous Tube Material..................................................................97
Stainless Steel.....................................................................................97 Ceramic ..............................................................................................97 Stainless Steel Wire Mesh................................................................100 Hydrophilic Plastic ...........................................................................100
Effect of Detergent Treatment and Cleaning Tests..................................100
Detergent Addition with Feed ..........................................................100 Detergent Cleaning Test ...................................................................100
Effect with Electric Field .........................................................................105 Evaluation of the Effect of Crud Formation and Plugging on Flotation Performance .................................................................105
Stainless Steel ASH-6C with Electric Field Plant-Site Test ................................105
System Set-up ................................................................................................105 Operating Conditions .....................................................................................110
Results and Discussion ..................................................................................110 Conclusions..........................................................................................................114

x
TABLE OF CONTENTS (CONT.) FINAL DISCUSSION AND SUMMARY ...................................................................117 Laboratory and Pilot Plant Studies with ASH-2C ...................................................117 Plant-Site Test with ASH-6C...................................................................................117 Conclusions..............................................................................................................117 Economic Consideration ..........................................................................................119 Recommendations ....................................................................................................119 APPENDIXES
A. Analytical Method for P2O5 Analysis of Products from Phosphate Flotation Tests.................................................................................................. A-1
B. Permeability Calculation ...................................................................................B-1 C. Measurement Results of Crud Formation Tests ................................................C-1 D. Photography of Crud Build-up on the Surface of Porous Tubes...................... D-1

xi
LIST OF FIGURES
Figure Page
1. Particle size distribution of both original and conditioned feed material .........................................................................................................7
2. Large size particles (>14 mesh) in the original feed.............................................9 3. X-ray diffraction pattern for the rougher tailing product from
single stage ASH flotation ..................................................................................10 4. X-ray diffraction pattern for the rougher tailing product from single stage ASH flotation. Peaks which correspond to quartz are indicated by the green lines................................................................11
5. X-ray diffraction pattern for the phosphate concentrate from single stage ASH flotation ..................................................................................12 6. X-ray diffraction pattern for the phosphate concentrate from single stage ASH flotation. Peaks which correspond to fluoroapatite are indicated by the green lines .....................................................13 7. Phosphate (fluoroapatite) and gangue (quartz) mineral particles as found in the flotation products .......................................................................15 8. Modified ASH-2C system with high-solids conditioning tank, discharge valve, and feed sump. The ASH-2C is shown on right side in the middle of the photograph. See Figure 11. ........................................17 9. The pilot-plant installation of the ASH-2C system for high-solids conditioning and discharge valve to the feed sump ............................................18
10. Feed sump with slurry feed control valve and pulp circulation system ................................................................................................................19
11. ASH-2C unit, feed pipe, and slurry pressure gage..............................................20 12. Rotameter for the control of air flow to the ASH-2C .........................................21 13. Air-sparged hydrocyclone flotation system ........................................................26 14. Single stage air-sparged hydrocyclone flotation performance as a function of A* (overflow opening area/underflow opening area) for rougher flotation feed (minus 35 mesh, 3.25% P2O5) ..................................28 15. Single stage air-sparged hydrocyclone flotation performance as a function of Q* (air flowrate/slurry flowrate) for rougher flotation feed (minus 35 mesh, 3.42 % P2O5) ...................................................................29 16. Single stage air-sparged hydrocyclone flotation performance as a function of collector dosage for rougher flotation feed (minus 35 mesh, 3.25% P2O5) .............................................................................................30 17. Single stage air-sparged hydrocyclone flotation performance as a function of vortex finder depth for rougher flotation feed (minus 35 mesh, 3.34% P2O5) .......................................................................................31 18. Single stage air-sparged hydrocyclone flotation performance as a function of particle size for rougher feed (minus 35 mesh, 3.51% P2O5) ..................................................................................................................33

xii
LIST OF FIGURES (CONT.)
Figure Page
19. The relationship between the coarse particle size flotation limit (Dmax) and centrifugal acceleration for the coal/MIBC system and the quartz/amine system. Theoretical considerations suggest
that Dmax=f tVR
2
which tends to be confirmed by the
experimental data ...............................................................................................35 20. The effect of amine addition on the bench scale amine flotation of quartz
from the rougher phosphate concentrate (25.5% P2O5) .....................................39 21. The effect of pH on the bench scale amine flotation of quartz from the rougher phosphate concentrate (25.5% P2O5)...............................................41 22. The effect of amine addition on single stage air-sparged hydrocyclone (ASH-2C) flotation of quartz from the rougher phosphate concentrate (25.5% P2O5) ..................................................................43 23. The effect of Q* (air flowrate/slurry flowrate) on single stage air-sparged hydrocyclone (ASH-2C) flotation of quartz from the rougher phosphate concentrate (25.5% P2O5) ....................................................44 24. Comparison of the particle size distribution for amine flotation feed with the particle size distribution of the rougher flotation feed......................................................................................................................45 25. Surface tension and froth height as a function of surfactant concentration natural pH (fatty acid data at pH=5.0, oleic acid data at pH=6.2) ...................................................................................................49 26. Surface tension as a function of pH (total reagent concentration 344 mg/l) ............................................................................................................51 27. Froth height as a function of pH (total reagent concentration 344 mg/l) ............................................................................................................52 28. Effect of fuel oil addition (by weight) on the surface tension (total reagent concentration 344 mg/l) ........................................................................53 29. Froth stability as a function of oil fraction (by weight) of the reagent mixture (total reagent concentration 344 mg/l) .....................................54 30. Water contact angle as a function of fatty acid addition for different phosphate minerals at a natural pH of 5.0 ...........................................56 31. Water contact angle as a function of pH for different minerals (fatty acid addition 344 mg/l) ............................................................................ 57 32. Comparison of contact angles measured using water drop and collector
solution drop (fatty acid addition 344 mg/l) ...................................................... 59 33. Effect of pH on the bench flotation of rougher phosphate feed......................... 60

xiii
LIST OF FIGURES (CONT.)
Figure Page
34. Water contact angle as a function of fuel oil fraction in the surfactant solution (total reagent mixture, fuel oil + fatty acid is 344 mg/l) ............................................................................................................61 35. 6-inch ASH flotation system ..............................................................................65 36. Air supply system for the 6-inch ASH................................................................65 37. ASH-6C unit and sampler ..................................................................................66 38. Feed sump for 6-inch ASH ................................................................................67 39. Feed pump for 6-inch ASH ................................................................................68 40. Air regulator, air flowrate control valve and pressure gage for 6-inch ASH .......................................................................................................69 41. Air compressor for 6-inch ASH air supply ........................................................69 42. Crud deposit on the surface of the porous tube...................................................74 43. IR spectrum of amine in CCl4.............................................................................78 44. IR spectrum of fatty acid in CCl4 .......................................................................79 45. IR spectrum of soluble crud components in CCl4 ..............................................80 46. Laboratory crud formation test unit ....................................................................82 47. Permeability change for the initial crud formation test.......................................84 48. Permeability change for the repeat tests with porous stainless steel tube...............................................................................................85 49. Permeability changes for the plastic porous tubes of different pore sizes.............................................................................................................87 50. Permeability change for the plastic porous tube and porous stainless steel tube .............................................................................................................88 51. Permeability change for porous stainless steel tube with positive electric field and without electric field ...............................................................89 52. Permeability change for porous stainless steel tube with negative electric field and without electric field ...............................................................90 53. Permeability change after crud formation and cleaning tests for porous stainless steel tube ..................................................................................91 54. Facility for the pilot-plant crud formation test....................................................93 55. The change of slime fraction with operating time in the pilot- plant crud formation test .....................................................................................94 56. Comparison of relative permeability change for porous stainless steel tubes with pore sizes of 20 µm and 1 µm ....................................95 57. Comparison of permeability change for porous stainless steel tubes with pore sizes of 20 µm and 1 µm ..........................................................96 58. Comparison of relative permeability for the fine and coarse plastic porous tubes ........................................................................................................98

xiv
Figure Page
59. Comparison of relative permeability for the porous stainless steel and plastic porous tubes......................................................................................99 60. Comparison of relative permeability for the ceramic and plastic porous tubes ......................................................................................................101 61. Comparison of relative permeability for the wired stainless steel and plastic porous tubes............................................................................102 62. Comparison of relative permeability for the hydrophilic and hydrophobic plastic porous tubes......................................................................103 63. Comparison of relative permeability for the plastic porous tubes with and without adding detergent ...................................................................104 64. Comparison of relative permeability for the plastic porous tubes with and without cleaning.................................................................................106 65. Crud build-up was reduced at stainless steel porous tube with electric field (after 18 hours' operation)............................................................107 66. Statistics of flotation performance (BPL and recovery of phosphate) for plant-site test using ASH-2C system ........................................108 67. Statistics of flotation performance (grade and rejection of insolubles) of plant-site test using ASH-2C system .........................................109 68. Plant-site test result of crud formation for the stainless steel ASH-6C with electric field (relative permeability) ..........................................111 69. Plant-site test result of crud formation for the stainless steel ASH-6C with electric field (air permeability) ..................................................112 70. Flotation performance of plant-site test using ASH-6C system ..............................................................................................................113
AP-C1. Initial crud formation test results for plastic porous tubes of different pore sizes............................................................................................C-1 AP-C2. Crud formation repeat tests with porous stainless steel tube ............................C-2 AP-C3. Comparison of crud formation test results for plastic porous tubes with different pore sizes....................................................................................C-3 AP-C4. Comparison of crud formation test results for plastic porous tube and porous stainless steel tube ..........................................................................C-4 AP-C5. Comparison of crud formation test results for porous stainless steel tubes with positive electric field and without electric field......................C-5 AP-C6. Comparison of crud formation test results for porous stainless steel tubes with negative electric field and without electric field .....................C-6 AP-C7. Results of cleaning test for porous stainless steel tube .....................................C-7 AP-C8. Crud formation test result for the porous stainless steel tube with pore size 20 µm with an electric field of potential of 80 volts .........................C-8
LIST OF FIGURES (CONT.)

xv
Figure Page AP-C9. Crud formation test result for the porous stainless steel tube with pore size 1 µm, no electric field................................................................C-9 AP-C10. Plant-site test result of crud formation for the fine plastic porous tube..................................................................................................................C-10 AP-C11. Plant-site test result of crud formation for the coarse plastic porous tube......................................................................................................C-11 AP-C12. Plant-site test result of crud formation for the porous stainless steel tube .........................................................................................................C-12 AP-C13. Plant-site test result of crud formation for the ceramic porous tube..................................................................................................................C-13 AP-C14. Plant-site test result of crud formation for the wired stainless steel tube with smooth inner surface...............................................................C-14 AP-C15. Plant-site test result of crud formation for the plastic porous tube when detergent was added in feed ..........................................................C-15 AP-C16. Plant-site test result of crud formation for the plastic porous tube while cleaning every 6 hours...................................................................C-16 AP-D1. Crud build-up at the fine plastic porous tube surface (after
18 hours’ operation) ......................................................................................... D-1 AP-D2. Crud build-up at the coarse plastic porous tube surface
(after 18 hours’ operation) ............................................................................... D-2 AP-D3. Crud build-up at stainless steel porous tube surface (after 16 hours' operation) ........................................................................................ D-3 AP-D4. Crud build-up at the ceramic porous tube surface (after 18 hours' operation) .............................................................................................. D-4 AP-D5. Crud build-up at the wired steel porous tube surface (smooth) (after 16 hours' operation)................................................................................ D-5 AP-D6. Crud build-up at the wired steel porous tube surface (rough) (after 9 hours' operation) ................................................................................. D-6 AP-D7. Crud build-up at the plastic porous tube when detergent was added with feed (after 18 hours' operation) .................................................... D-7 AP-D8. Crud build-up at plastic porous tube after cleaning with detergent (after 12 hours' operation) ............................................................... D-8
LIST OF FIGURES (CONT.)

xvi
LIST OF TABLES
Table Page
1. Typical Plant Conditions for Rougher Flotation of Florida Phosphate ..............................................................................................................6 2. Particle Size Analysis for Feed As Received and After 30 Minutes Conditioning ......................................................................................8 3. Feed Size Analysis and P2O5 Distribution for Rougher Flotation Feed .....................................................................................................14 4. Results from SEM-Microprobe Analysis for Phosphate Particles of Different Colors ...............................................................................14 5. Bench-Scale Flotation Results--Effect of Collector Dosage...............................22 6. Bench-Scale Flotation Results--Effect of Water Glass Dosage..........................23 7. Bench-Scale Flotation Results--Effect of pH .....................................................23 8. Bench-Scale Flotation Results--Effect of Fatty Acid to Fuel Oil Ratio..............................................................................................................24 9. Appropriate Conditions for Single Stage ASH-2C Flotation of Rougher Feed..................................................................................................32 10. Results from Single Stage ASH-2C Flotation of Rougher Feed (3.45 % P2O5) under Appropriate Experimental Conditions as Specified in Table 9 .....................................................................32 11. Results from Two-Stage ASH-2C Flotation of Rougher Feed (3.40 % P2O5) ............................................................................................34 12. Size Analysis and P2O5 Distribution for the Amine Flotation Feed ...................37 13. The Effect of A* (Overflow Opening Area/Underflow Opening Area) on Amine Flotation of Quartz from the Rougher Phosphate Concentrate with the ASH-2C ............................................................................40 14. Chemicals and Suppliers.....................................................................................47 15. Design Variable Scale-up from the 2-Inch ASH-2C to the 6-Inch ASH-6C ..................................................................................................63 16. Initial Operation Variables for the 6-Inch ASH-6C in Plant Test ......................64 17. Results from the Amine Dosage Test ...............................................................70 18. Results of A* Test on Single-Stage Amine Flotation .......................................71 19. Effect of Varying Q* on Single-Stage Amine Flotation in Plant Test ............................................................................................................72 20. Effect of Vortex Finder Depth on Single-Stage Amine Flotation ......................72 21. Average Results for In-Plant Amine Flotation Operating Continuously for 6 Hours....................................................................................73 22. Comparison of Single-Stage Results for ASH-2C, ASH-6C, and Typical Plant Performance.........................................................................118
1
EXECUTIVE SUMMARY
Air-sparged hydrocyclone (ASH) flotation technology is a new technology developed at the University of Utah over the past decade. During this time the ASH technology with its extremely high specific capacity (frequently greater than 100 times the specific capacity of convention flotation equipment) has been demonstrated in a number of applications, including its use for western phosphate flotation. These results suggested that ASH flotation technology can be used to good advantage in the Florida phosphate industry and in this regard, FIPR granted funds to the University of Utah (FIPR # 93-02-098) to demonstrate the feasibility of ASH flotation technology for the efficient recovery of phosphate minerals from fine flotation feed (35x150 mesh). The ASH flotation technology has been evaluated for use by the Florida phosphate industry, in pilot-plant and plant-site studies and the experimental results are significant. Specifically, ASH separation efficiencies equivalent to, if not better than, plant performance were achieved at specific capacities of at least 50 times that of conventional flotation equipment. For example, the range of results reported by plant operation are compared with pilot-plant results using a two-inch ASH system in the following table. These results demonstrate the potential impact of ASH flotation. Comparison of Plant Performance with Pilot-Plant Single-Stage ASH-2C Flotation Results.
P2O5 Recovery (%) Grade P2O5% ASH Plant ASH Plant Rougher Phosphate Flotation 76.9 80 - 85 23.6 22.9 - 25.2 Amine Flotation 98.3 9o - 98 31.5 31.6 - 32.5
Based on plant surveys during the project initiation, arrangements were made for
the procurement of plant samples and reagents with the help of FIPR and Global Consulting. In addition, analytical techniques were established, and characterization of the fine feed to rougher flotation was accomplished, as well as benchmark batch flotation experiments in a conventional flotation cell. During the second quarter of the first year, rougher phosphate flotation of the fine feed (35×150 mesh and 3.5% P2O5) was studied in pilot plant test with the 2-inch diameter ASH-2C system at the University of Utah. As expected, flotation of the coarse particles in the feed was difficult with the ASH-2C, but, after appropriate adjustment of the system variables, effective separations were made as indicated by the following results.

2
(35 ××××150 Mesh) with the ASH-2C.
Product Wt % % P2O5 P2O5 Distribution (%) Concentrate 11.3 23.55 76.9 Tail 88.7 0.90 23.1 Feed 100.0 3.45 100.0
With two stages of rougher flotation, the phosphate recovery could be improved to 86.7% with a grade of 21.86% P2O5. Typically the rougher phosphate concentrate from plant operations will contain 20-25% P2O5. In the third quarter of the first year, use of the ASH technology for amine flotation of quartz from the rougher phosphate concentrate (25.5% P2O5) was evaluated with the ASH-2C in pilot-plant tests at the University of Utah. Samples of rougher phosphate concentrate were obtained with the help of FIPR and Global Consulting. Excellent separations were obtained as indicated by the following results. Pilot-Plant Single-Stage Amine Flotation of Quartz from the Rougher Phosphate Concentrate with the ASH-2C.
Product Wt % % P2O5 P2O5 Distribution (%) Concentrate 79.5 31.51 98.3 Tail 20.5 2.15 1.7 Feed 100.0 25.50 100.0
Finally, during the first year, surface chemistry study of phosphate flotation was carried out. The research included measurements of the surface tension and froth stability of collector solutions, and measurement of the contact angles for polished sections of Florida phosphate pebbles of different color (white, tan, and black). During the second year of the ASH research program, further testing of amine flotation at a capacity of about 5 tph dry solids was accomplished with the ASH-2C, and on this basis plant testing of the 6-inch ASH-6C was initiated at a plant in central Florida. Again excellent separations were achieved at a capacity of about 5 tph dry solids, as is shown in the following table:
Pilot-Plant Single Stage Rougher Phosphate Flotation of Fine Feed

3
Plant-Site Single-Stage Amine Flotation with the ASH-6C System.*
Grade BPL % Insol % BPL Recovery % Concentrate 66.04 6.32 91.20 Tail 19.55 68.19 8.80 Feed 100.00 21.60 100.00
* Operated continuously for six hours. These capacities represent an extraordinarily high specific capacity, fifty times the specific capacity of conventional and column flotation equipment. However, during plant-site testing crud formation and plugging of the porous tube occurred after 10 hours of operation. In view of the promising results, the research program was extended to determine the composition of the crud which was found to consist of 50% fine quartz and clay particles and 50% of an organic phase containing amine, fatty acid, and fuel oil. On this basis several different options were examined to overcome the plugging problem. These options included variation of pore size, different porous tube materials, electric field modulation and cleaning of the porous tube. The results of testing of the ASH-2C at the University of Utah indicated that the stainless steel porous tube with an imposed electric field improves the life of the porous tube and reduces plugging. Therefore, a 6-inch stainless steel ASH-6C with an electric field system was set up at the plant site and evaluated. The results indicate that the plugging is still a problem and further research will be required to solve this problem. It was found that this problem of crud formation and plugging is most significant at the plant site and occurs after only 8 hours of operation. Tests corresponding to plant-site tests were conducted with the ASH-2C system at the University of Utah using tap water and plant feed and reagents and no crud formation or plugging was found even after 24 hours of operation. From the results of plant-site tests, the efficiency of the ASH flotation technology for amine flotation was found to be equivalent to, or exceed, that of conventional flotation with mechanical cells. Further, the specific capacity of the ASH system was found to be at least 50 times that for conventional flotation. However, at this particular plant-site, crud formation and plugging of the porous tube was found to limit the utility of the ASH technology. Further study of, and new designs for, the porous tube are warranted. Other applications of the ASH technology should be considered to avoid the plugging problem, for example, the direct amine flotation of extra fine feed (100µm × 20µm) is recommended for further study.

5
INITIAL RESEARCH EFFORTS
During the first quarter of the project, from May 16, 1994 to August 31, 1994, the major research activities were: (1) organization of the research team in order to successfully conduct the project; (2) completion of phosphate plant survey and sample collection; (3) construction of a high-solids phosphate conditioning tank; (4) set-up and installation of a reliable ASH-2C flotation system at the University of Utah; and (5) initiation of bench-scale flotation experiments. The following progress was made during the first quarter: PLANT SURVEY AND SAMPLE COLLECTION An initial survey of two typical phosphate plants (Noralyn Plant and Rockland Plant) which are mining and processing low MgO phosphate rock in central Florida was carried out by Dr. Qiang Yu and Mr. Yongquiang Lu (University of Utah), Dr. Hassan El-Shall (Global Marketing & Consulting Company (GMCC)), as well as Dr. Patrick Zhang (FIPR) at the beginning of the research program (May 26-June 1, 1994). The existing conditions for plant operations (slurry conditioning, reagent schedule, flotation time, concentrate grade, and phosphate recovery) were obtained in order to establish a bench mark for subsequent ASH flotation tests. About 1,400 lb. of representative fine flotation feed material (wet sample) was collected at another phosphate plant in central Florida by GMCC at a sampling frequency of 1.5 hours over a total period of four day shifts. About 1,100 lb. of the sample was shipped to the pilot-plant facilities at the University of Utah. In addition, five gallons of plant water and an appropriate amount of fatty acid and fuel oil (Fatty Acid Blend from Westvaco, Mulberry, Fla. and Fuel Oil No. 5 from IPC, Plant City, Fla.) were collected and shipped to the laboratory at the University of Utah by GMCC. Some pure phosphate mineral and gangue minerals were collected from the same plant and were used for characterization and surface chemistry studies. Typical conditions for flotation are described on Table 1. A typical grade for the rougher phosphate concentrate of about 50 BPL can be used to make a decision regarding the level of collector addition. The rougher tail assay should be 2-3 BPL which results in a phosphate recovery of 80-85%.

6
Table 1. Typical Plant Conditions for Rougher Flotation of Florida Phosphate.
ITEMS CONDITIONS NOTES Conditioning Percent Solids > 74% Vertical stirred tank Conditioning pH 9.2-9.5 Conditioning Time/ 4.0 minutes
90-120 seconds For plant operation For batch flotation
pH Modifier Soda ash Water Glass 0.1 lb/ton Silica depressant Fatty Acid/Fuel Oil Mixture 2-3 lb/ton Ratio 6/4-7/3 Size of Feed Material -35 mesh Feed Assay 7-9 BPL
SAMPLE PREPARATION AND CHARACTERIZATION The fine flotation feed (reported to be minus 35 mesh) was completely mixed and further split into 20 kg samples at the pilot-plant facilities. Each sample was kept in a wet condition (~85% solids by weight) with plant-operation water. The densities of typical phosphate concentrate (31.31% P2O5 and 8.3% insol.) and the tailing product (0.07% P2O5 and 99.20% insol.), as obtained from bench flotation, were found to be 3.12 g/cm3 and 2.66 g/cm3 respectively as determined by helium pycnometry. The particle size distributions for both fine flotation feed, as received and after 30 minutes high solids conditioning (70% solids at the pilot-plant facilities), were determined in order to examine the effect of extensive high solids conditioning. About two hundred grams of each sample was screened(wet/dry) and seven size fractions (+35, 35x60, 60x100, 100x150, 150x200, 200x400, -400 mesh) were obtained and weighed. The results from the particle size analysis are presented in Figure 1 and Table 2. It is evident that the extensive high solids conditioning has not created a significant production of fines. The particle size distribution has remained essentially unchanged. Further, as shown in Table 2, a significant amount of feed material (7.3% by weight) was found to be >35 mesh and some particles were found to be greater than 5 mm in size (see Figure 2). Such large-size particles in the feed material will plug the 2-inch air-sparged hydrocyclone (ASH) underflow. Therefore, for all ASH tests it was decided to screen the feed material prior to ASH flotation. In addition, a significant amount of wood chips (~0.3% by weight >35 mesh) was also found in the feed.

7
Size (mesh)
Wei
ght P
erce
ntag
e
0
5
10
15
20
25
30
35
40
45
50Feed as receivedFeed after 30 minutes conditioning
x35 35x60 60x100 100x150 150x200 200x400 -400
Size (mesh)
Wei
ght P
erce
ntag
e
0
5
10
15
20
25
30
35
40
45
50
Feed as receivedFeed after 30 minutes conditioning
x35 35x60 60x100 100x150 150x200 200x400 -400
Figure 1. Particle Size Distribution of Both Original and Conditioned
Feed Material.

8
Table 2. Particle Size Analysis for Feed As Received and After 30 Minutes
Conditioning. Size (mesh) +35 35x60 60x100 100x150 150x200 200x400 -400 Feed as Received
7.32 43.46 37.35 9.02 2.25 0.5 0.1
Feed after 30 Minutes Condition
7.29 43.13 37.52 8.95 2.24 0.67 0.2
The sample collected during the first quarter was exhausted so additional samples from the same plant were collected and shipped by Dr. Hassan El-Shall, Global Marketing & Consulting Companies. These additional samples which included 1000 lb. rougher feed sample, 1000 lb. amine feed, and 750 lb. amine tails as collected by GMCC on Sept. 9, 1994, were shipped to the University of Utah. The amine feed sample was used to evaluate the ASH system for reverse flotation of quartz (see the section on "Amine Flotation with the ASH-2C System - Pilot Plant Study"). The results from size analysis of the rougher feed material are presented in Table 3 including chemical analysis and the distribution of P2O5 values. It can be seen that the P2O5 was distributed mainly in the plus 100 mesh fraction. The grade of P2O5 in the coarse fraction is significantly greater than that in the finer size fractions. Figures 3, 4, 5 and 6 show the results from x-ray diffraction analysis. From Figure 4, it can be seen that the peak positions and relative intensities of the tailing product correspond to the diffraction pattern for quartz, thus indicating that quartz is the main component of the tailing product. Also it can be concluded that the main phosphate mineral in the concentrate is fluoroapatite as is evident from the diffraction data presented in Figures 5 and 6. Three colors of phosphate mineral; white, black and gray were identified by optical microscopy as can be seen from Figure 7. The results from SEM-microprobe analysis of the phosphate minerals of different color are presented in Table 4. It appears that the coloration of the phosphate particle types may be due to a higher carbon level associated with organic impurities. For example the black phosphate particles have a significantly greater carbon content. Table 4 shows that the Si content of these phosphate minerals was very low (about 0.3-0.6%), and indicates that the phosphate minerals are liberated from the quartz gangue as is evident from the photographs presented in Figure 7.
9
Figure 2. Large Size Particles (>14 Mesh) in the Original Feed.

10
Figu
re 3
. X
-Ray
Dif
frac
tion
Pat
tern
for
the
Rou
gher
Tai
ling
Prod
uct
f
rom
Sin
gle
Stag
e A
SH F
lota
tion
.

11
Figu
re 4
. X
-Ray
Dif
frac
tion
Pat
tern
for
the
Rou
gher
Tai
ling
Prod
uct f
rom
Sin
gle
Stag
e A
SH F
lota
tion
. Pe
aks
whi
ch c
orre
spon
d to
qua
rtz
are
i
ndic
ated
by
the
gree
n lin
es.

12
Figu
re 5
. X
-Ray
Dif
frac
tion
Pat
tern
for
the
Phos
phat
e C
once
ntra
te f
rom
Sin
gle
Stag
e A
SH F
lota
tion
.

13
Figu
re 6
. X
-Ray
Dif
frac
tion
Pat
tern
for
the
Phos
phat
e C
once
ntra
te f
rom
Sin
gle
Stag
e A
SH
F
lota
tion
. Pe
aks
whi
ch c
orre
spon
d to
flu
oroa
patit
e ar
e in
dica
ted
by th
e gr
een
lines
.

14
Table 3. Feed Size Analysis and P2O5 Distribution for Rougher Flotation
Feed.
Size Mesh Weight % P2O5 % P2O5 Distribution % 35 x 60 45.89 4.76 59.16 60 x 100 41.30 3.23 36.13 100 x 150 9.73 1.25 3.29 -150 3.08 1.70 1.42 Composite 100.00 3.69 100.00
Table 4. Results from SEM-Microprobe Analysis for Phosphate Particles of
Different Colors.
Elemental Analysis (%) Apatite C O F Na Mg Al Si P S Cl K Ca Ce White 1 13.27 51.24 5.70 0.21 0.07 0.38 0.27 9.66 1.02 0.00 0.02 18.14 0.01 White 2 17.58 48.81 4.24 0.06 0.03 0.82 0.29 10.02 0.05 0.01 0.01 18.08 0.00 White 3 10.62 55.15 4.97 0.49 0.24 0.56 0.44 9.39 0.44 0.00 0.04 17.66 0.00 Average 13.82 51.73 4.97 0.25 0.11 0.59 0.33 9.69 0.50 0.00 0.02 17.96 0.00 Black 1 13.72 53.23 4.90 0.34 0.15 0.97 0.61 9.09 0.53 0.04 0.05 16.38 0.01 Black 2 34.25 38.93 3.07 0.19 0.10 1.65 0.39 6.44 0.18 0.10 0.03 13.35 1.21 Black 3 20.13 49.07 4.58 0.28 0.24 1.54 0.94 7.48 0.26 0.01 0.09 15.13 0.25 Average 22.70 47.08 4.18 0.27 0.16 1.39 0.65 7.67 0.32 0.05 0.06 14.95 0.49 Gray 1 13.09 50.86 5.61 0.64 0.20 0.54 0.68 9.26 0.87 0.01 0.09 18.15 0.00 Gray 2 11.83 52.12 5.14 0.28 0.10 0.44 0.63 10.64 0.42 0.01 0.08 18.29 0.01 Average 12.46 51.49 5.38 0.46 0.15 0.49 0.66 9.95 0.65 0.01 0.09 18.22 0.01

15
Figure 7. Phosphate (Fluoroapatite) and Gangue (Quartz) Mineral Particles as Found in the Flotation Products.

16
INSTALLATION OF PILOT-PLANT ASH-2C SYSTEM According to the project schedule for the first quarter, set-up and installation of the pilot plant ASH-2C system was accomplished with some new design features to appropriately conduct phosphate flotation using the air-sparged hydrocyclone technology. The modified ASH-2C system (Figure 8) includes: high solids (>70% by weight) reagent conditioning tank with an impeller for stirring (Figure 9), high solids slurry discharge valve (Figure 9), and feed sump and pulp circulation pipe (Figures 9 and 10). In addition, the system includes slurry feed pipe and pressure gage (Figure 11), rotameters for air flowrate control (Figure 12), and slurry pressure control valve and fresh water washing system (Figure 10). The ASH-2C system was installed in such a way to insure that efficient and reliable ASH experiments can be carried out in a reasonable time interval so that more design and operating variables can be established for each ASH experiment which involves from 20-40 kg feed material depending on the percent solids to be examined. BENCH-SCALE FLOTATION EXPERIMENTS During the first quarter of the project (May 16, 1994-August 30,1994) a series of 2-liter bench scale flotation experiments were conducted in order to establish a suitable reagent schedule for ASH flotation. These experiments involved reagents currently used at the plant site. The effects of collector addition, water glass (depressant) addition, flotation pH, and fatty acid to fuel oil ratio were studied. The flotation conditions and results are listed in Tables 5 to 8. The initial chemical analysis of product samples was provided by FIPR to establish calibration standards for subsequent analysis at the University of Utah. Analysis of bench flotation products was done by the wet chemical method (refer to the appendix) and the results are presented in Tables 5 to 8.

17
Figure 8. Modified ASH-2C System with High-Solids Conditioning Tank, Discharge Valve, and Feed Sump. The ASH-2C Is Shown on Right Side in the Middle of the Photograph. See Figure 11.

18
Figure 9. The Pilot-Plant Installation of the ASH-2C System for High-Solids
Conditioning and Discharge Valve to the Feed Sump.

19
Figure 10. Feed Sump with Slurry Feed Control Valve and Pulp Circulation
System.

20
Figure 11. ASH-2C Unit, Feed Pipe, and Slurry Pressure Gage.

21
Figure 12. Rotameter for the Control of Air Flow to the ASH-2C.

22
As shown in Table 5, when the collector dosage was 0.35 lb./ton flotation performance was poor and essentially no recovery was achieved. When the collector dosage was increased to between 0.75 lb./ton and 1 lb./ton, the flotation performance was excellent. Higher levels of collector addition were less effective, so it appears that the collector addition should be maintained at 0.75 to 1 lb./ton. The ratio of fatty acid to fuel oil has a significant effect on the flotation separation as shown in Table 8. The results suggest that the ratio should be set between 7/3 and 1/1. Water glass addition seemed to have little impact on the flotation separation as indicated in Table 6. The results presented in Table 7 show that the best separation was achieved at pH 9.5 and suggest that the pH should be maintained between pH 8.5 and 9.5. In general, the results agree with those that are reported in the literature. Table 5. Bench Scale Flotation Results--Effect of Collector Dosage.
Test # Collector
Dosage(lb/t) Products Yield % P2O5 % P2O5
Recovery % 18
0.35
Conc. Tailing Feed
0.00 100.00 100.00
20
0.75
Conc. Tailing Feed
12.70 87.30 100.00
23.23 0.53 3.40
86.76 13.24 100.00
21
1.50
Conc. Tailing Feed
30.10 69.90 100.00
9.68 0.86 3.51
82.91* 17.09 100.00
19
2.00
Conc. Tailing Feed
33.00 67.00 100.00
9.73 0.69 3.67
87.47 12.53 100.00
*This recovery is lower than expected and probably is due to some error in the experiment and/or analysis of products. Flotation Conditions: Collector: mixture of fatty acid and fuel oil at a ratio of 70 to 30 by weight. Pulp conditioned in a vertical tank at 70% solids content by weight for 1.5 minutes before flotation in a 2 liter Denver flotation cell at a speed of 900 RPM for 5 minutes. The solids content in the flotation cell was 30% by weight. High solids conditioning pH was 9.2, and the flotation pH was 7.8. Sodium carbonate was used for pH adjustment.

23
Table 6. Bench Scale Flotation Results--Effect of Water Glass Dosage.
Test # Water Glass Dosage(lb/t)
Products Yield %
P2O5 %
P2O5 Recovery %
31
0.0
Conc. Tailing Feed
29.80 70.20 100.00
9.47 0.78 3.37
83.68 16.32 100.00
21
0.1
Conc. Tailing Feed
30.10 69.90 100.00
9.68 0.86 3.51
83.91 17.09 100.00
30
1.0
Conc. Tailing Feed
30.60 69.40 100.00
10.44 0.67 3.65
87.40 12.60 100.00
Flotation Conditions: Collector dosage was fixed at 1.5 lb/ton; water glass was added after high solids conditioning with collector addition for 1.5 minutes. Flotation was accomplished in a 2 liter Denver cell. The solids content in the flotation cell was 30% by weight. High solids conditioning pH was 9.2, and the flotation pH was 7.8. Sodium carbonate was used for pH adjustment. Table 7. Bench Flotation Results--Effect of pH.
Test # Flotation
pH Products Yield
% P2O5 %
P2O5 Recovery %
36
5.5
Conc. Tailing Feed
0.00 100.00 100.00
35
6.7
Conc. Tailing Feed
5.60 94.40 100.00
26.68 2.06 3.44
43.31 56.39 100.00
32
8.8
Conc. Tailing Feed
13.60 86.40 100.00
19.30 0.97 3.46
75.72 24.27 100.00
33
9.5
Conc. Tailing Feed
11.20 88.80 100.00
22.11 0.88 3.26
76.07 23.93 100.00
34
10.1
Conc. Tailing Feed
10.90 89.10 100.00
19.95 1.37 3.40
63.82 35.88 100.00
Flotation Conditions: Collector (fatty acid to fuel oil ratio of 70 to 30 by weight) fixed at 0.75 lb/ton. High solids conditioning pH was fixed at 9.2 . Sodium carbonate was used for pH adjustment. All other conditions were the same as in previous experiments.
24
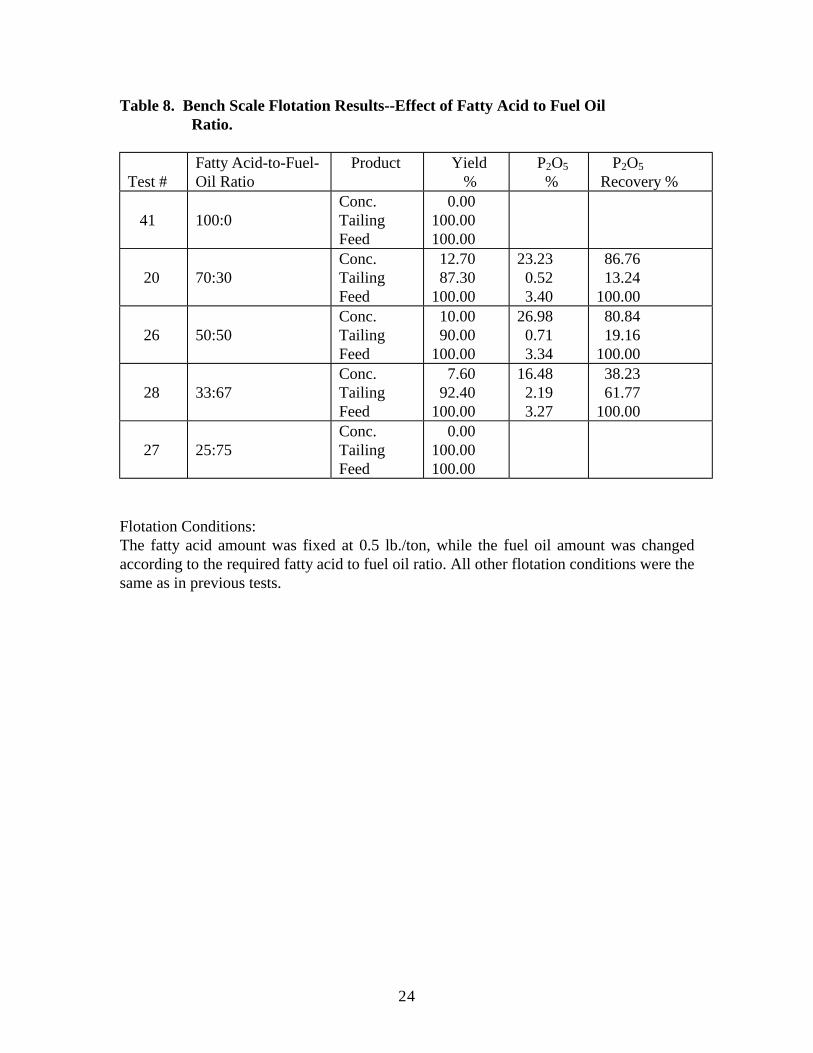
Table 8. Bench Scale Flotation Results--Effect of Fatty Acid to Fuel Oil Ratio.
Test #
Fatty Acid-to-Fuel-Oil Ratio
Product Yield %
P2O5 %
P2O5 Recovery %
41
100:0
Conc. Tailing Feed
0.00 100.00 100.00
20
70:30
Conc. Tailing Feed
12.70 87.30 100.00
23.23 0.52 3.40
86.76 13.24 100.00
26
50:50
Conc. Tailing Feed
10.00 90.00 100.00
26.98 0.71 3.34
80.84 19.16 100.00
28
33:67
Conc. Tailing Feed
7.60 92.40 100.00
16.48 2.19 3.27
38.23 61.77 100.00
27
25:75
Conc. Tailing Feed
0.00 100.00 100.00
Flotation Conditions: The fatty acid amount was fixed at 0.5 lb./ton, while the fuel oil amount was changed according to the required fatty acid to fuel oil ratio. All other flotation conditions were the same as in previous tests.

25
ROUGHER FLOTATION OF FINE PHOSPHATE FEED WITH THE ASH-2C SYSTEM
INTRODUCTION Two-inch air-sparged hydrocyclone (ASH-2C) flotation tests were carried out in pilot plant facilities at the University of Utah. Based on previous bench scale flotation results from the first quarter (see section on "Initial Research Efforts"), an appropriate reagent schedule was prepared and an exploratory series of tests was carried out with the ASH-2C to evaluate the phosphate ASH flotation response as a function of both operating variables(solution chemistry, percent solids, dimensionless flowrate, etc) and design variables (dimensionless area, vortex finder depth, etc). This initial pilot-plant test series was conducted in order to establish preferred conditions for ASH flotation of Florida phosphate, and to determine the influence of design and operating variables on the separation efficiency. Encouraging results were obtained with more than 76% P2O5 recovery from rougher feed material during single stage ASH flotation. PROCEDURE The pilot-plant flotation testing was carried out in the ASH-2C system as shown in Figure 13. A feed sample (about 20 Kg) was fed into the high solids conditioning tank. In the conditioning step Na2CO3 was added to adjust pH, and a mixture of fatty acid, fuel oil and frother was added to the slurry as the flotation reagents (see section on "Initial Research Efforts"). The fatty acid is the primary flotation reagent and other chemicals either help to extend the fatty acid or to stabilize the froth. The slurry was mixed for 5 minutes at 75% solids and then flowed by gravity into the feed sump. In the feed sump, the slurry was diluted to about 20% solids with the addition of fresh water and pumped into the 2 inch diameter ASH. The slurry flowrate to the ASH was adjusted by a control valve, and the air flowrate by a rotameter. The slurry pressure was varied from 1 psi to 10 psi. All the products from ASH flotation were collected, filtered, dried, weighed, and analyzed.

26
Figure 13. Air-Sparged Hydrocyclone Flotation System.
RESULTS In order to determine the proper values for the dimensionless variables A* (the ratio of overflow opening area to underflow opening area) and Q* (the ratio of air flowrate to slurry flowrate), for Florida phosphate flotation, ASH flotation tests for different A* and Q* were carried out. The results are presented in Figures 14 and 15. As is seen from the flotation response presented in Figure 14, the concentrate grade decreases from 25.64% to 23.25% while the recovery increases significantly from 34.27% to 61.28% with an increase in A*. Further increase of A* is difficult because the underflow opening area is too small for discharge of the tailing product. Therefore, A* should be fixed at 3.3 (which corresponds to an underflow rotation of one revolution and a vortex finder diameter of 1.17 inch).

27
Figure 15 shows the effect of Q* and the results demonstrate that an increased recovery and a decrease in P2O5 grade is obtained with an increase in Q*. The results suggest that Q* should be set at about 4.0 (Q* =3.67 corresponds to an air flowrate of 117.8 lpm and a slurry flowrate of 32.1 lpm). The effect of collector dosage on the flotation response is shown in Figure 16. The results indicate that an increased P2O5 recovery is possible at higher levels of collector addition. However, further increase in collector dosage beyond 3 lb/ton resulted in only a modest increase in recovery so a collector dosage of 3 lb/ton seems to be appropriate under these conditions. The test results for different vortex finder depths are shown in Figure 17. As seen from the curves in Figure 10, the P2O5 grade of the concentrate decreases with an increase in vortex finder depth. Notice that the grade decrease is very significant when the vortex finder depth is more than 3 inch. These results suggest that the vortex finder depth should be fixed at 3 inch. Based on the experimental results presented in Figures 14-17, appropriate ASH flotation conditions for rougher flotation have been established as indicated in Table 9, and the results for single stage ASH-2C flotation under these conditions are presented in Table 10. The data in Table 10 shows seen that the phosphate recovery reached 76.8 % in the overflow stream. In order to further evaluate these results, the ASH flotation products were sized and each size fraction was analyzed. The results are shown in Figure 18. As can be seen from the coarse particle size data presented in Figure 18, poor recovery occurs in the 35x48 mesh fraction (350 microns). A comparative batch test was made with the Denver flotation cell and the results of this test are included in Figure 18. It is evident that flotation is more effective at finer particle sizes with the ASH-2C. Because the ASH-2C has such a high capacity (the slurry flowrate is 32.1 lpm with retention time of 1.18 sec), complete recovery of the coarse particles is not possible in a single stage. Therefore for improved phosphate recovery, a second stage for scavenger flotation can be used. The results from two stage ASH-2C flotation experiments are presented in Table 11 where it can be seen that the total recovery increases to 86.2 % with a concentrate grade of 21.84% P2O5.

28
A* (Overflow Area/Underflow Area)2.25 2.50 2.75 3.00 3.25 3.50
Gra
de (P
2O5%
)
16
18
20
22
24
26
28R
ecov
ery
(%)
20
30
40
50
60
70
80
GradeRecovery
Figure 14. Single Stage Air-Sparged Hydrocyclone Flotation Performance as a Function of A* (Overflow Opening Area/Underflow Opening Area) for Rougher Flotation Feed (Minus 35 Mesh, 3.25% P2O5).
Flotation Conditions: Collector (fatty acid to fuel oil ratio of 7/3 by weight) was fixed at 2 lb/ton; insert depth of vortex finder at 3 inches; diameter of vortex finder at 1.175 inch; Q* at 3.67 (an air flowrate of 117.8 lpm and a slurry flowrate of 32.1 lpm). High solids conditioning was 75% by weight at pH 9.2. Flotation pulp was diluted to 20% solids by weight.

29
Q* (Air Flowrate/Slurry Flowrate)1 2 3 4 5 6 7
Gra
de (P
2O5%
)
12
16
20
24
28R
ecov
ery
(%)
20
30
40
50
60
70
80
GradeRecovery
Figure 15. Single Stage Air-Sparged Hydrocyclone Flotation Performance as a
Function of Q* (Air Flowrate/Slurry Flowrate) for Rougher Flotation Feed (Minus 35 Mesh, 3.42% P2O5).
Flotation Conditions: A* was fixed at 3.3. All other conditions were the same as described in Figure 14.

30
Collector Dosage (lb/ton)1.0 1.5 2.0 2.5 3.0 3.5 4.0 4.5
Gra
de (P
2O5%
)
16
18
20
22
24
26
28R
ecov
ery
(%)
30
40
50
60
70
80
GradeRecovery
Figure 16. Single Stage Air-Sparged Hydrocyclone Flotation Performance as a
Function of Collector Dosage for Rougher Flotation Feed (Minus 35 Mesh, 3.25% P2O5).
Flotation Conditions: A* was fixed at 3.3 and Q* was fixed at 3.67. All other conditions were the same as described in Figure 14.

31
Depth of Vortex Finder (inch)1.0 1.5 2.0 2.5 3.0 3.5 4.0
Gra
de (P
2O5%
)
16
18
20
22
24
26
28R
ecov
ery
(%)
40
50
60
70
80
90
GradeRecovery
Figure 17. Single Stage Air-Sparged Hydrocyclone Flotation Performance as a
Function of Vortex Finder Depth for Rougher Flotation Feed (Minus 35 Mesh, 3.34% P2O5) .
Flotation Conditions: Collector (fatty acid to fuel oil ratio of 7/3 by weight) was fixed at 2.0 lb/ton. A* was fixed at 3.3. Q* was fixed at 3.67. All other conditions were the same as described in Figure 14.

32
Table 9. Appropriate Conditions for Single-Stage ASH-2C Flotation of Rougher Feed (See Table 1).
Item Condition Notes Conditioning pH 9.2 Na2CO3 for pH adjustment Conditioning Density 75% solids by weight Conditioning Time 5 minutes Collector Dosage 3 lb/ton Fatty Acid : Fuel oil at 7/3 by weight Frother Surfactant 2 lb/ton Lion Industry Inc. A* 3.3 Q* 3.67 Air flowrate: 117.79 lpm
Slurry flowrate: 32.1 lpm Slurry Density 20 % solids by weight Vortex Finder Diameter 1.17 inch Vortex Finder Depth 3 inch
Table 10. Results from Single-Stage ASH-2C Flotation of Rougher Feed (3.45% P2O5)
under Appropriate Experimental Conditions as Specified in Table 9.
Products Wt % P2O5% Recovery % Overflow 11.27 23.53 76.85 Underflow 88.73 0.90 23.15
Feed 100.00 3.45 100.00 DISCUSSION It is clear that there is some concern regarding the recovery of coarse phosphate values from the rougher feed by ASH-2C flotation. This situation can be improved with a scavenger stage as indicated from the data presented in Table 11. However, it must be remembered that the particle size flotation limit (Dmax) for a given state of hydrophobicity, is determined by the acceleration experienced in the centrifugal field of the swirl flow (Vt2/R). Thus for a given inlet velocity, the coarse particle recovery by ASH flotation will increase with an increase in ASH diameter. In fact, theory predicts that Dmax=f(Vt2/R)-1/2. This expectation has been realized both in the case of coal flotation and in the case of quartz flotation as shown in Figure 19. The significance of ASH diameter needs to be examined in the case of phosphate flotation to establish the coarse particle size flotation limit for ASH flotation of phosphate rock.

33
Particle Size (microns)0 50 100 150 200 250 300 350 400
Rec
over
y (%
)
20
30
40
50
60
70
80
90
100
Batch flotationASH flotation
Figure 18. Single Stage Air-Sparged Hydrocyclone Flotation Performance as
a Function of Particle Size for Rougher Feed (Minus 35 Mesh, 3.51% P2O5).
Flotation Conditions: Batch flotation was carried out in a 2 liter Denver flotation cell with 3 lb./ton collector (fatty acid to oil = 7/3), 2 lb./ton surfactant, at pH 9.2, until all the froth product was collected (overall recovery =91.66 %, flotation time = 7 min.). ASH flotation was carried out at the same reagent dosages as used in batch flotation experiments. Other conditions were as described in Figure 7. (overall recovery =76.17 %, flotation time = 1.18 sec).

34
Table 11. Results from Two-Stage ASH-2C Flotation of Rougher Feed (3.40%
P2O5).
Stage Product Yield % P2O5%
Recovery %
Rougher Overflow 8.48 25.70 64.86 Underflow 91.52 1.29 35.14 Feed 100.00 3.36 100.00 Scavenger Overflow 5.38 15.23 62.48 Underflow 94.62 0.52 37.52 Feed 100.00 1.31 100.00 Total Concentrate 13.40 21.86 86.68 Tailing 86.60 0.52 13.32 Feed 100.00 3.38 100.00
Conditions: In order to increase the grade of the rougher concentrate, A* was changed from 3.3 to 2.87. The scavenger stage used the same A* of 2.87. All other conditions were the same as in previous experiments.

35
Figure 19. The Relationship Between the Coarse Particle Size Flotation Limit
(Dmax) and Centrifugal Acceleration for the Coal/MIBC System and the Quartz/Amine System. Theoretical Considerations
Suggest that D f vR
tmax =
−212
, Which Tends To Be Confirmed
by the Experimental Data.

37
AMINE FLOTATION WITH THE ASH-2C SYSTEM – PILOT-PLANT STUDY
INTRODUCTION Rougher phosphate concentrates contain a sufficient quantity of quartz and other gangue minerals, and are unsuitable for further chemical processing. In order to produce a satisfactory product, amine flotation is used to remove residual quartz and gangue minerals and produce a final phosphate concentrate. In this regard amine flotation was carried out in the ASH-2C system to evaluate ASH flotation for the removal of quartz and gangue minerals from the rougher concentrate. SAMPLE--ROUGHER PHOSPHATE CONCENTRATE The feed for amine flotation experiments, the rougher phosphate concentrate, was collected from plant operations by Global Marketing & Consulting Companies and shipped to the University of Utah. The sample was taken after treatment by acid scrubbers to remove fatty acid/oil from the surface of phosphate mineral particles. The particle size distribution and size by size P2O5 analysis are presented in Table 12. Most of the phosphate mineral particles in the feed (>75%) are distributed in 35x80 mesh size fraction. Table 12. Size Analysis and P2O5 Distribution for the Amine Flotation Feed.
Size, mesh Wt. % % P2O5 P2O5 Distribution % + 35 4.68 33.37 6.19 35x60 33.13 32.67 42.90 60x80 25.89 28.65 29.40 80x100 10.30 23.57 19.62 100x170 16.75 13.74 9.12 -170 9.25 7.52 2.76 100.00 25.23 100.00
FLOTATION EXPERIMENTS Bench-Scale Amine Flotation A series of 2-liter bench-scale flotation experiments was conducted with a Denver flotation machine in order to establish a suitable reagent schedule for amine flotation in the ASH-2C. These tests involved variations in the amine dosage and flotation pH. The flotation tests were performed in a 2 liter Denver cell with 400 gram samples. The ore was first conditioned in the Denver cell with the desired amount of

38
reagents at 20% solids. After about 4 minutes of conditioning, air was introduced and flotation initiated. Flotation was continued until the froth disappeared, which was usually less than 4 minutes. ASH-2C Amine Flotation Subsequently the amine flotation was carried out with the ASH-2C system. The sample was fed into the sump and diluted to about 20% solids with fresh water. The pH was adjusted to pH 5-6 and the amine collector was introduced at the desired level of addition. All products were collected , filtered , dried , weighed and analyzed. The vortex finder depth was fixed at 3 inches. The experimental variables included amine dosage, A* (the ratio of overflow opening area to underflow opening area), and Q* (the ratio of air flowrate to slurry flowrate). The slurry pressure was between 2 and 5 psi. RESULTS Bench-Scale Amine Flotation The effect of amine addition at pH 6.7 is shown by the results presented in Figure 20. Note that the recovery of phosphate decreases from 96.8% to 90.7% with an increase in collector level while the grade of the phosphate product increases from 32.0% P2O5 to 34.0%. Optimum collector dosage appears to be between 1.1 and 1.5 lb/ton.

39
Amine Addition (lb/ton)0.8 1.2 1.6 2.0 2.4
Gra
de (P
2O5%
)
28
30
32
34
36
38R
ecov
ery,
Yie
ld (%
)
50
60
70
80
90
100
GradeRecoveryYield
Figure 20. The Effect of Amine Addition on the Bench Scale Flotation of Quartz
from the Rougher Phosphate Concentrate (25.5% P2O5).
Flotation Conditions: Flotation pH was fixed at pH 6.6 with percent solids at 20% by weight.

40
Figure 21 shows the effect of pH. These results were for an amine addition of 1.1 lb/ton. Phosphate recoveries exceeding 95% were achieved at all pH values considered. It should be noted that the grade of the phosphate product is improved at higher pH values. Specifically the grade increases from 29.1% P2O5 to 32.0% P2O5 as the pH is increased from pH 6.0 to pH 7.0. These results suggest that the pH should be maintained at pH 6.6 or greater for improved quality of the phosphate product. ASH-2C Amine Flotation The preliminary ASH experiments indicated that the dimensionless variable, A* (the ratio of overflow opening area to underflow opening area) is an important variable. The results presented in Table 13 indicate that an A* value of 2.87 provides for an excellent separation with a recovery of 98.3 % and a phosphate product grade of 31.5% P2O5. Table 13. The Effect of A* (Overflow Opening Area/Underflow Opening Area) on
Amine Flotation of Quartz from the Rougher Phosphate Concentrate with the ASH-2C.
A* Product Wt. % P2O5 % Recovery %
2.54
Overflow Underflow Feed
7.23 92.77 100.00
1.11 27the .41 25.51
0.31 99.69 100.00
2.87
Overflow Underflow Feed 6.19
20.48 79.52 100.00
2.15 31.51 25.50
1.73 98.27 100.00
Flotation Conditions: Collector was fixed at 1.5 lb./ton and the flotation pH was maintained between 6.6 and 7 with Q* at 4.48 (corresponds to an air flowrate of 167.2 lpm and a slurry flowrate of 41.0 lpm).
41
pH5.5 6.0 6.5 7.0 7.5
Gra
de (P
2O5%
)
26
28
30
32
34R
ecov
ery,
Yie
ld (%
)
50
60
70
80
90
100
GradeRecoveryYield
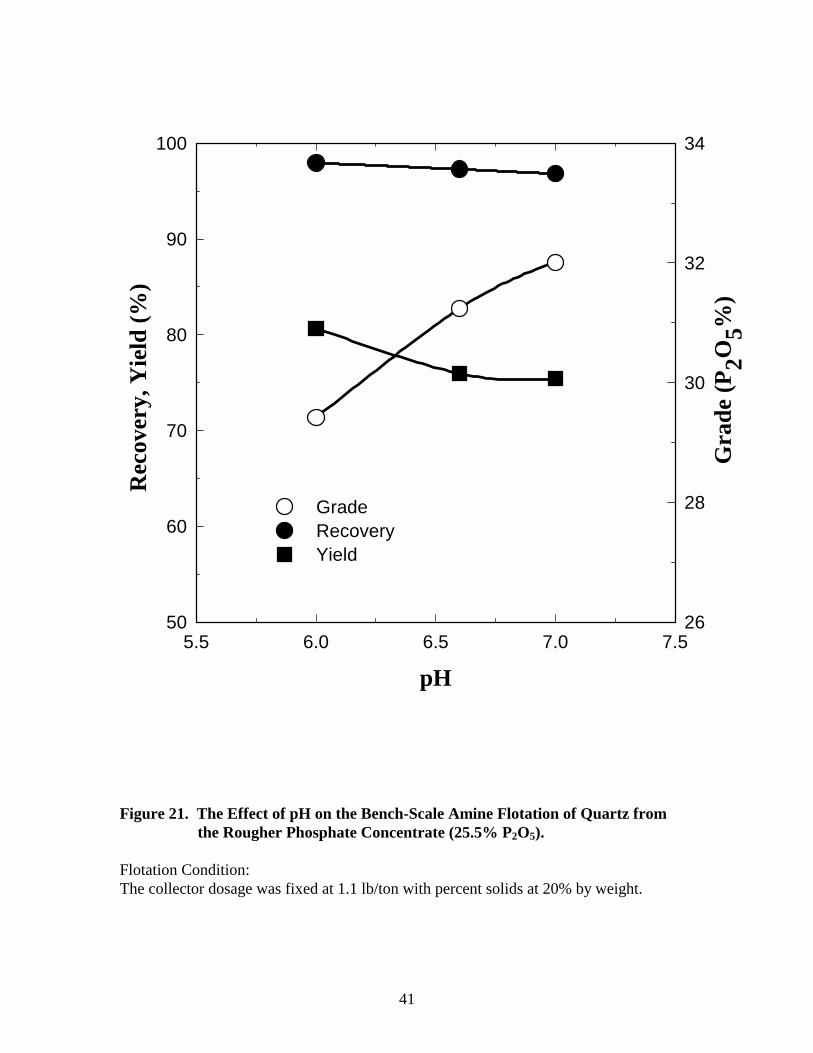
Figure 21. The Effect of pH on the Bench-Scale Amine Flotation of Quartz from the Rougher Phosphate Concentrate (25.5% P2O5).
Flotation Condition: The collector dosage was fixed at 1.1 lb/ton with percent solids at 20% by weight.

42
The results from tests at different levels of amine addition are shown in Figure 22. As is seen from the curve in Figure 22, the recovery of P2O5 decreases with an increase in amine addition while the grade increases. The results indicate that the amine level should be set between 1.6 and 2.0 lb/ton. Finally, the effect of Q* (air flowrate/slurry flowrate) is shown in Figure 23. Excellent recoveries exceeding 95% were obtained for Q*≤ 4.5 (corresponds to an air flowrate of 167.2 lpm and a slurry flowrate 41.0 of lpm; slurry pressure was 3 psi) with a grade of 32.0% P2O5. It is evident that at Q* values of more than 5.0, additional phosphate is floated and the recovery drops to 90% . DISCUSSION As mentioned in the section on rougher flotation of fine phosphate feed, the particle size flotation limit (Dmax) for a given state of hydrophobicity is determined by the acceleration experienced in the centrifugal field of the swirl flow ( )2V R . The efficiency of separation in ASH-2C amine flotation is based on the fact that the particle size distribution is somewhat finer than the distribution of the rougher flotation feed (Figure 5). Also, and probably even more important, is the fact that most of the phosphate values are in the coarser particle size intervals. More detailed tests need to be carried out with the ASH-2C to establish the coarse particle size flotation limit for ASH-2C flotation in this application. SUMMARY The ASH-2C results for amine flotation of quartz from the rougher phosphate concentrate demonstrate that efficient separations can be made by air-sparged hydrocyclone flotation. A final concentrate containing 31.0% P2O5 was obtained with 98.0% recovery from the rougher phosphate concentrate (25.5% P2O5). Typically in plant operations the P2O5 recovery from the amine flotation step is about 96.4%-98.0%.

43
Amine Addition (lb/ton)0.8 1.0 1.2 1.4 1.6 1.8 2.0 2.2
Gra
de (P
2O5%
)
26
27
28
29
30
31
32
33
34R
ecov
ery,
Yie
ld (%
)
50
60
70
80
90
100
GradeRecoveryYield
Figure 22. The Effect of Amine Addition on Single-Stage Air-Sparged
Hydrocyclone (ASH-2C) Flotation of Quartz from the Rougher Phosphate Concentrate (25.5% P2O5).
Flotation Conditions: A* was fixed at 2.87. Q* was set at 4.5. The flotation pH was maintained between pH 6.6 and 7.0 with percent solids at 20% by weight.

44
3.0 3.5 4.0 4.5 5.0 5.524
26
28
30
32
34
50
60
70
80
90
100
GradeRecovery
Rec
over
y, Y
ield
(%)
Q* (Air Flowrate/Slurry Flowrate)
Gra
de (P
2O5%
)
Yield
Figure 23. The Effect of Q* (Air Flowrate/Slurry Flowrate) on Single Stage Air-
Sparged Hydrocyclone (ASH-2C) Flotation of Quartz from the Rougher Phosphate Concentrate (25.5% P2O5).
Flotation Conditions: A* was fixed at 2.87. Collector dosage was fixed 1.5 lb./ton. The flotation pH was controlled between pH 6.6 and 7.0 with percent solids 20% by weight.

45
0 100 200 300 400 500 6000
20
40
60
80
100
Amine Feed
Part
icle
Siz
e D
istri
butio
n (%
)
Particle Size (microns)
Rougher Feed
Figure 24. Comparison of the Particle Size Distribution for Amine
Flotation Feed with the Particle Size Distribution of the Rougher Flotation Feed.

47
SURFACE CHEMISTRY ASPECTS OF PHOSPHATE FLOTATION
MATERIALS AND METHODS Materials The fatty acids and fuel oil used for surface tension, froth stability and contact angle measurements were commercial-grade reagents obtained from the Florida phosphate industry. High DI purity water was used for all surface tension, froth stability and contact angle measurements. The materials used for pilot plant ASH tests were either rougher feed or amine feed, as specified in the individual tests. The chemicals used for these experiments are listed in Table 14. Table 14. Chemicals and Suppliers.
Chemical Formula Grade Supplier Fatty Acid C15-17H27-
35COOH Tall Oil Fatty Acid Mixture
Westvaco, Mulberry, Fla.
Fuel Oil Commercial IPC, Plant City Fla. Oleic Acid C17H33COOH +99% Aldrich Sodium Hydroxide NaOH Analytical Mallinckrodt Hydrochloric Acid HCl Reagent EM Science
Methods
Surface Tension and Froth Stability Measurements. Surfactants were dissolved and/or dispersed in high purity DI water by ultrasonic dispersion. The Du Nouy ring method was used for surface tension measurements using a digital tensionmeter K10T, made by Kruss, Germany. The solution pH and froth stability (froth height) were measured immediately after the surface tension measurement. Froth height was determined using a froth height measurement column, 1 1
4 inches in diameter. Air was introduced at the bottom at a constant rate of 167 ml per minutes through a porous plate. During measurement, the solution was stirred by a magnetic stirrer at 60 rpm. The stable steady state froth height after 1 minute was measured as an indicator of the froth stability.

48
Contact Angle Measurements. Phosphate particles of three different colors (white, tan, and black) were imbedded in resin to make particles for easy handling. The imbedded particles were ground using diamond grinding wheels of roughness 100 µm, 40 µm, and 9 µm in series to completely expose the minerals and to obtain flat surfaces. After grinding, 1 µm, 0.3 µm, 0.05 µm alumina powders were used in series to polish the mineral surfaces. The sectioned particles were immersed in surfactant solution of desired pH and surfactant concentration for 20 minutes. After 20 minutes, the particles were vacuum-dried at room temperature and ready for contact angle measurement. After measurements for specified conditions the particles were polished using 0.05 µm alumina powder to refresh the mineral surface and measurements were made again under different conditions. Contact angles were measured using the Sessile-Drop method with a Goniometer-100, made by Ramé-Hart Inc. USA.
Pilot-Plant Experiments. The pilot-plant equipment and experimental procedure were the same as described in previous sections. RESULTS AND DISCUSSION Surface Tension and Froth Stability Presented in Figure 25 are the results which show the solution surface tension as a function of surfactant (fatty acid mixture or oleic acid) concentration at natural pH. It can be noted that the surface tension decreases linearly with the logarithm of the surfactant concentration, until the surfactant concentration reach 350 mg/l and 300 mg/l for oleic acid and fatty acid respectively. Above these concentrations, further addition of surfactant does not decrease the surface tension any further. This critical concentration may be related to the CMC value but not exactly the CMC value, because both the fatty acid and the oleic acid do not completely dissolve at such concentrations under these experimental conditions. The results indicate that the mixed fatty acid is more surface active than the pure oleic acid.
Another important observation is that at natural pH neither the fatty acid nor the pure oleic acid can stabilize froth, no matter what their concentrations are, although they can significantly reduce the solution's surface tension.

49
Figure 25. Surface Tension and Froth Height as a Function of Surfactant Concentration Natural pH (Fatty Acid Data at pH=5.0, Oleic Acid Data at pH=6.2).

50
The effect of pH on surface tension and froth stability is shown in Figures 26 and 27 for a surfactant addition of 344 mg/l. As the solution pH increases, the surface tension reaches its minimum: 30 mN/m for oleic acid, 27 mN/m for fatty acid, and then levels off above pH 9.5. Although the surface tension decreases only from 40 mN m to about 30 mN/m as the pH increases from 4.5 to 10, the froth stability changes dramatically. Below pH 7, a stable froth can not be generated from solution. On the other hand above pH 8, a very stable froth can be formed from solution. Thus pH plays a critical role in bubble formation and froth stabilization for fatty acid-water solutions. Fuel oil has is used as a promoter to facilitate phosphate flotation. The effect of fuel oil addition on surface tension is presented in Figure 28 for a total reagent addition of 344 mg/l. It is evident that the surface tension increases, almost linearly, as the fuel oil fraction of the reagent mixture increases. Figure 28 also shows that oleic acid has more tolerance to fuel oil addition than fatty acid does. The influence of fuel oil addition on froth stability is show in Figure 29. The froth stability is significantly influenced by fuel oil addition. At a fraction of 0.8 (by weight) fuel oil in the total reagent mixture the froth becomes completely unstable. Contrasted to the fatty acid, oleic acid shows more tolerance to fuel oil addition with regard to froth stability. Even at 0.8 fuel oil, a very stable froth can be generated. Contact Angle Contact angles were measured to investigate the hydrophobicity of phosphate minerals under several conditions. The natural contact angle was found about to be 10º for tan and black phosphate pebbles and 0º for white phosphate pebbles.

51
Figure 26. Surface Tension as a Function of pH (Total Reagent
Concentration 344 mg/l).

52
Figure 27. Froth Height as a Function of pH (Total Reagent Concentration 344 mg/l) .

53
Figure 28. Effect of Fuel Oil Addition (by Weight) on the Surface Tension (Total Reagent Concentration 344 mg/l).

54
Figure 29. Froth Stability as a Function of Oil Fraction (by Weight)
of the Reagent Mixture (Total Reagent Concentration 344 mg/l).

55
Figure 30 shows the change in advancing and receding contact angle measured with a water drop as a function of fatty acid addition. It is seen from Figure 30 for all three phosphate minerals that as the fatty acid addition increases the advancing contact angle increases dramatically and reaches a maximum at an addition of 10 mg/l. Thereafter, the contact angle decreases 10 to 30 degrees quickly to a plateau as the fatty acid concentration increases from 10 ppm to 100 ppm. The same trend can be observed for receding contact angles. The difference between advancing and receding contact angles is about 20º for tan and black phosphate samples and about 30º for the white phosphate sample. These values compare to about a 15º difference as measured for a single crystal of apatite. The large differences between advancing contact angles and receding contact angles, the contact angle hystereses, reflect, to some extent, the surface roughness of these minerals surfaces. These results suggest that a fatty acid addition in excess of 100 mg/l is not necessary provided that the collector is well dispersed in the system. Emulsification of the collector may help reduce the collector addition now being used in the phosphate industry. The effect of pH on contact angle, measured using a water drop, is show in Figure 31 for a fatty acid addition of 344 mg/l. As seen from Figure 31 the contact angle remains constant from pH 4 to pH 7. At pH 8, the contact angle increases abruptly and then, as the pH increases the contact angle continues to increase slightly until pH 11. Above pH 11, the contact angle decreases as the pH increases apparently due to hydroxyl ion competition at the phosphate-water interface. The contact angles measured using water drops reflect the fatty acid adsorption behavior at the phosphate-water interface. However these results do not describe the flotation system very well, because in a real flotation system, the mineral phases are equilibrated with the surfactant solution instead of pure water. A comparison of contact angles measured using water drops and collector solution drops is presented in Figure 32. The contact angles measured using solution drops have a maximum at pH 7 to 8 as compared to a maximum at pH 10 to 11 for a water drops. Further, the maximum contact angle for the collector solution was found to be 80º, which is significantly less than the

56
Figure 30. Water Contact Angle as a Function of Fatty Acid Addition for Different Phosphate Minerals at a Natural pH of 5.0.

57
Figure 31. Water Contact Angle as a Function of pH for Different
Minerals (Fatty Acid Addition 344 mg/l).

58
maximum contact angle for the water drop, 120º. These results can be explained by considering the three phase equilibrium. Above pH 8, the adsorption density increases as pH increases (the increase of the water drop contact angle as an indicator). On the other hand, the surface tension of the solution decreases (refer to Figure 26). The system can be analyzed according to Young's equation,
cos θ = SG SL
LG
r rr−
.
At a given adsorption density, rSG is constant. Now rLG decreases as the solutions surface tension decreases, and so does rSL. This results in an increase in cosθ, or a decrease in contact angle θ. The bench flotation response as a function of pH is presented in Figure 33. It is noted that the best flotation range is pH 8 to pH 9.5. These results can be explained by the results from contact angle measurements using surfactant solution drops together with the results from the froth stability measurements. Although at pH 7 to pH 8, the contact angle has its maximum at 80º, the froth stability is not very good, corresponding to a low phosphate recovery for this pH range. To achieve a stable froth condition, the suspension pH must be higher than pH 8. On other hand, when the pH is higher than pH 9.5, the contact angle decreases significantly to 15º from its maximum of 80º. It is clear that the flotation response decreases significantly at pH values greater than 11. The effect of fuel oil addition on contact angle measurements is presented in Figure 34. The addition of fuel oil does not influence the contact angle very much in the range of 0-60% fuel oil in the total reagent mixture. However, as discussed previously, it does influence froth formation and stabilization, as well as reagent economy.

59
Figure 32. Comparison of Contact Angles Measured Using Water Drop and Collector Solution Drop (Fatty Acid Addition 344 mg/l).
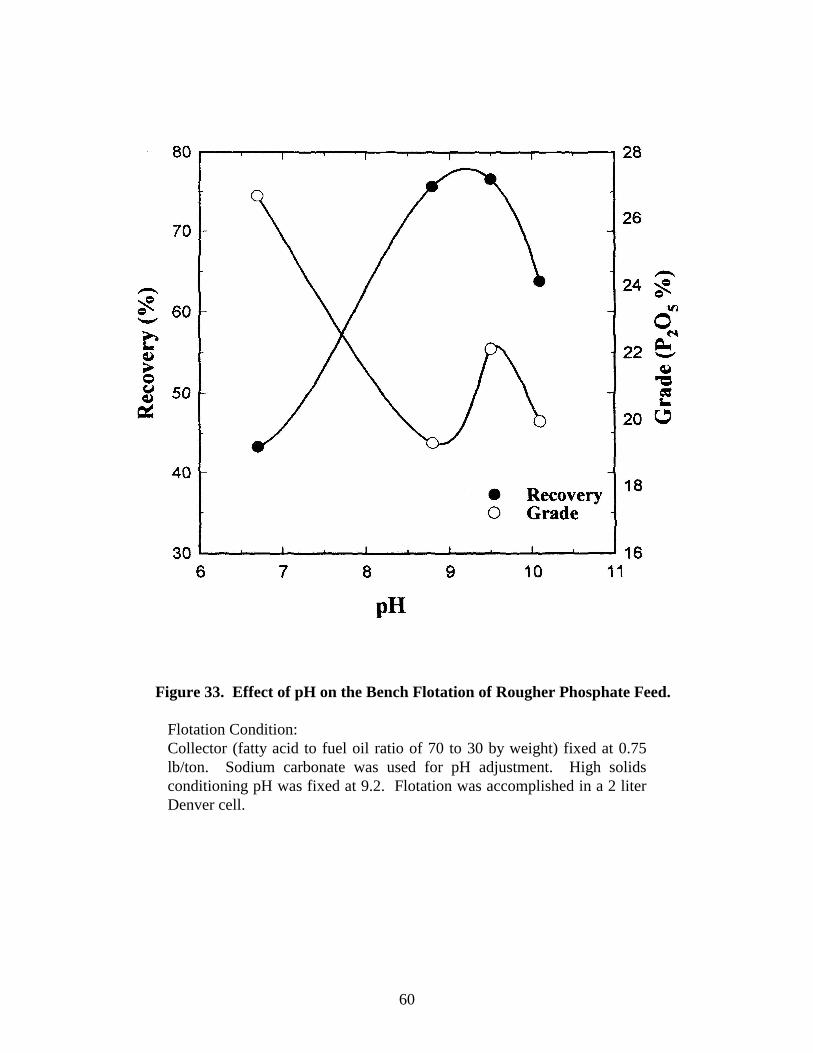
60
Figure 33. Effect of pH on the Bench Flotation of Rougher Phosphate Feed.
Flotation Condition: Collector (fatty acid to fuel oil ratio of 70 to 30 by weight) fixed at 0.75 lb/ton. Sodium carbonate was used for pH adjustment. High solids conditioning pH was fixed at 9.2. Flotation was accomplished in a 2 liter Denver cell.

61
Fuel Oil Fraction by Weight in Reagent Mixture (%)0 20 40 60 80 100
Con
tact
Ang
le (d
egre
e)
0
20
40
60
80
100
120
140
Black Phosphate Tan Phosphate White Phosphate
Advancing
Receding
WATER DROP
Figure 34. Water Contact Angle as a Function of Fuel Oil Fraction in
the Surfactant Solution (Total Reagent Mixture, Fuel Oil + Fatty Acid is 344 mg/l).
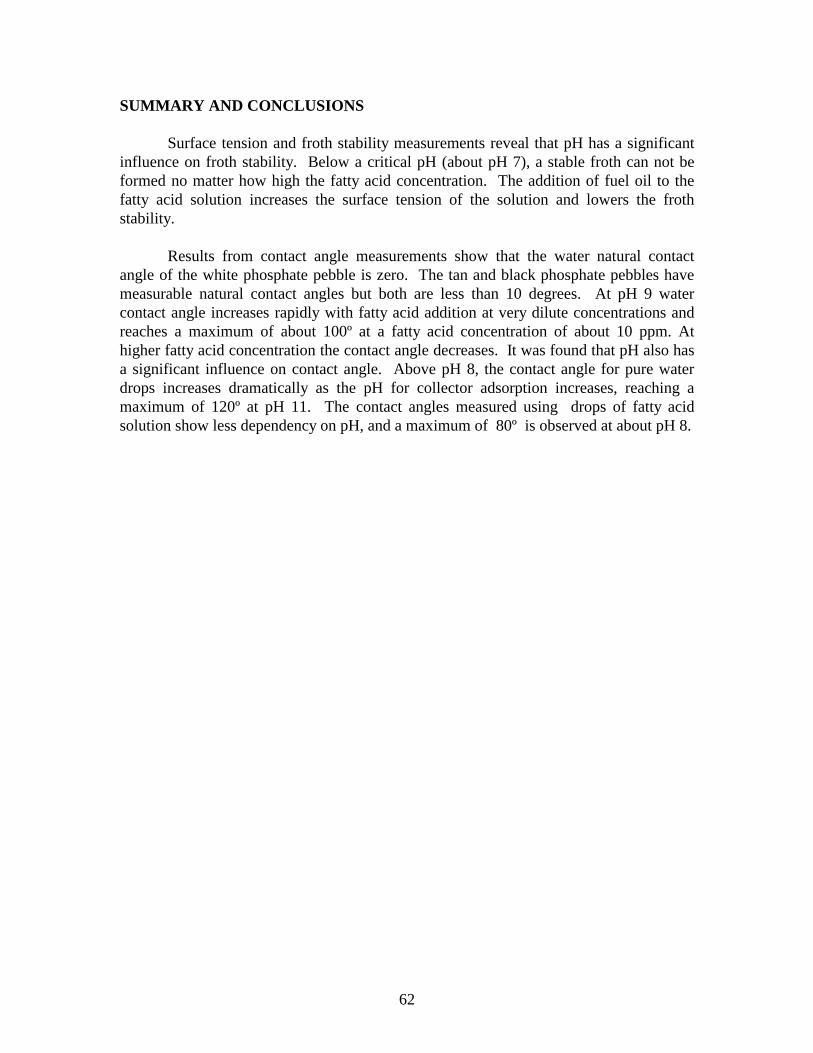
62
SUMMARY AND CONCLUSIONS Surface tension and froth stability measurements reveal that pH has a significant influence on froth stability. Below a critical pH (about pH 7), a stable froth can not be formed no matter how high the fatty acid concentration. The addition of fuel oil to the fatty acid solution increases the surface tension of the solution and lowers the froth stability. Results from contact angle measurements show that the water natural contact angle of the white phosphate pebble is zero. The tan and black phosphate pebbles have measurable natural contact angles but both are less than 10 degrees. At pH 9 water contact angle increases rapidly with fatty acid addition at very dilute concentrations and reaches a maximum of about 100º at a fatty acid concentration of about 10 ppm. At higher fatty acid concentration the contact angle decreases. It was found that pH also has a significant influence on contact angle. Above pH 8, the contact angle for pure water drops increases dramatically as the pH for collector adsorption increases, reaching a maximum of 120º at pH 11. The contact angles measured using drops of fatty acid solution show less dependency on pH, and a maximum of 80º is observed at about pH 8.

63
PLANT-SITE TESTS WITH THE ASH-6C SYSTEM
INTRODUCTION According to the original proposal, after approval of the Phase II Research Program the preparation and construction of a mobile ASH-2C system was to be undertaken at the University of Utah in order to conduct in-plant ASH phosphate flotation testing at a selected plant in Florida. The Phase II Proposal was modified and a 6-inch ASH-6C system was recommended for plant testing. In Phase II, the ASH unit was scaled up to a diameter of 6 inches from a diameter of 2 inches. The assembly of a 6-inch ASH-6C system was completed, and the system was shipped to a Central Florida phosphate plant. In-plant testing was carried out at actual continuous operating conditions. SCALE-UP OF ASH-2C TO ASH-6C Design Variables
In order to scale up the 2-inch ASH-2C to a 6-inch ASH-6C, the design variables had to be determined first. The design variables for the scale-up of the 2-inch ASH-2C to the 6-inch ASH-6C are listed in Table15. Table 15. Design Variable Scale-up from the 2-Inch ASH-2C to the 6-Inch ASH-6C. Design Variable Din inch Df inch Dc inch LH inch LF inch LC inch ASH-2C 0.8 11.7 1.875 5.5 3.0-3.5 12 ASH-6C 2.8 3.744 6. 10.0 12-14 48 Din : Diameter of inlet Df : Inner diameter of vortex finder Dc: Diameter of porous tube (equal to the inner diameter of cyclone header) LF: Inside length of vortex finder from the beginning of porous tube LC: Length of ASH (equal to length of porous tube) For the 2-inch ASH-2C and the 6-inch ASH-6C keep
Df / Dc = 0.625 inch LF / LC = 0.25 inch
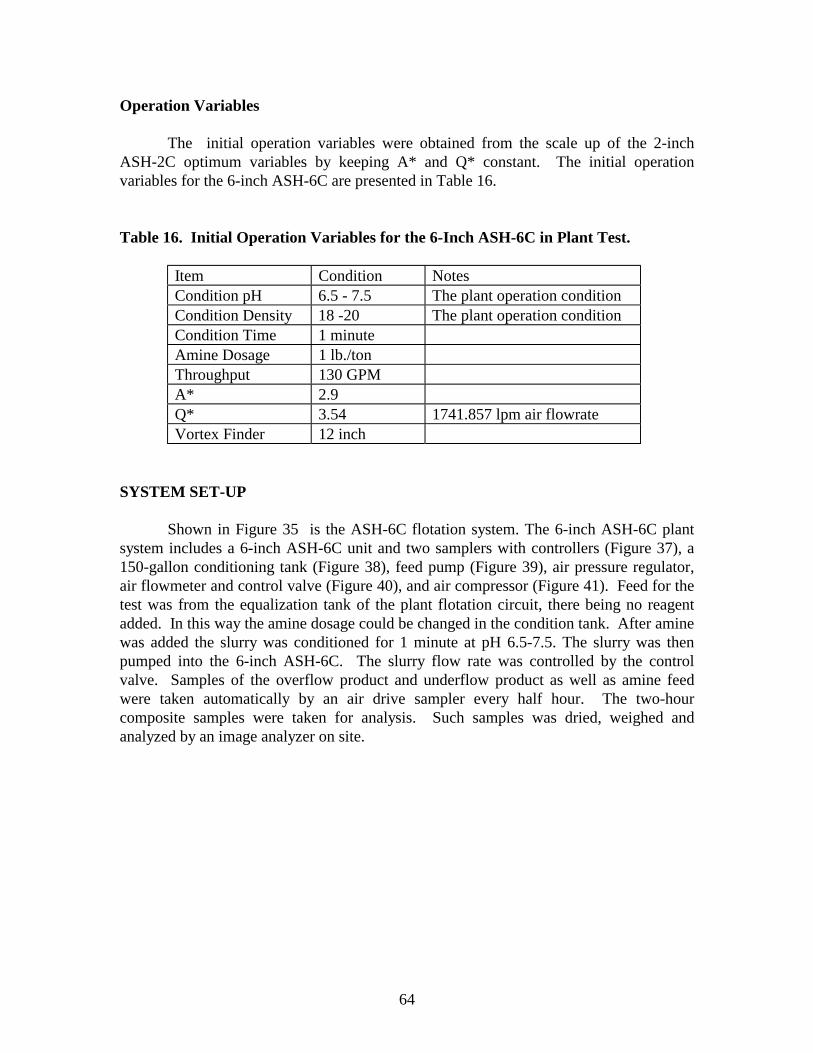
64
Operation Variables The initial operation variables were obtained from the scale up of the 2-inch
ASH-2C optimum variables by keeping A* and Q* constant. The initial operation variables for the 6-inch ASH-6C are presented in Table 16.
Table 16. Initial Operation Variables for the 6-Inch ASH-6C in Plant Test.
Item Condition Notes Condition pH 6.5 - 7.5 The plant operation condition Condition Density 18 -20 The plant operation condition Condition Time 1 minute Amine Dosage 1 lb./ton Throughput 130 GPM A* 2.9 Q* 3.54 1741.857 lpm air flowrate Vortex Finder 12 inch
SYSTEM SET-UP Shown in Figure 35 is the ASH-6C flotation system. The 6-inch ASH-6C plant system includes a 6-inch ASH-6C unit and two samplers with controllers (Figure 37), a 150-gallon conditioning tank (Figure 38), feed pump (Figure 39), air pressure regulator, air flowmeter and control valve (Figure 40), and air compressor (Figure 41). Feed for the test was from the equalization tank of the plant flotation circuit, there being no reagent added. In this way the amine dosage could be changed in the condition tank. After amine was added the slurry was conditioned for 1 minute at pH 6.5-7.5. The slurry was then pumped into the 6-inch ASH-6C. The slurry flow rate was controlled by the control valve. Samples of the overflow product and underflow product as well as amine feed were taken automatically by an air drive sampler every half hour. The two-hour composite samples were taken for analysis. Such samples was dried, weighed and analyzed by an image analyzer on site.
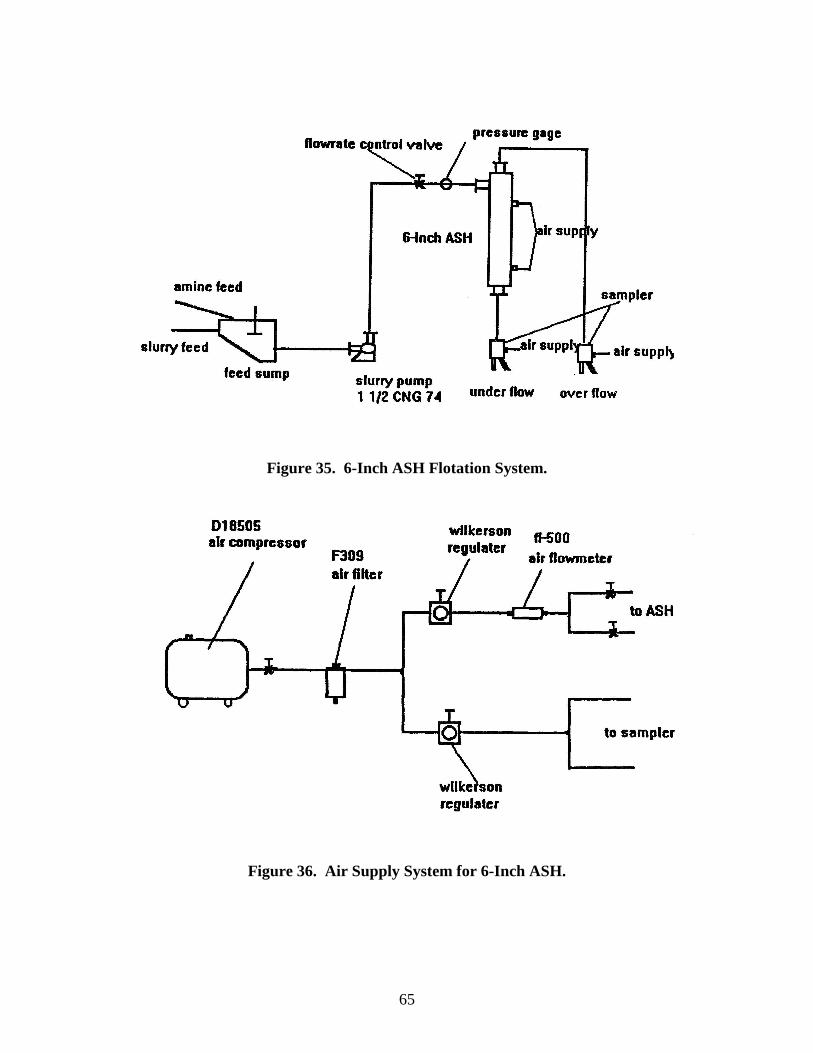
65
Figure 35. 6-Inch ASH Flotation System.
Figure 36. Air Supply System for 6-Inch ASH.

66
Figure 37. ASH-6C Unit and Sampler.

67
Figure 38. Feed Sump for 6-Inch ASH.

68
Figure 39. Feed Pump for 6-Inch ASH.

69
Figure 40. Air Regulator, Air Flowrate Control Valve and Pressure Gage for 6-Inch
ASH.
Figure 41. Air Compressor for 6-Inch ASH Air Supply.

70
RESULTS AND DISCUSSION
The amine addition test was carried out while other variables were at the initial operation condition. The results of amine addition are presented in Table 17. It can be seen that when amine dosage was lower, the flotation separation was not efficient. As amine dosage increased to 1lb./ton, most of the quartz was floated, with increased phosphate grade and recovery. When amine dosage increased to 2 lb../ton, some fine phosphate particles were floated with quartz into the overflow product; the recovery of phosphate was decreased. The optimal amine dosage was found to be around 1lb./ton. This value is the same as that in the pilot-plant test.
Table 17. Results from the Amine Dosage Test.
Dosage (lb./ton) Product Wt % BPL % Insol. % Recovery % Overflow 26.6 15.36 79.28 8.3
0.5 Underflow 73.4 61.26 17.35 91.7 Feed 100.0 49.03 33.85 100.0 Overflow 29.1 10.54 85.78 6.5
1.0 lb./ton Underflow 70.9 62.43 15.77 93.5 Feed 100.0 47.35 36.12 100.0 Overflow 30.7 21.87 70.49 13.1
2.0 lb./ton Underflow 69.3 64.05 13.59 86.9 Feed 100.0 51.09 31.07 100.0
The A* (the ratio of overflow opening area to underflow opening area) test was
carried out by changing the underflow opening while keeping other variables at initial conditions. The results of the A* tests are presented in Table 18. It can be seen that as A* decreased, phosphate recovery was increased. A 98.8% phosphate recovery was achieved with 59.56 BPL concentration when A* was set at 3.12. This value is again very close to the A* obtained from the pilot-plant test with ASH-2C. It appeared that A* can be kept constant in scaling up ASH.
Q* (the ratio of air flowrate to slurry flowrate) is a very important operation variable. The Q* test was carried out in order to find an optimum operating Q* for the 6- inch ASH-6C. Table 19 shows the effect of Q* (the ratio of air flowrate to slurry flowrate). It can be seen that the recovery increases as Q* increases. However, when Q* is over 4.1, the recovery decreases with Q* increase. The results suggested that Q* should be maintained at about 4 (corresponds to an air flowrate of 1845 lpm and a slurry flowrate of 450 lpm).
It was found from pilot-plant research that the vortex finder length insert ASH will affect ASH flotation operation. The results for different vortex finder depths are shown in Table 20. As is seen from the results, when the vortex finder is not sufficiently deep, some phosphate particles reported to the overflow, thus reducing phosphate

71
recovery. When the vortex finder depth increased to 10 inches, the phosphate was efficiently separated from the quartz and the recovery increased. But when vortex finder depth increased to 12 inches, the recovery decreased because the finder opening was close to the underflow opening, causing some phosphate particles to get into the overflow. The results indicate that the ideal vortex finder should be about 10 inches. Table 21 shows results for in-plant amine flotation with a 6-inch ASH system operating continuously for six hours at optimum operation variables. The results from plant tests indicated that under optimum conditions, a good separation can be achieved in amine flotation with a capacity of about 5 tph dry solids and an amine consumption of 1.0 lb./ton.
Table 18. Results of the A* Test on Single-Stage Amine Flotation.
A* Product Wt. % BPL % Insol. Recovery % Overflow 14.4 15.64 75.94 4.1 3.37 Underflow 85.6 61.65 12.07 95.9 Feed 100 55.02 21.28 100.0 Overflow 19.42 11.93 81.37 4.3 3.24 Underflow 80.58 64.51 9.47 95.7 Feed 100.0 54.3 23.44 100.0 Overflow 8.34 7.83 87.04 1.2 3.12 Underflow 91.57 59.56 14.56 98.8 Feed 100 55.20 21.83 100.0 Overflow 13.74 536 90.77 1.4 2.9 Underflow 86.26 59.86 15.32 98.6 Feed 100.0 52.37 25.34 100.0
Test Conditions: Feed pressure 4 psi (throughput 130 GPM). Q* was 3.54; solid density was 20 %; pH was about 6. Vortex finder depth was 6 inches; amine dosage was 1 lb./t.

72
Table 19. Effect of Varying Q* on Single-Stage Amine Flotation in Plant Test.
Q* Product Wt. % BPL Insol Recovery % Overflow 30.6 29.63 56.34 16.4 3.5 Underflow 69.4 66.58 5.63 83.6 Feed 100.0 55.26 21.28 100.0 Overflow 24.6 19.33 68.19 9.23 4.1 Underflow 75.4 63.53 9.80 90.77 Feed 100.0 52.80 23.75 100.00 Overflow 25.9 23.97 64.35 11.2 4.72 Underflow 74.1 66.29 6.32 88.88 Feed 100.0 55.33 20.34 100.00 Overflow 48.6 38.28 46.02 34.4 5.3 Underflow 51.6 68.90 4.91 65.6 Feed 100.0 54.03 23.66 100.0
Test Conditions: A* =3.12; amine dosage was fixed at 1lb./t. All other conditions were the same as in the previous test. Table 20. Effect of Vortex Finder Depth on Single-Stage Amine Flotation.
Depth (in.) Product Wt. % BPL % Insol % Recovery % Overflow 27.5 13.18 80.43 7.2 8 Underflow 72.5 64.68 7.65 92.8 Feed 100.0 50.52 27.43 100.0 Overflow 20.2 5.90 90.89 2.38 10 Underflow 79.8 61.03 12.20 97.62 Feed 100.0 49.91 30.90 100.0 Overflow 28.93 12.20 82.66 7.5 12 Underflow 71.07 61.29 13.04 92.5 Feed 100.0 47.09 33.06 100.0
Test Conditions: A* =3.12; Q* = 4.1. Amine Dosage was 1 lb./t; all other conditions were the same as in the previous test.

73
Table 21. Average Results of In-Plant Amine Flotation Operating Continuously for 6 Hours.
Product Grade BPL % Insol % BPL Recovery % Amine Concentrate 66.04 6.32 91.2 Amine Tail 19.55 68.19 8.8 Amine Feed 54.56 21.60 100.0
Operating Conditions: Q*=4.1; A* = 3.12; Vortex Finder Depth is fixed at 10 inch; pH is about 6; solids density is 20 % . Porous Tube Plugging Problem
During the in-plant tests, plugging of the porous tube occurred. A very sticky crud deposited on the surface of the porous tube (see Figure 42). This crud gradually builds up, plugging the pores of the porous tube and causing poor separation due to poor air distribution. DISCUSSION AND SUMMARY The results from the plant-site test with ASH-6C indicated that under normal conditions, a good separation can be achieved in amine flotation. A 66% BPL concentrate was obtained with 91% recovery.
The capacities observed for both the 2-inch ASH and the 6-inch ASH correspond to specific capacities that are 50 times the specific capacity of conventional and column flotation equipment. The power cost for the feed pump is about $ 0.16/ton feed.
Based on the actual specific capacity for the ASH-6C of 160 GPM/ft3, a plant producing 1.5 million tons of amine concentrate per year would only need a total volume of 40 ft3 under the following assumptions:
• Amine feed grade: 50 % BPL • Amine concentrate grade: 70% BPL • Amine tailing grade: 15% BPL • The plant operates 300 days per year

74
Figure 42. Crud Deposit on the Surface of the Porous Tube.

75
This calculation clearly shows the great potential for the application of the ASH system in the phosphate industry. Considering the high specific capacity of the ASH and its encouraging metallurgical performance, the research program was extended for ten months to solve the plugging problem.

77
CRUD FORMATION AND PLUGGING OF THE POROUS TUBE INTRODUCTION Results from plant-site tests with the ASH-6C indicated that under normal conditions a good separation can be achieved in amine flotation with a capacity of about 5 tph dry solids and an amine dosage of 1.0 lb/ton. However, crud formation on the surface of the porous tube and plugging of the porous tube occurred during the plant-site tests. This crud gradually built up, plugged the pores of the porous tube and caused poor flotation separation, apparently due to inadequate air distribution. Nevertheless, considering the high specific capacity of the ASH, further research was warranted. In order to eliminate or reduce the crud formation and plugging of the porous tube, numerous laboratory, pilot-plant and plant-site tests were undertaken. CRUD IDENTIFICATION A crud sample was collected randomly from the wall of the porous tube. By inspection, it is easy to see that the crud consists of organic agents and slime. One gram of this crud sample was added to 50 ml CCl4 and hexane and stirred for one hour. The organic components in the crud completely dissolved in both CCl4 and hexane. The solids were filtered and dried, and the liquid bottled for FTIR analysis. It was found that the solid, mostly fine quartz and clay particles, contribute about 48% by weight to the crud. Transmission FTIR experiments were conducted using the B10 Rad FST-40 spectrometer with a liquid nitrogen-cooled MCT detector. Fluorite windows were used with a 0.1 mm spacer. All the spectra were taken at 8 cm-1 resolution with 256 Co-added scans. The CCl4 soluble components of the crud were analyzed by FTIR spectroscopy. The spectra of fatty acid and amine (both from the plant operations), also dissolved in CCl4 at a concentration of 1%, were also taken for comparison. All the spectra were rationed against pure CCl4 as background. The IR spectra of amine, fatty acid and the soluble crud components in CCl4, are presented in Figures 43 to 45. The bands in Figure 43 are assigned as follows: the bands in the range of 2800 cm-1 to 3100 cm-1 are assigned to CH stretching of CH2 and CH3 groups. The weak band at 3520 cm-1 is assigned to N-H stretching vibration; this is a typical band for NH stretch in amine or amide. The bands at 1760 cm-1 and 1700 cm-1 are due to the C=O stretch in ester form and in fatty acid form, respectively. The bands at 1760 cm-1 and 1700 cm-1 may indicate the appearance of some ester and carboxylate components. The 1650 cm-1 can be assigned to the C=O stretching in amide, and the 1400 cm-1 is a typical stretching vibration of the C-N bond. The very sharp
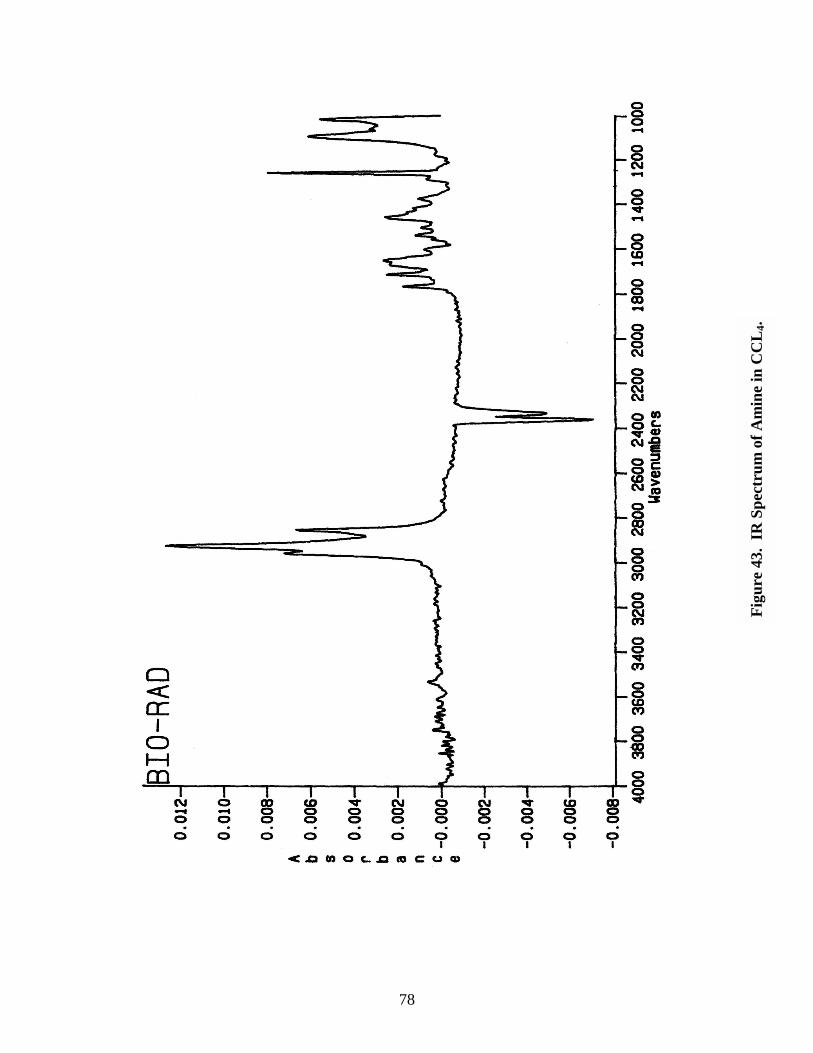
78
Figu
re 4
3. I
R S
pect
rum
of A
min
e in
CC
L4.

79
Figu
re 4
4. I
R S
pect
rum
of F
atty
Aci
d in
CC
L4.

80
Figu
re 4
5. I
R S
pect
rum
of S
olub
le C
rud
Com
pone
nts i
n C
CL
4.

81
and strong peak at 1230 cm-1 comes from the CCL4 background. The negative peaks between 2300-2400 cm-1 are due to the adsorption of CO2 in the atmosphere. The IR spectrum of fatty amine used in the plant reveals that this amine is a complicated mixture of fatty esters and fatty amides. The spectrum of the fatty acid is relatively simple. The bands in the range of 2800-3100 cm-1 are the CH stretching vibrations. The peaks at 1740 cm-1 and 1700 cm-1 are the typical vibration of C=O in the free acid form and in acid-acid dimer form. Again, the strong peak around 1200 cm-1 is from the background. Figure 45 is the spectrum of the crud. By comparison with Figures 43 and 44, the typical C=O stretch band at 1650 cm-1 in amide and the C=O stretch band at 1709 cm-1
and the typical stretching band for C-N at 1400 cm-1 are all visible in the crud spectrum. It can be concluded that the CCl4 soluble organic phase in the crud consists mostly of amine and small amounts of fatty acid. Because fuel oil also absorbs strongly at 2800-3000 cm-1 and weakly at 900-1500 cm-1, this crud spectrum does not eliminate the possibility of fuel oil existence in the crud. In summary, it appears that the crud consists of about 50% fine quartz and clays and 50% of an organic phase containing amine, fatty acid, and fuel oil. LABORATORY AND PILOT PLANT TESTS Laboratory Test In order to examine the effect of crud on the surface of the porous tube, a special test unit was designed, fabricated, and installed at the University of Utah. The unit consisted of an air-jacketed section of porous tube and a high speed stirrer, as shown in Figure 46. After preliminary testing, an appropriate procedure was developed. The amine feed sample taken from plant operations was ground into slime for 15 minutes. A mixture of 35 grams of slime and 25 grams of amine feed was placed in the test unit. The mixture was stirred for one minute and then half of the total dosage of fuel oil, fatty acid and amine was added. The crud formation test was then carried out at a stirring speed of 6000 rpm. After 15 minutes, the other half of the reagents was added. After an additional 15 minutes, the pressure drop between the inner surface and the outer surface of the porous tube was measured at different air flowrates. These data were used to calculate air permeability of the various porous tubes. The permeability of a porous tube was defined as the air flowrate per unit area of porous tube under unit back pressure as following:
K
Q RP
S=/ 2 1π∆

82
where Qs is the standard air flowrate, ∆P is the pressure drop through the porous tube, and R1 is the inner radius of the porous tube. The relative permeability is defined as the ratio of the permeability of the used porous tube to the permeability of a new porous tube:
K KKr used
new=
Air
Pressure Gauge
High speed stirrer
Figure 46. Laboratory Crud Formation Test Unit. RESULTS AND DISCUSSION Initial Tests The crud which formed on the porous tube consists of slime, fuel oil and other reagents. Crud does not form without fuel oil and reagents. However, it was found from initial tests that an excessive reagent dosage eliminates crud formation. The surface of the porous tubes were only soiled with reagents but the air permeability decreased,

83
apparently due to the reagent soiling of the tubes. Special data and the permeability calculated are included in Appendix B. The corresponding permeability values are presented in Figure 47. After several tests, a suitable dosage of reagents was determined as oil 0.35 ml, fatty acid 0.35 ml, and amine 1.05 ml. In order to determine the reliability of the tests, two stainless steel porous tubes were tested in sequence under the same operating conditions. The results show that the test procedure provides good reproducibility of test results, as is shown in Figure 48. Therefore, this test procedure was selected to evaluate crud formation on different porous tubes. Plastic Porous Tube--The Effect of Pore Size Under the above-described test conditions, in only 30 minutes visible crud formed on both plastic porous tubes, the coarse porous tube (100µm) and the fine porous tube (20µm). From the plots shown in Figure AP-C3 (Appendix C, Figure 3) the air permeability of the porous tubes can be calculated and the results of these calculations are shown in Figure 49. The air permeability depends on the pore size distribution and the surface characteristics, with other parameters being held constant. A sharp decrease in the air permeability corresponding to crud formation and slime entering the pores of the porous tube is evident. However, the two figures indicate that the decrease in air permeability for the fine porous tube is less than that of coarse porous tube under these specific test conditions. The lower impact on air permeability for the fine pore tube is caused by the smoother surface characteristics as well as the fact that slime particles having greater difficulty entering the fine pores. Stainless Steel Porous Tube The sintered stainless steel porous tube has a more hydrophilic surface than that of the porous plastic tube. Figure 50 shows a comparison of the results for the plastic porous tube and the stainless steel porous tube. The decrease in the air permeability of the stainless steel porous tube is much less than that of the plastic porous tube, although it has a lower absolute air permeability due to its structure. The results can be explained by the smoother and more hydrophilic surface characteristics of the stainless steel porous tube.

84
Coarse Pore Fine Pore
Perm
eabi
lity
(m3 /P
a*m
2 )
0.00000
0.00002
0.00004
0.00006
0.00008
0.00010
0.00012
0.00014
0.00016
0.00018
Fresh plastic porous tubeAfter 1 hourAfter 2 hours
Test Conditions: Slime: 35 g Water: 25 g Oil: 1.0 ml Fatty Acid : 1.0 ml Amine: 3.0 ml
All reagents are added before the beginning of soiling test
Stirrer velocity: 6000 rpm
1.00
0.330.28
1.00
0.48 0.39
Figure 47. Permeability Change for the Initial Crud Formation Test.

85
Test 1 Test 2
Perm
eabi
lity
(m3 /P
a*m
2 )
0e+0
2e-6
4e-6
6e-6
8e-6
1e-5
1e-5
1e-5
2e-5
2e-5
2e-5
2e-5
2e-5
3e-5
3e-5
3e-5Fresh porous stainless steel tubeAfter 30 minutes
Test Conditions: Slime: 35 g Water: 20 g Oil: 0.35 ml Fatty Acid : 0.35 ml Amine: 1.05 m
All reagents are added in 15 minutes sequnce, each 0.175 ml for Oil and Fatty Acidas well as each 0.525 ml for Amine.
Stirrer velocity: 6000 rpm
0.53
0.67
1.001.00
Figure 48. Permeability Change for the Repeat Tests with Porous
Stainless Steel Tube.

86
Stainless Steel Porous Tube with Static Potential An increase in surface potential should tend to repel particles or drops of the same sign and make it difficult for them to adhere at the surface. Accordingly, it is expected that a charged surface of the porous tube may reduce or eliminate crud formation. Therefore two special tests were carried out. The stainless steel porous tube was connected to the positive terminal of a static power supply and was charged at +40V potential, and the stirring axis was connected to the negative terminal of a static power supply as a reference in the first test; this was done vice versa in the second test. Following standard procedures, no crud formed on the inner surface of either porous tube after 30 minutes. However, very thin layers of deposition on both porous tubes were observed. A black-colored layer was formed on the positively charged porous tube and a yellow-colored layer was formed on the negatively charged porous tube. Although no crud formation was detected on the surface, the air permeability of both porous tubes decreased by half in comparison to the uncharged case, as shown in Figures 51 and 53. It appears that the deposit of some fuel oil or amine on the surface of the porous tube changed the surface characteristics and caused the decrease in the air permeability. However, crud was not uniformly distributed on the surface of the porous tube. On the other hand the layers of deposition are very thin and uniformly distributed so that uniform bubble generation could be obtained by an increase to the air pressure in the air chamber. Cleaning Test A cleaner from the automotive industry was used to clean crud from the surface of the stainless steel porous tube. The cleaner consisted of benzene methyl, isopropyl alcohol, 2-butanone and carbon dioxide. The crud was removed very easily in a few minutes and the air permeability increased to about 83% of the original fresh porous tube, as shown in Figure 53.

87
Coarse Pore Fine Pore
Perm
eabi
lity
(m3 /P
a/m
2 )
0.00000
0.00002
0.00004
0.00006
0.00008
0.00010
0.00012
0.00014
0.00016
0.00018
Fresh plastic porous tubeAfter 30 minutes
Test Conditions: Slime: 35 g Water: 20 g Oil: 0.35 ml Fatty Acid : 0.35 ml Amine: 1.05 m
All reagents are added in 15 minutes sequnce, each 0.175 ml for Oil and Fatty Acidas well as each 0.525 ml for Amine.
Stirrer velocity: 6000 rpm
1.00
0.16
1.00
0.23
Figure 49. Permeability Change for the Plastic Porous Tubes of
Different Pore Sizes.

88
Steel Plastic
Perm
eabi
lity
(m3 /P
a*m
2 )
0e+0
4e-6
8e-6
1e-5
2e-5
2e-5
2e-5
3e-5
3e-5
4e-5
4e-5
4e-5
5e-5
5e-5
6e-5
6e-5Fresh porous tubeAfter 30 minutes
Test Conditions: Slime: 35 g Water: 20 g Oil: 0.35 ml Fatty Acid : 0.35 ml Amine: 1.05 m
All reagents are added in 15 minutes sequnce, each 0.175 ml for Oil and Fatty Acidas well as each 0.525 ml for Amine.
Stirrer velocity: 6000 rpm
0.53 0.24
1.00
1.00
Figure 50. Permeability Change for the Plastic Porous Tube and
Porous Stainless Steel Tube.

89
No Electric Field +40v Electric Field
Perm
eabi
lity
(m3 /P
a*m
2 )
0e+0
2e-6
4e-6
6e-6
8e-6
1e-5
1e-5
1e-5
2e-5
2e-5
2e-5
2e-5
2e-5
3e-5
3e-5
3e-5
Fresh porous stainless steel tubeAfter 30 minutes
Test Conditions: Slime: 35 g Water: 20 g Oil: 0.35 ml Fatty Acid : 0.35 ml Amine: 1.05 m
All reagents are added in 15 minutes sequnce, each 0.175 ml for Oil and Fatty Acidas well as each 0.525 ml for Amine.
Stirrer velocity: 6000 rpm
0.53
0.25
1.001.00
Figure 51. Permeability Change for Porous Stainless Steel Tube with
Positive Electric Field and without Electric Field.

90
No Electric Field -40v Electric Field
Perm
eabi
lity
(m3 /P
a/m
2 )
0e+0
2e-6
4e-6
6e-6
8e-6
1e-5
1e-5
1e-5
2e-5
2e-5
2e-5
2e-5
2e-5
3e-5
3e-5
3e-5Fresh porous stainless steel tubeAfter 30 minutes
Test Conditions: Slime: 35 g Water: 20 g Oil: 0.35 ml Fatty Acid : 0.35 ml Amine: 1.05 m
All reagents are added in 15 minutes sequnce, each 0.175 ml for Oil and Fatty Acidas well as each 0.525 ml for Amine.
Stirrer velocity: 6000 rpm
0.53
0.24
1.001.00
Figure 52. Permeability Change for Porous Stainless Steel Tube with
Negative Electric Field and without Electric Field.

91
Perm
eabi
lity
(m3 /P
a*m
2 )
0.0e+02.0e-64.0e-66.0e-68.0e-61.0e-51.2e-51.4e-51.6e-51.8e-52.0e-52.2e-52.4e-52.6e-52.8e-53.0e-53.2e-5
Fresh porous stainless steel tubeCrud formation after 30 minutesAfter cleaning with the cleaner
Test Conditions: Slime: 35 g Water: 20 g Oil: 0.35 ml Fatty Acid : 0.35 ml Amine: 1.05 m
All reagents are added in 15 minutes sequnce, each 0.175 ml for Oil and Fatty Acidas well as each 0.525 ml for Amine.
Stirrer velocity: 6000 rpm
0.49
0.83
1.00
Cleaner: Methyl benzene Isopropyl alcohol 2-Butanone Cabon dioxide
Figure 53. Permeability Change after Crud Formation and Cleaning
Tests for Porous Stainless Steel Tube.

92
Pilot Plant Crud Formation Test In order to simulate the process of crud formation and investigate the critical factors of crud formation as well as the effect of potential, a parallel pilot plant test was carried out with the use of two ASH-2C units with stainless steel porous tubes with pore sizes of 20 µm and 1 µm, respectively. A stainless steel rod was used as one electrode and was inserted in the center in the ASH-2C unit through the vortex finder which was connected to the negative terminal of the power supply. The stainless steel porous tube (20 µm) was connected to the positive terminal of the power supply (+50V). The design is shown in Figure 54. Because the slurry was recycled, the slime fraction of the particles would increase very quickly due to continuous abrasion. Three slurry samples were taken from the recycle slurry at the beginning and after 4 hours and 8 hours of operation. The slime fraction increased linearly, as shown in Figure 55. Considering that the slime fraction was large in comparison with the size distribution for the plant-site situation, desliming was carried out after every 8-hour test. After four days or a total 24 hours of operation, no crud formation was found on either porous tube. Of course, as expected from laboratory tests, the surface became discolored (brown) for stainless steel porous tube charged at +50V potential. The air permeability decreased very sharply for the porous tube with a 20 µm pore size, and smoothly for the porous tube with a 1 µm pore size, as shown in Figure 56. After about 10 hours, the air permeability of the 20 µm porous tube decreased to the level of a fresh porous tube with 1 µm pores as shown in Figure 57. It is evident that a lot of slime in the slurry results in the plugging of the coarse porous tube because finer particles are able to enter the porous tube easier. The gradual plugging of the porous tube without crud formation can be used continuously under the same air flowrate because the air flowrate distribution on the porous tube is still as uniform as it was for the original fresh tube. The only difference is that a higher air pressure in the air chamber is required to achieve the same air flowrate. Of course the slime fraction in the amine feed at the plant is much less than it is in this special situation. It is expected that this type of plugging problem would be much less at the plant site than at the pilot plant. POROUS TUBE PLANT-SITE TEST WITH ASH-2C SYSTEMS After the laboratory study, tubes of different pore size and different materials were evaluated using ASH-2C units at the plant site in central Florida's phosphate concentrator. During plant-site tests, cleaning and anti-plugging reagents were also tested.

93
Air Air
Overflow Overflow
Underflow Underflow
Pump
Valve
Valve
Pressure gauge
Pressure gauge
ASH
-2C
ASH
-2C
Stirrer
Figure 54. Facility for the Pilot-Plant Crud Formation Test.

94
Operating Time (Hour)0 1 2 3 4 5 6 7 8 9 10
Frac
tion
of -2
70 m
esh
in S
luur
y (%
)
0
3
6
9
12
15
Figure 55. The Change of Slime Fraction with Operating Time in the
Pilot-Plant Crud Formation Test.

95
Operating Time (Hour)0 2 4 6 8 10 12 14 16 18 20 22 24
Rel
ativ
e Pe
rmea
bilit
y (U
sed/
New
)
0.0
0.1
0.2
0.3
0.4
0.5
0.6
0.7
0.8
0.9
1.0
20 micron1 micron
Figure 56. Comparison of Relative Permeability Change for Porous
Stainless Steel Tubes with Pore Sizes of 20 µµµµm and 1 µµµµm.

96
Operating Time (Hour)0 2 4 6 8 10 12 14 16 18 20 22 24
Perm
iabi
lity
(m3 /P
a*m
2 )
0e+0
1e-7
2e-7
3e-7
4e-7
5e-7
6e-7
7e-7
8e-7
9e-7
1e-6
20 micron1 micron
Figure 57. Comparison of Permeability Change for Porous Stainless
Steel Tubes with Pore Sizes of 20 µµµµm and 1 µµµµm.

97
Parallel tests were carried out using two ASH-2C units in order to compare different porous tubes under the same conditions. Every six hours the pressure between the inner surface of the porous tube and the air jacket chamber was measured and recorded. The pressures recorded were used to calculate relative air permeability of the porous tube in order to evaluate the level of crud formation and plugging of the porous tube. The sample procedure is the same as previous in the plant test. Results and Discussion Effect of Pore Size. Parallel tests using two plastic porous tubes with fine pore size (25µm) and coarse pore size (100µm) were carried out. The photographs of the crud build-up on the surface of both plastic porous tubes after 18 hours of operation are shown in Figures AP-D1 and AP-D2 (refer to Appendix D), respectively. The variation of the air permeability with time of operation is presented in Figure 58. It can be seen that the air permeability decreased with an increase in operation time. After 6 hours the air permeability decreased to 40% of its initial value for the fine porous tube and to 20% for the coarse porous tube. After 18 hours the air permeability decreased to 26% of its initial value for the fine and to 12% of its initial value for the coarse porous tube. The results presented in Figure 58 also indicate that the fine porous tube is better than the coarse porous tube in view of the change in air permeability. These plant-site test results confirm the laboratory test results. Normally if the porosity of the fine porous tube is less than that of the coarse porous tube, the air velocity for the fine porous tube is higher than that of the coarse porous tube for the same total air flowrate. Effect of Porous Tube Material. Stainless Steel. A stainless steel porous tube with a pore size of about 20µm was tested and compared with the plastic porous tube. Crud build-up on the surface of the stainless steel porous tube is shown in Figure AP-D3. The variation in the air permeability with operating time is shown in Figure 59. From Figure 59, it can be seen that after 16 hours the air permeability decreased to 57% of its initial value for the steel porous tube and 12% of its initial value for the plastic porous tube. These results indicate that the stainless steel porous tube maintains its air permeability better than the plastic porous tube after 16 hours of operation. Ceramic. A ceramic porous tube (ordered from REMET Ceramics, Inc.) was evaluated and compared with the plastic porous tube. From Figure AP-D4 (refer to Appendix D), the extent of the crud build-up at the surface of the ceramic porous tube can be seen after 18 hours of operation. The air permeability vs. operation time for the ceramic and plastic porous tubes is shown in Figure 60. It can been seen that the air permeability decreased to 20% of its initial value after 12 hours of operation. The ceramic tube is little bit better than the plastic porous tube.
Method

98
Operating Time (Hour)0 2 4 6 8 10 12 14 16 18 20
Rel
ativ
e Pe
rmea
bilit
y (U
sed/
New
)
0.0
0.1
0.2
0.3
0.4
0.5
0.6
0.7
0.8
0.9
1.0
Plastic tube with coarse porePlastic tube with fine pore
Figure 58. Comparison of Relative Permeability for the Fine and
Coarse Plastic Porous Tubes.

99
Operating Time (Hour)0 2 4 6 8 10 12 14 16 18 20
Rel
ativ
e Pe
rmea
bilit
y (U
sed/
New
)
0.0
0.1
0.2
0.3
0.4
0.5
0.6
0.7
0.8
0.9
1.0
Stainless steelPlastic with coarse pore
Figure 59. Comparison of Relative Permeability for the Porous
Stainless Steel and Plastic Porous Tubes.

100
Stainless Steel Wire Mesh. Two steel wire mesh porous tubes (named Poramet porous tube, made by lamination of screens of different size) were purchased from BOPP CO., Switzerland. A photograph of the crud build up on the surface of these two different Poramet porous tubes, one with a smooth inner surface and one with a rough inner surface, are shown in Figures AP-D5 and AP-D6 (refer to Appendix D). Figure 61 shows the air permeability change with operating time using the two different Poramet tubes. After 16 hours, the air permeability of both porous tubes decreased to 20% and 5% of the initial value. It is evident that the porous tube with smooth inner surface is better than the porous tube with rough inner surface. These results also indicate that crud accumulates more rapidly on the rougher surface. It is evident that the Poramet tube with a smooth inner surface is similar to the plastic porous tube. Hydrophilic Plastic. It is expected that the crud would accumulate more rapidly at a hydrophobic surface than at a hydrophilic surface. Therefore, the naturally hydrophobic plastic porous tube was made hydrophilic by treatment with a surfactant. The results indicate that the crud still accumulates on the surface of the hydrophilic plastic porous tube. The air permeability decreases to about 10% of its initial value after 16 hours of operation as shown in Figure 62; the air permeability decrease is almost the same as that of the hydrophobic plastic porous tube. Effect of Detergent Treatment and Cleaning Tests Detergent Addition with Feed. The test using detergent added to the feed was carried out in order to prevent crud build-up on the porous tube surface. Figure AP-D7 (refer to Appendix D) shows the crud build-up on the plastic porous tube surface when detergent from the University of Florida was added to the feed at a level of 0.002 lb./ton. Comparisons with the contrast case (no detergent) are shown in Figure 63. It can be seen that initially the permeability with detergent decreases less than without detergent. After 8 hours, the air permeability decreased to about 25% with detergent, and to about 20% without detergent, but after 10 hours the relative air permeability for both cases is almost the same. It appears that once the crud builds up on the surface of the porous tube it is difficult to remove with the detergent. Detergent Cleaning Test. The detergent cleaning test was run for 12 hours. Every 6 hours the porous tube was cleaned by addition of the detergent from pump into the cyclone at a dosage of 0.1 lb./m for 5 minutes. Figure AP-D8 shows crud on the surface of the plastic porous tube after 12 hours subsequent cleaning with detergent for 5 minutes. The air permeability change with operating time is presented in Figure 64. The results show that the cleaning method is not effective after the crud has accumulated.

101
Operating Time (Hour)0 2 4 6 8 10 12 14 16 18 20
Rel
ativ
e Pe
rmea
bilit
y (U
sed/
New
)
0.0
0.1
0.2
0.3
0.4
0.5
0.6
0.7
0.8
0.9
1.0
CeramicPlastic of coarse pore
Figure 60. Comparison of Relative Permeability for the Ceramic and
Plastic Porous Tubes.

102
Operating Time (Hour)0 2 4 6 8 10 12 14 16 18 20
Rel
ativ
e Pe
rmea
bilit
y (U
sed/
New
)
0.0
0.1
0.2
0.3
0.4
0.5
0.6
0.7
0.8
0.9
1.0Wired stainless steel tube with smooth inner surfaceWired stainless steel tube with roughinner surfacePlastic tube with coarse pore
Figure 61. Comparison of Relative Permeability for the Wired
Stainless Steel and Plastic Porous Tubes.
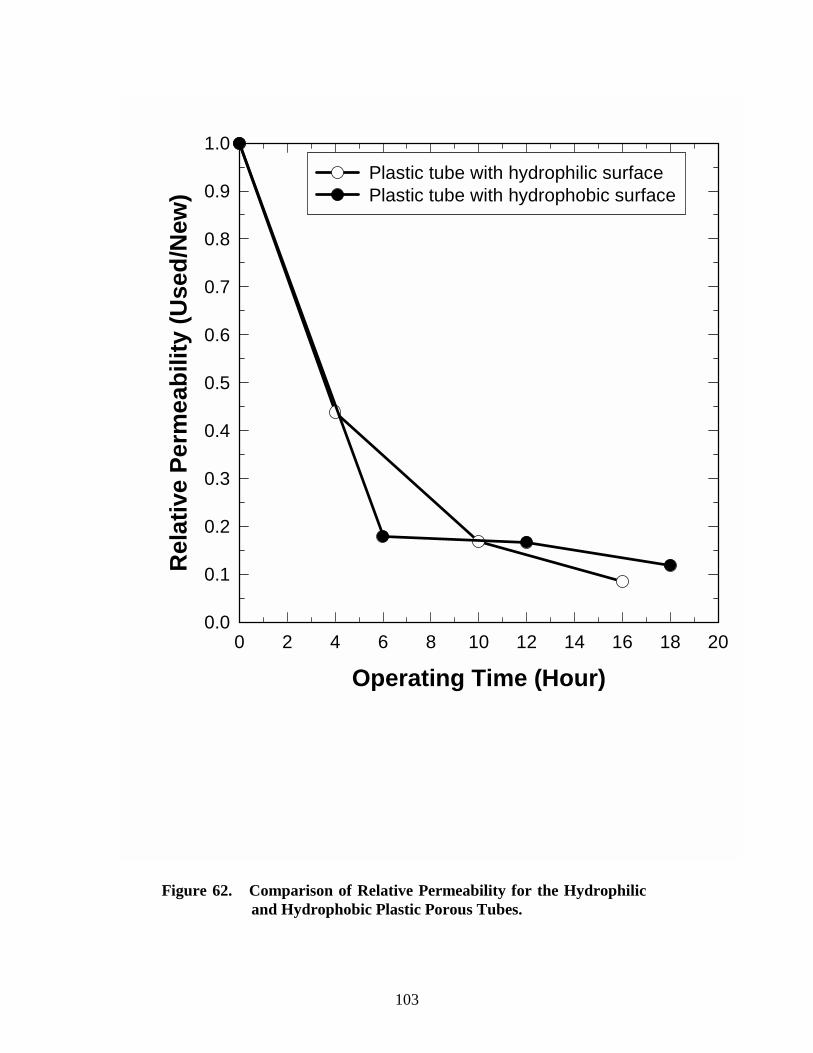
103
Operating Time (Hour)0 2 4 6 8 10 12 14 16 18 20
Rel
ativ
e Pe
rmea
bilit
y (U
sed/
New
)
0.0
0.1
0.2
0.3
0.4
0.5
0.6
0.7
0.8
0.9
1.0Plastic tube with hydrophilic surfacePlastic tube with hydrophobic surface
Figure 62. Comparison of Relative Permeability for the Hydrophilic
and Hydrophobic Plastic Porous Tubes.

104
Operating Time (Hour)0 2 4 6 8 10 12 14 16 18 20 22
Rel
ativ
e Pe
rmea
bilit
y (U
sed/
New
)
0.0
0.1
0.2
0.3
0.4
0.5
0.6
0.7
0.8
0.9
1.0
Plastic tube with detergent added in feedPlastic tube without detergent
Figure 63. Comparison of Relative Permeability for the Plastic
Porous Tubes with and without Adding Detergent.
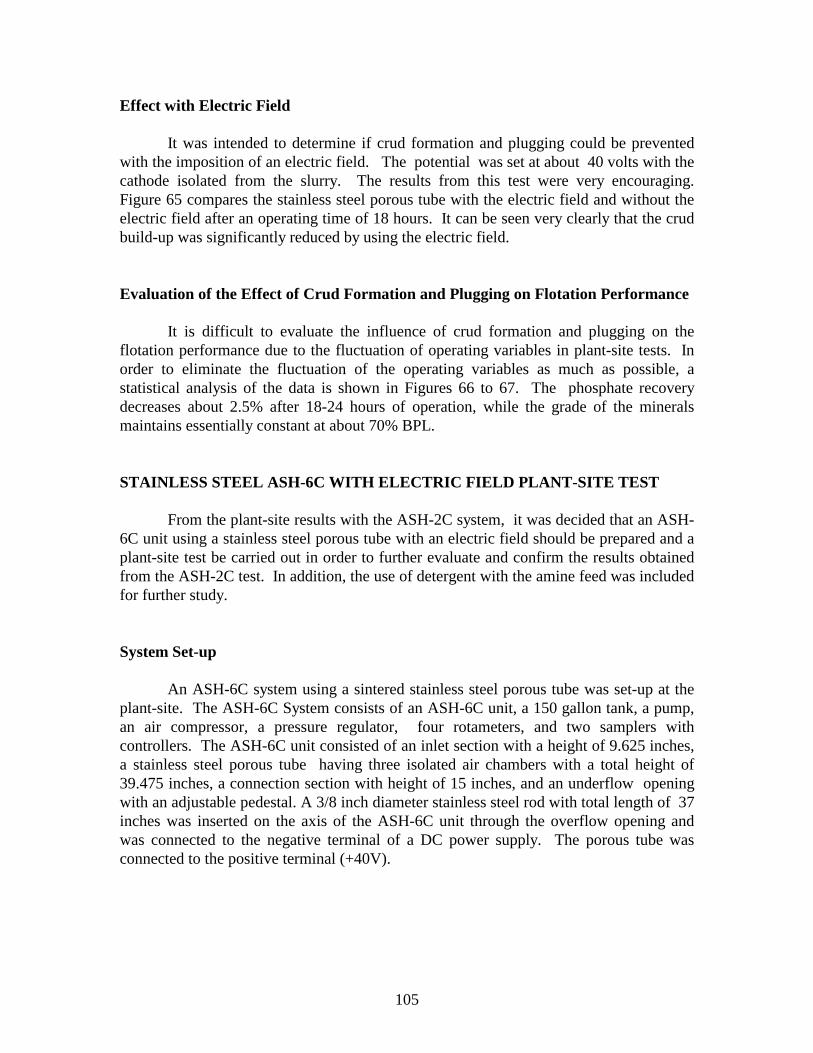
105
Effect with Electric Field It was intended to determine if crud formation and plugging could be prevented with the imposition of an electric field. The potential was set at about 40 volts with the cathode isolated from the slurry. The results from this test were very encouraging. Figure 65 compares the stainless steel porous tube with the electric field and without the electric field after an operating time of 18 hours. It can be seen very clearly that the crud build-up was significantly reduced by using the electric field. Evaluation of the Effect of Crud Formation and Plugging on Flotation Performance It is difficult to evaluate the influence of crud formation and plugging on the flotation performance due to the fluctuation of operating variables in plant-site tests. In order to eliminate the fluctuation of the operating variables as much as possible, a statistical analysis of the data is shown in Figures 66 to 67. The phosphate recovery decreases about 2.5% after 18-24 hours of operation, while the grade of the minerals maintains essentially constant at about 70% BPL. STAINLESS STEEL ASH-6C WITH ELECTRIC FIELD PLANT-SITE TEST From the plant-site results with the ASH-2C system, it was decided that an ASH-6C unit using a stainless steel porous tube with an electric field should be prepared and a plant-site test be carried out in order to further evaluate and confirm the results obtained from the ASH-2C test. In addition, the use of detergent with the amine feed was included for further study. System Set-up An ASH-6C system using a sintered stainless steel porous tube was set-up at the plant-site. The ASH-6C System consists of an ASH-6C unit, a 150 gallon tank, a pump, an air compressor, a pressure regulator, four rotameters, and two samplers with controllers. The ASH-6C unit consisted of an inlet section with a height of 9.625 inches, a stainless steel porous tube having three isolated air chambers with a total height of 39.475 inches, a connection section with height of 15 inches, and an underflow opening with an adjustable pedestal. A 3/8 inch diameter stainless steel rod with total length of 37 inches was inserted on the axis of the ASH-6C unit through the overflow opening and was connected to the negative terminal of a DC power supply. The porous tube was connected to the positive terminal (+40V).

106
Operating Time (Hour)0 2 4 6 8 10 12 14 16 18 20
Rel
ativ
e Pe
rmea
bilit
y (U
sed/
New
)
0.0
0.1
0.2
0.3
0.4
0.5
0.6
0.7
0.8
0.9
1.0Plastic tube with cleaning after every 6 hoursPlastic tube without cleaning
Figure 64. Comparison of Relative Permeability for the Plastic Porous Tubes
with and without Cleaning.

107
Figure 65. Crud Build-up Was Reduced at Stainless Steel Porous Tube with
Electric Field (After 18 Hours’ Operation).

108
Operating Time (hour)0 2 4 6 8 10 12 14 16 18 20 22 24
BPL
& R
ecov
ery
of P
hosp
hate
(%)
0
10
20
30
40
50
60
70
80
90
100
BPL from ImageRecovery
Figure 66. Statistics of Flotation Performance (BPL and Recovery of
Phosphate) for Plant-Site Test Using ASH-2C System.

109
Operating Time (hour)0 2 4 6 8 10 12 14 16 18 20 22 24
Gra
de o
f Ins
olub
les
(%)
0
5
10
15
20
25
30R
ejec
tion
of In
solu
bles
(%)
0
10
20
30
40
50
60
70
80
90
100
Grade from imageRejection
Figure 67. Statistics of Flotation Performance (Grade and Rejection of
Insolubles) for Plant-Site Test Using ASH-2C System.

110
Operating Conditions A continuous test was carried out over a period of three days for a total of about 24 hours. The feed slurry was about 18% of solids, the amine dosage was about 1.0 lb./ton, and the total air flowrate was 1965 lpm injected into three isolated sections at the proportions of 20:20:15. The slurry flowrate was about 130 gpm and the overflow opening/underflow opening was 3.12. After every 8 hours, the air pressure in each air chamber was measured at a fixed air flowrate. The sampling procedure is the same as that for the previous in-plant test. Results and Discussion After three days of operation, the crud had still accumulated on the inner surface of the porous tube. The relative air permeabilities of the three porous tube sections are shown in Figure 68. The air permeabilities of the three sections drop very fast to about 40%-50% of the initial value during the first 8-hours. The drop continues in the second 8 hours and slows down in the third 8-hour period. However, the patterns of the air permeability for the three sections are different. It is evident that the rate of crud formation is the fastest for the top section, followed by the bottom section, and is the lowest for the middle section. The results shows that the rate of crud formation has some relationship with the pressure on the inner wall surface resulting from the centrifugal force and fluid pressure. The highest pressure due to the highest tangential velocity is at the top section of the porous tube, the next highest pressure is in the bottom section due to the change of the fluid flow direction, and the lowest pressure is in the middle section as determined from the previous study at the University of Utah. The greatest amount of crud formation occurs at higher pressure where the tangential velocity is the greatest, and it is in this region that the crud accumulates most rapidly. In comparison with the results of ASH-2C with the electric field, the ASH-6C results show no significant effect from the electric field. It may be possible that the electric field was too weak. Of course a more detailed study may be necessary to determine if crud formation can be prevented or at least inhibited. The flotation performance of the ASH-6C system is shown in Figure 70. The recovery of phosphate decreases a little in the first 8 hours, then drops very sharply. However, the rejection of the insoluble decreases only 2.5 to 5.0%, which is similar to the results for the ASH-2C system. The grade of the insoluble product increases from 10% to 35%. This is due to the very low BPL (BPL 19% to 23%) in the feed in the third 8 hours.

111
Operating Time (Hour)0 4 8 12 16 20 24
Rel
ativ
e Pe
rmea
bilit
y (U
sed/
New
)
0.0
0.1
0.2
0.3
0.4
0.5
0.6
0.7
0.8
0.9
1.0
first sectionsecond sectionthird section
Figure 68. Plant-Site Test Result of Crud Formation for the Stainless
Steel ASH-6C with Electric Field (Relative Permeability).

112
Operating Time (Hour)0 4 8 12 16 20 24
Perm
eabi
lity
(m3 / P
a*m
2 *10-6
)
0
2
4
6
8
10
12
14
16
18
20
22
24
26
28
30
first sectionsecond sectionthird section
Figure 69. Plant-Site Test Result of Crud Formation for the Stainless
Steel ASH-6C with Electric Field (Air Permeability).

113
Operating Time (hour)2 4 6 8 10 12 14 16 18 20 22 24 26
BPL
& R
ecov
ery
of P
hosp
hate
(%)
0
10
20
30
40
50
60
70
80
90
100
Gra
de &
Rej
ectio
n of
Inso
lubl
es (%
)
0
10
20
30
40
50
60
70
80
90
100
BPLRecovery of phosphateGrade of insolublesRejection of insolubles
Figure 70. Flotation Performance of Plant-Site Test Using ASH-6C System.

114
CONCLUSIONS From laboratory, pilot-plant, and plant-site tests it can be concluded:
1. The crud forms very easily on the surface of different porous media such as plastic, sintered stainless steel, stainless steel laminated wire mesh, and ceramic.
2. Although the crud builds up on the surface of all porous tubes, the rate of
accumulation varies.
3. The porous tubes with finer pore size are better than those with a coarse pore size, as was found for both plastic and stainless steel porous tubes.
4. The porous tubes with a smoother inner wall surface tend to reduce the rate of
crud formation. 5. The stainless steel porous tubes are better than the other porous tubes probably
because they have a finer pore size as well as a smooth inner wall and a more hydrophilic surface.
6. Once the crud has formed at the surface, it is very difficult to clean with the
detergents tested. 7. Addition of detergents into the feed reduces the rate of crud formation to some
extent, but as operating time increases the crud still accumulates on the surface of the plastic porous tube.
8. The crud causes a change in the air distribution due to its non-uniform
formation. The poor air flow distribution results in a poor flotation separation. Normally, the recovery decreases about 2.5 to 5.0% in 18 to 24 hours of operation while the BPL keeps almost constant.
9. The results of the porous stainless steel tube with an electric field indicated
that when a electric field is used, the crud formation is reduced to some extent for the ASH-2C system.
10. The reduction of crud formation by the use of an electric field was not
observed for the ASH-6C system. Perhaps the electric field was too weak for this larger system.

115
11. Crud formation involves very complex phenomena which are affected by
many factors. The most important factors include slime components, reagents, slurry flowrate, pore size, smoothness, hydrophobicity, porosity of the porous tube, and air-sparged velocity. Although the rate of crud formation can be reduced, the prevention of crud formation at the plant site has not yet been achieved.
117
FINAL DISCUSSION AND SUMMARY The overall objective of this research project was to demonstrate the feasibility of ASH flotation technology for efficient recovery of Florida phosphate minerals from fine flotation feed material (35x150 mesh). LABORATORY AND PILOT-PLANT STUDIES WITH ASH-2C The Phase I Research program involved both laboratory and pilot-plant studies. The influence of various design and operating variables on ASH flotation was tested at the University of Utah pilot-plant facilities. Excellent progress was made during the Phase I Research Program. Appropriate conditions for both rougher and amine flotation separations with the ASH-2C system were established. In addition, a surface chemistry study of phosphate flotation was carried out and the results reveal that pH has a significant influence on froth stability. PLANT-SITE TEST WITH ASH-6C
In Phase II, according to design features for the ASH 2-inch diameter unit used in Phase I, the ASH unit was scaled up to 6-inch diameter for plant-site testing. The 6-inch ASH-6C flotation system was completed and installed in a central Florida phosphate plant. In-plant tests with the ASH-6C flotation system were carried out in amine flotation circuit. Under normal conditions a good separation was achieved with 91.2% BPL recovery and 160 gpm/ft3 specific capacity for the ASH-6C.
Crud was formed on the porous tube surface during the in-plant test. This crud gradually built up, plugged the pores of the tube, and caused poor separation due to poor air distribution. Further research was carried out in order to eliminate or reduce the crud formation and plugging of the porous tube. CONCLUSIONS
From these research results it can be concluded that:
1. The air-sparged hydrocyclone can be used for efficient recovery of fine phosphate minerals during both rougher phosphate flotation and amine flotation. A comparison of single-stage results between the 2-inch ASH-2C and the 6-inch ASH-6C, and typical plant performance is given in Table 22. The plant data were supplied by the company during the sampling week.

118
Table 22. Comparison of Single Stage Results for ASH-2C, ASH-6C and
Typical Plant Performance.
System Product Grade Recovery Rougher Phosphate Flotation
Plant Performance
Rougher Feed Rougher Concentrate Rougher Tail
6-8 % BPL 50-55 % BPL 2-3 % BPL
. 80-85% P2O5
ASH-2C Flotation
Rougher Feed Rougher Concentrate Rougher Tail
7.54 % BPL 51.41 % BPL 1.97 % BPL
77% P2O5
Amine Flotation Plant Performance
Amine Feed Amine Concentrate Amine Tail
50-55 % BPL 69-71 % BPL 5-6 % BPL
90-98% P2O5
ASH-6C Flotation
Amine Feed Amine Concentrate Amine Tail
54.56 % BPL 66.04 % BPL 19.55 % BPL
91% P2O5
ASH-2C Flotation
Amine Feed Amine Concentrate Amine Tail
55.72 % BPL 68.58 % BPL 4.70 % BPL
98% P2O5
2. The air-sparged hydrocyclone can be used for selective in both rougher and
amine flotation at a high specific capacity. The specific slurry capacity reached 435 gpm/ft3 in the case of rougher flotation and 550 gpm/ft3 in the case of amine flotation.
3. A* (the ratio of overflow opening area to underflow opening area) and Q*
(the ratio of air flowrate to slurry flowrate) were identified as two important process variables. Excellent results can be achieved through appropriate adjustment of these variables.
4. The experimental results indicate that there is a coarse particle size flotation
limit (Dmax ) for a given diameter air-sparged hydrocyclone. Further tests should be undertaken to establish in more detail the coarse particle size flotation limit.
5. Surface tension and froth stability measurements reveal that pH has a
significant influence on froth stability. Below a critical pH (about pH 7), a stable froth cannot be formed, no matter how high the fatty acid concentration. The addition of fuel oil to the fatty acid solution increases the surface tension of the solution and lowers the froth stability.

119
6. The results from plant tests with the 6-inch ASH-6C indicate that under normal conditions a good separation can be achieved in amine flotation with a capacity of about 5 tph dry solids.
7. The results from in-plant tests with tubes of different materials indicate that
crud formation and plugging occurs for all materials tested (plastic, stainless steel, ceramic, etc.) The stainless steel porous tube had a higher air permeability than other porous tube materials under conditions where crud formation had occurred.
8. Cleaning tests with detergent reveal that once the crud has formed on the
porous tube surface, it is very difficult to remove with detergent. 9. The results for a porous stainless steel tube with an applied electric field
indicated that when the electric field is present, the rate of crud formation is reduced.
ECONOMIC CONSIDERATION
Plant demonstration indicated that the specific capacity for the ASH-6C is about 160 gpm/ft3, which is about 50 times the specific capacity of a conventional flotation cell, and this should have a significant effect on capital cost. The energy consumption associated with the pump required to feed the ASH-6C is about 0.23 kwh/ton. This corresponds to a cost of $0.016/ton using a price for energy of $0.07/kwh. RECOMMENDATIONS
At this particular plant site, crud formation and plugging of the porous tube was found to limit the utility of the ASH technology. Tests at other plant sites with higher- quality water should be considered. Further study of, and new designs for, the porous tube are warranted. Other applications of the ASH technology should be considered to avoid the plugging problem; for example, the direct amine flotation of extra fine feed (100 mm x 20 mm) is recommended for further study.

Appendix A
ANALYTICAL METHOD FOR P2O5 ANALYSIS OF PRODUCTS FROM PHOSPHATE FLOTATION TESTS

A-1
APPENDIX A
ANALYTICAL METHOD FOR P2O5 ANALYSIS OF PRODUCTS FROM PHOSPHATE FLOTATION TESTS
REAGENTS a. Nitric acid 45.61% aqueous solution b. Ammonium molybdate solution Add 54 g ammonium nitrate, 53 g citric acid, and 68 ammonium molybdate in 1360 ml H2O. Pour molybdic acid solution slowly into HNO3 solution with constant stirring, heat to boil and allow to stand at least 24 hours. Filter before using. c. Phenolphthalein 1% in 95% ethyl alcohol. d. Filter medium Filter papers (Whatman, qualitative) e. Standard NaOH 0.2017 N. f. Standard HCl 0.1093 N. DETERMINATION Transfer 0.1 g sample(-200 mesh) into a 250 ml beaker and add 80 ml ammonium molybdate solution. Heat to boiling and simmer at slow boil for five minutes. Cool to room temperature and allow precipitate to settle. Prepare a funnel with filter paper. Decant onto filter. Wash precipitate onto filter with a small stream of H2O. Wash beaker down four times with a stream of H2O and transfer washing to filter. Wash precipitate and filter paper four times, then transfer precipitate and filter paper to original beaker, keeping the volume of H2O at 100 ml. Add from burette sufficient standard NaOH solution to completely dissolve the yellow precipitate plus 1-3 ml in excess; add 0.5 ml of phenolphthalein at end or near end of NaOH titration. Titrate excess NaOH with standard HCl solution to a faint pink end point by means of a pH meter at 7.85 ± 0.05.
%P O M N VG2 5 480
= × ××

A-2
where: M - P2O5 molecular weight. N - NaOH standard solution equivalent concentration G - weight of sample in gram. V - NaOH standard solution actual consumption in ml. V = ml of NaOH standard solution - ml of HCl standard solution × NHCl/NNaOH

Appendix B
PERMEABILITY CALCULATION

B-1
APPENDIX B
PERMEABILITY CALCULATION From fluid dynamics, the apparent velocity v, the flow rate per unit area, and direction of flow can be expressed by a constitutive relation, Darcy’s Law. In the case of the air-sparged hydrocyclone, the problem can be simplified as an axisymmetric air flow into the porous tube. The momentum equation for air flow is described as
v k pr
= − εµ
∂∂
(1) where ε is the porosity of the porous media, k is the permeability of the porous media, µ is viscosity of air, p is pressure, and r is the radial position. Besides the constitutive equation describing flow resistance, the flow obeys the continuity equation, which in steady state, is 1 0
r rr v∂
∂ρ( ) =
(2) for an incompressible porous structure, where ρ is the air density. From equation (2), the following equation can be derived: r v const q mρ = = − * (3) where, q*m is the product of the mass flow of air through a unit cylindrical area multiplied by the radius r. Substituting equation (3) into (1) and considering the compressibility of air, equation (1) becomes an ordinary differential equation describing the relation of pressure P and position r as following:
k dp
drq P
rpm
µ ρ=
*1
1
(4) where, P1 is the pressure on the inner wall surface of the porous tube, and ρ1 is the air density at the inner wall surface of the porous tube.

B-2
Integrating the above equation with the following boundary conditions: p = P1 at r = R1 (5a) p = P2 at r = R2, (5b) where P2 is the pressure on the outer wall surface of the porous tube, R1 and R2 are inner radius and outer radius of the porous tube, respectively, equation (4) becomes
q RR
kR P
P Pm = −122
1
1
1 122
12
ln( )
ρ εµ
(6) where qm = qm*/ R1, which is the air mass flow through a unit area at the inner wall surface of the porous tube. The standard volume flowrate of air can be found from equation (6) as:
q k
RRR
PP
PP
PsS S
= +ε
µ 12
1
1 212ln
( )∆ ∆
(7) where Ps is the standard pressure, e.g. atmospheric pressure, and ∆P is the pressure drop through the porous tube, ∆P = P2-P1. From the above equation, it can be concluded that if the back pressure is very small relative to standard pressure, the second item in the parenthesis can be ignored and the pressure drop increases linearly with increasing air flowrate. Therefore, the product of permeability k and the porosity ε can be calculated approximately by following equation:
ε µπ
k RRR
qPP
PP
PC
Q RP
s
S S
s=+
≈12
1 1 2
11
2
2ln
( )∆ ∆ ∆

B-3
where C is a constant for a given porous tube. Therefore, the permeability of a porous tube can be defined as the air flowrate through per unity area of porous tube under unity back pressure as follows: K
Q RP
S=/ 2 1π∆
(8) The relative permeability is defined as the ratio of the permeability of used porous tube and the permeability of new porous tube: K K
Kr usednew
= (9)

Appendix C
MEASUREMENT RESULTS OF CRUD FORMATION TESTS

C-1
APPENDIX C
MEASUREMENT RESULTS OF CRUD FORMATION TESTS
Pressure Drop (psi)0.0 0.5 1.0 1.5 2.0 2.5 3.0 3.5 4.0 4.5
Air
Flow
rate
(slp
m)
0
50
100
150
200
250
300
350
400
450
500
Test Conditions: Slime: 35 g Water: 25 g Oil: 1.0 ml Fatty Acid : 1.0 ml Amine: 3.0 ml
All reagents are added before the beginning of crud formation test
Stirrer velocity: 6000 rpm
Fresh porous tube After 1 hour After 2 hours
Coarse Fine
Figure AP-C1. Initial Crud Formation Test Results for Plastic Porous Tubes of Different Pore Sizes.
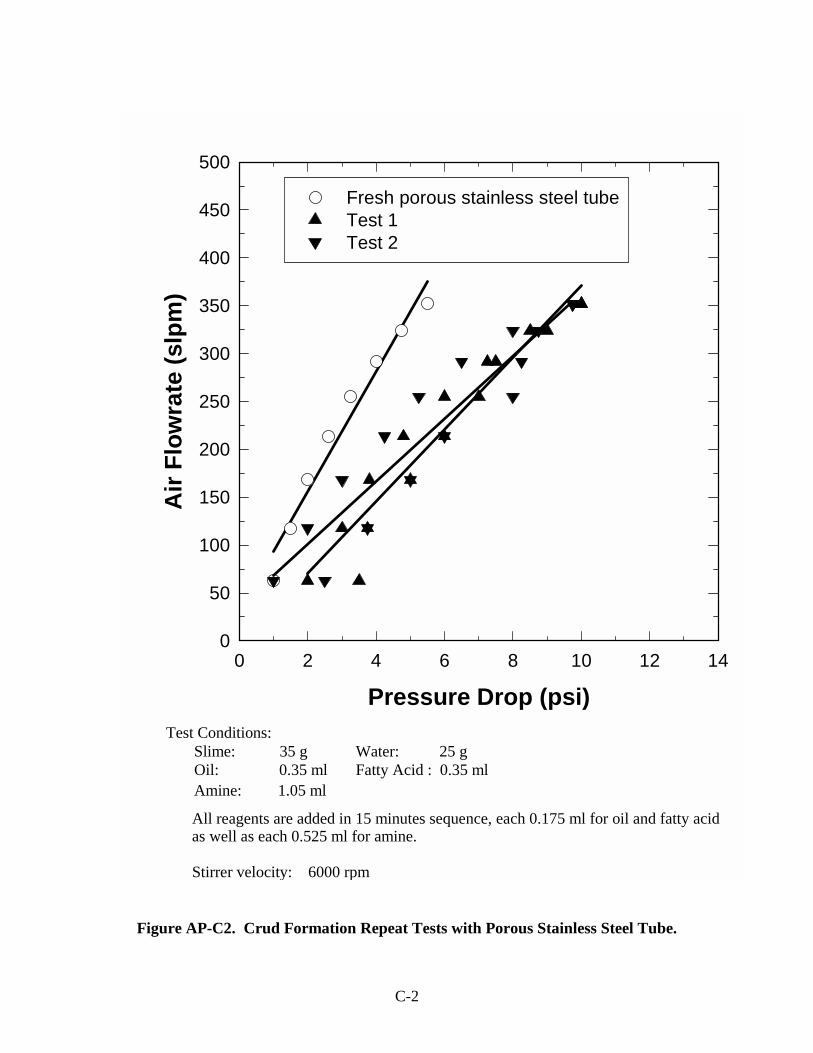
C-2
Pressure Drop (psi)0 2 4 6 8 10 12 14
Air
Flow
rate
(slp
m)
0
50
100
150
200
250
300
350
400
450
500
Fresh porous stainless steel tubeTest 1Test 2
Test Conditions: Slime: 35 g Water: 25 g Oil: 0.35 ml Fatty Acid : 0.35 ml Amine: 1.05 ml
All reagents are added in 15 minutes sequence, each 0.175 ml for oil and fatty acidas well as each 0.525 ml for amine.
Stirrer velocity: 6000 rpm
Figure AP-C2. Crud Formation Repeat Tests with Porous Stainless Steel Tube.

C-3
Pressure Drop (psi)0 1 2 3 4 5 6 7 8
Air
Flow
rate
(slp
m)
0
50
100
150
200
250
300
350
400
450
500
Test Conditions: Slime: 35 g Water: 25 g Oil: 0.35 ml Fatty Acid : 0.35 ml Amine: 1.05 ml
All reagents are added in 15 minutes sequence, each 0.175 ml for oil and fatty acidas well as each 0.525 ml for amine.
Stirrer velocity: 6000 rpm
Fresh plastic porous tube After 30 minutes
Coarse Fine
Figure AP-C3. Comparison of Crud Formation Test Results for Plastic Porous Tubes with Different Pore Sizes.

C-4
Pressure Drop (psi)0 1 2 3 4 5 6 7 8 9 10 11 12
Air
Flow
rate
(slp
m)
0
50
100
150
200
250
300
350
400
450
500
Porous stainless steel tube Plastic porous tube
Test Conditions: Slime: 35 g Water: 25 g Oil: 0.35 ml Fatty Acid : 0.35 ml Amine: 1.05 ml
All reagents are added in 15 minutes sequence, each 0.175 ml for oil and fatty acidas well as each 0.525 ml for amine.
Stirrer velocity: 6000 rpm
White for fresh tube and black for after test
Figure AP-C4. Comparison of Crud Formation Test Results for Plastic Porous Tube and Porous Stainless Steel Tube.

C-5
Pressure Drop (psi)0 2 4 6 8 10 12 14
Air
Flow
rate
(slp
m)
0
50
100
150
200
250
300
350
400
450
500
Fresh porous tubeAfter 30 minutes for no static electric fieldAfter 30 minutes for +40v static electric field
Test Conditions: Slime: 35 g Water: 25 g Oil: 0.35 ml Fatty Acid : 0.35 ml Amine: 1.05 ml
All reagents are added in 15 minutes sequence, each 0.175 ml for oil and fatty acidas well as each 0.525 ml for amine.
Stirrer velocity: 6000 rpm
Figure AP-C5. Comparison of Crud Formation Test Results for Porous Stainless Steel Tubes with Positive Electric Field and without Electric Field.

C-6
Pressure Drop (psi)0 2 4 6 8 10 12 14
Air
Flow
rate
(slp
m)
0
50
100
150
200
250
300
350
400
450
500
Fresh porous stainless steel tubeAfter 30 minutes for no static electric fieldAfter 30 minutes for -40v static electric field
Test Conditions: Slime: 35 g Water: 25 g Oil: 0.35 ml Fatty Acid : 0.35 ml Amine: 1.05 ml
All reagents are added in 15 minutes sequence, each 0.175 ml for oil and fatty acidas well as each 0.525 ml for amine.
Stirrer velocity: 6000 rpm
Figure AP-C6. Comparison of Crud Formation Test Results for Porous Stainless Steel Tubes with Negative Electric Field and without Electric Field.

C-7
Pressure Drop (psi)0 2 4 6 8 10 12
Air
Flow
rate
(slp
m)
0
50
100
150
200
250
300
350
400
450
500
Fresh porous stainless steel tubeAfter 30 minutesAfter Cleaning
Test Conditions: Slime: 35 g Water: 25 g Oil: 0.35 ml Fatty Acid : 0.35 ml Amine: 1.05 ml
All reagents are added in 15 minutes sequence, each 0.175 ml for oil and fatty acidas well as each 0.525 ml for amine.
Stirrer velocity: 6000 rpm
Cleaner: Benzene, methyl Isopropyl alcohol 2-Butannone Cabon dioxide
Figure AP-C7. Results of Cleaning Test for Porous Stainless Steel Tube.
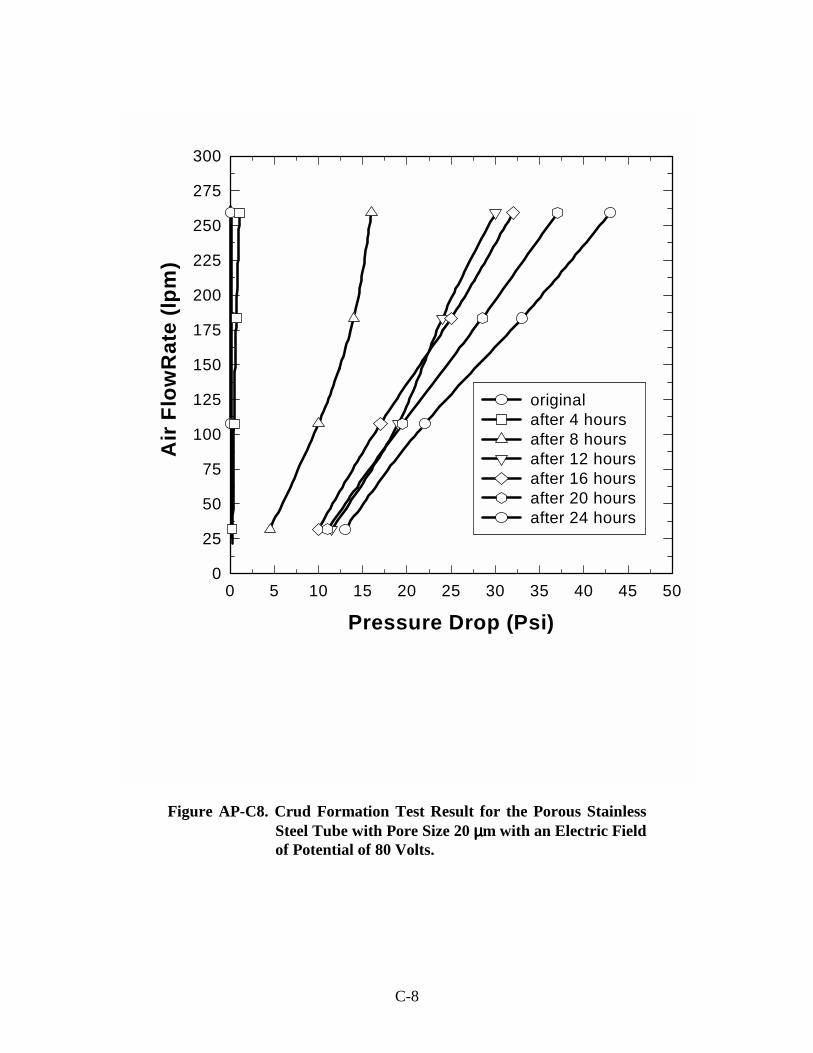
C-8
Pressure Drop (Psi)0 5 10 15 20 25 30 35 40 45 50
Air
Flow
Rat
e (lp
m)
0
25
50
75
100
125
150
175
200
225
250
275
300
originalafter 4 hoursafter 8 hoursafter 12 hoursafter 16 hoursafter 20 hoursafter 24 hours
Figure AP-C8. Crud Formation Test Result for the Porous Stainless
Steel Tube with Pore Size 20 µµµµm with an Electric Field of Potential of 80 Volts.

C-9
Pressure Drop (Psi)0 5 10 15 20 25 30 35 40 45 50
Air
Flow
Rat
e (lp
m)
0
25
50
75
100
125
150
175
200
225
250
275
300
originalafter 4 hoursafter 8 hoursafter 12 hoursafter 16 hoursafter 20 hoursafter 24 hours
Figure AP-C9. Crud Formation Test Result for the Porous Stainless
Steel Tube with Pore Size 1 µµµµm, No Electric Field.

C-10
Pressure Drop (Psi)0.0 0.2 0.4 0.6 0.8 1.0 1.2 1.4 1.6 1.8 2.0
Air
Flo
wra
te (l
pm)
75
100
125
150
175
200
225
originalafter 6 hoursafter 12 hoursafter 18 hours
Figure AP-C10. Plant-Site Test Result of Crud Formation for the
Fine Plastic Porous Tube.

C-11
Pressure Drop (Psi)0.0 0.1 0.2 0.3 0.4 0.5 0.6 0.7 0.8 0.9 1.0
Air
Flow
rate
(lpm
)
75
100
125
150
175
200
225
originalafter 6 hoursafter 12 hoursafter 18 hours
Figure AP-C11. Plant-Site Test Result of Crud Formation for the
Coarse Plastic Porous Tube.

C-12
Pressure Drop (Psi)0.0 0.2 0.4 0.6 0.8 1.0 1.2 1.4 1.6 1.8 2.0
Air
Flow
Rat
e (lp
m)
75
100
125
150
175
200
225
originalafter 4 hoursafter 10 hoursafter 16 hours
Figure AP-C12. Plant-Site Test Result of Crud Formation for the
Porous Stainless Steel Tube.

C-13
Pressure Drop (Psi)0.0 0.1 0.2 0.3 0.4 0.5 0.6 0.7 0.8 0.9 1.0
Air
Flow
Rat
e (lp
m)
75
100
125
150
175
200
225
originalafter 6 hoursafter 12 hoursafter 18 hours
Figure AP-C13. Plant-Site Test Result of Crud Formation for the
Ceramic Porous Tube.

C-14
Pressure Drop (Psi)0.00 0.05 0.10 0.15 0.20 0.25 0.30 0.35 0.40 0.45 0.50
Air
Flow
rate
(lpm
)
75
100
125
150
175
200
225
originalafter 6 hoursafter 12 hoursafter 18 hours
Figure AP-C14. Plant-Site Test Result of Crud Formation for the Wired Stainless Steel Tube with Smooth Inner Surface.

C-15
Pressure Drop (Psi)0.0 0.2 0.4 0.6 0.8 1.0 1.2 1.4 1.6 1.8 2.0
Air
Flow
rate
(lpm
)
75
100
125
150
175
200
225
originalafter 6 hoursafter 12 hoursafter 14.5 hoursafter 20.5 hours
Figure AP-C15. Plant-Site Test Result of Crud Formation for the Plastic Porous
Tube when Detergent Was Added in Feed.

C-16
Pressure Drop (Psi)0.0 0.1 0.2 0.3 0.4 0.5 0.6 0.7 0.8 0.9 1.0
Air
Flow
rate
(lpm
)
75
100
125
150
175
200
225
originalafter 6 hoursafter 12 hours
Figure AP-C16. Plant-Site Test Result of Crud Formation for the Plastic
Porous Tube While Cleaning Every 6 Hours.

Appendix D
PHOTOGRAPHY OF CRUD BUILD-UP ON THE SURFACE OF POROUS TUBES

D-1
Figure AP-D1. Crud Build-up at the Fine Plastic Porous Tube Surface (After 18
Hours’ Operation).

D-2
Figure AP-D2. Crud Build-up at the Coarse Plastic Porous Tube
Surface (After 18 Hours’ Operation).

D-3
Figure AP-D3. Crud Build-Up at Stainless Steel Porous Tube Surface
(After 16 Hours' Operation).
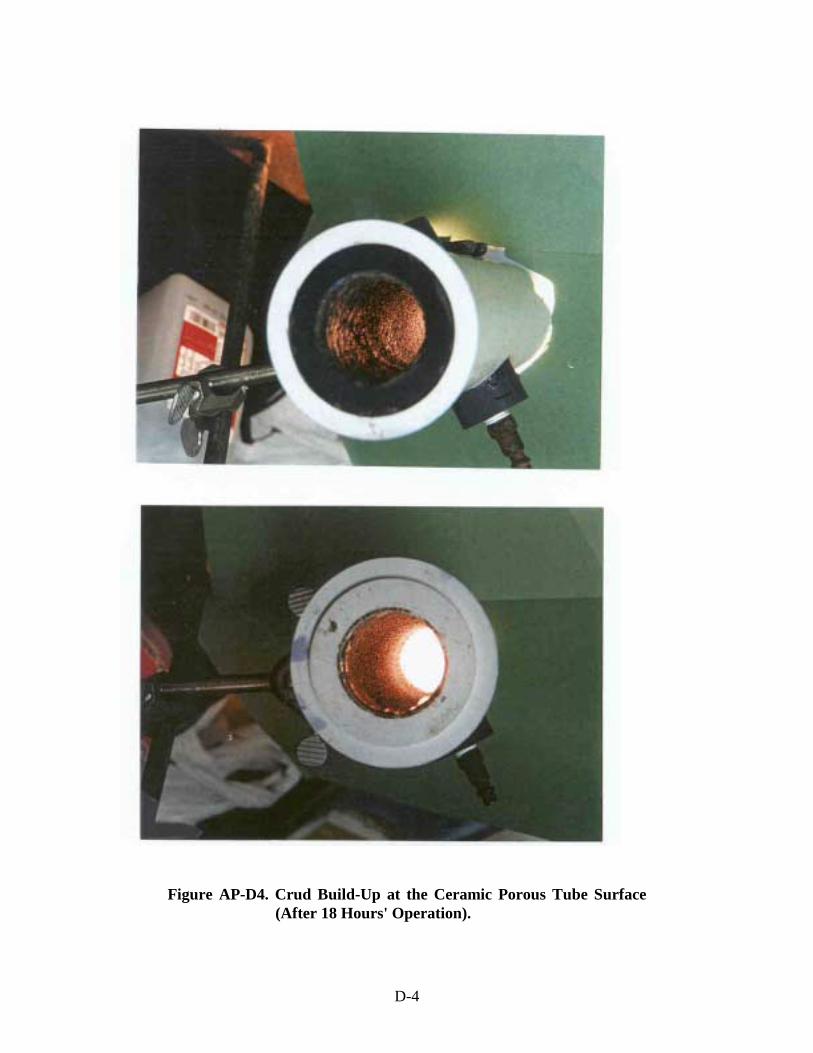
D-4
Figure AP-D4. Crud Build-Up at the Ceramic Porous Tube Surface
(After 18 Hours' Operation).

D-5
Figure AP-D5. Crud Build-Up at the Wired Steel Porous Tube Surface (Smooth) (After 16 Hours' Operation).

D-6
Figure AP-D6. Crud Build-Up at the Wired Steel Porous Tube
Surface (Rough) (After 9 Hours' Operation).

D-7
Figure AP-D7. Crud Build-Up at the Plastic Porous Tube When
Detergent Was Added with Feed (After 18 Hours' Operation).

D-8
Figure AP-D8. Crud Build-up at Plastic Porous Tube after Cleaning with
Detergent (After 12 Hours' Operation).


![[PPT]An Introduction to Basic Hydrocyclone Operation Hydrocyclone Operation.ppt · Web viewAn Introduction to Basic Hydrocyclone Operation What is a Cyclone ? A cyclone is a piece](https://static.documents.pub/doc/80x56/5b046c187f8b9a6c0b8dc5cf/pptan-introduction-to-basic-hydrocyclone-hydrocyclone-operationpptweb-viewan.jpg)


