AIR TEMPERATURE VARIABILITY AND TRENDS OVER GREECE C.M. PHILANDRAS1 1Research Center for Atmospheric Physics andP.T. NASTOS2 Climatology of Academy of AthensC.C. REPAPIS1 3rd September 131, Athens, Greece 2Laboratory of Climatology and Atmospheric Environment University of Athens Panepistimiopolis, GR 157 84, Athens, Greece Received: 17/04/07 *to whom all correspondence should be addressed:Accepted: 25/02/08 e-mail: [email protected]
ABSTRACT In this study, the variability and trends of the mean annual and seasonal surface air temperature in Greek peninsula are examined. The climatic data used, concern mean monthly values of air temperature of 20 meteorological stations of the Hellenic Meteorological Service, for the period 1951-2000. The air temperature time series for each station are analyzed, so that the variability and trends be described. Regarding the annual time series, a cooling trend is observed since the early 1960’s till the middle of the decade of 1970, when the trend reverses to heating till nowadays. It is remarkable that the today air temperature levels do not exceed the levels of the middle of the century. During the winter, it is crystal clear that a cooling trend exists from the middle of the decade of 1950 to the end of the decade of 1980, especially in the south region of the country. Afterwards an increasing trend is obvious till nowadays. The pattern in spring appears a slight heating trend in the northern region of Greece and a cooling trend in the south. The summer time series are similar to the annual ones, so the contribution of summer to annual variability is unquestionable. Generally speaking, the air temperature in autumn follows the same distribution in time. In the process, the Factor Analysis is applied on the mean annual and seasonal air temperature and thereafter the regions, within the air temperature covariates, are defined. Finally, the application of spectral analysis to annual and seasonal air temperature is regarded necessary so that the periodicities are derived.
KEYWORDS: Air Temperature Trends, Factor Analysis, Spectral Analysis, Greece 1. INTRODUCTION At the last two decades a lot of research has been carried out, concerning the climatic fluctuations and trends of surface air temperature in different regions of the planet for various time periods, as well. It appears, therefore, that the global surface air temperature increases about 0.6 ± 0.2 °C during the twentieth century. The air temperature time series for the Northern Hemisphere seem to have the same rate of change (Jones et al., 2001; IPCC, 2001). In the Mediterranean region, the variations of air temperature for the last 100 years appear to be similar to the variations of temperature that have been recorded globally. In the region of Eastern Mediterranean, Repapis and Philandras, (1988) and Philandras (1994) showed that, the march of the mean annual air temperature is almost parallel to the respective one in the Northern Hemisphere, from the minimum that happens in the beginning of the 20th century up to the heating of 0.6 °C observed about the middle of the century and thereafter the cooling of the decades of 1960 and 1970, after small fluctuations. The cooling observed during this period in the Northern Hemisphere is inverted soon and since the beginning of the decade of 1980 the air temperature exceeds the temperature levels corresponding to the middle of the
274 PHILANDRAS et al.
century. Concerning the Eastern Mediterranean, the cooling is more intense of about –0.6 °C and even if it is reversed since the decade of 1980, the last two or three years seems to reach the levels of temperature in the middle of the century. Sahsamanoglou and Makrogiannis (1992) have proved that, during the period 1950-1988, the air temperature in the region of Western Mediterranean presents positive trend of 0.01-0.02 °C/year and equivalent negative trend of 0.01-0.02 °C/year, in the region of Eastern Mediterranean, as a result of the small change in circulation observed in the region of Mediterranean during the examined period. Also, Metaxas et al., (1991) concluded to similar results after having examined the sea surface temperature time series for the region of Mediterranean. Piervitali et al., (1997) found that the mean air temperature in the Mediterranean and more specifically in the Central and Western Mediterranean presents an increase of about 0.80 °C/100 years. In the region of Greece, Giles and Flocas (1984) showed that, the annual and seasonal air temperature time series for the stations of Thessalonica and Larissa present negative trends for a time period of 80 years while the time series for Athens present negative trends only during the period 1945-1981. Hasanean (2001) also found that, in Athens there is a rise (warming) of temperature during the period 1875-1940, and thereafter temperatures fall (cooling) until 1991. Proedrou et al., (1997) have extracted similar results, examining the trends of the mean maximum and mean minimum air temperatures for 25 stations of Greece during the period 1951-1993. They found a cooling trend in the annual time series, which is recovered since the middle of the decade 1970. Feidas et al., (2004) found that Greece, in general, shows a cooling trend in winter for the period 1955–2001, whereas, summer shows an overall warming trend, however, neither is statistically significant. As a result, the overall trend of the annual values is nearly zero. With regard to Athens, Founda et al., (2004) analyzed the 105-year (1897-2001) surface air temperature record of the National Observatory of Athens (NOA) and found a tendency towards warmer years, with significantly warmer summer and spring periods and slightly warmer winters (an increase of 1.23 and 0.34°C has been observed in the mean summer and mean winter temperature, respectively. According to a recent research of Michel and Hulme (2000), the mean annual air temperature was estimated for every country in our planet during 1901-1998. In the process, the linear trend for every country during 20th century was computed, and the trend for Greece is negative, -0.1 °C. In the present research, the time series of the mean annual and seasonal air temperature are examined during the period 1951-2000, aiming to study more specifically the structure of air temperature regime in Greece, in the decade 1990-2000, which marked the end of 20th century.
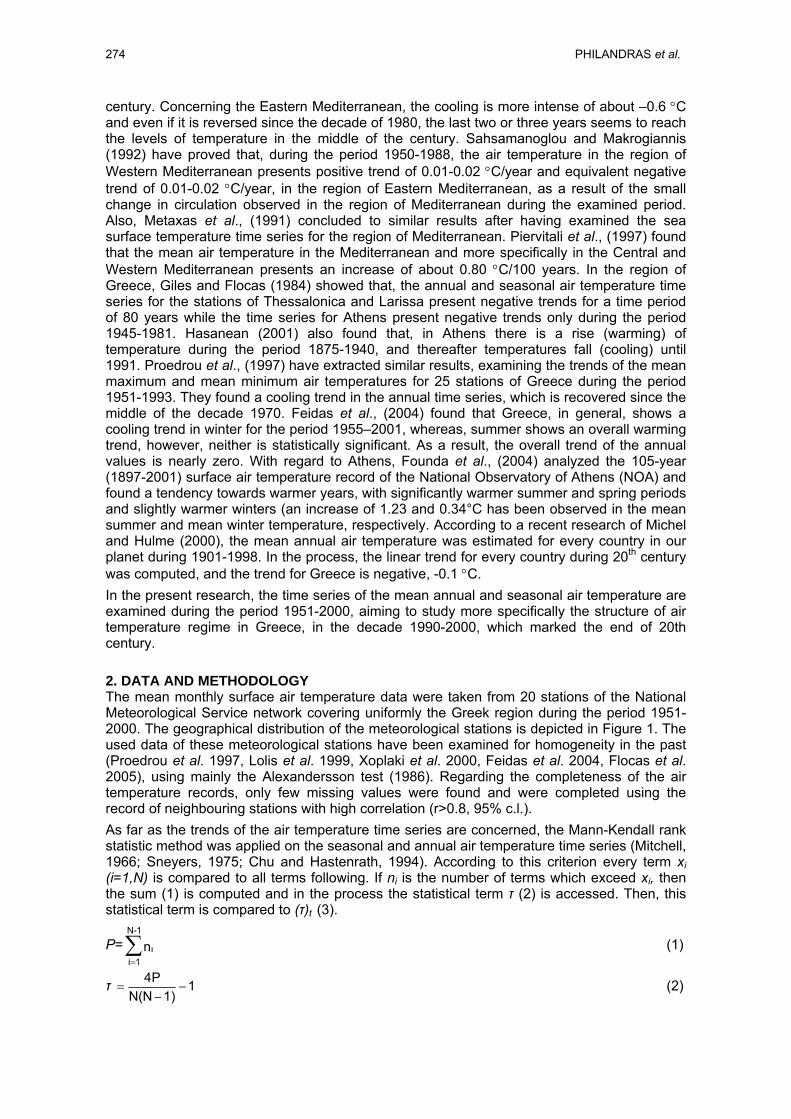
2. DATA AND METHODOLOGY The mean monthly surface air temperature data were taken from 20 stations of the National Meteorological Service network covering uniformly the Greek region during the period 1951-2000. The geographical distribution of the meteorological stations is depicted in Figure 1. The used data of these meteorological stations have been examined for homogeneity in the past (Proedrou et al. 1997, Lolis et al. 1999, Xoplaki et al. 2000, Feidas et al. 2004, Flocas et al. 2005), using mainly the Alexandersson test (1986). Regarding the completeness of the air temperature records, only few missing values were found and were completed using the record of neighbouring stations with high correlation (r>0.8, 95% c.l.). As far as the trends of the air temperature time series are concerned, the Mann-Kendall rank statistic method was applied on the seasonal and annual air temperature time series (Mitchell, 1966; Sneyers, 1975; Chu and Hastenrath, 1994). According to this criterion every term xi (i=1,N) is compared to all terms following. If ni is the number of terms which exceed xi, then the sum (1) is computed and in the process the statistical term τ (2) is accessed. Then, this statistical term is compared to (τ)t (3).
P=Ν-1
ιi 1
n=∑ (1)
τ 4P 1Ν(Ν 1)
= −−
(2)
AIR TEMPERATURE VARIABILITY AND TRENDS OVER GREECE 275
(τ)t = 0±1.96 4Ν 109Ν(Ν 1)
+−
(3)
where 1.96 is the value for t at the probability point in the Gaussian distribution for 95% significant level and for the two-tailed test. In the process, the Factor Analysis (FA) was used, which is briefly discussed below.The main applications of FA are to reduce the number of variables and to detect structure in the relationships between variables, that is to classify variables. Therefore FA is applied as a data reduction or structure detection method. The data should have a bivariate normal distribution for each pair of variables, and observations should be independent. Therefore each of the p initial variables X1, X2, …, Xp can be expressed as a linear function of m (m<p) uncorrelated factors: Xi = ai1F1 + ai2F2 + … + aimFm where F1, F2, … , Fm are the factors and ai1, ai2, … , aim are the factor loadings which express the correlation between the factors and the initial variables. The values of each factor are called factor scores and they are presented in standardized form, having zero mean and unit variance (Jolliffe, 1986; Manly, 1986). The number m of the retained factors has to be decided, by using various rules (eigenvalue ≥ 1, scree plot) and considering the physical interpretation of the results (Bartzokas and Metaxas, 1993). Another important point of the analysis is the rotation of the axes, which maximizes some factor loadings and minimizes some others and in that way a better separation among the initial variables is succeeded. Varimax rotation is generally accepted as the most accurate orthogonal rotation, which maximizes the sum of the variances of the square factor loadings, keeping the factors uncorrelated (Richman, 1986).
IOANNINA
PYRGOS
KYTHIRA
TRIPOLIS
MILOS
TRIKALALARISSA
KOZANI
ALEXANDROUPOLIS
IRAKLIOSITIA
20 21 22 23 24 25 26 27 28 29
20 21 22 23 24 25 26 27 28 29
35
36
37
38
39
40
41
42
35
36
37
38
39
40
41
42
ALBANIA
FYROMBULGARIA
TURKEY
TURKEY
IONIAN SEA
AEGEAN SEA
THESSALONIKI
PHILADELPHIA
ELLINIKO
KERKYRA
ARAXOS
METHONI
MYTILINI
KOS
NOA
Figure 1. Geographical distribution of the meteorological stations network
Finally, the Spectral Analysis (Blackman and Tukey, 1958) is applied to the annual time series in order hidden periodicities be extracted. The period is estimated according to the following
formula: Period= max2LagLag
, where Lagmax=number of years/3.
276 PHILANDRAS et al.
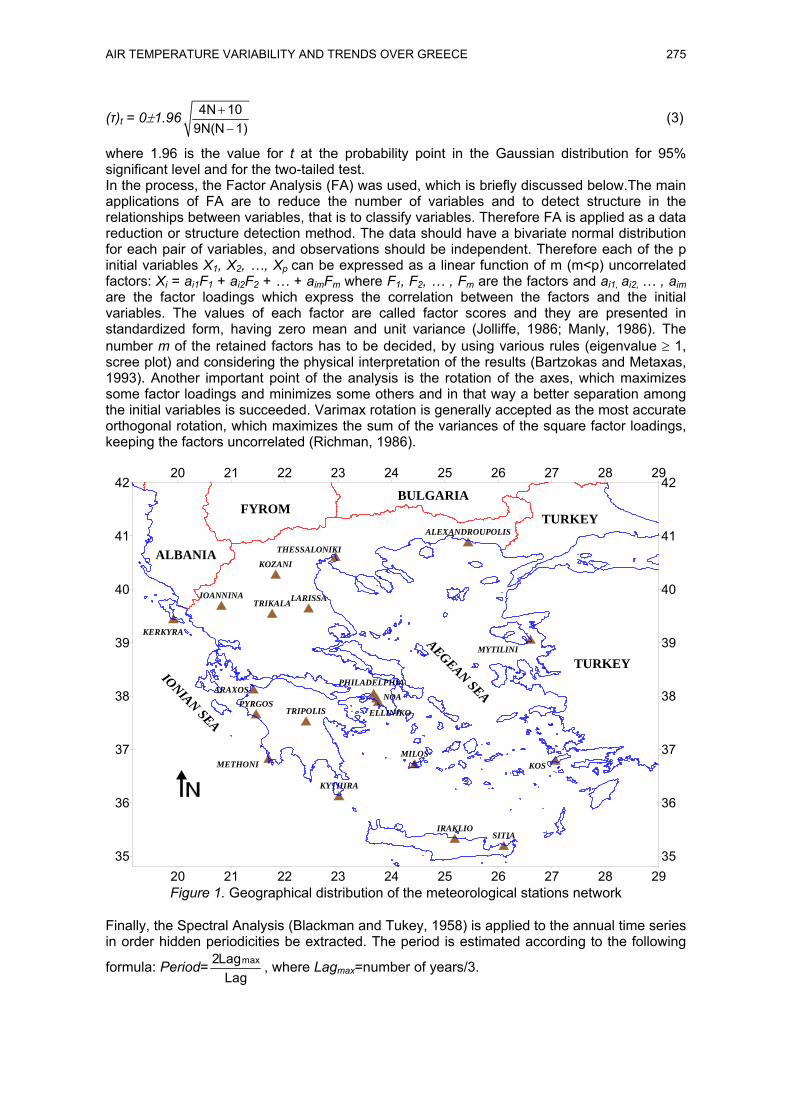
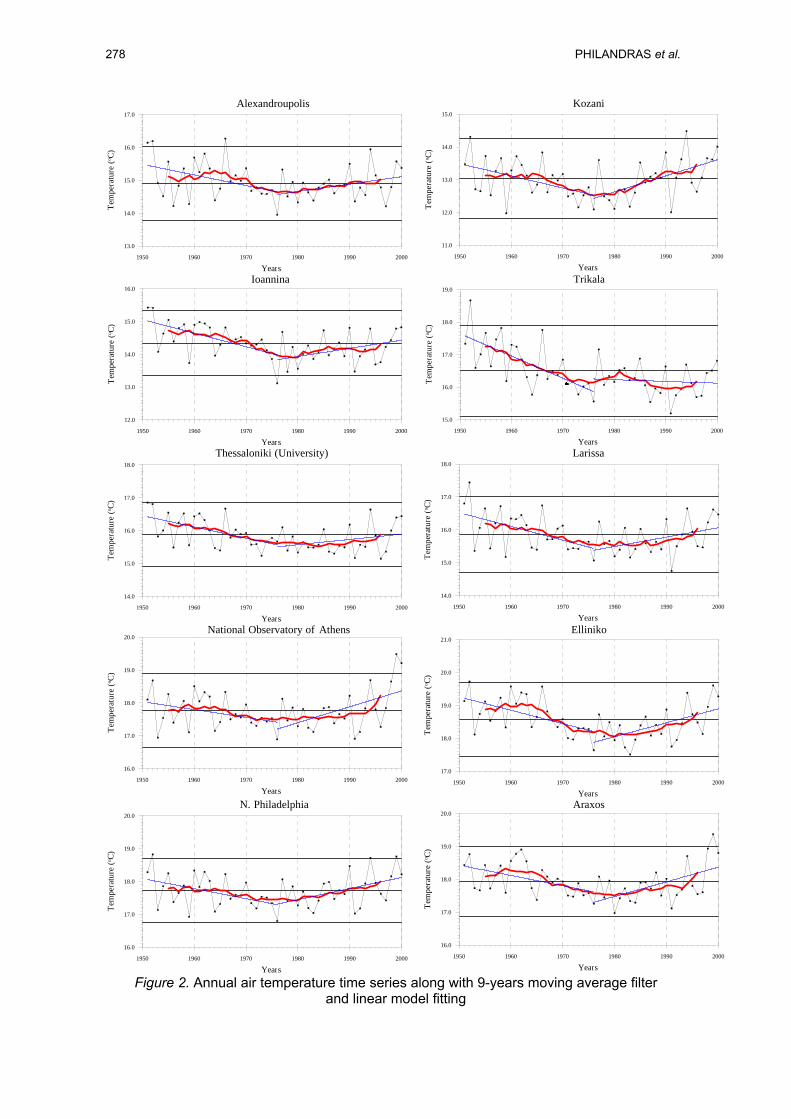
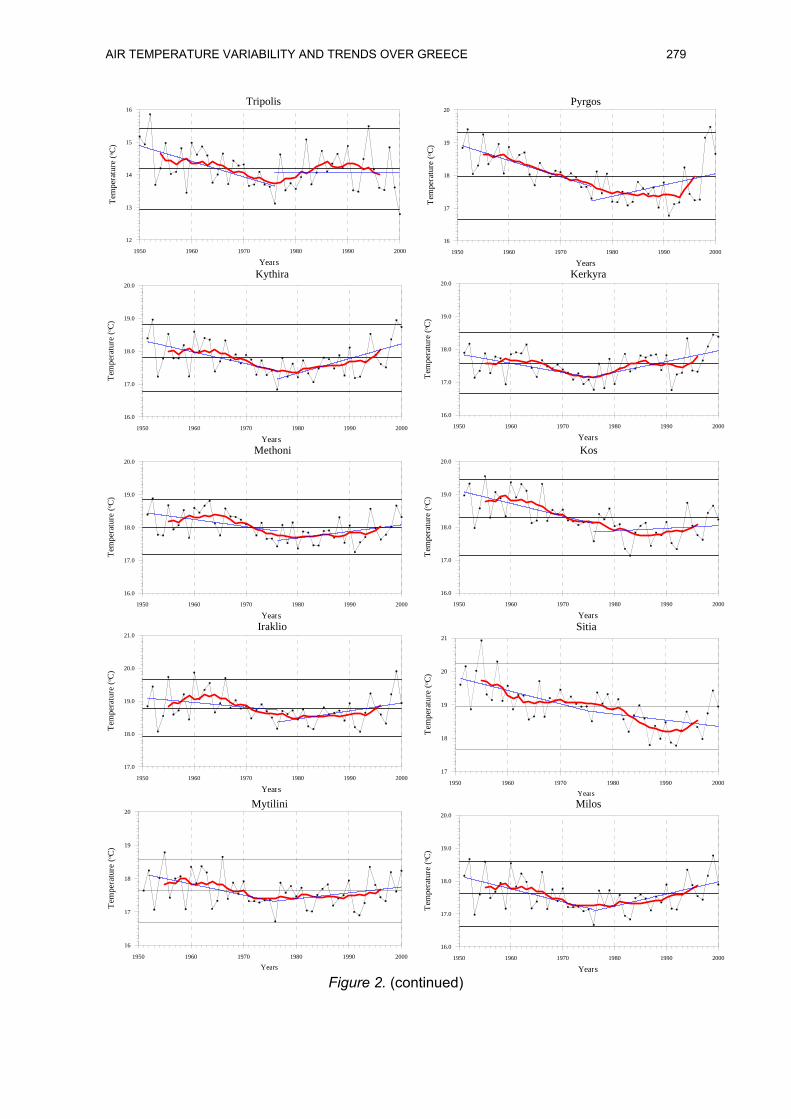
3. DISCUSSION AND RESULTS The annual air temperature time series along with 9-years moving average filter and linear models fitting for the 20 meteorological stations are depicted in Figure 2. Also, in each graph of the Figure 2, three lines have been drawn, representing the mean annual air temperature for the period 1951-2000, the mean+2σ and the mean–2σ respectively (σ is the standard deviation). It is obvious that since the beginning of the examined period and for about the next fifteen years, the annual air temperature shows high values, which, in the most cases, are higher than the mean annual air temperature of the period 1951-2000. Thereafter, a cooling trend, approximately –0.8 °C, statistically significant at the 95% confidence level (c.l.), is observed for the majority of the stations, ending at a minimum in the middle of the decade of 1970, which is the coolest decade in the Hellenic region. More specifically, for the cooling period 1951-1976, the trend appears to be from -0.014 °C/year (Iraklio) to –0.066 °C/year (Trikala), (Tables 1, 2).
Table 1. Mann-Kendall test results for annual and seasonal air temperature time series. Stations Year Winter Spring Summer Autumn
In most of the stations, the minimum of the annual air temperature appears in 1976, which is one from the coldest years. Afterwards, the air temperature of all time series remains almost at low levels, under the mean value of the period 1951-2000, since the beginning of the decade of 1990, when the trend reverses to heating, all over the Hellenic region. It is remarkable to mention that, only at the last two-three years, the air temperature reaches the boundaries of the air temperature appeared in the middle of the century (Figure 2). As far as the extreme annual mean air temperature is concerned, the upper limit (mean + 2σ) was exceeded in all stations with an exception of Kerkyra, National Observatory of Athens (NOA) and Araxos stations, during the first five years of the decade 1950 and in a few stations during the last decade of 1990, especially nearby the year 2000. Table 1 gives the results of the Mann-Kendall test, which certify that all the trends (°C/year) of the mean annual air temperature time series (with an exception of the Alexandroupolis and Iraklio), as they appear in the following Table 2, are statistically significant (95% c.l.) for the first period 1951-1976 (figures in bold and shaded with gray color). The heating trends
AIR TEMPERATURE VARIABILITY AND TRENDS OVER GREECE 277
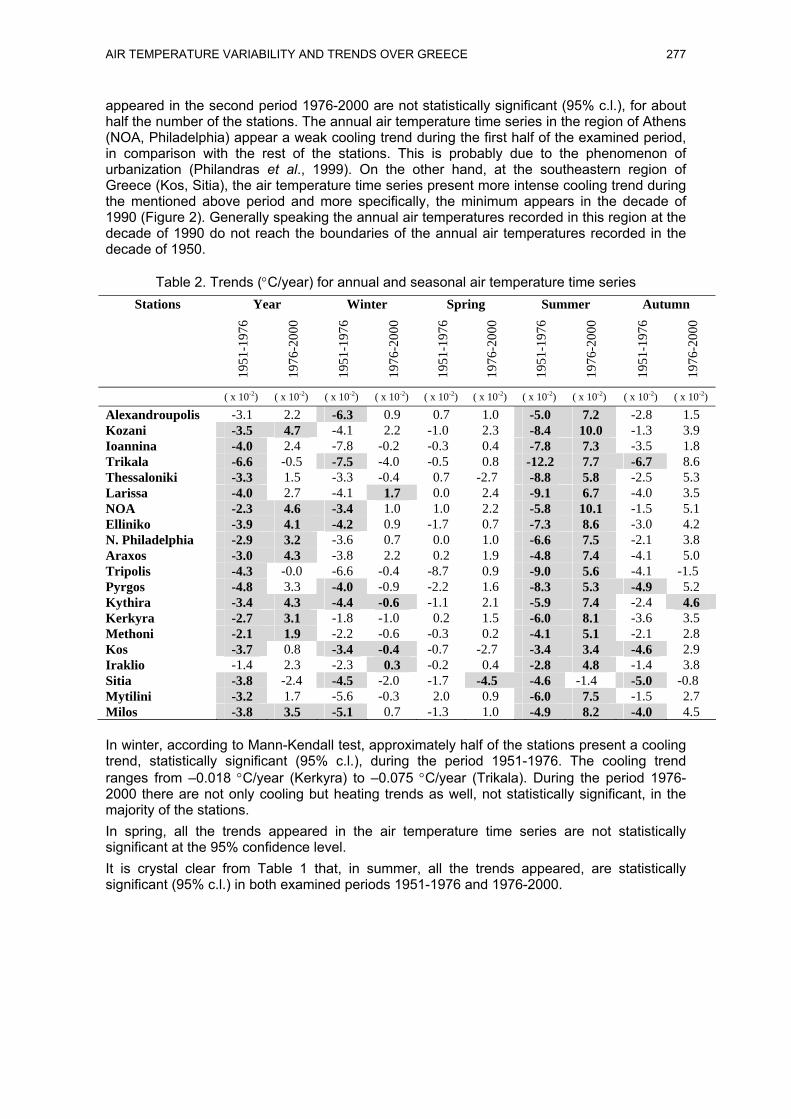
appeared in the second period 1976-2000 are not statistically significant (95% c.l.), for about half the number of the stations. The annual air temperature time series in the region of Athens (NOA, Philadelphia) appear a weak cooling trend during the first half of the examined period, in comparison with the rest of the stations. This is probably due to the phenomenon of urbanization (Philandras et al., 1999). On the other hand, at the southeastern region of Greece (Kos, Sitia), the air temperature time series present more intense cooling trend during the mentioned above period and more specifically, the minimum appears in the decade of 1990 (Figure 2). Generally speaking the annual air temperatures recorded in this region at the decade of 1990 do not reach the boundaries of the annual air temperatures recorded in the decade of 1950.
Table 2. Trends (°C/year) for annual and seasonal air temperature time series Stations Year Winter Spring Summer Autumn
1951
-197
6
19
76-2
000
19
51-1
976
19
76-2
000
19
51-1
976
19
76-2
000
19
51-1
976
19
76-2
000
19
51-1
976
19
76-2
000
( x 10-2) ( x 10-2) ( x 10-2) ( x 10-2) ( x 10-2) ( x 10-2) ( x 10-2) ( x 10-2) ( x 10-2) ( x 10-2)
Alexandroupolis -3.1 2.2 -6.3 0.9 0.7 1.0 -5.0 7.2 -2.8 1.5 Kozani -3.5 4.7 -4.1 2.2 -1.0 2.3 -8.4 10.0 -1.3 3.9 Ioannina -4.0 2.4 -7.8 -0.2 -0.3 0.4 -7.8 7.3 -3.5 1.8 Trikala -6.6 -0.5 -7.5 -4.0 -0.5 0.8 -12.2 7.7 -6.7 8.6 Thessaloniki -3.3 1.5 -3.3 -0.4 0.7 -2.7 -8.8 5.8 -2.5 5.3 Larissa -4.0 2.7 -4.1 1.7 0.0 2.4 -9.1 6.7 -4.0 3.5 NOA -2.3 4.6 -3.4 1.0 1.0 2.2 -5.8 10.1 -1.5 5.1 Elliniko -3.9 4.1 -4.2 0.9 -1.7 0.7 -7.3 8.6 -3.0 4.2 N. Philadelphia -2.9 3.2 -3.6 0.7 0.0 1.0 -6.6 7.5 -2.1 3.8 Araxos -3.0 4.3 -3.8 2.2 0.2 1.9 -4.8 7.4 -4.1 5.0 Tripolis -4.3 -0.0 -6.6 -0.4 -8.7 0.9 -9.0 5.6 -4.1 -1.5 Pyrgos -4.8 3.3 -4.0 -0.9 -2.2 1.6 -8.3 5.3 -4.9 5.2 Kythira -3.4 4.3 -4.4 -0.6 -1.1 2.1 -5.9 7.4 -2.4 4.6 Kerkyra -2.7 3.1 -1.8 -1.0 0.2 1.5 -6.0 8.1 -3.6 3.5 Methoni -2.1 1.9 -2.2 -0.6 -0.3 0.2 -4.1 5.1 -2.1 2.8 Kos -3.7 0.8 -3.4 -0.4 -0.7 -2.7 -3.4 3.4 -4.6 2.9 Iraklio -1.4 2.3 -2.3 0.3 -0.2 0.4 -2.8 4.8 -1.4 3.8 Sitia -3.8 -2.4 -4.5 -2.0 -1.7 -4.5 -4.6 -1.4 -5.0 -0.8 Mytilini -3.2 1.7 -5.6 -0.3 2.0 0.9 -6.0 7.5 -1.5 2.7 Milos -3.8 3.5 -5.1 0.7 -1.3 1.0 -4.9 8.2 -4.0 4.5 In winter, according to Mann-Kendall test, approximately half of the stations present a cooling trend, statistically significant (95% c.l.), during the period 1951-1976. The cooling trend ranges from –0.018 °C/year (Kerkyra) to –0.075 °C/year (Trikala). During the period 1976-2000 there are not only cooling but heating trends as well, not statistically significant, in the majority of the stations. In spring, all the trends appeared in the air temperature time series are not statistically significant at the 95% confidence level. It is crystal clear from Table 1 that, in summer, all the trends appeared, are statistically significant (95% c.l.) in both examined periods 1951-1976 and 1976-2000.
278 PHILANDRAS et al.
1950 1960 1970 1980 1990 2000
Years
13.0
14.0
15.0
16.0
17.0Te
mpe
ratu
re (o C
)Alexandroupolis
1950 1960 1970 1980 1990 2000
Years
11.0
12.0
13.0
14.0
15.0
Tem
pera
ture
(o C)
Kozani
1950 1960 1970 1980 1990 2000
Years
12.0
13.0
14.0
15.0
16.0
Tem
pera
ture
(o C)
Ioannina
1950 1960 1970 1980 1990 2000
Years
15.0
16.0
17.0
18.0
19.0
Tem
pera
ture
(o C)
Trikala
1950 1960 1970 1980 1990 2000
Years
14.0
15.0
16.0
17.0
18.0
Tem
pera
ture
(o C)
Thessaloniki (University)
1950 1960 1970 1980 1990 2000
Years
14.0
15.0
16.0
17.0
18.0
Tem
pera
ture
(o C)
Larissa
1950 1960 1970 1980 1990 2000
Years
16.0
17.0
18.0
19.0
20.0
Tem
pera
ture
(o C)
National Observatory of Athens
1950 1960 1970 1980 1990 2000
Years
17.0
18.0
19.0
20.0
21.0
Tem
pera
ture
(o C)
Elliniko
1950 1960 1970 1980 1990 2000
Years
16.0
17.0
18.0
19.0
20.0
Tem
pera
ture
(o C)
N. Philadelphia
1950 1960 1970 1980 1990 2000
Years
16.0
17.0
18.0
19.0
20.0
Tem
pera
ture
(o C)
Araxos
Figure 2. Annual air temperature time series along with 9-years moving average filter
and linear model fitting
AIR TEMPERATURE VARIABILITY AND TRENDS OVER GREECE 279
Figure 2. (continued)
1950 1960 1970 1980 1990 2000
Years
12
13
14
15
16Te
mpe
ratu
re (o C
)Tripolis
1950 1960 1970 1980 1990 2000
Years
16
17
18
19
20
Tem
pera
ture
(o C)
Pyrgos
1950 1960 1970 1980 1990 2000
Years
16.0
17.0
18.0
19.0
20.0
Tem
pera
ture
(o C)
Kythira
1950 1960 1970 1980 1990 2000
Years
16.0
17.0
18.0
19.0
20.0
Tem
pera
ture
(o C)
Kerkyra
1950 1960 1970 1980 1990 2000
Years
16.0
17.0
18.0
19.0
20.0
Tem
pera
ture
(o C)
Methoni
1950 1960 1970 1980 1990 2000
Years
16.0
17.0
18.0
19.0
20.0
Tem
pera
ture
(o C)
Kos
1950 1960 1970 1980 1990 2000
Years
17.0
18.0
19.0
20.0
21.0
Tem
pera
ture
(o C)
Iraklio
1950 1960 1970 1980 1990 2000
Years
17
18
19
20
21
Tem
pera
ture
(o C)
Sitia
1950 1960 1970 1980 1990 2000
Years
16
17
18
19
20
Tem
pera
ture
(o C)
Mytilini
1950 1960 1970 1980 1990 2000
Years
16.0
17.0
18.0
19.0
20.0
Tem
pera
ture
(o C)
Milos
280 PHILANDRAS et al.
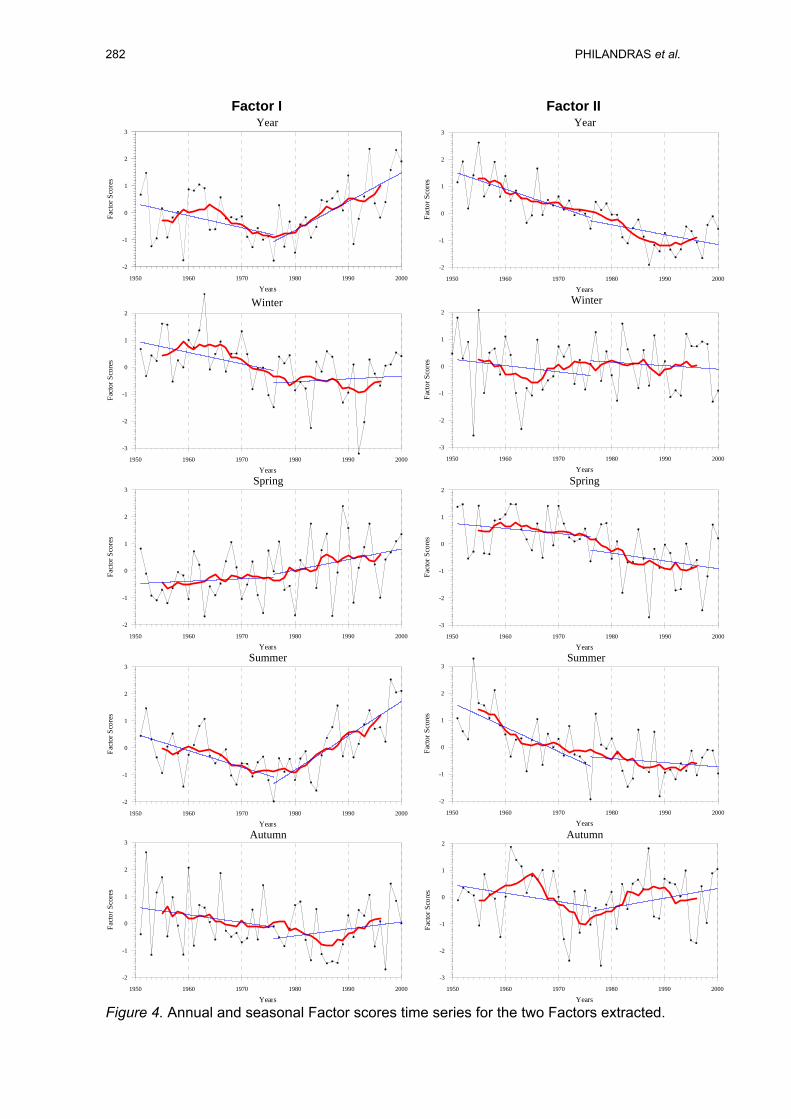
During the first period, a cooling trend is apparent all over the Hellenic region and ranges from –0.028 °C/year (Iraklio) to –0.122 °C/year (Trikala). During the second period 1976-2000 the heating trend is dominated with an exception of Sitia, where a weak cooling trend is appeared. The air temperature increases from 1.2 °C (Iraklio) to 2.5 °C (NOA, Kozani). Interpreting these Mann-Kendall results, everybody can claim that the summer air temperature contributes to the annual air temperature more than winter air temperature does. This is probably the main reason of the annual air temperature increase, especially during the decade 1990. In autumn, which is a transient season, the air temperature follows a cooling trend during the period 1951-1976, but this trend is statistically significant (95% c.l.) only to few stations while the heating trend appeared in the following years is not statistically significant (95% c.l.) for the most of the stations. The application of FA to monthly air temperature time series resulted in an objective classification of the meteorological stations in sub-regions of Greece with common characteristics regarding the air temperature variability (Figure 3); namely it is more clear to present the trends and the variability of the air temperature regime of each extracted sub region, instead of presenting the air temperature of Greece, by averaging all the air temperature time series, as presented in Feidas et al. (2004) study. Besides, the variability and trends of the main factors on seasonal and annual basis are presented for the two examined periods 1951-1976 and 1976-2000 (Figure 4), where remarkable differences are depicted with respect to annual, spring and summer trends of the two main factors extracted. In the process, the results of the application of FA to annual and seasonal time series are interpreted. Regarding the annual air temperature time series, FA leads to two factors, explaining the 84% of the total variance. The first factor (76%) represents the northern and central Hellenic region while the second one (8%), mainly the southeastern region. Plotting the factors scores time series extracted, for the first factor, two trends are apparent. The cooling trend appears during 1951-1976 and the heating trend during 1976-2000, both statistically significant (95% c.l.), (Figure 4). The factor scores time series, for the second factor, verify the cooling trends for the two periods examined. Throughout the analysis, there is a general sense of concern that such annual trends are attributable in some measure to summer trends. In attempting to address such concerns, the application of FA to summer time series was assessed. Two factors extracted, explaining 81% of the total variance. The first factor (73%) includes the majority of the Hellenic region, and the second one (8%) represents the southeastern area of the country. Both factor scores time series show similar trends to respective annual ones, but these trends are more intense in cooling and heating as well, during the two prolonged periods (Figure 4). Besides, the first factor presents statistically significant (95% c.l.) positive trend with respect to the whole period (1951-2000). This can be explained by the observed significant positive sea-level pressure trend (up to 0.04 hPa=year) in the southeastern Mediterranean, the Middle East and Turkey and therefore a less frequent expansion of the low over the Mediterranean results in a weakening of the Etesian winds (north to noortheasterly air flow) and a subsequent increase in summer temperatures (Feidas et al., 2004). Winter is well described by two factors, which explain the 88% of the total variance. The air temperature regime is established according to latitude (Nastos, 1995), that is, the first factor (82%) represents the southern, eastern and part of western regions while the second one (6%) the northern and mountainous regions. Regarding the first factor, there is a cooling trend statistically significant (95% c.l.) for the period 1951-1976 and thereafter a weak-heating trend for the period 1976-2000. The factor scores time series of the second factor appear weak cooling trends in both examined periods (Figure 4). Taking into account the whole period (1951-2000), a cooling trend, although not significant, is apparent in the two sub regions examined. This is possibly connected to the corresponding increasing trend of the sea level pressure over central-western regions of the Mediterranean (Feidas et al., 2004), which is likely to be related to an increase of the frequency and persistence of anticyclones, particularly during the winter, that could be attributed to the Azores anticyclone (Colacino and Conte, 1993; Piervitali et al., 1997). As a consequence, the
AIR TEMPERATURE VARIABILITY AND TRENDS OVER GREECE 281
tracks of the depressions moving across the Mediterranean have changed to the north and more specifically for the eastern Mediterranean, a decrease in cyclonic circulation is observed since 1960 for winter, which can be connected to a change in the zonal circulation index for the North Atlantic and Europe (Sahsamanoglou and Makrogiannis, 1992). Furthermore, this cooling trend can be associated with the increased frequency of the northwest or northeast continental, dry and cold flows over Greece from northern Europe and western Russia, which are linked to the increase of the frequency and persistence of anticyclones over the central Mediterranean and Balkans (Maheras et al., 1999). This is also in agreement with the results of Feidas et al. (2004), regarding the winter geopotential height field.
20 21 22 23 24 25 26 27 28 29
20 21 22 23 24 25 26 27 28 29
35
36
37
38
39
40
41
42
35
36
37
38
39
40
41
42
ALBANIA
FYROMBULGARIA
TURKEY
TURKEY
IONIAN SEA
AEGEAN SEA
Factor II
Factor I
20 21 22 23 24 25 26 27 28 29
20 21 22 23 24 25 26 27 28 29
35
36
37
38
39
40
41
42
35
36
37
38
39
40
41
42
ALBANIA
FYROMBULGARIA
TURKEY
TURKEY
IONIAN SEA
AEGEAN SEA
Factor II
Factor I
Winter Spring
20 21 22 23 24 25 26 27 28 29
20 21 22 23 24 25 26 27 28 29
35
36
37
38
39
40
41
42
35
36
37
38
39
40
41
42
ALBANIA
FYROMBULGARIA
TURKEY
TURKEY
IONIAN SEA
AEGEAN SEA
Factor II
Factor I
Factor II
20 21 22 23 24 25 26 27 28 29
20 21 22 23 24 25 26 27 28 29
35
36
37
38
39
40
41
42
35
36
37
38
39
40
41
42
ALBANIA
FYROMBULGARIA
TURKEY
TURKEY
IONIAN SEA
AEGEAN SEA
Factor I
Factor II
Summer Autumn
Figure 3. Seasonal spatial distribution of the two Factors extracted
In spring, the first factor (75%) represents most of the stations located in northern, western and central Greece, while the second one (7%) is limited to the southern and southeastern regions. The factor scores time series show small increasing trends for the first factor, while small decreasing trends are obvious for the second factor. The air temperature, in autumn (a transient season) differs from the other seasons. The first factor (78%) concludes stations from the eastern and central Greece, while the second one (7%) represents mainly the western region. A cooling trend during 1951-1976, and thereafter a heating one till 2000 are the results of plotting the factor scores time series of the first factor. Similar trends, but more intense are presented in western Hellenic region (Figure 4). This result shows that air temperature distribution, in autumn, differs from air temperature one in spring, which is a transient season, as well.
282 PHILANDRAS et al.
Factor I Factor II
1950 1960 1970 1980 1990 2000
Years
-2
-1
0
1
2
3
Fact
or S
core
s
Year
1950 1960 1970 1980 1990 2000
Years
-2
-1
0
1
2
3
Fact
or S
core
s
Year
1950 1960 1970 1980 1990 2000
Years
-3
-2
-1
0
1
2
Fact
or S
core
s
Winter
1950 1960 1970 1980 1990 2000
Years
-3
-2
-1
0
1
2
Fact
or S
core
s
Winter
1950 1960 1970 1980 1990 2000
Years
-2
-1
0
1
2
3
Fact
or S
core
s
Spring
1950 1960 1970 1980 1990 2000
Years
-3
-2
-1
0
1
2
Fact
or S
core
s
Spring
1950 1960 1970 1980 1990 2000
Years
-2
-1
0
1
2
3
Fact
or S
core
s
Summer
1950 1960 1970 1980 1990 2000
Years
-2
-1
0
1
2
3
Fact
or S
core
s
Summer
1950 1960 1970 1980 1990 2000
Years
-2
-1
0
1
2
3
Fact
or S
core
s
Autumn
1950 1960 1970 1980 1990 2000
Years
-3
-2
-1
0
1
2
Fact
or S
core
s
Autumn
Figure 4. Annual and seasonal Factor scores time series for the two Factors extracted.
AIR TEMPERATURE VARIABILITY AND TRENDS OVER GREECE 283
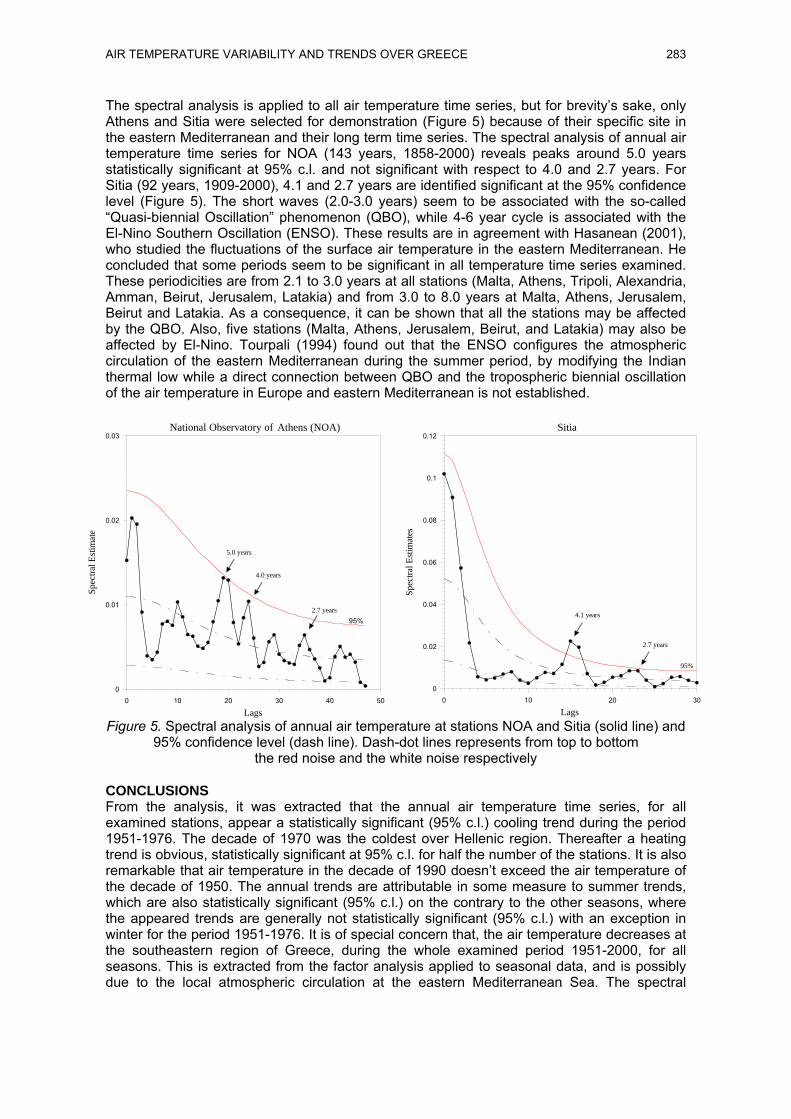
The spectral analysis is applied to all air temperature time series, but for brevity’s sake, only Athens and Sitia were selected for demonstration (Figure 5) because of their specific site in the eastern Mediterranean and their long term time series. The spectral analysis of annual air temperature time series for NOA (143 years, 1858-2000) reveals peaks around 5.0 years statistically significant at 95% c.l. and not significant with respect to 4.0 and 2.7 years. For Sitia (92 years, 1909-2000), 4.1 and 2.7 years are identified significant at the 95% confidence level (Figure 5). The short waves (2.0-3.0 years) seem to be associated with the so-called “Quasi-biennial Oscillation” phenomenon (QBO), while 4-6 year cycle is associated with the El-Nino Southern Oscillation (ENSO). These results are in agreement with Hasanean (2001), who studied the fluctuations of the surface air temperature in the eastern Mediterranean. He concluded that some periods seem to be significant in all temperature time series examined. These periodicities are from 2.1 to 3.0 years at all stations (Malta, Athens, Tripoli, Alexandria, Amman, Beirut, Jerusalem, Latakia) and from 3.0 to 8.0 years at Malta, Athens, Jerusalem, Beirut and Latakia. As a consequence, it can be shown that all the stations may be affected by the QBO. Also, five stations (Malta, Athens, Jerusalem, Beirut, and Latakia) may also be affected by El-Nino. Tourpali (1994) found out that the ENSO configures the atmospheric circulation of the eastern Mediterranean during the summer period, by modifying the Indian thermal low while a direct connection between QBO and the tropospheric biennial oscillation of the air temperature in Europe and eastern Mediterranean is not established.
0 10 20 30 40 50
Lags
0
0.01
0.02
0.03
Spec
tral E
stim
ate
National Observatory of Athens (NOA)
95%
5.0 years
4.0 years
2.7 years
0 10 20 30
Lags
0
0.02
0.04
0.06
0.08
0.1
0.12
Spec
tral E
stim
ates
4.1 years
2.7 years
95%
Sitia
Figure 5. Spectral analysis of annual air temperature at stations NOA and Sitia (solid line) and
95% confidence level (dash line). Dash-dot lines represents from top to bottom the red noise and the white noise respectively
CONCLUSIONS From the analysis, it was extracted that the annual air temperature time series, for all examined stations, appear a statistically significant (95% c.l.) cooling trend during the period 1951-1976. The decade of 1970 was the coldest over Hellenic region. Thereafter a heating trend is obvious, statistically significant at 95% c.l. for half the number of the stations. It is also remarkable that air temperature in the decade of 1990 doesn’t exceed the air temperature of the decade of 1950. The annual trends are attributable in some measure to summer trends, which are also statistically significant (95% c.l.) on the contrary to the other seasons, where the appeared trends are generally not statistically significant (95% c.l.) with an exception in winter for the period 1951-1976. It is of special concern that, the air temperature decreases at the southeastern region of Greece, during the whole examined period 1951-2000, for all seasons. This is extracted from the factor analysis applied to seasonal data, and is possibly due to the local atmospheric circulation at the eastern Mediterranean Sea. The spectral
284 PHILANDRAS et al.
analysis reveals peaks, which likely identify the QBO and ENSO cycles in the annual air temperature time series. REFERENCES Alexandersson H. (1986), A homogeneity test applied to precipitation data, Journal of Climatology
6, 661–675. Bartzokas A. and Metaxas, D.A. (1993), Covariability and climatic changes of the lower-troposhere
temperatures over the Northern Hemisphere, Il Nuovo Cimento, 16, 359-373. Blackman R.B. and Tukey G.W. (1958), The measurement of Power Spectra, Dover Publ., N.Y.,
190. Chu P.S., Yu, Z.P. and Hastenrath S. (1994), Detecting climate change concurrent with
deforestation in the Amazon basin : Which way has it gone? Bulletin of American Meteorological Society, 75, 759-583.
Colacino M., Conte M. (1993), Greenhouse effect and pressure patterns in the Mediterranean basin, Il Nuovo Cimento C 16, 67–76.
Feidas H., Makrogiannis T. and Bora-Senta E. (2004), Trend analysis of air temperature time series in Greece and their relationship with circulation using surface and satellite data: 1955-2001, Theoretical and Applied Climatology 79, 185-208.
Flocas H.A., Tolika K., Anagnostopoulou Chr., Patrikas I., Maheras P., Vafiadis M. (2005), Evaluation of maximum and minimum temperature of NCEP-NCAR reanalysis data over Greece, Theoretical and Applied Climatology 80, 49-65.
Founda D., Papadopoulos K.H., Petrakis M., Giannakopoulos C. and Good P. (2004), Analysis of mean, maximum, and minimum temperature in Athens from 1897 to 2001 with emphasis on the last decade: Trends, warm events, and cold events, Global and Planetary Change, 44(1-4), 27-38.
Giles B.D. and Flocas A.A. (1984), Air Temperature variations in Greece. Part 1. Persistance, Trend, And Fluctuations, International Journal of Climatology, 4, 531-539.
Hasanean H.M, (2001), Fluctuations of surface air temperature in the Eastern Mediterranean, Theoretical and Applied Climatology 68, 75-87.
IPCC (2001), Third Assessment Report, Working Group I Report. Jolliffe I.T. (1986), Principal Component Analysis, Springer-Verlag, New York. Jones P.D., Osborn T.J., Briffa K.R., Folland C.K., Horton B., Alexander L.V., Parker D.E. and
Rayner, N.A. (2001), Adjusting for sampling density in grid-box land and ocean surface temperature time series, Journal of Geophysical. Research, 106, 3371-3380.
Lolis C.J., Bartzokas A., Metaxas D.A. (1999), Spatial covariability of the climatic parameters in the Greek area, International Journal of Climatology 19, 185-196.
Maheras P., Xoplaki E., Davies T.D., Martin-Vide J., Barriendos M., Alcoforado M.J. (1999), Warm and cold monthly anomalies across the Mediterranean basin and their relationship with circulation, International Journal of Climatology 19,1697–1715.
Manly B.F.J. (1986), Multivatiate Statistical Methods: A Primer. Chapman & Hall: London. Metaxas D.A., Bartzokas A. and Vitsas A. (1991), Temperature Fluctuations in the Mediterranean
Area during the last 120 years, International Journal of Climatology 11, 897-908. Michel T. and Hulme M. (2000), A Country by Country Analysis of Past and Future Warming
Rates, Tyndall Centre Internal Report, No 1, November, UEA, Norwich, UK, 6 (http://www.tyndall.uea.ac.uk/main.htm)
Mitchell J.M. et al. (1966), Climatic change, WMO, Tech Note 79. WMO No 195. TP-100 Geneva, 79
Nastos P.T. (1995), The influence of the physicogeographical factors on the air temperature regime over Greece, PhD Thesis, Faculty of Geology and Geoenvironment, University of Athens, Greece.
Philandras C.C., Metaxas D.A., Nastos P.T. and Repapis C.C. (1999), Climate Variability and Urbanization in Athens, Theoretical and Applied Climatology 63, 65-72.
Philandras C.M. (1994), Climatic trends and fluctuations of the air temperature regime in Europe and Mediterranean Sea during the last 100 years, PhD Thesis, Faculty of Geology and Geoenvironment, University of Athens, Greece.
Piervitali E., Colasino M., Conte M. (1997), Signals of climatic change in the Central-Western Mediterranean basin, Theoretical and Applied Climatology 58, 211–219.
AIR TEMPERATURE VARIABILITY AND TRENDS OVER GREECE 285
Proedrou M., Theoharatos G. and Cartalis C. (1997), Variations and trends in annual and seasonal air temperature in Greece determined from ground and satellite measurements, Theoretical and Applied Climatology 57, 65-78.
Repapis C.C. and Philandras C. M. (1988), A note on the air temperature trends of the last 100 years, as evidenced in the Eastern Mediterranean time series, Theoretical and Applied Climatology 39, 93-107.
Richman M.B. (1986), Rotation of principal components, Journal of Climatology 6, 293-335. Sahsamanoglou H.S., Makrogiannis T.J. (1992), Temperature trends over the Mediterranean
region, 1950–1988, Theoretical and Applied Climatology 45: 183–192 Sneyers R. (1975), Sur l’ analyse statistique des series d’observations, Technical Note 143,
WMO, Geneva. Tourpali C. (1994), The Quasi Biennial Oscillation and the Southern Oscillation in the Atmosphere,
PhD Thesis, Faculty of Physics, University of Thessaloniki, Greece. Xoplaki E, Luterbacher J, Burkard R, Patrikas I, Maheras P (2000), Connection between the large-
scale 500 hPa geopotential height fields and precipitation over Greece during wintertime, Climate Research 14,129-146.