Airborne tunable diode laser spectrometer fortrace-gas measurement in the lower stratosphere
James Podolske and Max Loewenstein
This paper describes the airborne tunable laser absorption spectrometer, a tunable diode laser instrumentdesigned for in situ trace-gas measurement in the lower stratosphere from an ER-2 high-altitude researchaircraft. Laser-wavelength modulation and second-harmonic detection are employed to achieve therequired constituent detection sensitivity. The airborne tunable laser absorption spectrometer was usedin two polar ozone campaigns, the Airborne Antarctic Ozone Experiment and the Airborne ArcticStratospheric Expedition, and measured nitrous oxide with a response time of Is and an accuracy • 10%.
Many problems of interest in modern atmosphericchemical and dynamical research require fast-respond-ing and specific chemical constituent sensors. Infra-red-absorption measurements provide the requisitespeed and measurement specificity and are a prioriapplicable to any molecule having reasonably strongdipole transitions in the infrared spectral region, asdo almost all of the molecules of interest in atmo-spheric research. Several broad classes of moleculesmay be distinguished in the atmosphere, and heremuch of the emphasis will be placed on the lowerstratosphere. One class might be broadly referred toas atmospheric tracers, which are relatively abundant[mixing ratios > 10 parts in 109 by volume (ppbv)] andhave lifetimes generally much greater than 1 year.Molecules in this class are easily accessible to in situmeasurment by the use of tunable diode lasers andharmonic spectroscopy. Some typical members ofthis class are CH4, N20, CO, 03, and H20. A secondclass of molecules, typically with abundances < 10ppbv and lifetimes shorter than 1 year, are those thatenter into important chemical reactions throughoutthe lower stratosphere. In the nitrogen family NO2and HNO3 are typical examples; in the chlorine familyHCl is an important example. These molecules arestill accessible to detection by the use of harmonicspectroscopy, but they require longer paths for their
The authors are with the Earth System Science Division, NASAAmes Research Center, Moffett Field, California 94035-1000.
detection than do the tracer molecules. Finally, twoimportant classes of molecules that have mixingratios << 1 ppbv are the radicals such as ClO and HO2and the reservoir species such as N205 and CONO2.For their measurement these molecules require longoptical paths, which can generally be achieved only insolar occultation or by limb emission types of experi-ments.
Over the past decade there have emerged a numberof advanced technology instruments for atmosphericresearch employing tunable diode lasers and second-harmonic spectroscopy. The differential absorptionCO monitor (DACOM)' 2 and the balloon laser in situspectrometer (BLISS)3 have made significant measure-ments in the troposphere and stratosphere by employ-ing the tunable diode laser in a second-harmonicspectrometer. The airborne tunable laser absorp-tion spectrometer (ATLAS) has made important con-tributions to recent polar campaignS4' 5 by measuringthe tracer N20 in conjunction with other instrumentsmeasuring O3, CO, nitrogen oxides, and meteorologi-cal variables. The ATLAS instrument measures spe-cies accurately at a 1-Hz rate and thus providesmeaningful correlations with other high-rate datastreams available from the multiconstituent, polar-campaign instrument suite.
The initial motivation for the development of theATLAS instrument in the mid-1980's was to measureCO as a tracer of tropospheric air being transportedinto the stratosphere in the tropics, which was a partof the Stratosphere Troposphere Exchange Project(STEP)6 effort carried out in Darwin, Australia.With the discovery of the Antarctic ozone hole andthe resulting research needs, the ATLAS was con-verted to measure N20 as a stratospheric tracer.
Measurements made during the Airborne AntarcticOzone Experiment (AAOE)4 and the Airborne ArcticStratospheric Expedition (AASE)5 contributed a vitaldimension to the multiconstituent database gatheredin these campaigns. Future campaigns in whichATLAS tracer measurements will be important arethe follow-on Arctic and Antarctic campaigns plannedfor 1991-1993 and a new program (the NASA HighSpeed Research Program/Atmospheric Effects ofStratospheric Aircraft) to study the stratosphericchemical impacts of a planned supersonic aircraft (theHigh Speed Civil Transport) that may fly at altitudesbetween 17 and 24 km in the future.
2. TechniqueInfrared-absorption spectroscopy has proven to be apowerful method for measuring trace species in theatmosphere., 2' 7-20 The method exploits the rotation-vibration transitions of small molecules (five atoms orless) in the mid-infrared, which provide a selectiveand sensitive means to monitor the atmosphericnumber density of such molecules in a direct andnondestructive way.8 In the implementation of thismethod, lead salt tunable diode lasers (TDL's) arehighly effective as infrared sources.21 TDL's areavailable to cover the 3- to 15-p.m mid-infraredfingerprint region, where most molecules have atleast one strong absorption band. In addition, thelaser linewidth is significantly smaller than the molec-ular absorption linewidth under all conditions encoun-tered in the atmosphere, which is critical in achievingmaximum selectivity and sensitivity. The laser fre-quency can typically be tuned over 20.5 cm-' in asingle mode, easily covering a pressure-broadenedabsorption line. TDL's are compact, efficient, low-input-power devices, with a beam that can be easilycoupled to a high-f-number multipass sample cell forenhanced detection sensitivity. Finally, fractionallaser-amplitude noise levels in the kilohertz range ator below 105/Hi permit operation at frequencieswhere lock-in amplifiers are commercially available.
The second-harmonic detection technique is em-ployed to enhance the infrared-absorption signaturesof the gas being detected. This technique has aproven high sensitivity, with minimum detectableabsorptions of <5 x 10⁻⁶/Hz reported.9Harmonic detection selectively accentuates featureswith a spectral width comparable with the modula-tion amplitude of the laser frequency, so conditionscan be optimized for detecting the gas of interest andminimizing interfering features (baseline curvature,interference fringes, and laser-power variation).
The second-harmonic detection technique has beendescribed in detail previously9"10 and will be describedonly briefly here. First, the laser frequency v ismodulated over a small interval ±Av at a modulationfrequency f which is typically 1-10 kHz. Next thebeam is passed through a sample containing theabsorber of interest, generally with as long a pathlength as possible. The transmitted laser-beampower is then converted to an electrical signal, and its
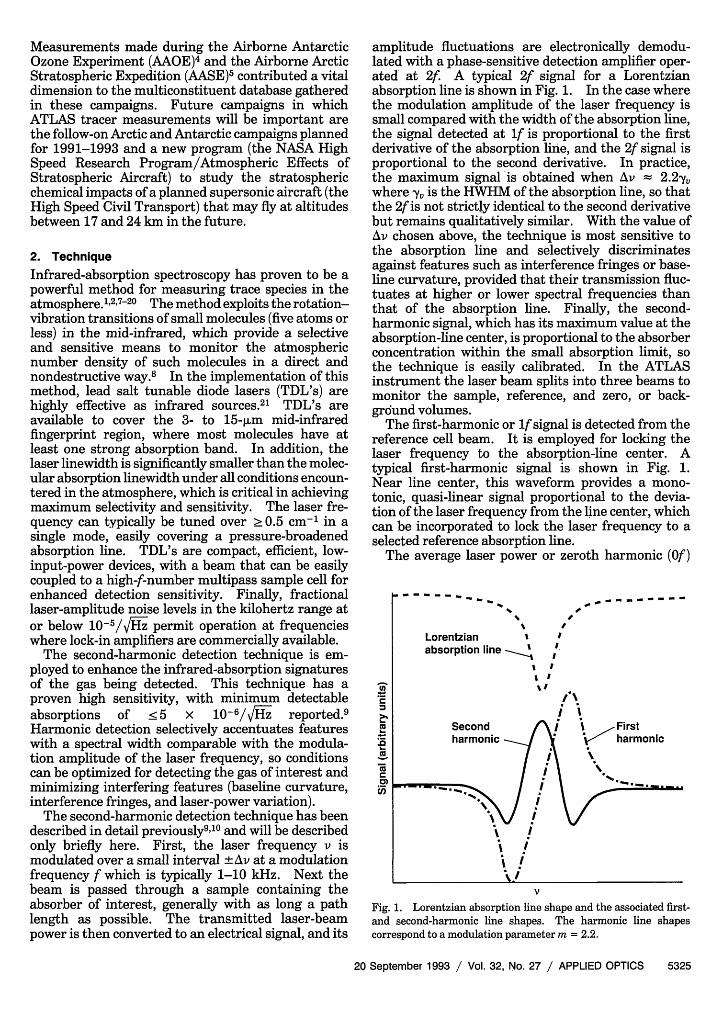
amplitude fluctuations are electronically demodu-lated with a phase-sensitive detection amplifier oper-ated at 2f. A typical 2f signal for a Lorentzianabsorption line is shown in Fig. 1. In the case wherethe modulation amplitude of the laser frequency issmall compared with the width of the absorption line,the signal detected at if is proportional to the firstderivative of the absorption line, and the 2f signal isproportional to the second derivative. In practice,the maximum signal is obtained when Av 2.2y,where yv is the HWHM of the absorption line, so thatthe 2f is not strictly identical to the second derivativebut remains qualitatively similar. With the value ofAv chosen above, the technique is most sensitive tothe absorption line and selectively discriminatesagainst features such as interference fringes or base-line curvature, provided that their transmission fluc-tuates at higher or lower spectral frequencies thanthat of the absorption line. Finally, the second-harmonic signal, which has its maximum value at theabsorption-line center, is proportional to the absorberconcentration within the small absorption limit, sothe technique is easily calibrated. In the ATLASinstrument the laser beam splits into three beams tomonitor the sample, reference, and zero, or back-ground volumes.
The first-harmonic or If signal is detected from thereference cell beam. It is employed for locking thelaser frequency to the absorption-line center. Atypical first-harmonic signal is shown in Fig. 1.Near line center, this waveform provides a mono-tonic, quasi-linear signal proportional to the devia-tion of the laser frequency from the line center, whichcan be incorporated to lock the laser frequency to aselected reference absorption line.
The average laser power or zeroth harmonic (Of)
Lorentzian * I
absorption line - ,
Second j ' Firste harmonic . harmonic
Su !_
V
Fig. 1. Lorentzian absorption line shape and the associated first-and second-harmonic line shapes. The harmonic line shapescorrespond to a modulation parameter m = 2.2.
proves useful for normalizing the 2f signals. The 2fsignal is proportional to average laser power, sonormalizing 2fby Of eliminates the effects of transmit-ted laser-power fluctuations. It also accounts forabsolute detector sensitivity so that the normalized 2fsignals from the three beams may be directly com-pared. In addition, calculations indicate that thedeviations from linearity of the calibration curve atfinite sample absorbance are an order of magnitudesmaller for the normalized 2f signal compared withthe direct 2f signal.
Within all optical systems there is a certain amountof reflected, diffracted, and scattered light that inter-acts with the primary beam to form interferencefringes. Several approaches involving mechanical"dithering" of optical components have been em-ployed to address this problem.22 23 ATLAS incorpo-rates a method developed by Reid et al. 1224 that usesan asynchronous dither modulation of the laser wave-length to suppress the dominant fringe pattern byaveraging over an integral number of fringes. Be-cause the fringe frequency is only a function of thefixed physical spacing of the scattering optical ele-ments, the dominant fringe can be identified and theproper dither amplitude set to minimize the domi-nant interference fringe signal.
The finite path length of the laser beam outside thesampling volume contributes to the sample-channelsignal. To compensate for this effect, we employ azero beam whose path length is identical with theportion of the sample beam that is outside thesampling volume. Subtracting the normalized zero-beam 2f signal from the sample-beam 2f signal yieldsan effective sample-volume-only signal. This tech-nique, first developed for the DACOM instruments 2
proved useful for CO detection during the STEPmission, because the CO mixing ratio inside theoptical compartment was often an order of magnitudelarger than in the sampling volume. Under detectornoise-limited conditions, however, this background-correction technique actually adds noise to the finalsignal. For N2O operation, where there is no air-craft contamination of the optical compartment asthere was for CO, this technique was not used.
The reference cell beam, which is used for line-locking the laser, is also used to generate the primarycalibration. The 2f signal produced by a laser beampassing through a gas sample is a function of severalparameters: laser frequency, the amplitudes of boththe main and dither modulations, average beampower, pressure- and temperature-dependent molecu-lar absorption parameters, path length, and absorb-ing gas mixing ratio. Both the sample and referencegases are probed by laser beams with identical fre-quency and modulation characteristics, both gasesare maintained at a common temperature and pres-sure, and both gases always have an absorbance << 1,so the only factors not common to the normalized 2fsample and reference signals are the path length andabsorber mixing ratio. Because both path lengthsare known, as is the mixing ratio in the reference cell,
the absorber mixing ratio of the sample can beobtained directly from the ratio of the normalizedsample signal to reference signal. The validity ofthis technique has been checked experimentally andis discussed in Section 4. This method of calibrationdepends on using an accurately known calibration gasin the reference cell.25 For N20, the working refer-ence gas is cross calibrated with a standard referencematerial from the National Institute for Standardsand Technology, as described in Section 4.
A secondary method using standard gas addition26
has been incorporated as a redundant calibration andto test for absorber gas loss in the air intake andheater system. The reference cell system provides aknown mass flow of calibration gas, which can beperiodically injected into the sampling inlet, produc-ing a step increase in the sample signal. The effec-tive mixing ratio of the addition is calculated from themeasured flows of the reference gas and the main airflow.
3. Instrument Hardware
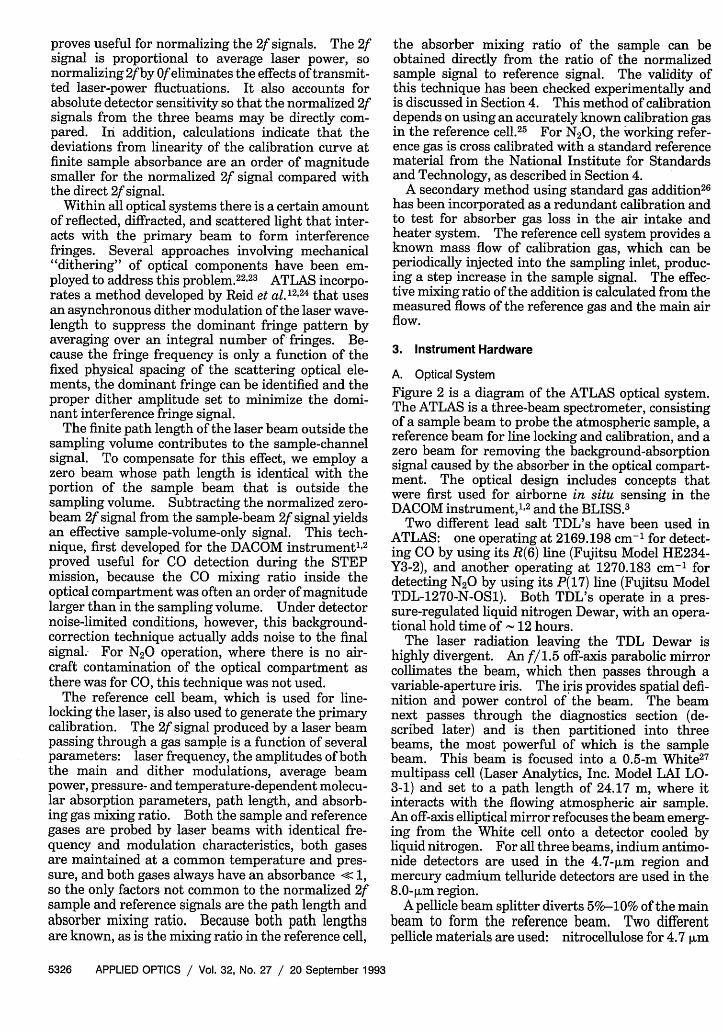
A. Optical SystemFigure 2 is a diagram of the ATLAS optical system.The ATLAS is a three-beam spectrometer, consistingof a sample beam to probe the atmospheric sample, areference beam for line locking and calibration, and azero beam for removing the background-absorptionsignal caused by the absorber in the optical compart-ment. The optical design includes concepts thatwere first used for airborne in situ sensing in theDACOM instrument,"2 and the BLISS.3
Two different lead salt TDL's have been used inATLAS: one operating at 2169.198 cm-' for detect-ing CO by using its R(6) line (Fujitsu Model HE234-Y3-2), and another operating at 1270.183 cm-' fordetecting N2O by using its P(17) line (Fujitsu ModelTDL-1270-N-OS1). Both TDL's operate in a pres-sure-regulated liquid nitrogen Dewar, with an opera-tional hold time of - 12 hours.
The laser radiation leaving the TDL Dewar ishighly divergent. An f/1.5 off-axis parabolic mirrorcollimates the beam, which then passes through avariable-aperture iris. The iris provides spatial defi-nition and power control of the beam. The beamnext passes through the diagnostics section (de-scribed later) and is then partitioned into threebeams, the most powerful of which is the samplebeam. This beam is focused into a 0.5-m White27
multipass cell (Laser Analytics, Inc. Model LAI LO-3-1) and set to a path length of 24.17 m, where itinteracts with the flowing atmospheric air sample.An off-axis elliptical mirror refocuses the beam emerg-ing from the White cell onto a detector cooled byliquid nitrogen. For all three beams, indium antimo-nide detectors are used in the 4.7-pLm region andmercury cadmium telluride detectors are used in the8.0-pm region.
A pellicle beam splitter diverts 5%-10% of the mainbeam to form the reference beam. Two differentpellicle materials are used: nitrocellulose for 4.7 pm
Fig. 2. Optical system layout of the ATLAS. The laser beam is collimated by mirror MI, focused into the sample cell by mirror M2, andfocused onto the detectors by mirrors M3, M4, and M5. The sample, reference, and zero beams are detected by detector (Det) S, R, and Z,respectively. The bidirectional alignment beam is formed by the He-Ne laser and beam splitter (BS) 3. The beam is optionally passedthrough the mode-selecting monochromator by placing the mode-selecting transfer optics (MSTO) in the beam path.
and polystyrene for 8.0 pum. This reference beampasses through a 6.52-cm cell containing calibrationgas that is maintained at the same temperature andpressure as the White cell. After leaving this cell,the beam is focused onto the same type of infrareddetector as is used for the sample beam.
The zero beam is created and detected in the sameway as the reference beam. This beam is designed insuch a way that the total path length from laser todetector equals the path length of the portion of thesample beam that is external to the White cell. Thisarrangement was first developed for DACOM.' 2
The diagnostics section of the instrument, posi-tioned between the iris and the beam-splitter section,consists of an optional mode-selection monochroma-tor and a visible alignment system. All lasers arecharacterized in the laboratory with a 32-cm Czerny-Turner monochromator to establish that at least 98%of the laser energy resides in a single mode and tomeasure the main mode frequency as a function oftemperature and current. A 15-cm monochromator(Laser Analytics, Inc. Model LAI 5155) can be in-serted into the main beam to isolate a single mode of amultimode laser, if required. Aligning the infraredsystem is accomplished with the collimated beamfrom a He-Ne laser.
B. Electronic System
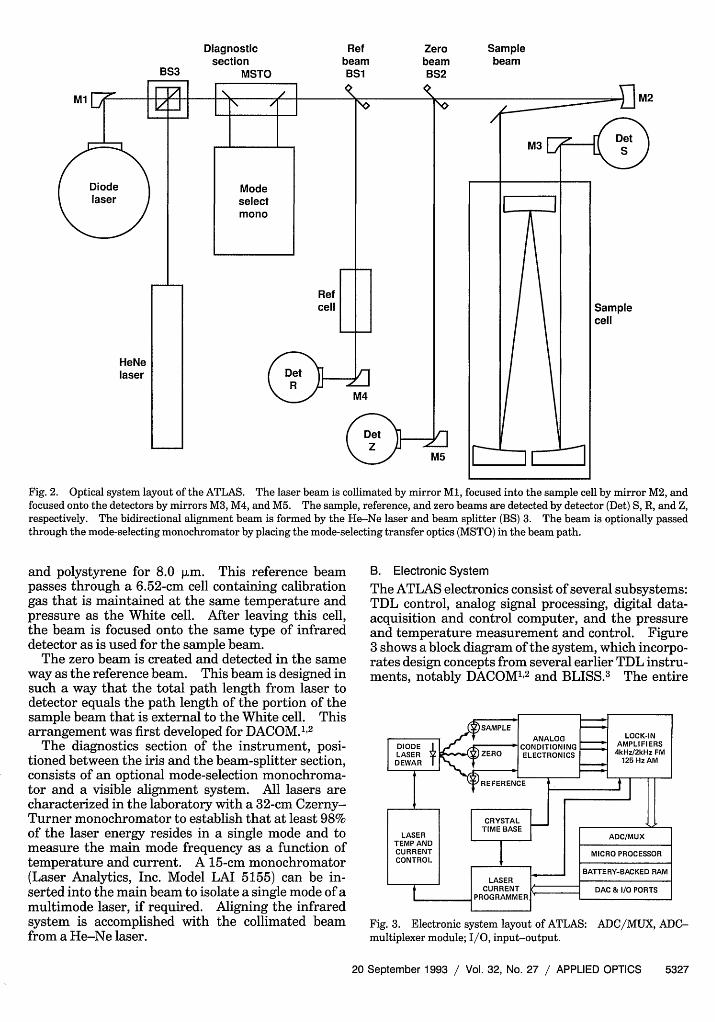
The ATLAS electronics consist of several subsystems:TDL control, analog signal processing, digital data-acquisition and control computer, and the pressureand temperature measurement and control. Figure3 shows a block diagram of the system, which incorpo-rates design concepts from several earlier TDL instru-ments, notably DACOM" 2 and BLISS.3 The entire
I I I ~LASER IICURRENT DAC & /O PORTSI
Fig. 3. Electronic system layout of ATLAS: ADC/MUX, ADC-multiplexer module; I/O, input-output.
electronic system is contained in an enclosure main-tained at 1-atm pressure with dry air to ensureadequate heat dissipation from the electronic compo-nents and to prevent moisture condensation on thecircuit boards.
The great advantage of the TDL is its wavelengthtunability, accomplished by varying the junction tem-perature and injection current. The junction temper-ature is determined during ground operation andremains fixed during a flight operation. Laser-junction temperature is regulated by the cryogenictemperature stabilizer (CTS) system (modified Spec-tra Physics Model SP5720). The CTS employs aproportional plus integral feedback control scheme,which holds the temperature within 0.01 K of theset point.
Laser-injection current is supplied by a laser-current module (modified Spectra Physics ModelSP5820). Once the laser temperature is set, thelaser current is adjusted until the laser wavelengthcorresponds to the center of the selected absorptionline. A voltage input to the laser-current module(LCM) permits programming of the laser currentabout this current set point.
Eight signals are combined to program the lasercurrent. Two digital-to-analog converter (DAC) out-puts go to the LCM to adjust the laser current over acoarse and a fine range under computer control.The third signal is a 2-kHz constant amplitude,synthesized sine wave that is fed through a multiply-ing DAC to the LCM to provide the required wave-length modulation for harmonic detection. The con-verter permits the computer firmware to adjust the2-kHz modulation amplitude to optimize detectionconditions (i.e., adjusts v 2.2 -yv). All modula-tions, except the dither, are harmonics or subharmon-ics of this frequency. The fourth signal is 125-Hztriangle wave, which is used during instrument setupon the ground to scan the laser rapidly to find theabsorption-line and laser-mode breaks and to observethe shape of the baseline. The fifth signal is a12.8-kHz triangle-wave dither modulation to thelaser current for suppressing interference fringe ef-fects. 224 The sixth laser-current programming sig-nal is a gate pulse with a duration of 125 ps, occurringat the fundamental waveform-pattern frequency of125 Hz, that turns off the laser so that the detectorzero can be measured. The seventh signal is acompensation pulse that occurs immediately follow-ing each gate pulse. This pulse is adjusted to providea pulse of heating comparable with the heating thatwould have occurred had the laser not been gated off.This adjustment speeds thermal recovery of the laserjunction. Finally, the eighth signal to the LCM isthe feedback signal from the first-harmonic detectorof the reference channel, controlled by the computersystem, which locks the laser frequency to the centerof an absorption line.
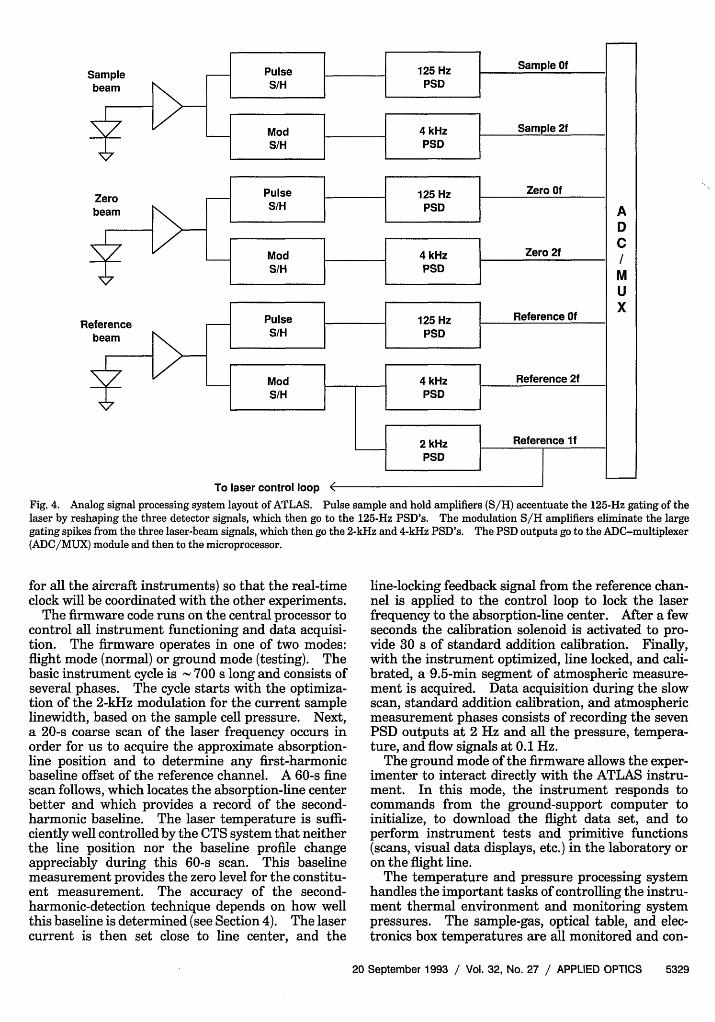
A diagram of the analog signal processing system isshown in Fig. 4. In flight mode, the combination ofthe gate pulses, compensation pulses, and the 2-kHz
and 12.8-kHz modulations produces a complex-amplitude waveform with a fundamental patternfrequency of 125 Hz coming from the infrared beamdetectors. For each of the three beam detectors, awaveform processor consisting of two sample andhold amplifiers is employed. The pulse sample andhold takes the detector zero signal obtained while thelaser is pulsed off and holds it out for one half of a125-Hz cycle, and then passes the laser-on signal forthe other half-cycle to produce a 50% duty-cyclewaveform. The Of lock in processes this waveform toproduce a signal proportional to the average laserpower. The modulation sample and hold takes thedetector signal from just prior to the gate pulse andholds it over the next half-cycle of the 125-Hz pattern,effectively removing the large spikes that occur be-cause of the gate and compensation pulses. For theother half-cycle the circuit passes the small amplitudemodulations at 2 and 4 kHz to the f and 2f lock-inamplifiers for processing.
The next step in the analog signal processingsystem is the lock-in amplifier section. This sectionhas seven independent phase-sensitive detectors(PSD's, Evans Electronics Model 4110), and threeindependent phase-control units (PCU's, Evans Elec-tronics Model 4114) that drive the PSD's. The firstPCU is referenced to the 125-Hz pattern frequency,as defined by the gate pulses. It provides a phase-shifted reference waveform to the three PSD's thatmeasure the average laser power in each of the threeoptical channels of the instrument. The secondPCU is driven by the 2-kHz sine-wave modulation,and it provides the appropriately phase-shifted refer-ence waveform for the PSD that measures the first-harmonic component of the reference beam. This ifsignal is used for line-locking the laser. The thirdPCU is driven by the second harmonic of the 2-kHzmain modulation, and it provides the reference wave-form to the three PSD's that measure the second-harmonic components of the three optical channels.The output signals from the seven PSD's feed to amultiplexer-analog-to-digital converter module onthe instrument computer, and they are each sampledat a 2-Hz rate. In addition, the first-harmonic signalfrom the reference channel goes through a computer-controlled analog switch to the LCM system forline-locking the laser.
Central control of the electronic system is providedby the microprocessor system. The prime module isa single-board Multibus computer (Intel Model iSBC86/30), equipped with analog-to-digital converter(ADC) and DAC piggyback boards. Primary datastorage occurs on a 1-megabyte battery-backed RAMboard. A real-time clock board permits the systemto enter time markers in the data stream and thussynchronize the ATLAS measurements with thosefrom other instruments. Finally, a custom input-output board integrates several interface functionsbetween the analog and digital parts of the electronicsystem. This board reads the geosynchronous oper-ational environment satellite clock (the central clock
Fig. 4. Analog signal processing system layout of ATLAS. Pulse sample and hold amplifiers (S/H) accentuate the 125-Hz gating of thelaser by reshaping the three detector signals, which then go to the 125-Hz PSD's. The modulation S/H amplifiers eliminate the largegating spikes from the three laser-beam signals, which then go the 2-kHz and 4-kHz PSD's. The PSD outputs go to the ADO-multiplexer(ADC/MUX) module and then to the microprocessor.
for all the aircraft instruments) so that the real-timeclock will be coordinated with the other experiments.
The firmware code runs on the central processor tocontrol all instrument functioning and data acquisi-tion. The firmware operates in one of two modes:flight mode (normal) or ground mode (testing). Thebasic instrument cycle is 700 s long and consists ofseveral phases. The cycle starts with the optimiza-tion of the 2-kHz modulation for the current samplelinewidth, based on the sample cell pressure. Next,a 20-s coarse scan of the laser frequency occurs inorder for us to acquire the approximate absorption-line position and to determine any first-harmonicbaseline offset of the reference channel. A 60-s finescan follows, which locates the absorption-line centerbetter and which provides a record of the second-harmonic baseline. The laser temperature is suffi-ciently well controlled by the CTS system that neitherthe line position nor the baseline profile changeappreciably during this 60-s scan. This baselinemeasurement provides the zero level for the constitu-ent measurement. The accuracy of the second-harmonic-detection technique depends on how wellthis baseline is determined (see Section 4). The lasercurrent is then set close to line center, and the
line-locking feedback signal from the reference chan-nel is applied to the control loop to lock the laserfrequency to the absorption-line center. After a fewseconds the calibration solenoid is activated to pro-vide 30 s of standard addition calibration. Finally,with the instrument optimized, line locked, and cali-brated, a 9.5-min segment of atmospheric measure-ment is acquired. Data acquisition during the slowscan, standard addition calibration, and atmosphericmeasurement phases consists of recording the sevenPSD outputs at 2 Hz and all the pressure, tempera-ture, and flow signals at 0.1 Hz.
The ground mode of the firmware allows the exper-imenter to interact directly with the ATLAS instru-ment. In this mode, the instrument responds tocommands from the ground-support computer toinitialize, to download the flight data set, and toperform instrument tests and primitive functions(scans, visual data displays, etc.) in the laboratory oron the flight line.
The temperature and pressure processing systemhandles the important tasks of controlling the instru-ment thermal environment and monitoring systempressures. The sample-gas, optical table, and elec-tronics box temperatures are all monitored and con-
trolled by this system. The microprocessor chip andWhite cell atmospheric sample-gas temperatures arealso monitored. Three pressures transducers (Rose-mount Model 1332A) monitor the White cell, refer-ence cell, and calibration-gas pressures. All the con-ditioned temperature and pressure signals are sent tothe processor system for recording.
C. Calibration-Flow System
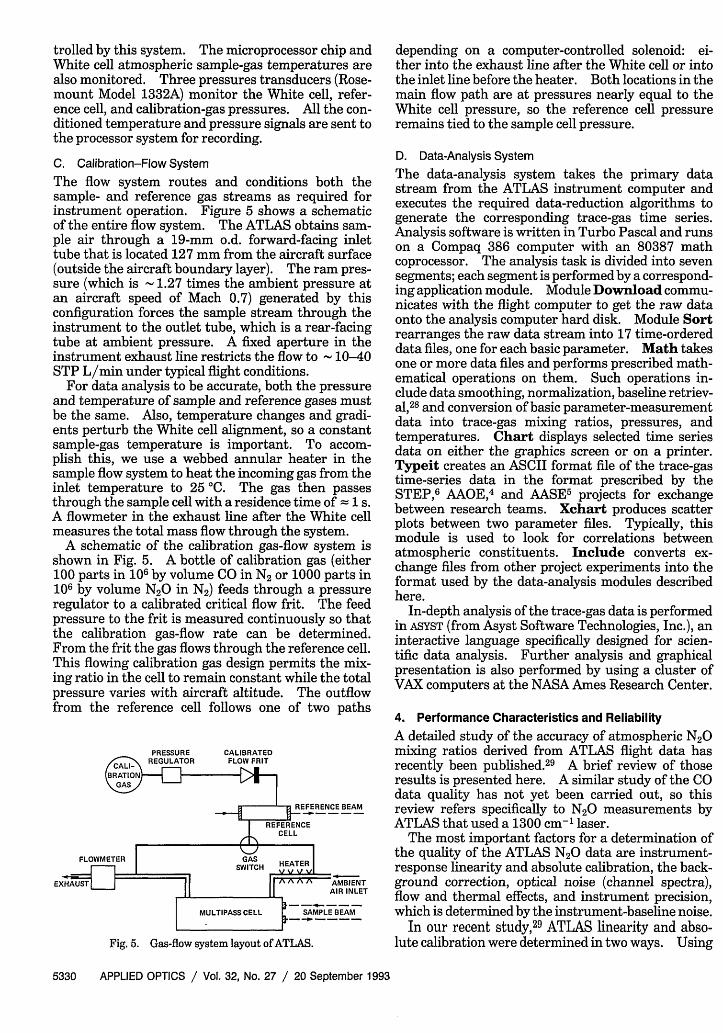
The flow system routes and conditions both thesample- and reference gas streams as required forinstrument operation. Figure 5 shows a schematicof the entire flow system. The ATLAS obtains sam-ple air through a 19-mm o.d. forward-facing inlettube that is located 127 mm from the aircraft surface(outside the aircraft boundary layer). The ram pres-sure (which is 1.27 times the ambient pressure atan aircraft speed of Mach 0.7) generated by thisconfiguration forces the sample stream through theinstrument to the outlet tube, which is a rear-facingtube at ambient pressure. A fixed aperture in theinstrument exhaust line restricts the flow to 10-40STP L/min under typical flight conditions.
For data analysis to be accurate, both the pressureand temperature of sample and reference gases mustbe the same. Also, temperature changes and gradi-ents perturb the White cell alignment, so a constantsample-gas temperature is important. To accom-plish this, we use a webbed annular heater in thesample flow system to heat the incoming gas from theinlet temperature to 25 'C. The gas then passesthrough the sample cell with a residence time of 1 s.A flowmeter in the exhaust line after the White cellmeasures the total mass flow through the system.
A schematic of the calibration gas-flow system isshown in Fig. 5. A bottle of calibration gas (either100 parts in 106 by volume CO in N2 or 1000 parts in106 by volume N20 in N2) feeds through a pressureregulator to a calibrated critical flow frit. The feedpressure to the frit is measured continuously so thatthe calibration gas-flow rate can be determined.From the frit the gas flows through the reference cell.This flowing calibration gas design permits the mix-ing ratio in the cell to remain constant while the totalpressure varies with aircraft altitude. The outflowfrom the reference cell follows one of two paths
Fig. 5. Gas-flow system layout of ATLAS.
depending on a computer-controlled solenoid: ei-ther into the exhaust line after the White cell or intothe inlet line before the heater. Both locations in themain flow path are at pressures nearly equal to theWhite cell pressure, so the reference cell pressureremains tied to the sample cell pressure.
D. Data-Analysis SystemThe data-analysis system takes the primary datastream from the ATLAS instrument computer andexecutes the required data-reduction algorithms togenerate the corresponding trace-gas time series.Analysis software is written in Turbo Pascal and runson a Compaq 386 computer with an 80387 mathcoprocessor. The analysis task is divided into sevensegments; each segment is performed by a correspond-ing application module. Module Download commu-nicates with the flight computer to get the raw dataonto the analysis computer hard disk. Module Sortrearranges the raw data stream into 17 time-ordereddata files, one for each basic parameter. Math takesone or more data files and performs prescribed math-ematical operations on them. Such operations in-clude data smoothing, normalization, baseline retriev-al,28 and conversion of basic parameter-measurementdata into trace-gas mixing ratios, pressures, andtemperatures. Chart displays selected time seriesdata on either the graphics screen or on a printer.Typeit creates an ASCII format file of the trace-gastime-series data in the format prescribed by theSTEP,6 AAOE,4 and AASE5 projects for exchangebetween research teams. Xchart produces scatterplots between two parameter files. Typically, thismodule is used to look for correlations betweenatmospheric constituents. Include converts ex-change files from other project experiments into theformat used by the data-analysis modules describedhere.
In-depth analysis of the trace-gas data is performedin ASYST (from Asyst Software Technologies, Inc.), aninteractive language specifically designed for scien-tific data analysis. Further analysis and graphicalpresentation is also performed by using a cluster ofVAX computers at the NASA Ames Research Center.
4. Performance Characteristics and ReliabilityA detailed study of the accuracy of atmospheric N20mixing ratios derived from ATLAS flight data hasrecently been published.29 A brief review of thoseresults is presented here. A similar study of the COdata quality has not yet been carried out, so thisreview refers specifically to N20 measurements byATLAS that used a 1300 cm-' laser.
The most important factors for a determination ofthe quality of the ATLAS N 20 data are instrument-response linearity and absolute calibration, the back-ground correction, optical noise (channel spectra),flow and thermal effects, and instrument precision,which is determined by the instrument-baseline noise.
In our recent study,29 ATLAS linearity and abso-lute calibration were determined in two ways. Using
flow dilution of ambient air (307 ppbv)30 with areliable zero gas (LN2 gas boiloff, which showed a zeroresponse in the ATLAS instrument), we demon-strated instrument linearity between zero and 307ppbv N20. Absolute calibration was established byusing a National Institute of Technology and Stan-dards standard (301 ± 3 ppbv). These results leadto an estimate of ± 1.2% 2-sigma accuracy for theATLAS retrievals. A second independent calibra-tion made use of four commercial N20 cylinders withmixing ratios, in air, ranging from 50 to 300 ppbv.These cylinders had been assayed at the ScrippsInstitution of Oceanography.2 9 The results of thiscomparison are shown in Fig. 6. This technique alsogave a N20 retrieval accuracy of ± 1.2% (2 sigma).
Instrument precision is deduced from flight-measurement records (see Figs. 7 and 8). The rmsnoise of these records leads to an estimate of ± 1.5%for the average precision of the flight data.
Air flow and thermal effects on the flight data havebeen estimated from a series of laboratory simula-tions of the varying conditions normally encounteredin a field experiment. 29 A maximum of ± 1.5% uncer-tainty arises independently from each of these param-eter variations.
The remaining sources of uncertainty, and thelargest ones, are the optical noise and the N20background correction. Optical noise in the form ofchannel spectra (interference fringes) appears in thedata record when the laser frequency is scanned.The channel spectra are thermally sensitive and driftthrough the data record, producing an effective opti-cal noise even when the laser is line locked. Themagnitude of this noise can be estimated from theflight record by examining the residuals of second-harmonic line fits carried out in the data analysis.29
350
300
250
00
0.
1 200 Ma
S-150_/
100_ r
50
/ I I i I I I I0 50 100 150 200 250 300 350
N20 (Scripps) (ppbv)Fig. 6. Intercomparison results between the ATLAS and theScripps Institution of Oceanography for four master gas samples ofN20 in air.
2500 r
.00.
0
500
300
c.0
0.01z
200
(a) I
rb~~~>vjPlI~
!1I ~~~V
(b I I I%/\
11:30 12:00 12:30 13:00Time (GMT)
Fig. 7. ATLAS N20 and National Oceanic and AtmosphericAdministration 03 data for a segment of an AASE flight taken on25 January 1989. Note the strong anticorrelation between thesetwo constituents during this portion of the flight. GMT, Green-wich Mean Time.
An analysis of these residuals for several flights of theATLAS led to an estimated 2-sigma error caused bythe optical noise of ± 8%.
Finally, a background-correction uncertainty of+6% must be included in the data analysis. Thecause of this rather large error detailed in Ref. 29 isthe limited signal-to-noise ratio available from theN20 zero channel in the current instrument configu-ration. The resultant uncertainty of N20 retrievalsfrom ATLAS measurements in the current configura-tion of the instrument is ± 10% (2 sigma); this resultis the root-sum square of the individual errors dis-cussed above.
The ATLAS instrument has a long record of success-ful flights that have returned high-quality N20 data.As part of the STEP,6 AAOE,4 and AASE5 fieldcampaigns, we carried out 53 successful data flights.No failure of the ATLAS instrument has occurred onany campaign data flight. Numerous published pa-pers have employed the ATLAS N20 data sets.Significant portions of our N20 data can be found inRefs. 31-33. The correlation of N20 with otherspecies contains important information about thechemical state of the sampled atmosphere. Represen-tative data segments obtained during the AASEcampaign are presented in Figs. 7 and 8. The natureand significance of these correlations have recentlybeen explored in two papers examining the observedN2O-NOY relationship outside the polar vortex34 andthe implications of the N20-0 3 correlation observedboth inside and outside the Arctic vortex.35
The authors acknowledge the ATLAS design andconstruction staff for their outstanding work. J.Eilers was the lead instrument engineer and mechan-ical engineer and C. Currey was chief electricalengineer. R. Hedlund provided consistent electrical
(b)Fig. 8. ATLAS N20 and National Oceanic and AtmosphericAdministration NOY data for a segment of an AASE flight taken on12 January 1989: (a) the times series shows the variation of N20and NOY observed as the aircraft entered the polar vortex. (b) Thescatter plot of the same data shows the strong anticorrelationbetween N20 and NOY in this region of the atmosphere. GMT,Greenwich Mean Time.
engineering support throughout the design, construc-tion, and deployment phases. Scientific support,testing, and calibration were provided by T. Black-burn and S. Strahan.
References1. G. W. Sachse, G. F. Hill, L. 0. Wade, and E. P. Condon,
"DACOM-A rapid, high sensitivity airborne carbon monox-ide monitor," in Proceedings of the Fourth Joint Conference onSensing of Environmental Pollutants, H. G. Stewart, ed.(American Chemical Society, Washington, D.C., 1977), pp.590-593.
2. G. W. Sachse, G. F. Hill, L. 0. Wade, and M. G. Perry,"Fast-response, high-precision carbon monoxide sensor usinga tunable diode laser absorption technique," J. Geophys. Res.92, 2071-2081 (1987).
3. R. T. Menzies, C. R. Webster, and E. D. Hinkley, "Balloon-borne diode-laser absorption spectrometer for measurementsof stratospheric trace species," Appl. Opt. 22, 2655-2664(1983).
4. A. F. Tuck, R. T. Watson, E. P. Condon, J. J. Margitan, and0. B. Toon, "The planning and execution of ER-2 and DC-8aircraft flights over Antarctica, August and September 1987,"J. Geophys. Res. 94, 11,181-11,222 (1989).
5. R. Turco, A. Plumb, and E. Condon, "The Airborne ArcticStratospheric Expedition: prologue," Geophys. Res. Lett. 17,317-320 (1990).
6. P. B. Russell, L. Pfister, and H. B. Selkirk, "The tropicalexperiment of the Stratosphere-Troposphere Exchange Project(STEP): science objectives, operations, and summary of re-sults" J. Geophys. Res. (to be published).
7. R. T. Ku, E. D. Hinkley, and J. 0. Sample, "Long-pathmonitoring of atmospheric carbon monoxide with a tunablediode laser system," Appl. Opt. 14, 854-861 (1975).
8. E. D. Hinkley, R. T. Ku, and P. L. Kelley, "Techniques fordetection of molecular pollutants by absorption of laser radia-tion," in Laser Monitoring of the Atmosphere, E. D. Hinkley,ed. (Springer, New York 1976), Chap. 6.
9. J. Reid, J. Shewchun, B. K. Garside, and E. A. Ballik, "Highsensitivity pollution detection employing tunable diode la-sers," Appl. Opt. 17, 300-307 (1978).
10. J. Reid and D. Labrie, "Second-harmonic detection withtunable diode lasers-comparison of experiment and theory,"Appl. Phys. B 26,203-210 (1981).
11. J. Reid, B. K. Garside, J. Shewchun, M. El-Sherbiny, and E. A.Ballik, "High sensitivity point monitoring of atmosphericgases employing tunable diode lasers," Appl. Opt. 17, 1806-1810 (1978).
12. J. Reid, M. El-Sherbiny, B. K. Garside, and E. A. Ballik,"Sensitivity limits of a tunable diode laser spectrometer, withapplication to the detection of NO2 at the 100-ppt level," Appl.Opt. 19, 3349-3354 (1980).
13. D. T. Cassidy and J. Reid, "Atmospheric pressure monitoringof trace gases using tunable diode lasers," Appl. Opt. 21,1185-1190 (1982).
14. C. R. Webster and R. T. Menzies, "In-situ measurement ofstratospheric nitric oxide using a balloon-borne tunable diodelaser spectrometer," Appl. Opt. 23, 1140-1142 (1984).
15. C. R. Webster and R. D. May, "Simultaneous in-situ measure-ments and diurnal variations of NO, NO2, 03, NO2, CH4, H20,and CO2 in the 40- to 26-km region using an open path tunablediode laser spectrometer," J. Geophys. Res. 92, 11,931-11,950(1987).
16. R. D. May and C. R. Webster, "In-situ stratospheric measure-ments of HNO3 and HCI near 30 km using the balloon-bornelaser in-situ sensor tunable diode laser spectrometer," J.Geophys. Res. 94, 16,343-16,350 (1989).
17. D. R. Hastie, G. I. Mackay, T. Iguchi, B. A. Ridley, and H. I.Schiff, "Tunable diode laser systems for measuring trace gasesin tropospheric air," Environ. Sci. Technol. 17, 352A-364A(1983); erratum 17, 510A (1983).
18. D. R. Hastie and M. D. Miller, "Balloon-borne tunable diodelaser absorption spectrometer for multispecies trace gas mea-surements in the stratosphere," Appl. Opt. 24, 3694-3701(1985).
19. G. C. Toon, C. B. Farmer, L. L. Lowes, P. W. Schaper, J.-F.Blavier, and R. H. Norton, "Infrared aircraft measurements ofstratospheric composition over Antarctica during September1987," J. Geophys. Res. 94, 16,571-16,596 (1989), and refer-ences therein.
20. W. G. Mankin, M. T. Coffey, A. Goldman, M. R. Schoeberl,L. R. Lait, and P. A. Newman, "Airborne measurements ofstratospheric constituents over the Arctic in the winter of
1989," Geophys. Res. Lett. 17, 473-476 (1990), and referencestherein.
21. R. S. Eng, J. F. Butler, and K. J. Linden, "Tunable diode laserspectroscopy: an invited review," Opt. Eng. 19, 945-960(1980).
22. C. R. Webster, "Brewster-plate spoiler: a novel method forreducing the amplitude of interference fringes that limittunable-laser absorption sensitivities," J. Opt. Soc. Am. B 2,1464-1470 (1985).
23. J. A Silver and A. C. Stanton, "Optical interference fringereduction in laser absorption experiments," Appl. Opt. 27,1914-1916 (1988).
24. D. T. Cassidy and J. Reid, "Harmonic detection with tunablediode lasers-two-tone modulation," Appl. Phys. B 29, 279-285 (1982).
25. A. Fried, R. Sams, and W. W. Berg, "Application of tunablediode laser absorption for trace stratospheric measurements ofHCl: laboratory results," Appl. Opt.23, 1867-1880 (1984).
26. J. A. Mucha, "Standard addition technique for quantitativetrace gas analysis using derivative infrared diode laser spectros-copy," Appl. Spectrosc. 36, 393-400 (1982).
27. J. U. White, "Long optical paths of large aperture," J. Opt.Soc. Am. 32, 285-288 (1942).
28. H. I. Schiff, D. R. Karecki, G. W. Harris, D. R. Hastie, and G. I.Mackay, "A tunable diode laser system for aircraft measure-ments of trace gases," J. Geophys. Res. 95, 10,147-10,153(1990).
29. M. Loewenstein, J. R. Podolske, and S. E. Strahan, "ATLAS
instrument characterization: accuracy of the AASE andAAOE nitrous oxide data sets," Geophys. Res. Lett. 17,481-484(1990).
30. R. F. Weiss, "The temporal and spatial distribution of tropo-spheric nitrous oxide," J. Geophys. Res. 86, 7185-7195 (1981);Scripps Institute of Oceanography, La Jolla, Calif. 92093(personal communication).
31. J. R. Podolske, M. Loewenstein, S. E. Strahan, and K. R. Chan,"Stratospheric nitrous oxide distribution in the southernhemisphere," J. Geophys. Res. 94, 16,767-16,772 (1989).
32. M. Loewenstein, J. R. Podolske, K. R. Chan, and S. E. Strahan,"Nitrous oxide as a dynamical tracer in the 1987 AirborneArtarctic Ozone Experiment," J. Geophys. Res. 94, 11,589-11,598 (1989).
33. S. E. Strahan, M. Loewenstein, J. R. Podolske, W. L. Starr,K. R. Chan, M. H. Proffitt, and K. K. Kelly, "Correlation ofN20 and ozone in the southern polar vortex during theAirborne Antarctic Ozone Experiment," J. Geophys. Res. 94,16,749-16,756 (1989).
34. D. W. Fahey, S. Solomon, S. R. Kawa, M. Loewenstein, J. R.Podolske, S. E. Strahan, and K. R. Chan, "A diagnostic fordenitrification in the winter polar stratospheres," Nature(London) 345, 698-702 (1990).
35. M. H. Proffitt, J. J. Margitan, K. K. Kelly, M. Loewenstein,J. R. Podolske, and K. R. Chan, "Ozone loss in the Arctic polarvortex inferred from high-altitude aircraft measurements,"Nature (London) 347, 31-36 (1990).