43
Airbus Annual Press Conference 13 January 2014 John Leahy Chief Operating Officer, Customers
Airbus Annual Press Conference 13 January 2014
John Leahy
Chief Operating Officer, Customers
© AIRBUS S.A.S. All rights reserved. Confidential and proprietary document.
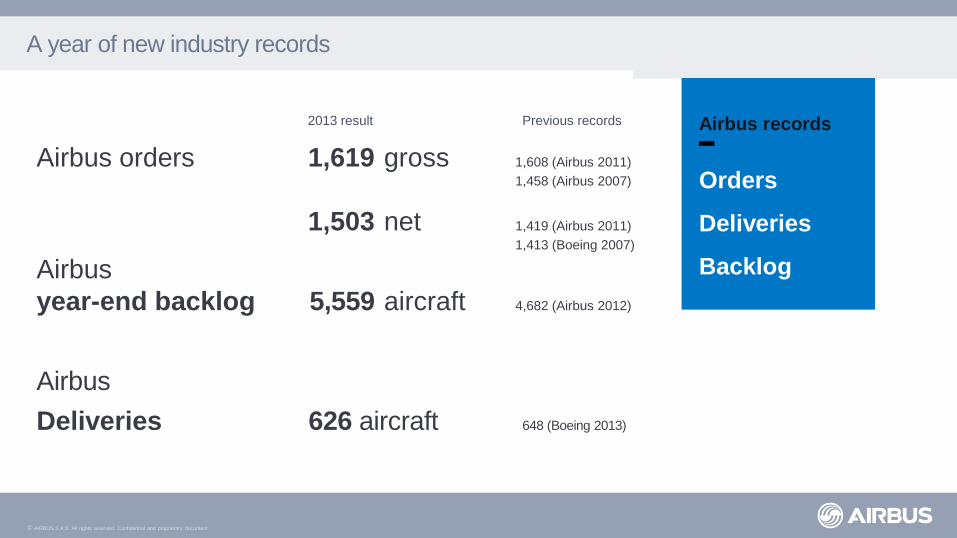
A year of new industry records
Airbus orders 1,619 gross 1,608 (Airbus 2011)
1,458 (Airbus 2007)
1,503 net 1,419 (Airbus 2011)
1,413 (Boeing 2007)
Airbus
year-end backlog 5,559 aircraft 4,682 (Airbus 2012)
Airbus
Deliveries 626 aircraft 648 (Boeing 2013)
Previous records Airbus records
Orders
Deliveries
Backlog
2013 result
© AIRBUS S.A.S. All rights reserved. Confidential and proprietary document.
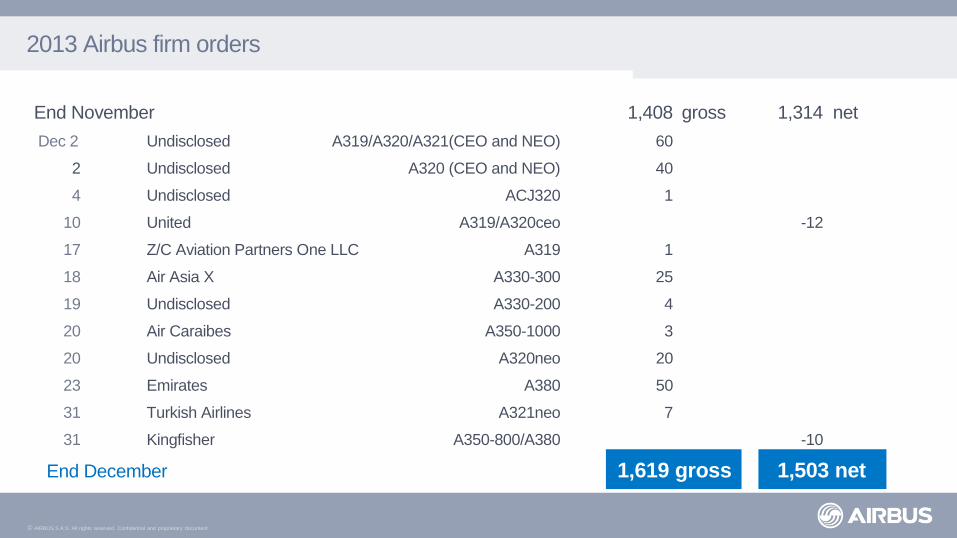
2013 Airbus firm orders
End November 1,408 gross 1,314 net
Dec 2 Undisclosed A319/A320/A321(CEO and NEO) 60
2 Undisclosed A320 (CEO and NEO) 40
4 Undisclosed ACJ320 1
10 United A319/A320ceo -12
17 Z/C Aviation Partners One LLC A319 1
18 Air Asia X A330-300 25
19 Undisclosed A330-200 4
20 Air Caraibes A350-1000 3
20 Undisclosed A320neo 20
23 Emirates A380 50
31 Turkish Airlines A321neo 7
31 Kingfisher A350-800/A380 -10
End December 1,619 gross 1,503 net
© AIRBUS S.A.S. All rights reserved. Confidential and proprietary document.
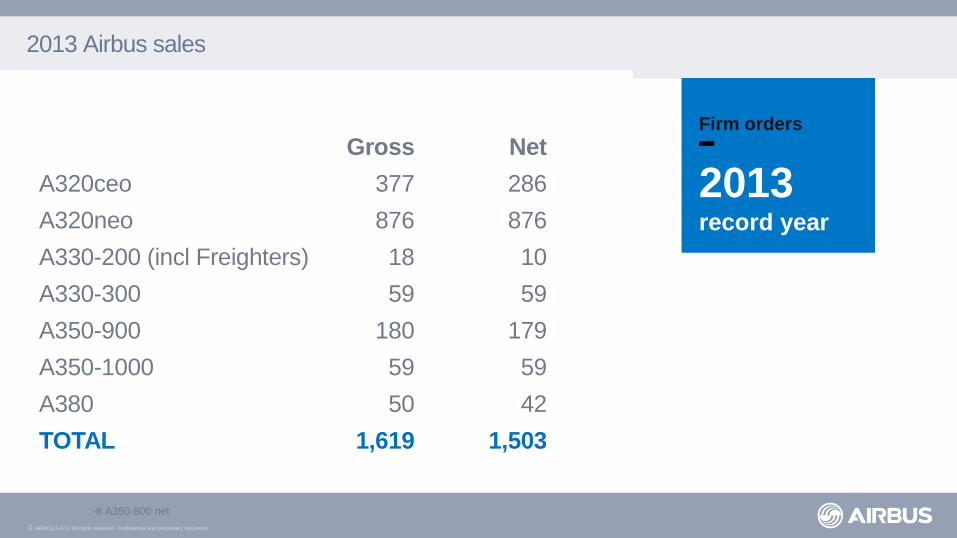
2013 Airbus sales
-8 A350-800 net
Firm orders
2013 record year
Gross Net
A320ceo 377 286
A320neo 876 876
A330-200 (incl Freighters) 18 10
A330-300 59 59
A350-900 180 179
A350-1000 59 59
A380 50 42
TOTAL 1,619 1,503
© AIRBUS S.A.S. All rights reserved. Confidential and proprietary document.
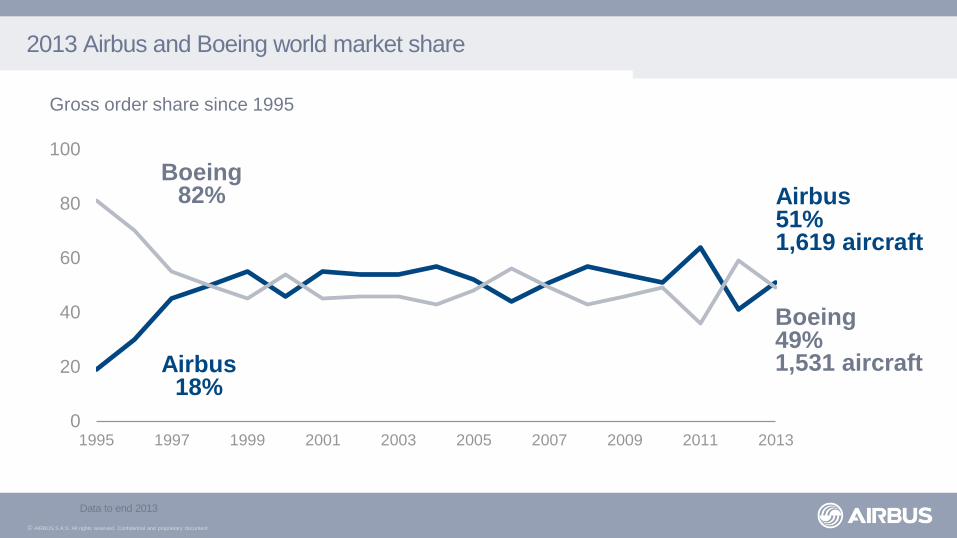
2013 Airbus and Boeing world market share
Data to end 2013
0
20
40
60
80
100
1995 1997 1999 2001 2003 2005 2007 2009 2011 2013
Gross order share since 1995
Boeing 82%
Airbus 18%
Boeing 49% 1,531 aircraft
Airbus 51% 1,619 aircraft
© AIRBUS S.A.S. All rights reserved. Confidential and proprietary document.
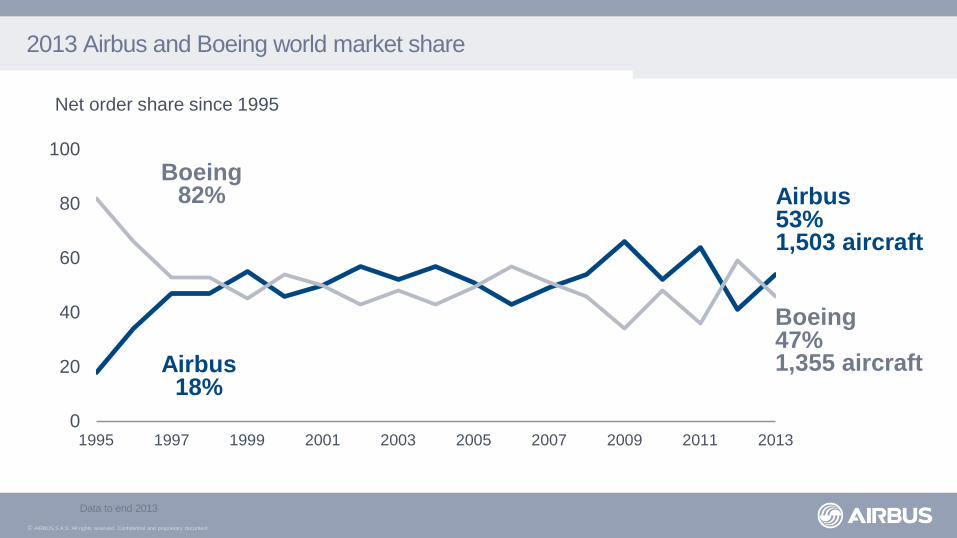
2013 Airbus and Boeing world market share
0
20
40
60
80
100
1995 1997 1999 2001 2003 2005 2007 2009 2011 2013
Net order share since 1995
Boeing 82%
Airbus 18%
Airbus 53% 1,503 aircraft
Boeing 47% 1,355 aircraft
Data to end 2013
© AIRBUS S.A.S. All rights reserved. Confidential and proprietary document.
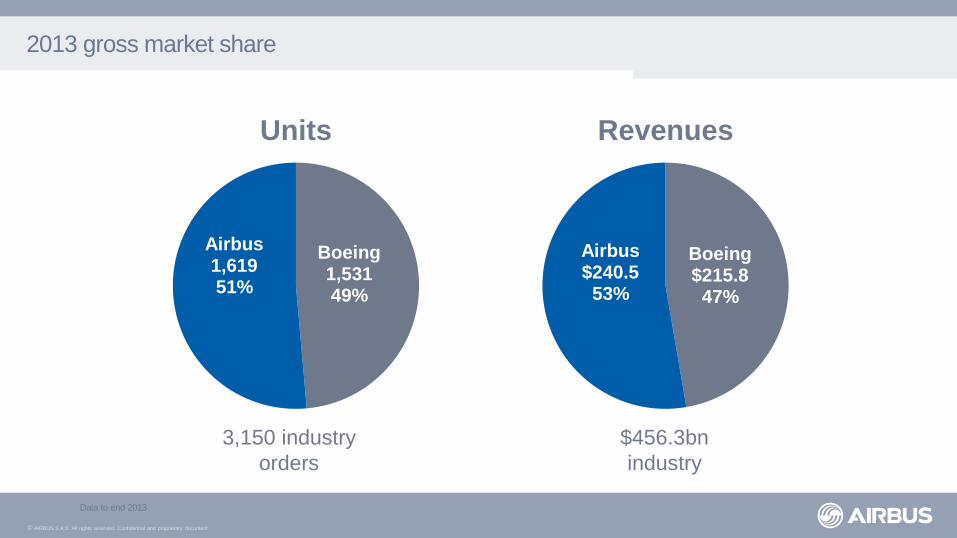
2013 gross market share
Boeing 1,531 49%
Airbus 1,619 51%
Units
Boeing $215.8 47%
Airbus $240.5 53%
Revenues
3,150 industry
orders
$456.3bn
industry
Data to end 2013
© AIRBUS S.A.S. All rights reserved. Confidential and proprietary document.
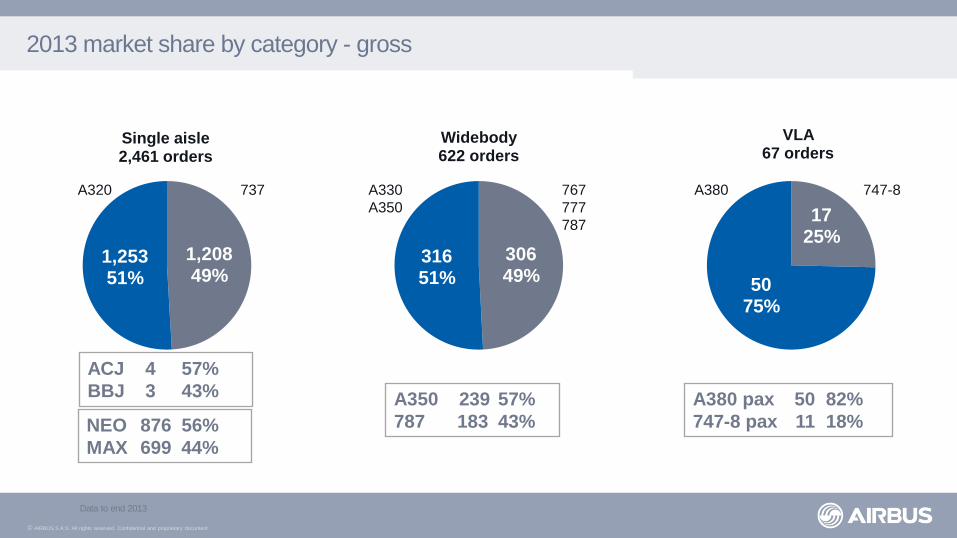
2013 market share by category - gross
1,208 49%
1,253 51%
Single aisle 2,461 orders
A320 737
306 49%
316 51%
Widebody 622 orders
17 25%
50 75%
VLA 67 orders
A330
A350
767
777
787
A380 747-8
ACJ 4 57%
BBJ 3 43% A350 239 57%
787 183 43%
Data to end 2013
NEO 876 56%
MAX 699 44%
A380 pax 50 82%
747-8 pax 11 18%
© AIRBUS S.A.S. All rights reserved. Confidential and proprietary document.
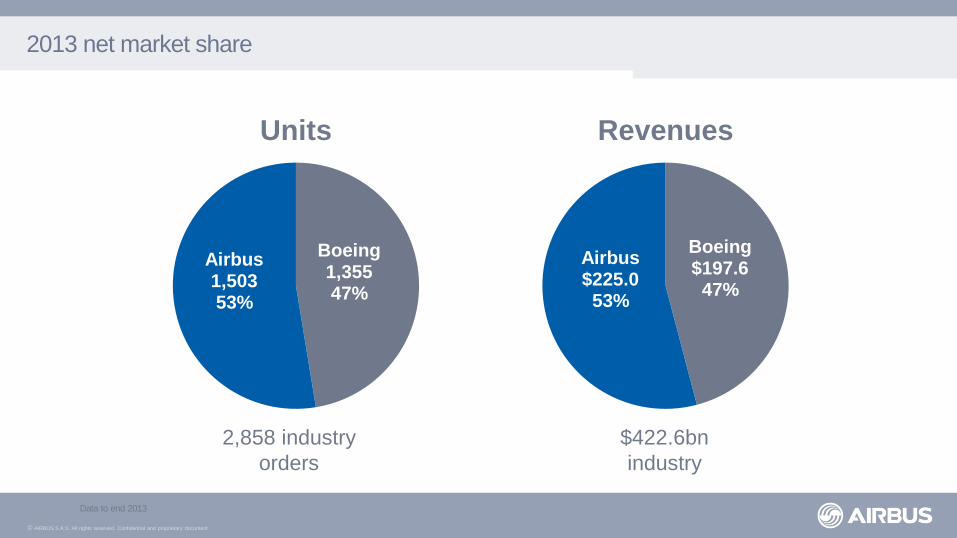
2013 net market share
Boeing 1,355 47%
Airbus 1,503 53%
Units
Boeing $197.6 47%
Airbus $225.0 53%
Revenues
2,858 industry
orders
$422.6bn
industry
Data to end 2013
© AIRBUS S.A.S. All rights reserved. Confidential and proprietary document.
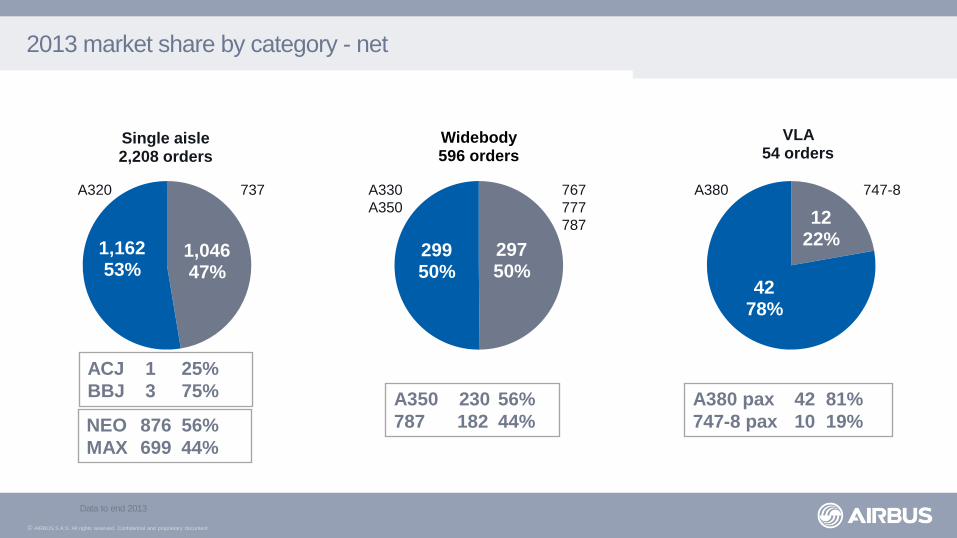
2013 market share by category - net
1,046 47%
1,162 53%
Single aisle 2,208 orders
A320 737
297 50%
299 50%
Widebody 596 orders
12 22%
42 78%
VLA 54 orders
A330
A350
767
777
787
A380 747-8
Data to end 2013
ACJ 1 25%
BBJ 3 75% A350 230 56%
787 182 44% NEO 876 56%
MAX 699 44%
A380 pax 42 81%
747-8 pax 10 19%
© AIRBUS S.A.S. All rights reserved. Confidential and proprietary document.
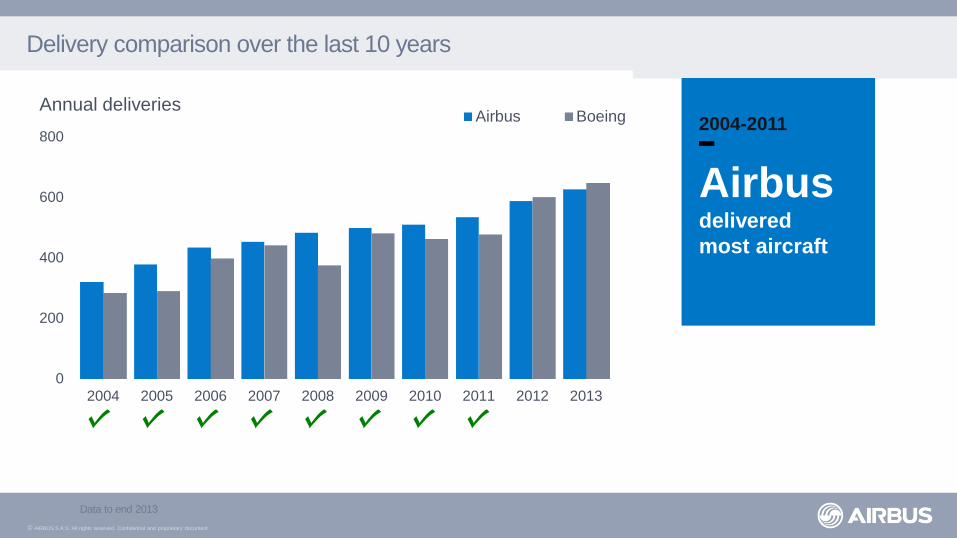
Delivery comparison over the last 10 years
0
200
400
600
800
2004 2005 2006 2007 2008 2009 2010 2011 2012 2013
Airbus BoeingAnnual deliveries
Data to end 2013
2004-2011
Airbus delivered
most aircraft
© AIRBUS S.A.S. All rights reserved. Confidential and proprietary document.
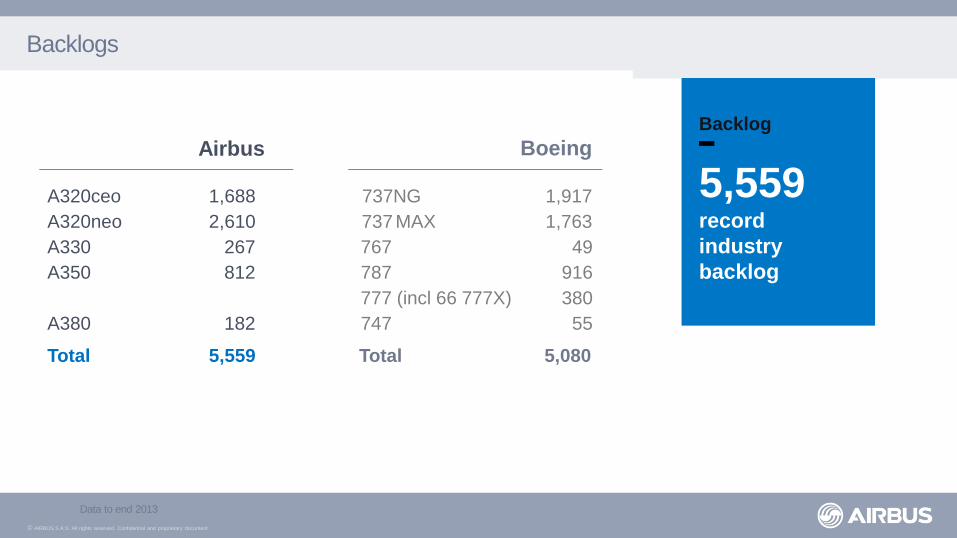
Backlogs
Airbus
A320ceo 1,688
A320neo 2,610
A330 267
A350 812
A380 182
Total 5,559
Boeing
737NG 1,917
737 MAX 1,763
767 49
787 916
777 (incl 66 777X) 380
747 55
Total 5,080
Data to end 2013
Backlog
5,559 record
industry
backlog
© AIRBUS S.A.S. All rights reserved. Confidential and proprietary document.
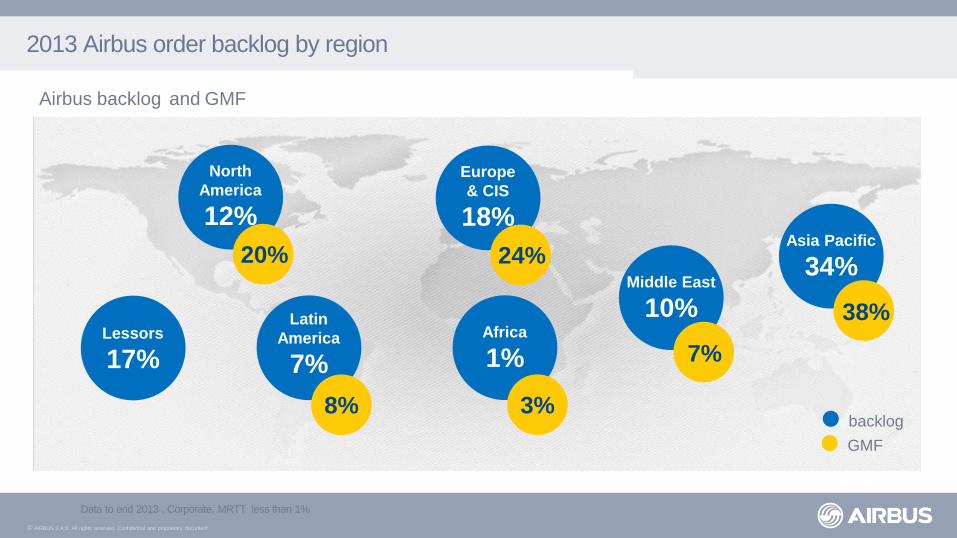
2013 Airbus order backlog by region
Backlog of 5,393 aircraft
Data to end 2013 . Corporate, MRTT less than 1%
Airbus backlog and GMF
Asia Pacific
34%
38%
Middle East
10%
7%
Europe
& CIS
18%
24%
Africa
1%
3%
Latin
America
7%
8%
North
America
12%
20%
Lessors
17%
GMF
backlog
© AIRBUS S.A.S. All rights reserved. Confidential and proprietary document.
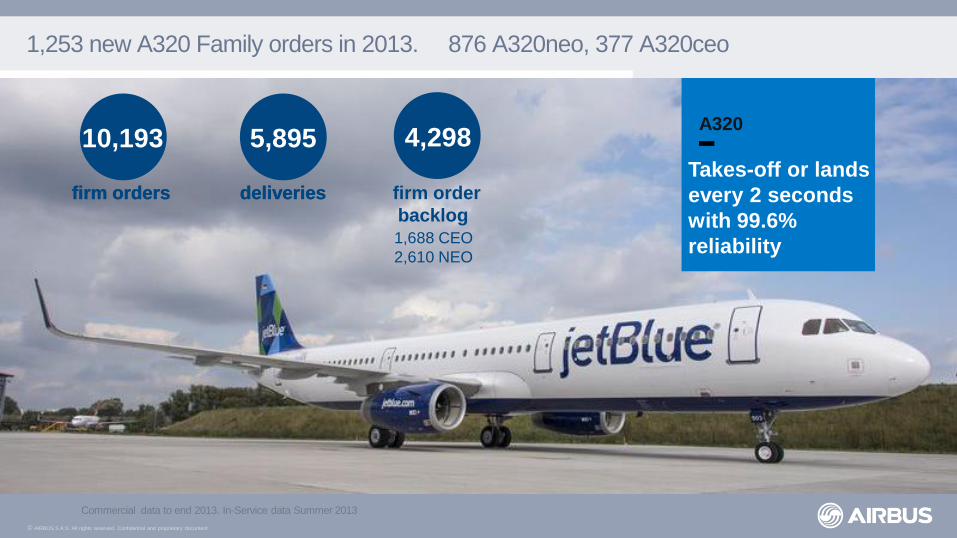
1,253 new A320 Family orders in 2013. 876 A320neo, 377 A320ceo
Commercial data to end 2013. In-Service data Summer 2013
10,193
firm orders
5,895
deliveries
4,298
firm order
backlog 1,688 CEO
2,610 NEO
A320
Takes-off or lands
every 2 seconds
with 99.6%
reliability
firm orders deliveries
© AIRBUS S.A.S. All rights reserved. Confidential and proprietary document.
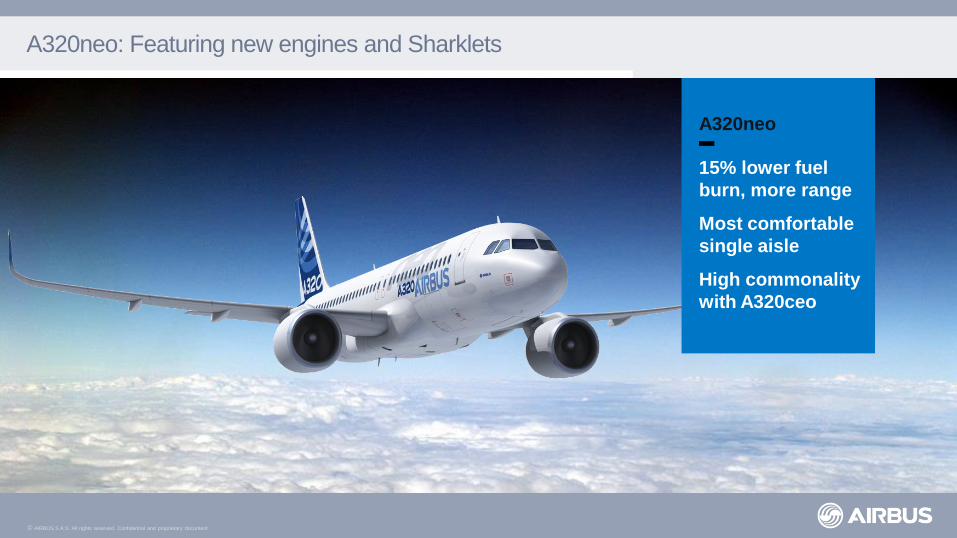
A320neo: Featuring new engines and Sharklets
A320neo
15% lower fuel
burn, more range
Most comfortable
single aisle
High commonality
with A320ceo
© AIRBUS S.A.S. All rights reserved. Confidential and proprietary document.
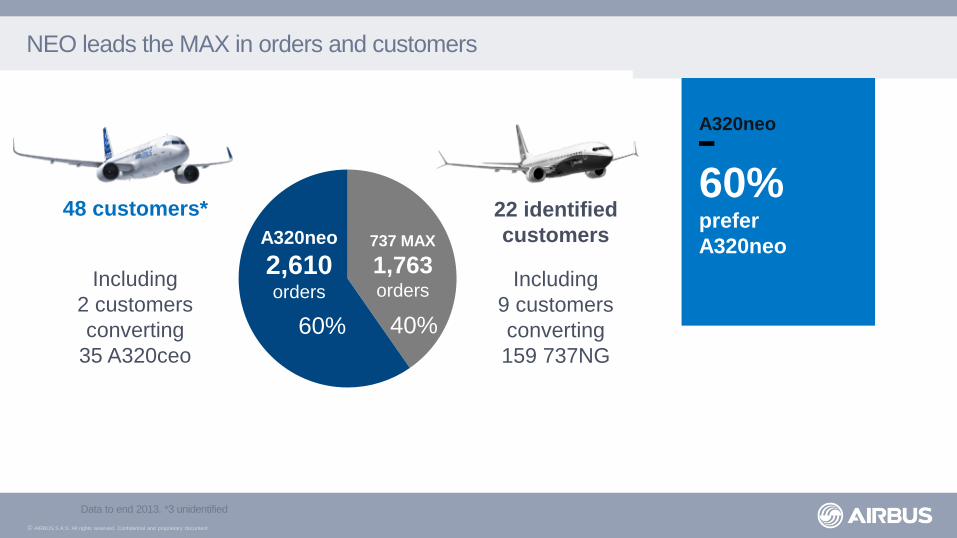
NEO leads the MAX in orders and customers
Data to end 2013. *3 unidentified
40% 60%
48 customers*
A320neo
2,610 orders
737 MAX
1,763 orders
22 identified
customers
Including
9 customers
converting
159 737NG
Including
2 customers
converting
35 A320ceo
A320neo
60%
prefer
A320neo
© AIRBUS S.A.S. All rights reserved. Confidential and proprietary document.
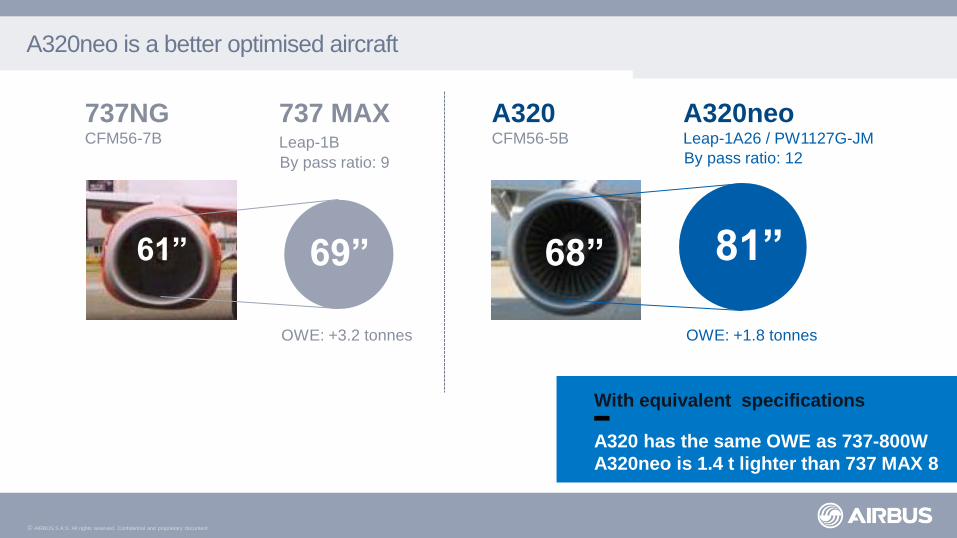
737 MAX Leap-1B
A320neo Leap-1A26 / PW1127G-JM
737NG CFM56-7B
A320neo is a better optimised aircraft
With equivalent specifications
A320 has the same OWE as 737-800W
A320neo is 1.4 t lighter than 737 MAX 8
68”
A320 CFM56-5B
68” 61” 69” 81”
OWE: +1.8 tonnes OWE: +3.2 tonnes
By pass ratio: 9 By pass ratio: 12
© AIRBUS S.A.S. All rights reserved. Confidential and proprietary document.
Airbus Widebody Family: matching market demand
© AIRBUS S.A.S. All rights reserved. Confidential and proprietary document.
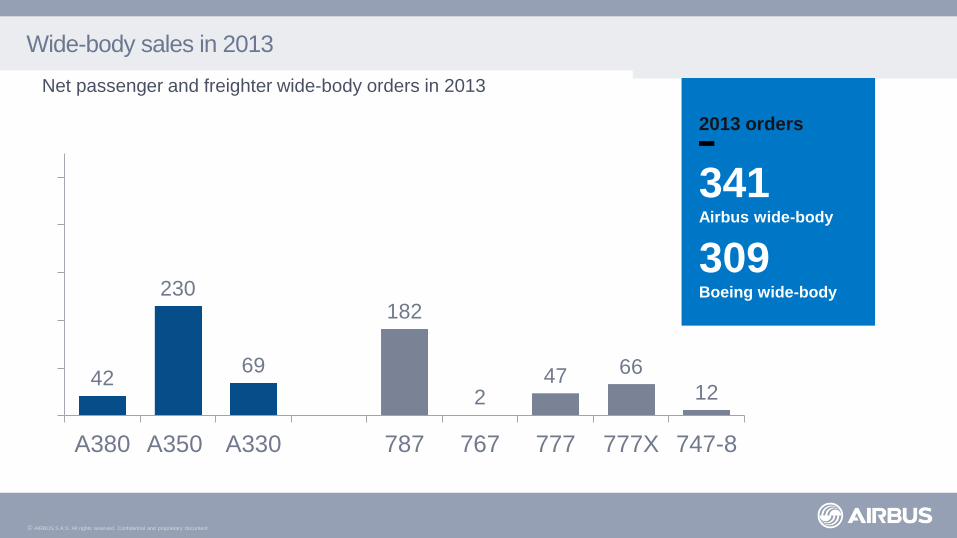
Wide-body sales in 2013
42
230
69
182
2 47 66
12 0
100
200
300
400
500
A380 A350 A330 787 767 777 777X 747-8
Net passenger and freighter wide-body orders in 2013
2013 orders
341 Airbus wide-body
309 Boeing wide-body
© AIRBUS S.A.S. All rights reserved. Confidential and proprietary document.
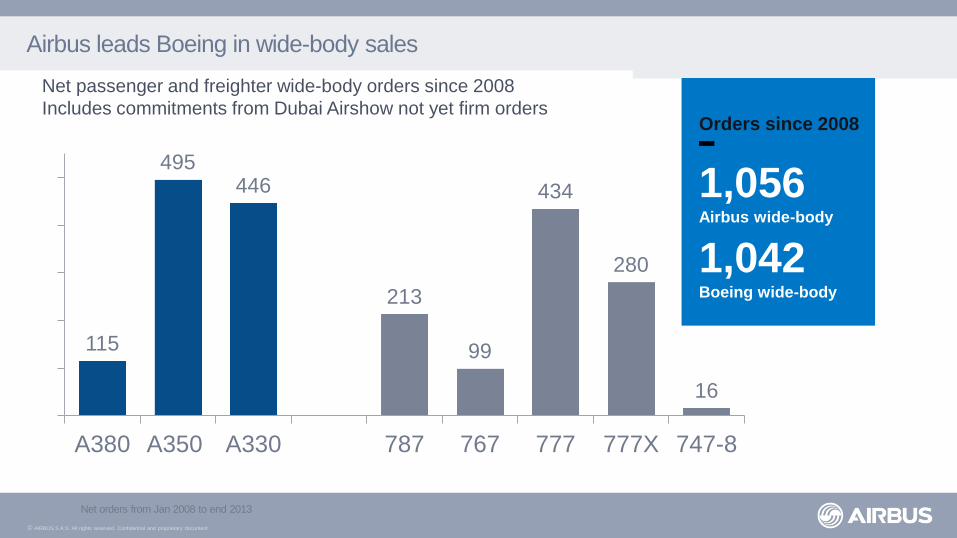
Airbus leads Boeing in wide-body sales
Net orders from Jan 2008 to end 2013
115
495 446
213
99
434
280
16
0
100
200
300
400
500
A380 A350 A330 787 767 777 777X 747-8
Net passenger and freighter wide-body orders since 2008
Includes commitments from Dubai Airshow not yet firm orders Orders since 2008
1,056 Airbus wide-body
1,042 Boeing wide-body
© AIRBUS S.A.S. All rights reserved. Confidential and proprietary document.
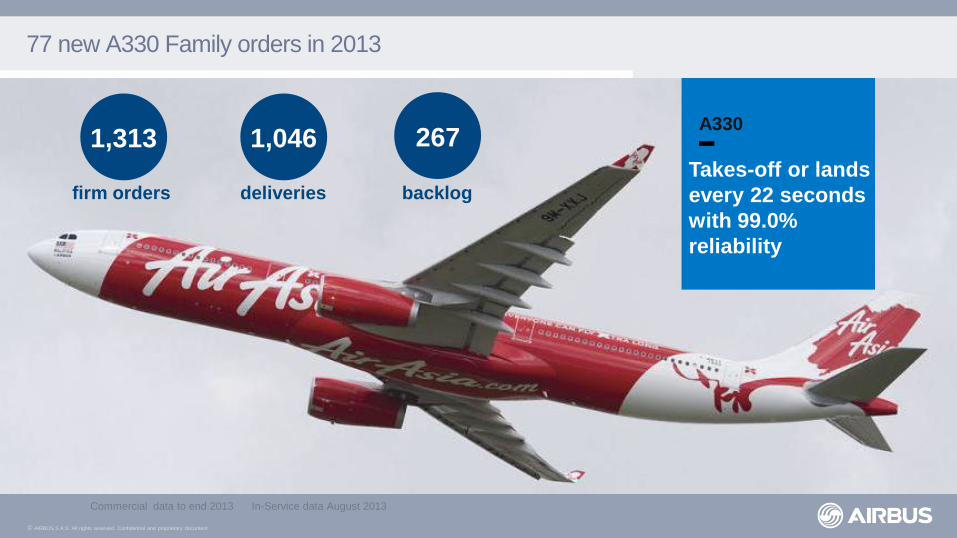
77 new A330 Family orders in 2013
Commercial data to end 2013 In-Service data August 2013
A330
Takes-off or lands
every 22 seconds
with 99.0%
reliability
1,313
firm orders
1,046
deliveries
267
backlog
© AIRBUS S.A.S. All rights reserved. Confidential and proprietary document.
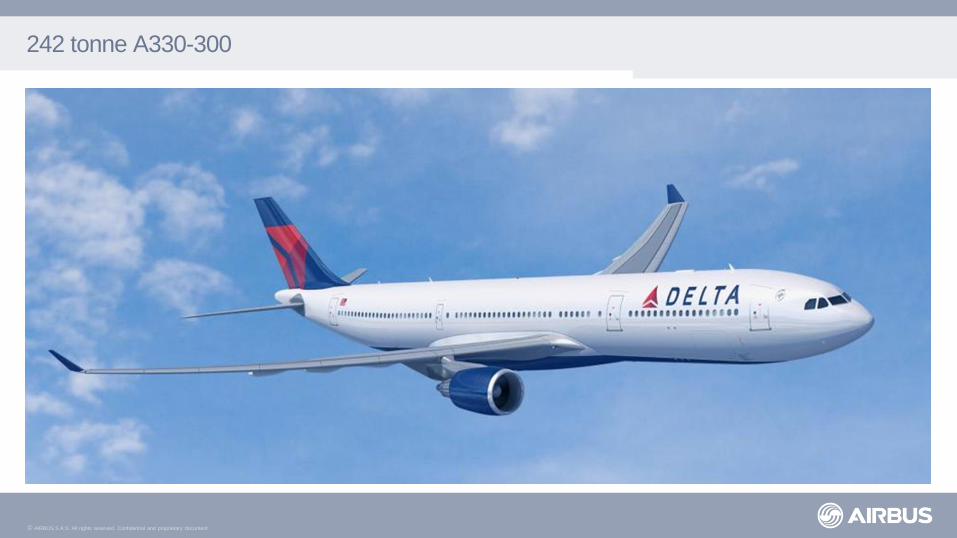
242 tonne A330-300
© AIRBUS S.A.S. All rights reserved. Confidential and proprietary document.
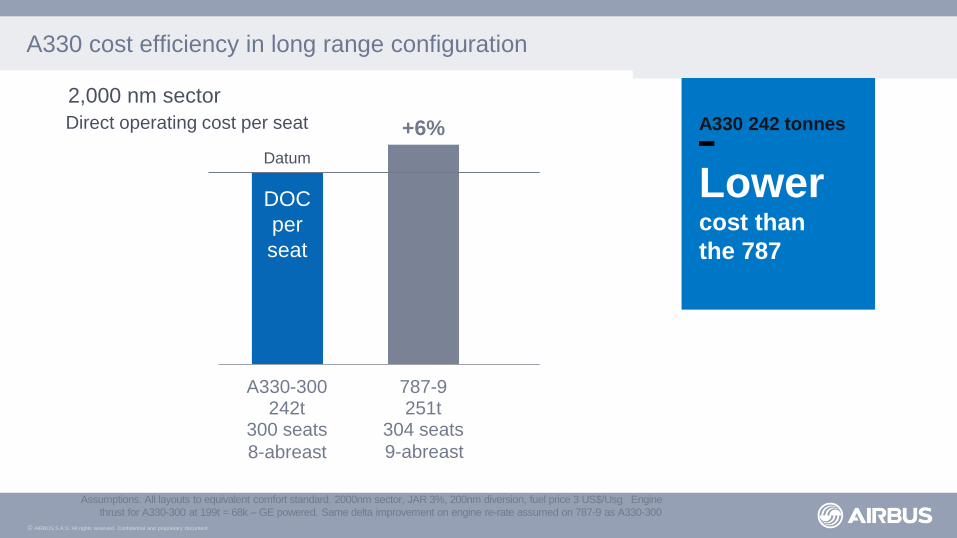
A330-300242t
300 seats
787-9251t
304 seats
A330-300199t
400 seats
787-9197t
364 seats
A330 cost efficiency in long range configuration
Assumptions. All layouts to equivalent comfort standard. 2000nm sector, JAR 3%, 200nm diversion, fuel price 3 US$/Usg Engine
thrust for A330-300 at 199t = 68k – GE powered. Same delta improvement on engine re-rate assumed on 787-9 as A330-300
+6%
8-abreast 9-abreast
DOC
per
seat
A330 242 tonnes
Lower
cost than
the 787
2,000 nm sector
Direct operating cost per seat
Datum
© AIRBUS S.A.S. All rights reserved. Confidential and proprietary document.
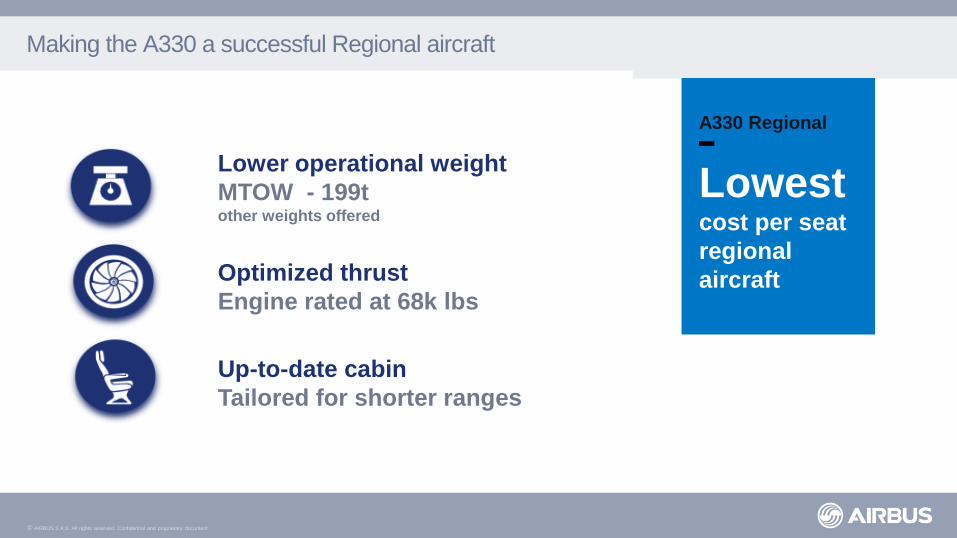
Making the A330 a successful Regional aircraft
Lower operational weight
MTOW - 199t other weights offered
Optimized thrust
Engine rated at 68k lbs
Up-to-date cabin
Tailored for shorter ranges
A330 Regional
Lowest
cost per seat
regional
aircraft
© AIRBUS S.A.S. All rights reserved. Confidential and proprietary document.
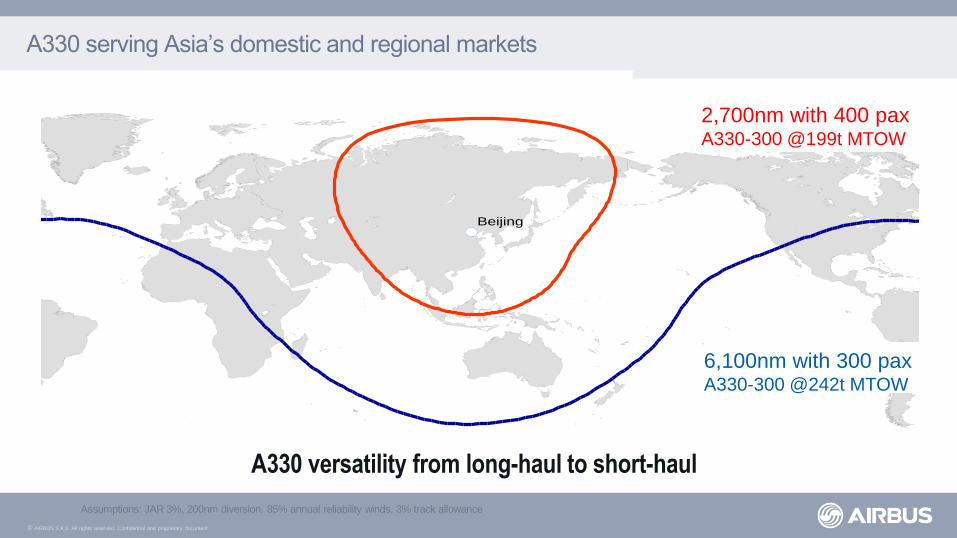
A330 serving Asia’s domestic and regional markets
A330 versatility from long-haul to short-haul
Assumptions: JAR 3%, 200nm diversion. 85% annual reliability winds, 3% track allowance
Beijing
2,700nm with 400 pax A330-300 @199t MTOW
6,100nm with 300 pax A330-300 @242t MTOW
© AIRBUS S.A.S. All rights reserved. Confidential and proprietary document.
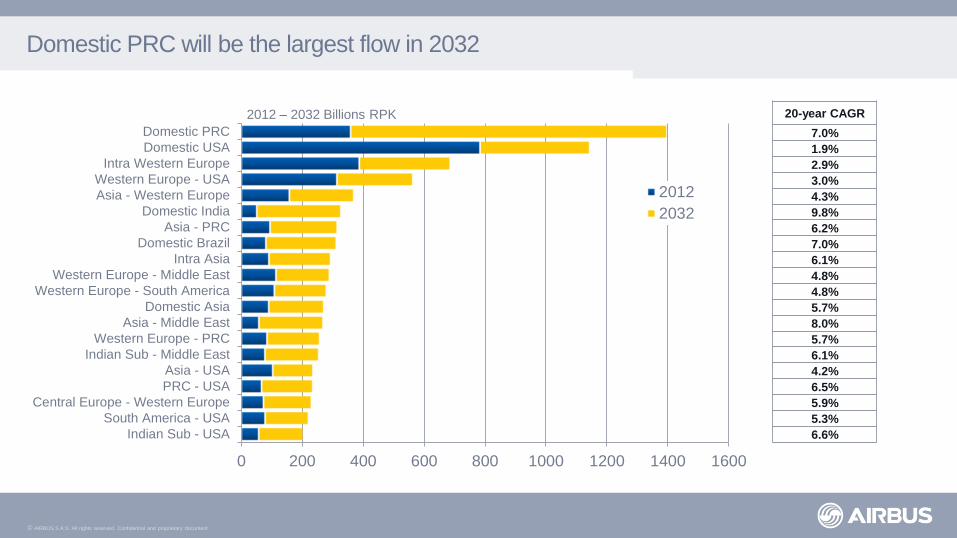
Domestic PRC will be the largest flow in 2032
0 200 400 600 800 1000 1200 1400 1600
Indian Sub - USA
South America - USA
Central Europe - Western Europe
PRC - USA
Asia - USA
Indian Sub - Middle East
Western Europe - PRC
Asia - Middle East
Domestic Asia
Western Europe - South America
Western Europe - Middle East
Intra Asia
Domestic Brazil
Asia - PRC
Domestic India
Asia - Western Europe
Western Europe - USA
Intra Western Europe
Domestic USA
Domestic PRC
2012
2032
2012 – 2032 Billions RPK 20-year CAGR
7.0%
1.9%
2.9%
3.0%
4.3%
9.8%
6.2%
7.0%
6.1%
4.8%
4.8%
5.7%
8.0%
5.7%
6.1%
4.2%
6.5%
5.9%
5.3%
6.6%
© AIRBUS S.A.S. All rights reserved. Confidential and proprietary document.
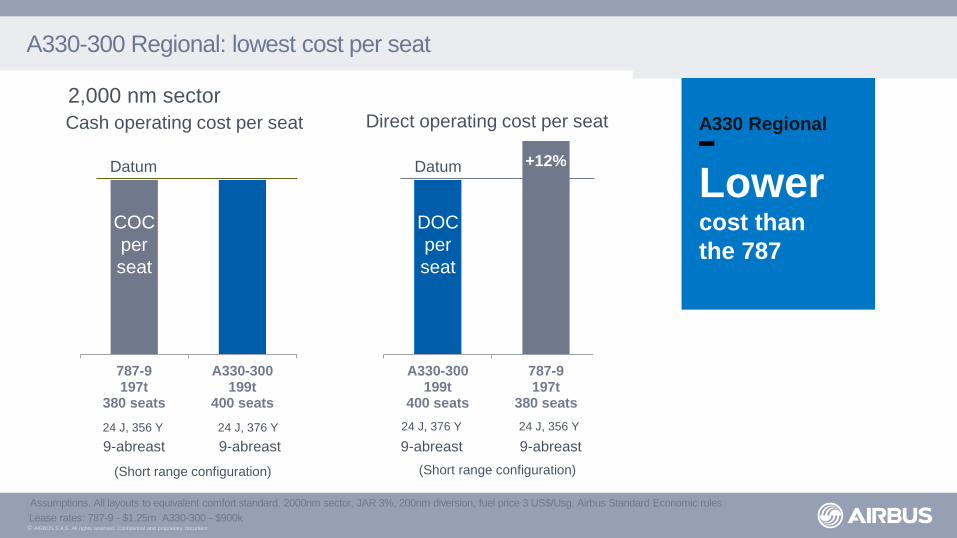
787-9197t
380 seats
A330-300199t
400 seats
A330-300199t
400 seats
787-9197t
380 seats
A330-300 Regional: lowest cost per seat
Assumptions. All layouts to equivalent comfort standard. 2000nm sector, JAR 3%, 200nm diversion, fuel price 3 US$/Usg, Airbus Standard Economic rules
Datum
Cash operating cost per seat
COC
per
seat
+12% Datum
DOC
per
seat
Direct operating cost per seat
2,000 nm sector
24 J, 356 Y
24 J, 376 Y
9-abreast 9-abreast
(Short range configuration)
24 J, 376 Y
24 J, 356 Y
(Short range configuration)
9-abreast 9-abreast
A330 Regional
Lower
cost than
the 787
Lease rates: 787-9 - $1.25m A330-300 - $900k
© AIRBUS S.A.S. All rights reserved. Confidential and proprietary document.
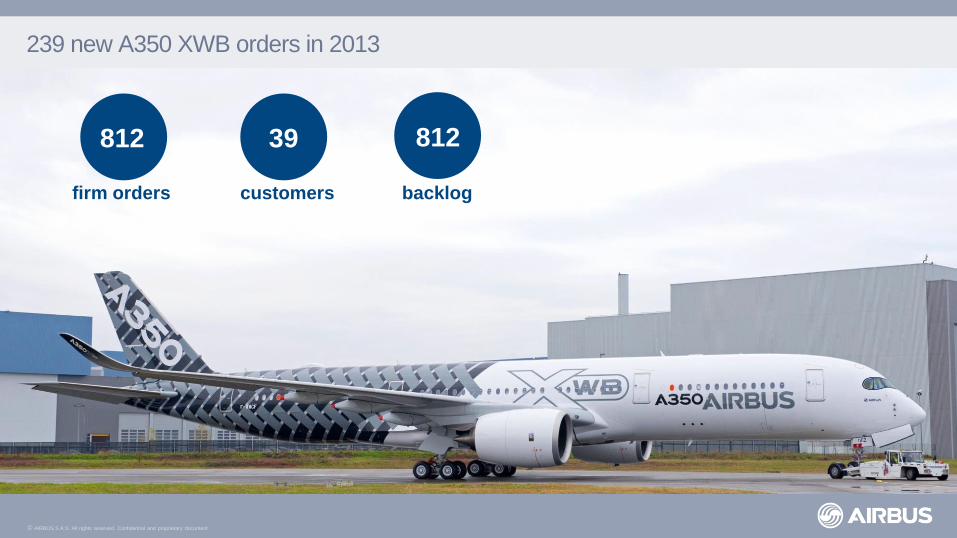
812
firm orders
39
customers
812
backlog
239 new A350 XWB orders in 2013
© AIRBUS S.A.S. All rights reserved. Confidential and proprietary document.
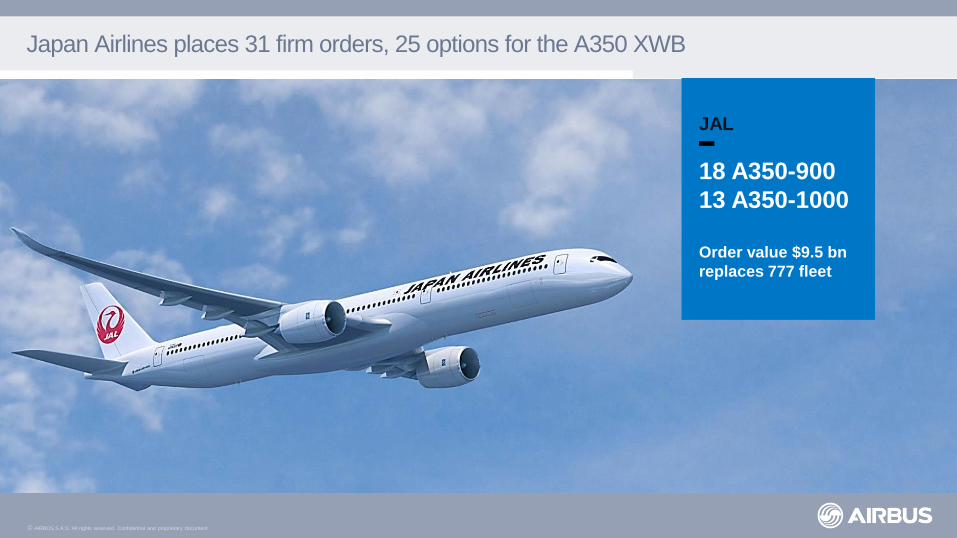
Japan Airlines places 31 firm orders, 25 options for the A350 XWB
JAL
18 A350-900
13 A350-1000
Order value $9.5 bn
replaces 777 fleet
© AIRBUS S.A.S. All rights reserved. Confidential and proprietary document.
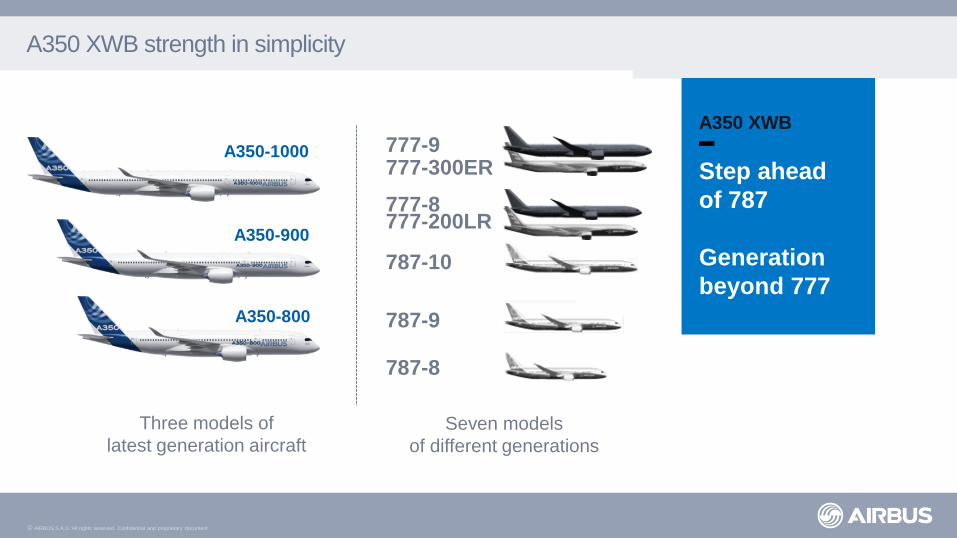
A350 XWB strength in simplicity
A350-800
A350-900
A350-1000
Three models of
latest generation aircraft
Seven models
of different generations
787-9
787-8
787-10
777-9
777-8
777-300ER
777-200LR
A350 XWB
Step ahead
of 787
Generation
beyond 777
© AIRBUS S.A.S. All rights reserved. Confidential and proprietary document.
0
10 000
20 000
30 000
40 000
50 000
60 000
70 000
0 1 000 2 000 3 000 4 000 5 000 6 000 7 000 8 000 9 000 10 000
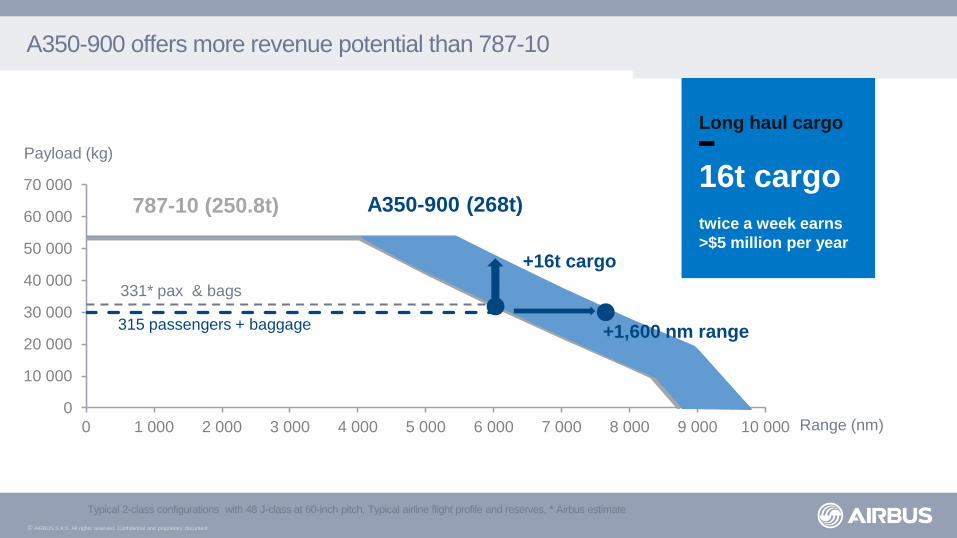
A350-900 offers more revenue potential than 787-10
Typical 2-class configurations with 48 J-class at 60-inch pitch, Typical airline flight profile and reserves, * Airbus estimate
+1,600 nm range
+16t cargo
Payload (kg)
315 passengers + baggage
331* pax & bags
Range (nm)
Long haul cargo
16t cargo
twice a week earns
>$5 million per year
787-10 (250.8t) A350-900 (268t)
© AIRBUS S.A.S. All rights reserved. Confidential and proprietary document.
0
10 000
20 000
30 000
40 000
50 000
60 000
70 000
0 1 000 2 000 3 000 4 000 5 000 6 000 7 000 8 000 9 000 10 000
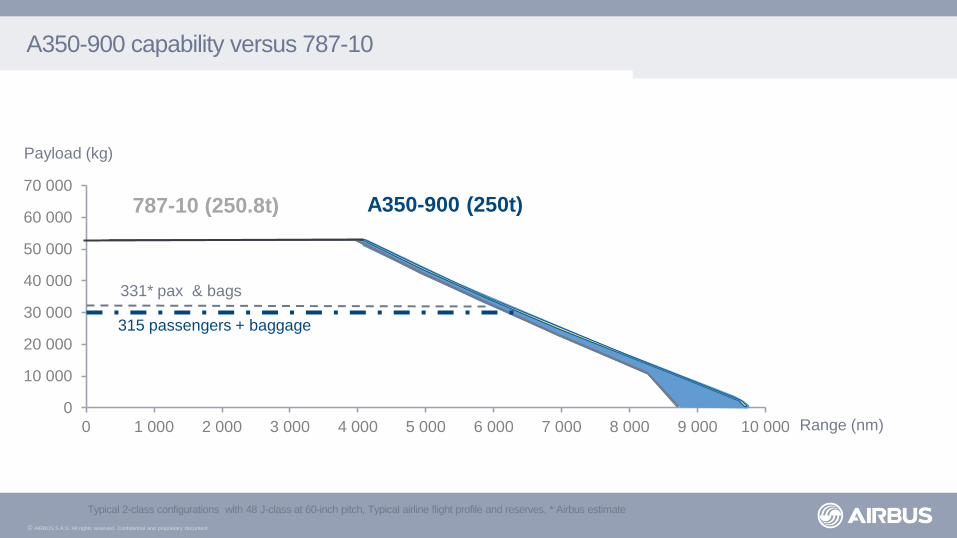
A350-900 capability versus 787-10
787-10 (250.8t)
Typical 2-class configurations with 48 J-class at 60-inch pitch, Typical airline flight profile and reserves, * Airbus estimate
315 passengers + baggage
331* pax & bags
A350-900 (250t)
Payload (kg)
Range (nm)
© AIRBUS S.A.S. All rights reserved. Confidential and proprietary document.
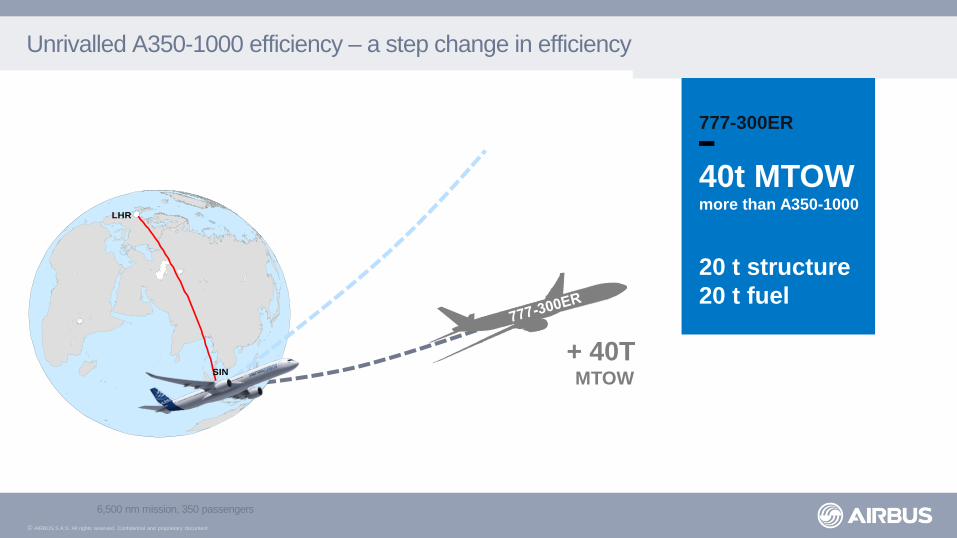
Unrivalled A350-1000 efficiency – a step change in efficiency
6,500 nm mission, 350 passengers
+ 40T MTOW
777-300ER
40t MTOW more than A350-1000
20 t structure
20 t fuel
LHR
SIN
© AIRBUS S.A.S. All rights reserved. Confidential and proprietary document.
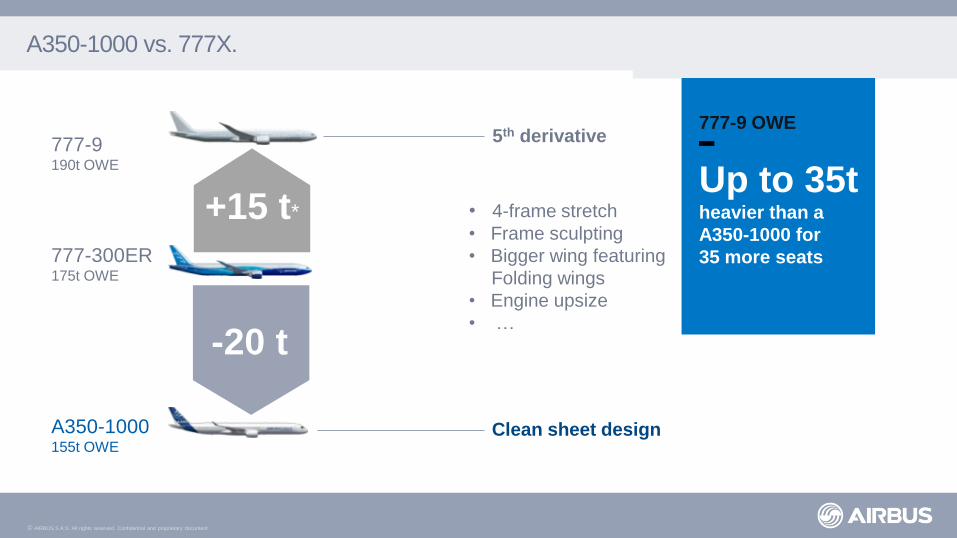
A350-1000 vs. 777X.
777-9 190t OWE
777-300ER 175t OWE
-20 t
+15 t*
A350-1000 155t OWE
Clean sheet design
5th derivative
• 4-frame stretch
• Frame sculpting
• Bigger wing featuring
wtiFolding wings
• Engine upsize
• …
777-9 OWE
Up to 35t heavier than a
A350-1000 for
35 more seats
© AIRBUS S.A.S. All rights reserved. Confidential and proprietary document.
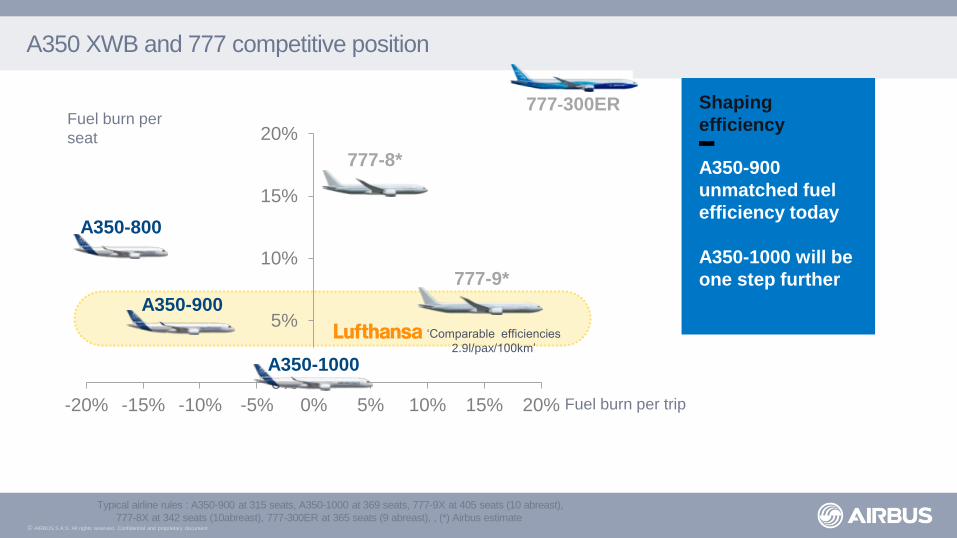
‘Comparable efficiencies
2.9l/pax/100km’
A350 XWB and 777 competitive position
Typical airline rules : A350-900 at 315 seats, A350-1000 at 369 seats, 777-9X at 405 seats (10 abreast),
777-8X at 342 seats (10abreast), 777-300ER at 365 seats (9 abreast), , (*) Airbus estimate
777-8*
777-9*
A350-800
Fuel burn per
seat
Fuel burn per trip
A350-900
777-300ER
Shaping
efficiency
A350-900
unmatched fuel
efficiency today
A350-1000 will be
one step further
0%
5%
10%
15%
20%
-20% -15% -10% -5% 0% 5% 10% 15% 20%
A350-1000
© AIRBUS S.A.S. All rights reserved. Confidential and proprietary document.
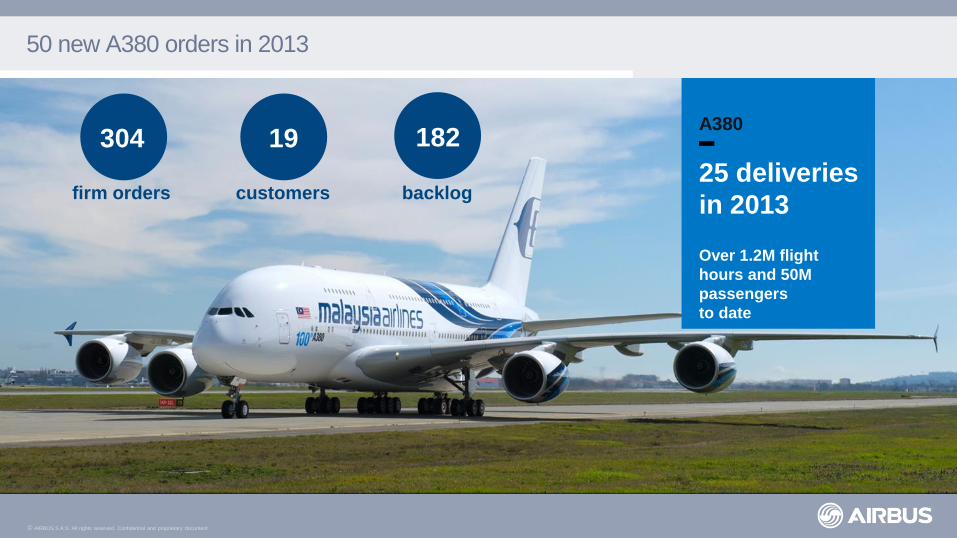
50 new A380 orders in 2013
A380
25 deliveries
in 2013 Over 1.2M flight
hours and 50M
passengers
to date
304
firm orders
19
customers
182
backlog
© AIRBUS S.A.S. All rights reserved. Confidential and proprietary document.
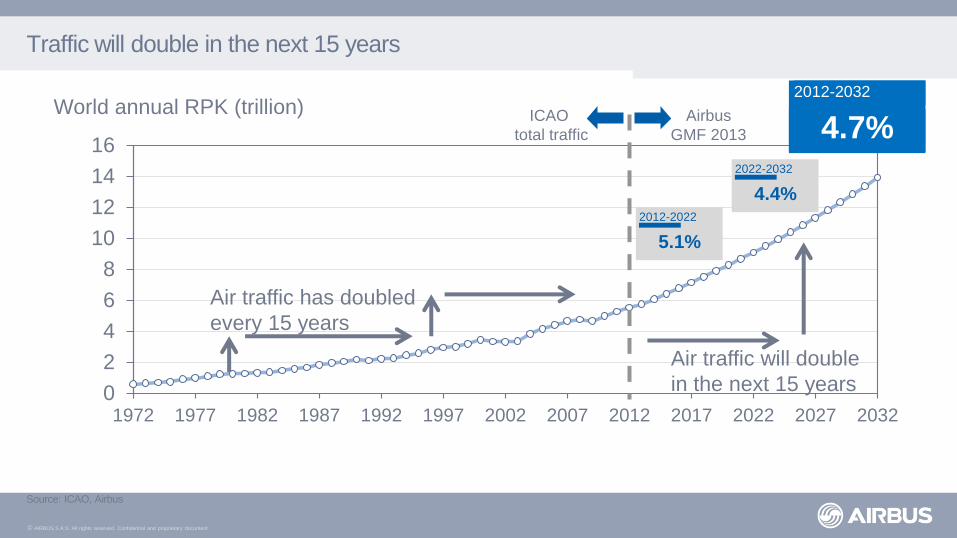
Traffic will double in the next 15 years
Source: ICAO, Airbus
0
2
4
6
8
10
12
14
16
1972 1977 1982 1987 1992 1997 2002 2007 2012 2017 2022 2027 2032
Air traffic has doubled
every 15 years
Air traffic will double
in the next 15 years
Airbus
GMF 2013
ICAO
total traffic
World annual RPK (trillion)
4.4%
2022-2032
5.1%
2012-2022
4.7%
2012-2032
© AIRBUS S.A.S. All rights reserved. Confidential and proprietary document.
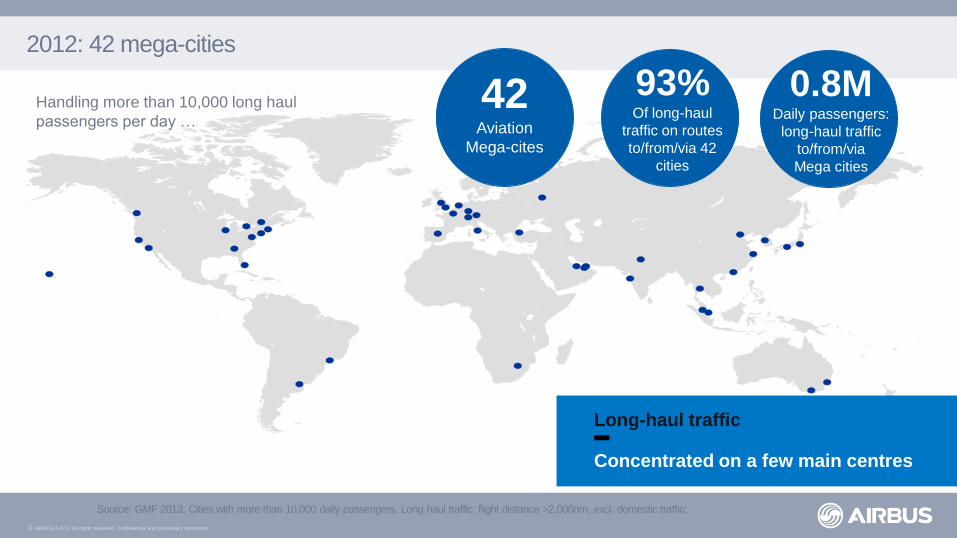
2012: 42 mega-cities
Source: GMF 2013; Cities with more than 10,000 daily passengers, Long haul traffic: flight distance >2,000nm, excl. domestic traffic;
93% Of long-haul
traffic on routes
to/from/via 42
cities
42 Aviation
Mega-cites
0.8M Daily passengers:
long-haul traffic
to/from/via
Mega cities
Handling more than 10,000 long haul
passengers per day …
Long-haul traffic
Concentrated on a few main centres
© AIRBUS S.A.S. All rights reserved. Confidential and proprietary document.
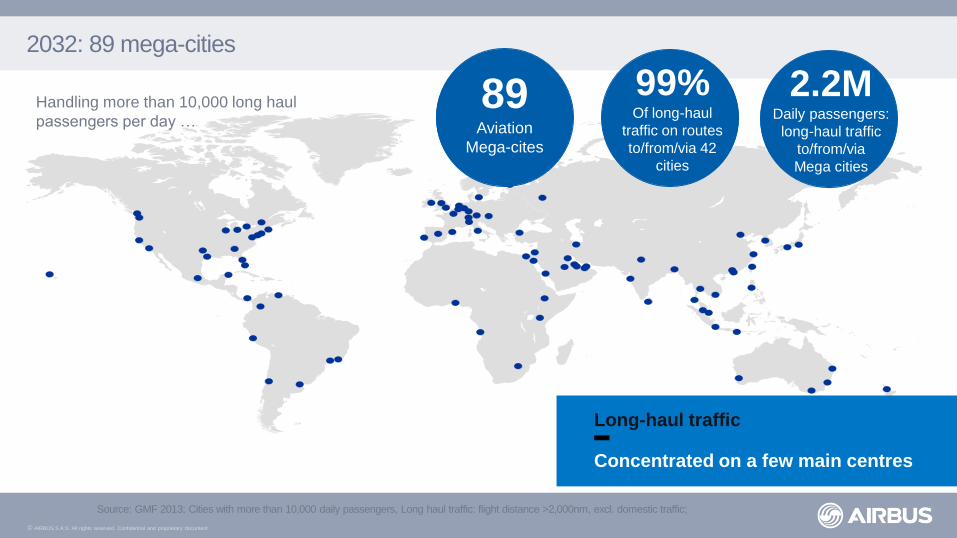
2032: 89 mega-cities
Source: GMF 2013; Cities with more than 10,000 daily passengers, Long haul traffic: flight distance >2,000nm, excl. domestic traffic;
Handling more than 10,000 long haul
passengers per day …
99% Of long-haul
traffic on routes
to/from/via 42
cities
89 Aviation
Mega-cites
2.2M Daily passengers:
long-haul traffic
to/from/via
Mega cities
Long-haul traffic
Concentrated on a few main centres
© AIRBUS S.A.S. All rights reserved. Confidential and proprietary document.
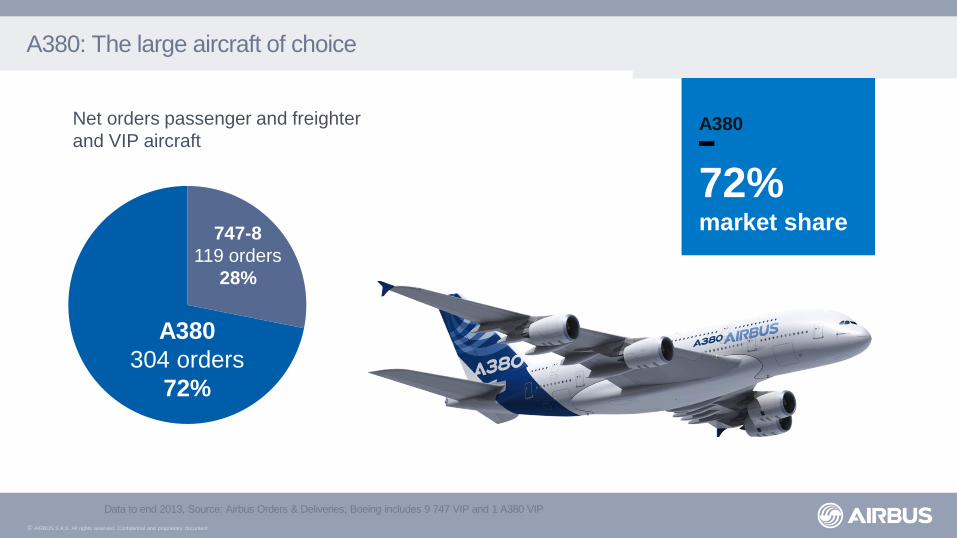
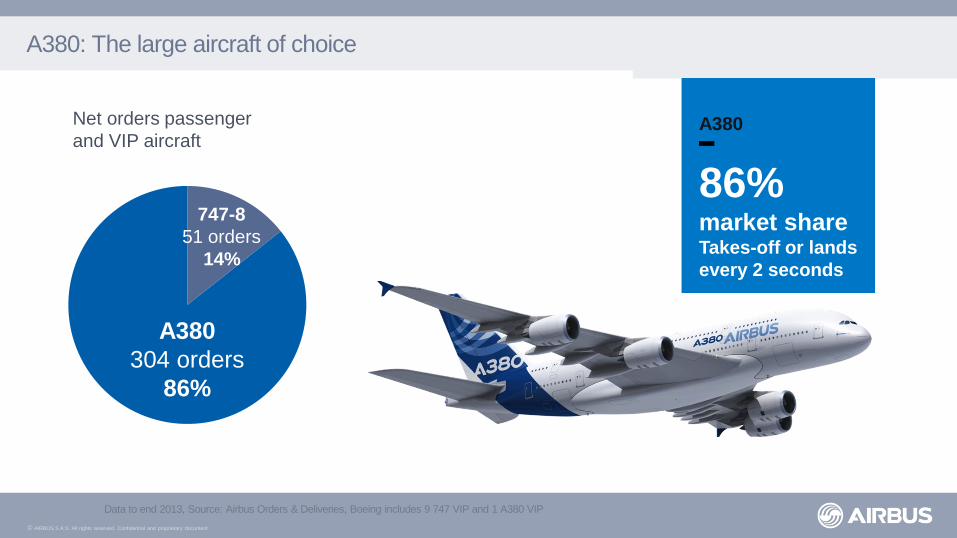
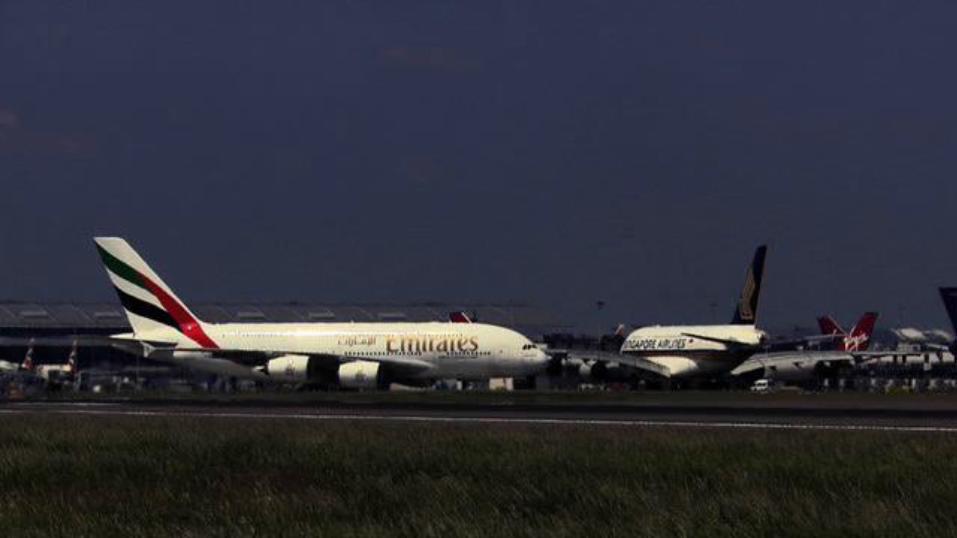
A380: The large aircraft of choice
Data to end 2013, Source: Airbus Orders & Deliveries, Boeing includes 9 747 VIP and 1 A380 VIP
A380
304 orders
72%
747-8
119 orders
28%
Net orders passenger and freighter
and VIP aircraft A380
72% market share
© AIRBUS S.A.S. All rights reserved. Confidential and proprietary document.
A380: The large aircraft of choice
Data to end 2013, Source: Airbus Orders & Deliveries, Boeing includes 9 747 VIP and 1 A380 VIP
A380
304 orders
86%
747-8
51 orders
14%
Net orders passenger
and VIP aircraft A380
86% market share Takes-off or lands
every 2 seconds
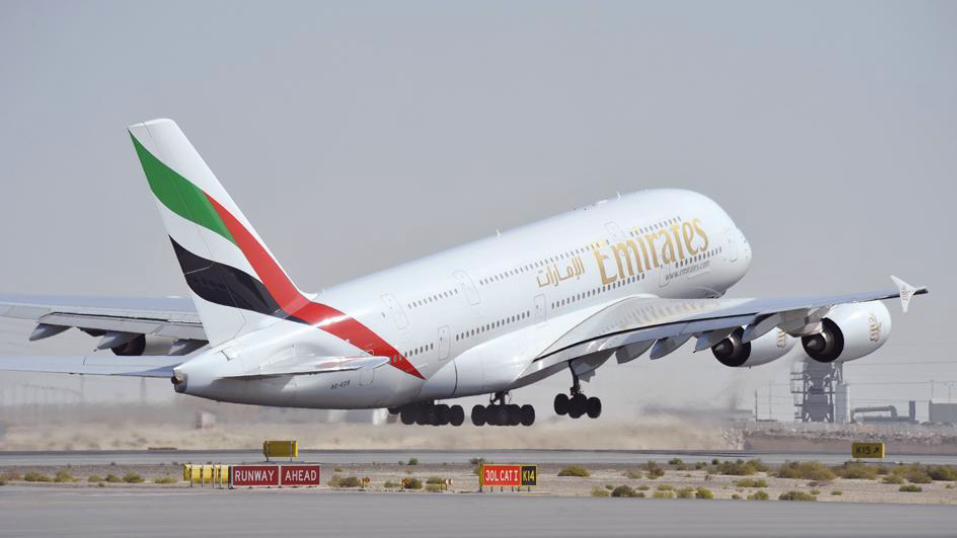
© AIRBUS S.A.S. All rights reserved. Confidential and proprietary document.
`


![Air Cond – Press - Vent - SmartCockpit · TAM MSN 0243-2393 2445 Airbus A319-320-321 [Air Cond - Press - Vent] Page 2](https://static.documents.pub/doc/80x56/5b47be0e7f8b9aa4148d0f34/air-cond-press-vent-tam-msn-0243-2393-2445-airbus-a319-320-321-air.jpg)


