American Institute of Aeronautics and Astronautics 1 Aircraft Loss-of-Control Accident Analysis Christine M. Belcastro * and John V. Foster † NASA Langley Research Center, Hampton, Virginia, 23681 Loss of control remains one of the largest contributors to fatal aircraft accidents worldwide. Aircraft loss-of-control accidents are complex in that they can result from numerous causal and contributing factors acting alone or (more often) in combination. Hence, there is no single intervention strategy to prevent these accidents. To gain a better understanding into aircraft loss-of-control events and possible intervention strategies, this paper presents a detailed analysis of loss-of-control accident data (predominantly from Part 121), including worst case combinations of causal and contributing factors and their sequencing. Future potential risks are also considered. Nomenclature CAST = Commercial Aviation Safety Team ICAO = International Civil Aviation Organization LOC = Loss of Control (in-flight) NASA = National Aeronautics and Space Administration NextGen = Next Generation Airspace Operations Concept NTSB = National Transportation Safety Board PIO = Pilot Induced Oscillation I. Introduction oss of control remains one of the largest contributors to fatal aircraft accidents. As shown in Figure 1, in-flight loss of control (LOC) is the largest fatal accident category for commercial jet airplane accidents worldwide occurring from 1999 through 2008, and resulted in 22 accidents and 1,991 total fatalities. 1 Aircraft loss of control is a significant contributor to accidents and fatalities across all vehicle classes, operational categories, and phases of flight. It is also a highly complex event, usually resulting from multiple causal and contributing factors that can occur individually or (more often) in combination. There is therefore no single intervention strategy that can be readily identified to prevent LOC accidents. In order to develop effective intervention strategies for preventing LOC accidents, it is necessary to analyze how these events unfold. In Reference [2], 74 LOC accidents were reviewed for the time period 1993 – 2007, which resulted in 42 hull loss accidents and 3241 fatalities. The analysis of this reference groups the accidents into the categories aerodynamic stall, flight control system, spatial disorientation of the crew, contaminated airfoil, and atmospheric disturbance. There is also a detailed discussion of accidents in each of these categories and a comparison with older accidents that occurred prior to 1993 in order to identify emerging trends. This reference also provides a definition of aircraft upset conditions, which is defined therein as “any uncommanded or inadvertent event with an abnormal aircraft attitude, rate of change of aircraft attitude, acceleration, airspeed, or flight trajectory”. As also noted in Ref. [2], “abnormal” must be determined relative to phase of flight and aircraft type. Reference [3] contains an analysis of LOC accidents between 1988 and 2004 relative to operational categories, including Parts 121, 135, and 91. This report states that “in flight loss of control is a serious aviation problem”, and that “well over half of the loss of control accidents included at least one fatality (80% in Part 121), and roughly half of all aviation fatalities in the studied time period occurred in conjunction with loss of control”. The study of Ref. [3] also found that about 30% of Part 121 loss of control accidents involved system/component failure/malfunction, and that icing and adverse winds were also the primary cause of many * Senior Researcher, Dynamic Systems and Control Branch, MS 308, E-Mail: [email protected]; AIAA Senior Member. † Senior Researcher, Flight Dynamics Branch, MS 308, E-Mail: [email protected]; AIAA Senior Member. L
Transcript
American Institute of Aeronautics and Astronautics
1
Aircraft Loss-of-Control Accident Analysis
Christine M. Belcastro* and John V. Foster† NASA Langley Research Center, Hampton, Virginia, 23681
Loss of control remains one of the largest contributors to fatal aircraft accidents worldwide. Aircraft loss-of-control accidents are complex in that they can result from numerous causal and contributing factors acting alone or (more often) in combination. Hence, there is no single intervention strategy to prevent these accidents. To gain a better understanding into aircraft loss-of-control events and possible intervention strategies, this paper presents a detailed analysis of loss-of-control accident data (predominantly from Part 121), including worst case combinations of causal and contributing factors and their sequencing. Future potential risks are also considered.
Nomenclature CAST = Commercial Aviation Safety Team ICAO = International Civil Aviation Organization LOC = Loss of Control (in-flight) NASA = National Aeronautics and Space Administration NextGen = Next Generation Airspace Operations Concept NTSB = National Transportation Safety Board PIO = Pilot Induced Oscillation
I. Introduction oss of control remains one of the largest contributors to fatal aircraft accidents. As shown in Figure 1, in-flight loss of control (LOC) is the largest fatal accident category for commercial jet airplane accidents worldwide
occurring from 1999 through 2008, and resulted in 22 accidents and 1,991 total fatalities. 1 Aircraft loss of control is a significant contributor to accidents and fatalities across all vehicle classes, operational categories, and phases of flight. It is also a highly complex event, usually resulting from multiple causal and contributing factors that can occur individually or (more often) in combination. There is therefore no single intervention strategy that can be readily identified to prevent LOC accidents. In order to develop effective intervention strategies for preventing LOC accidents, it is necessary to analyze how these events unfold. In Reference [2], 74 LOC accidents were reviewed for the time period 1993 – 2007, which resulted in 42 hull loss accidents and 3241 fatalities. The analysis of this reference groups the accidents into the categories aerodynamic stall, flight control system, spatial disorientation of the crew, contaminated airfoil, and atmospheric disturbance. There is also a detailed discussion of accidents in each of these categories and a comparison with older accidents that occurred prior to 1993 in order to identify emerging trends. This reference also provides a definition of aircraft upset conditions, which is defined therein as “any uncommanded or inadvertent event with an abnormal aircraft attitude, rate of change of aircraft attitude, acceleration, airspeed, or flight trajectory”. As also noted in Ref. [2], “abnormal” must be determined relative to phase of flight and aircraft type. Reference [3] contains an analysis of LOC accidents between 1988 and 2004 relative to operational categories, including Parts 121, 135, and 91. This report states that “in flight loss of control is a serious aviation problem”, and that “well over half of the loss of control accidents included at least one fatality (80% in Part 121), and roughly half of all aviation fatalities in the studied time period occurred in conjunction with loss of control”. The study of Ref. [3] also found that about 30% of Part 121 loss of control accidents involved system/component failure/malfunction, and that icing and adverse winds were also the primary cause of many
* Senior Researcher, Dynamic Systems and Control Branch, MS 308, E-Mail: [email protected];
American Institute of Aeronautics and Astronautics
2
accidents. In 2009, NASA commissioned an independent study of aircraft loss of control. 4 The final report from this study organized causal and contributing factors into human-induced, environmentally-induced, and systems-induced categories and concluded that “no single category is solely responsible for loss of control accidents” and that “accidents occur when combinations of breakdowns happen across human and engineering systems, and often in the presence of threats posed by the external environment”. This report further states that “a sympathetic read of the loss of control accidents should leave one with little hope of reducing them if efforts toward improvement were aimed in a single direction or within a single category”.
In this paper, the analysis seeks to identify worst case combinations and sequencing of precursors to aircraft
LOC accidents that were predominantly from the Part 121 category operations (both large transports and smaller regional aircraft). These LOC accident precursors are called “causal and contributing factors” throughout this paper. The LOC accidents considered in this paper included accidents that involved vehicle upsets, as well as those involving failures, impairment, or damage to the flight control capability of the aircraft (including control surfaces, flight control system or components, and the engines) or to the vehicle airframe (when the damage was sufficient to alter vehicle dynamics and control characteristics) whether or not they led to an upset condition (or there was evidence of upset cited in the report). Causal and contributing factors were identified from reading the full reports available for each accident (not through key word search), and these factors were categorized into three groups so that worst case combinations and sequences could be identified. In understanding combinations of loss-of-control factors and how they occur sequentially, it may be possible to develop a holistic intervention strategy for breaking the sequences that result in loss of control accidents. This is the primary motivation for the LOC accident analysis presented in this paper. Section II contains the analysis results, and conclusions are given in Section III.
American Institute of Aeronautics and Astronautics
3
II. Aircraft Loss-of-Control Accident Analysis A review of 126 LOC accidents (predominantly from Part 121, including large transports and smaller regional
carriers) occurring between 1979 and 2009 (30 years) and resulting in 6087 fatalities was performed for the analysis, and a listing of these accidents is provided in the Appendix. This accident set does not represent an exhaustive search throughout this time period, and it does not include military, private, cargo, charter, and corporate accidents. Russian aircraft accidents were also excluded due to a general lack of detailed information in the associated reports. Of this total accident set, 91 accidents resulting in 4190 fatalities occurred between 1994 and 2009 (15 years). The review was based on accident reports available on the Aviation Safety Network 5 and National Transportation Safety Board (NTSB) 6 websites. The level of detail in analyzing each accident was therefore dependent on the level of detail provided in the accident reports. Information from each report was transcribed into a categorized set of causal and contributing factors, using the following scheme. The causal and contributing factors were grouped into three categories: adverse onboard conditions, vehicle upsets, and external hazards and disturbances. Adverse onboard conditions included:
vehicle impairment (including inappropriate vehicle configuration, contaminated airfoil, and improper
vehicle loading); system faults, failures, and errors (resulting from design flaws, software errors, or improper maintenance
actions); vehicle damage to airframe and engines (resulting from fatigue cracks, foreign objects, overstress during
upsets or upset recovery, etc.); and inappropriate crew response (including pilot-induced oscillations, spatial disorientation, mode confusion,
ineffective recoveries, crew impairment, and failures to take appropriate actions). External hazards and disturbances included:
poor visibility; wake vortices; wind shear, turbulence, and thunderstorms; snow and icing conditions; and abrupt maneuvers for obstacle avoidance or collisions.
Vehicle upsets included:
abnormal attitude; abnormal airspeed, angular rates, or asymmetric forces; abnormal flight trajectory; uncontrolled descent (including spiral dive); and stall/departure (including falling leaf and spin).
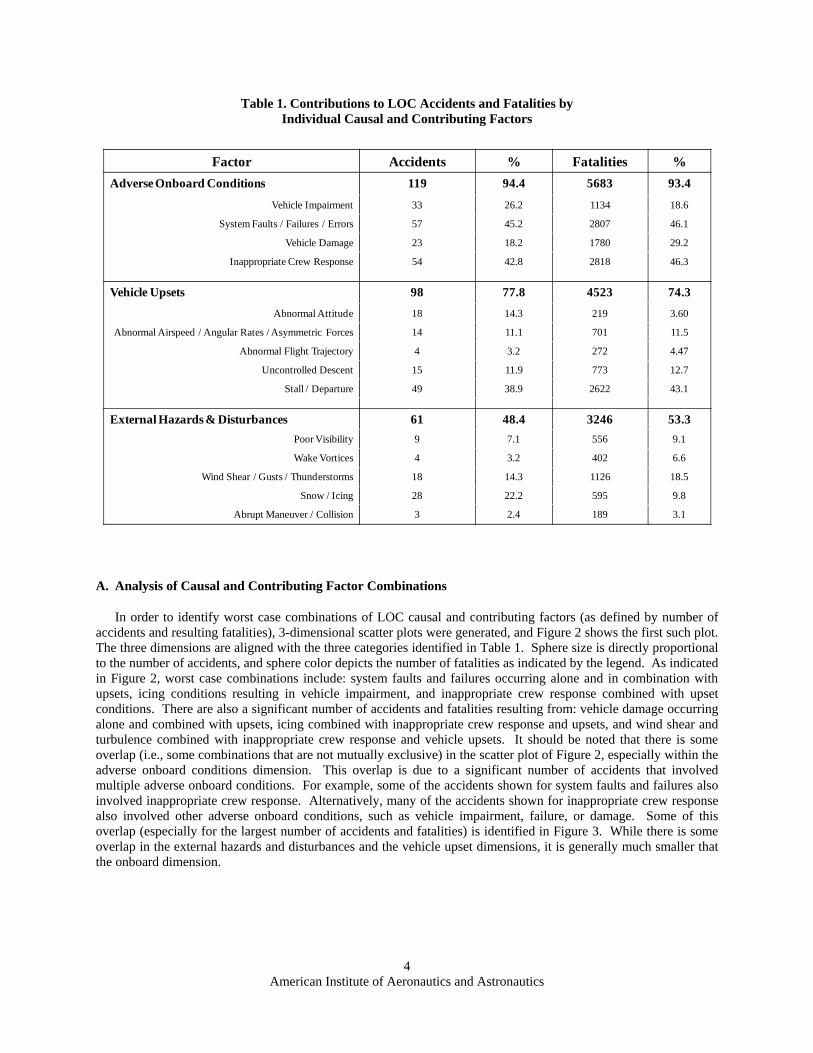
A basic analysis of the contributions of each causal/contributing factor to the 126 accidents is given in Table 1. It should be noted in Table 1 that the factors are not mutually exclusive. For example, 119 LOC accidents involved one or more adverse onboard conditions, and the frequency of each individual factor within this category is listed. These numbers do not add up to 119, however, because there were many accidents involving more than one subfactor. Similarly, adding the number of accidents listed for the three categories exceeds the 126 total because many accidents involved multiple categories. The 23 accidents related to vehicle damage consisted of 20 airframe and system damage conditions, and 3 engine damage conditions. Table I is useful for determining the number of accidents and fatalities associated with individual causal and contributing factors, but it does not provide any information on combinations or sequencing of these factors. Nonetheless, this table identifies System Faults/Failures/Errors, Vehicle Impairment/Damage, Inappropriate Crew Response, Stall/Departure, Atmospheric Disturbances related to Wind Shear/Gusts, and Snow/Icing as the most significant contributors to the number of fatalities. The following subsections A and B address combinations and sequencing of LOC causal and contributing factors, respectively. Subsection C addresses future risks.
American Institute of Aeronautics and Astronautics
4
Table 1. Contributions to LOC Accidents and Fatalities by Individual Causal and Contributing Factors
Factor Accidents % Fatalities %
Adverse Onboard Conditions 119 94.4 5683 93.4
Vehicle Impairment 33 26.2 1134 18.6
System Faults / Failures / Errors 57 45.2 2807 46.1
A. Analysis of Causal and Contributing Factor Combinations
In order to identify worst case combinations of LOC causal and contributing factors (as defined by number of accidents and resulting fatalities), 3-dimensional scatter plots were generated, and Figure 2 shows the first such plot. The three dimensions are aligned with the three categories identified in Table 1. Sphere size is directly proportional to the number of accidents, and sphere color depicts the number of fatalities as indicated by the legend. As indicated in Figure 2, worst case combinations include: system faults and failures occurring alone and in combination with upsets, icing conditions resulting in vehicle impairment, and inappropriate crew response combined with upset conditions. There are also a significant number of accidents and fatalities resulting from: vehicle damage occurring alone and combined with upsets, icing combined with inappropriate crew response and upsets, and wind shear and turbulence combined with inappropriate crew response and vehicle upsets. It should be noted that there is some overlap (i.e., some combinations that are not mutually exclusive) in the scatter plot of Figure 2, especially within the adverse onboard conditions dimension. This overlap is due to a significant number of accidents that involved multiple adverse onboard conditions. For example, some of the accidents shown for system faults and failures also involved inappropriate crew response. Alternatively, many of the accidents shown for inappropriate crew response also involved other adverse onboard conditions, such as vehicle impairment, failure, or damage. Some of this overlap (especially for the largest number of accidents and fatalities) is identified in Figure 3. While there is some overlap in the external hazards and disturbances and the vehicle upset dimensions, it is generally much smaller that the onboard dimension.
American Institute of Aeronautics and Astronautics
5
Fatalities01 – 99100 – 199200 – 299
300 ‐More
Sphere Size isDirectly Proportional to Number of Accidents
Adverse Onboard Conditions
External Hazards /
Disturbances
Vehicle Upset Conditions
None / Unkn.
Ab. Attitude
Ab. Trajectory
Stall / Depart.
Unc. Descent
Ab. Airspeed / Rates / Asym
Figure 2. Combinations of LOC Causal and Contributing Factors, 1979 – 2009.
3 Accidents / 204 Fatalities(2 Accidents with 196 Fatalities Also Involved Failures, Damage,
or Impairment)
Adverse Onboard Conditions
External Hazards /
Disturbances
Vehicle Upset Conditions
None / Unkn.
Ab. Attitude
Ab. Trajectory
Stall / Depart.
Unc. Descent
Ab. Airspeed / Rates / Asym
15 Accidents / 522 Fatalities(1 Accident with 47 Fatalities Also Involved
Inappropriate Crew Response)
9 Accidents / 370 Fatalities(5 Accidents with 219 Fatalities Also
Involved Inappropriate Crew Response)
17 Accidents / 326 Fatalities(4 Accidents with 55 Fatalities Also
Involved Inappropriate Crew Response)
Sphere Size isDirectly Proportional to Number of Accidents
Fatalities0
1 – 99100 – 199200 – 299
300 ‐More14 Accidents / 778 Fatalities(10 Accidents with 620 Fatalities
Also Involved Failures, Damage, or Impairment)
Figure 3. Identification of Overlap in LOC Causal and Contributing Factor Combinations, 1979 – 2009.
American Institute of Aeronautics and Astronautics
6
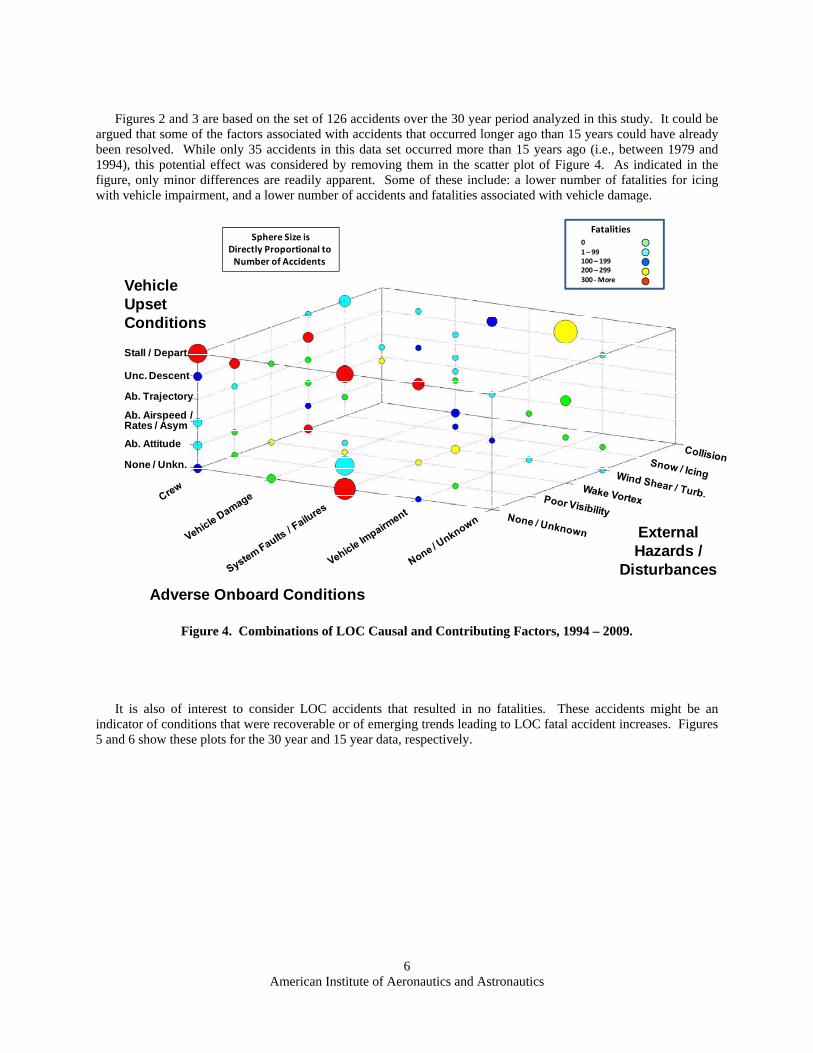
Figures 2 and 3 are based on the set of 126 accidents over the 30 year period analyzed in this study. It could be
argued that some of the factors associated with accidents that occurred longer ago than 15 years could have already been resolved. While only 35 accidents in this data set occurred more than 15 years ago (i.e., between 1979 and 1994), this potential effect was considered by removing them in the scatter plot of Figure 4. As indicated in the figure, only minor differences are readily apparent. Some of these include: a lower number of fatalities for icing with vehicle impairment, and a lower number of accidents and fatalities associated with vehicle damage.
Sphere Size isDirectly Proportional to Number of Accidents
Adverse Onboard Conditions
External Hazards /
Disturbances
Vehicle Upset Conditions
None / Unkn.
Ab. Attitude
Ab. Trajectory
Stall / Depart.
Unc. Descent
Ab. Airspeed / Rates / Asym
Fatalities0
1 – 99100 – 199200 – 299300 ‐More
Figure 4. Combinations of LOC Causal and Contributing Factors, 1994 – 2009.
It is also of interest to consider LOC accidents that resulted in no fatalities. These accidents might be an
indicator of conditions that were recoverable or of emerging trends leading to LOC fatal accident increases. Figures 5 and 6 show these plots for the 30 year and 15 year data, respectively.
American Institute of Aeronautics and Astronautics
7
Sphere Size isDirectly Proportional to Number of Accidents
Adverse Onboard Conditions
External Hazards /
Disturbances
Vehicle Upset Conditions
None / Unkn.
Ab. Attitude
Ab. Trajectory
Stall / Depart.
Unc. Descent
Ab. Airspeed / Rates / Asym
Figure 5. Combinations of LOC Causal and Contributing Factors for Nonfatal Accidents, 1979 – 2009. The results of Figures 5 and 6 are very similar. This similarity indicates that many of the nonfatal accidents in the data set occurred during the more recent 15 year period (1994 – 2009). The largest numbers of nonfatal accidents were associated with failures (with and without upsets), vehicle damage (without upsets), icing and the associated vehicle impairment (with upsets), and inappropriate crew response combined with upsets (with and without wind shear / turbulence and icing conditions). It is not clear, however, whether these nonfatal accidents can be interpreted as emerging trends or simply as individual situations in which the crew was able to successfully recover. The latter might be assumed in this case, since there were also many accidents and fatalities associated with these conditions.
Sphere Size isDirectly Proportional to Number of Accidents
Adverse Onboard Conditions
External Hazards /
Disturbances
Vehicle Upset Conditions
None / Unkn.
Ab. Attitude
Ab. Trajectory
Stall / Depart.
Unc. Descent
Ab. Airspeed / Rates / Asym
Figure 6. Combinations of LOC Causal and Contributing Factors for Nonfatal Accidents, 1994 – 2009.
American Institute of Aeronautics and Astronautics
8
B. Analysis of Causal and Contributing Factor Sequences
An analysis of the time sequencing of the LOC causal and contributing factors was performed for the 30-year data set. Table 2 provides a summary of this sequencing.
Table 2. Sequencing of LOC Accidents Causal and Contributing Factors
It should be noted that these sequences were identified without overlap. That is, there is no “double bookkeeping” of sequences in Table 2. Thus, the total number of initiating factors under column 1 sums to the total number of LOC accidents, since all LOC accidents result from at least 1 causal or contributing factor. Table 2 indicates that LOC events are usually first precipitated by an adverse onboard condition or an external hazard or disturbance. Moreover, external hazards and disturbances rarely occur further downstream in LOC sequences. Vehicle upsets are rarely the initial factor but rather an outcome of an external hazard or adverse onboard condition. Within adverse onboard conditions, system faults, failures, and errors are the leading initial factor, and inappropriate crew response is the second most likely initial event. Relative to external hazards and disturbances, the leading initial factor is icing, followed by wind shear, gusts, and thunderstorms. Adverse onboard conditions are also the most likely factor to occur second in the chain of events leading to aircraft LOC, with vehicle impairment being the most likely secondary factor to occur. This is due to vehicle impairment resulting from icing conditions (i.e., contaminated airfoil or reduced engine performance), faults or damage. Vehicle upsets most often occur as the second, third, or fourth factor in the LOC sequence. Only one 5-factor sequence was identified in this data set.
An analysis was also performed of each LOC sequence. This analysis is summarized in Table 3 and detailed in Figures 7 - 16. Table 3 provides the number of accidents and fatalities (and associated percentages) relative to each causal and contributing factor as the initial factor in the LOC sequence. Defining the LOC sequences in terms of the initiating factor allowed a comprehensive assessment without overlap.
American Institute of Aeronautics and Astronautics
9
Table 3. Summary of LOC Accident Sequences
Initial Factor in LOC Sequence Accidents % Fatalities % Figures
As indicated in Table 3, LOC events initiated by adverse onboard conditions comprised 54.8% of the accidents
and 61.3% of the fatalities within the data set considered in this analysis. Of these, system failures, faults, and errors initiated 33.3% of accidents and 29% of fatalities, followed by inappropriate crew response, vehicle damage, and vehicle impairment. External hazards and disturbances initiated 42.8% of the accidents and 36.6% of the fatalities in the LOC accidents considered. Within this category, icing represented 21.4% of accidents and 9.7% of fatalities, whereas wind shear, turbulence, and thunderstorms initiated 11.1% of accidents and 14.4% of fatalities. These factors were followed in frequency of occurrence by poor visibility, wake vortices, and abrupt maneuver or collision (with the last two having the same frequency of occurrence). It is interesting to note that icing initiated more accidents, but wind-related disturbances resulted in more fatalities. This is because the predominance of icing-induced accidents in the data set of this study involved smaller aircraft, whereas the preponderance of wind-induced accidents in this data set involved large transports. As indicated previously, vehicle upsets are rarely the precipitating factor in the LOC sequence, with these comprising 2.4% of the accidents and 2.1% of the fatalities considered in this study. Within this category, stall/departure initiated 1.6% of the accidents and 0.2% of fatalities, and abnormal flight trajectory initiated 0.8% of accidents and 1.9% of fatalities in the data set. While upsets are not usually the precipitating factor, many LOC sequences include vehicle upset somewhere in the chain of events (as indicated in Table 2). The last column of Table 3 references the figures that present the detailed LOC sequences associated with each initial factor. Sequences initiated by adverse onboard conditions are provided in Figures 7 - 10, those initiated by external hazards and disturbances are shown in Figures 11 – 15, and Figure 16 provides the sequences initiated by vehicle upsets. Each figure lists the LOC sequence number on the left, and the accident identification number from the Appendix is identified on the right in parentheses. The number of accidents and fatalities associated with each sequence is also provided.
Figure 7 shows the 5 LOC sequences initiated by vehicle impairment, with the associated number of accidents and fatalities provided for each sequence. The initiating events for these accidents included: aircraft overweight (1 accident that was overloaded with passengers), inappropriate vehicle configuration (1 accident), and an emulated engine failure during a training flight (1 accident). As indicated in Figure 7, 33% of these LOC sequences culminated in a vehicle upset, and 33% involved an inappropriate crew action or response.
American Institute of Aeronautics and Astronautics
10
Vehicle Impairment
NormalFlight
Vehicle Impairment: 3 Accidents, 186 Fatalities:
VehicleUpset
LOCEvent 1 Accident, 154 Fatalities
(14)
Inappropriate Crew Response
LOCEvent 1 Accidents, 8 Fatalities
(90)
External Hazard
VehicleFailure
LOCEvent 1 Accidents, 24 Fatalities
(7)
33% Led to a Vehicle Upset, 33% Involved Inappropriate Crew Response
1.
2.
3.
Figure 7. LOC Accident Sequences Initiated by Vehicle Impairment.
Figure 8 shows the 42 LOC sequences initiated by system failures. The initiating events for these accidents included: engine and engine control failures (17 accidents), flight control sensors and instrumentation failures and malfunctions (9 accidents), flight control system and component design errors and failures (15 accidents), and flight deck warning system failures (1 accident). External hazards and disturbances associated with these sequences included turbulence (2 accidents), wake vortices (1 accident), and an external obstruction (1 accident). As indicated in Figure 8, 26% of these sequences involved only the failure condition, 57% of these sequences led to vehicle upset, and 26% involved inappropriate crew response. All types of vehicle upsets (i.e., abnormal attitude; abnormal airspeed, angular rates, or asymmetric forces; abnormal flight trajectory; uncontrolled descent; and stall/departure) occurred in these LOC sequences.
Figure 9 shows the 11 LOC sequences initiated by vehicle damage. The precipitating damage events in these sequences included airframe structural damage (5 accidents) and engine damage (1 accident involving fatigue cracks in the engine). As indicated in Figure 9, 83% of these sequences culminated in vehicle upset, and only 1 sequence involved inappropriate crew response.
American Institute of Aeronautics and Astronautics
57% Led to a Vehicle Upset, 26% Involved Failure Only, 26% Involved Inappropriate Crew Response
10.
11.
12.
13.
14.
15.
Figure 8. LOC Accident Sequences Initiated by Failures.
American Institute of Aeronautics and Astronautics
12
Vehicle Damage: 6 Accidents, 908 Fatalities:
Vehicle Damage
NormalFlight
LOCEvent
Vehicle Upset
LOCEvent
1 Accidents, 0 Fatalities(3)
Inappropriate Crew
Response
VehicleUpset
LOCEvent
2 Accidents, 84 Fatalities(104, 120)
VehicleFailure
Vehicle Upset
LOCEvent 1 Accident, 520 Fatalities
(118)
VehicleUpset
Vehicle Failure
LOCEvent 1 Accident, 273 Fatalities
(125)
1 Accident, 31 Fatalities(117)
83% Led to a Vehicle Upset
16.
17.
18.
19.
20.
Figure 9. LOC Accident Sequences Initiated by Damage. Figure 10 shows the 18 LOC sequences initiated by inappropriate crew actions. These actions included:
improper and inadvertent control inputs (9 accidents), crew impairment and distraction (3 accidents), spatial disorientation (2 accidents), failure to configure the vehicle properly (3 accidents), and improper pre-flight planning or preparation (1 accident). As indicated in Figure 10, 100% of these sequences led to an upset condition, and 50% resulted in vehicle impairment or damage.
Figures 11-15 show the LOC sequences that were initiated by external hazards and disturbances. Figure 11 shows the 7 sequences precipitated by poor visibility. As indicated in the figure, 86% of these sequences culminated in a vehicle upset condition, and 86% involved inappropriate crew response. Of the 6 sequences involving inappropriate crew response, 5 resulted from spatial disorientation. Figure 12 shows the 3 LOC sequences initiated by a wake vortex encounter. All of these sequences culminated in a vehicle upset. Figure 13 shows the 14 LOC sequences initiated by wind shear, turbulence, and thunderstorms. As indicated in the figure, 86% of these sequences led to a vehicle upset condition, and 64% involved inappropriate crew response.
American Institute of Aeronautics and Astronautics
100% Led to a Vehicle Upset, 50% Resulted in Vehicle Impairment/Damage
21.
22.
23.
24.
25.
Figure 10. LOC Accident Sequences Initiated by Inappropriate Crew Input.
Poor Visibility: 7 Accidents, 438 Fatalities:
Poor Visibility
NormalFlight Inappropriate
Crew ResponseVehicle Upset
LOCEvent 4 Accidents, 233 Fatalities
(12, 53, 59, 60)
Inappropriate Crew Response
Vehicle Damage
Vehicle Upset
LOCEvent 1 Accidents, 2 Fatalities
(103)
Vehicle Failure
Vehicle Upset
LOCEvent 1 Accidents, 203 Fatalities
(70)
86% Led to a Vehicle Upset, 86% Involved Inappropriate Crew Response
Inappropriate Crew Response
Vehicle Impairment
LOCEvent 1 Accidents, 0 Fatalities
(9)
26.
27.
28.
29.
Figure 11. LOC Accident Sequences Initiated by Poor Visibility.
American Institute of Aeronautics and Astronautics
14
Wake Vortex: 3 Accidents, 137 Fatalities:
Wake Vortex
NormalFlight
LOCEvent 2 Accidents, 5 Fatalities
(57, 92)
Vehicle Upset
Wake Vortex
NormalFlight
LOCEvent 1 Accident, 132 Fatalities
(85)Vehicle Upset
Vehicle Failure
100% Led to a Vehicle Upset
30.
31.
Figure 12. LOC Accident Sequences Initiated by Wake Vortex Encounter.
Thunder‐storms /
Wind Shear / Gusts
NormalFlight
LOCEvent
Vehicle Upset
LOCEvent
1 Accident, 30 Fatalities(16)
2 Accidents, 250 Fatalities(23, 122)
Vehicle Failure
Vehicle Upset
LOCEvent 2 Accidents, 25 Fatalities
(95, 107)
Inappropriate Crew Response
Vehicle Upset
LOCEvent 2 Accidents, 227 Fatalities
(21, 27)
Inappropriate Crew Response
LOC Event 1 Accident, 125 Fatalities(26)
Inappropriate Crew Response
Vehicle Upset
LOCEvent 1 Accidents, 0 Fatalities
(80)
Vehicle Impairment
Inappropriate Crew Response
Vehicle Upset
LOCEvent 2 Accidents, 74 Fatalities
(71, 99)
Vehicle Damage / Failures
Vehicle Upset
LOCEventVehicle
FailureInappropriate Crew Response
3 Accidents, 143 Fatalities(22, 86, 102)
86% Led to a Vehicle Upset, 64% Involved Inappropriate Crew Response
32.
33.
34.
35.
36.
37.
38.
39.
Figure 13. LOC Accident Sequences Initiated by Wind Shear, Gusts, & Thunderstorms.
Figure 14 shows the 27 LOC sequences that were initiated by snow and icing conditions. As indicated in the figure, 10% of these sequences led to a vehicle upset, and 22% involved inappropriate crew response.
American Institute of Aeronautics and Astronautics
100% Led to a Vehicle Upset, 22% Involved Inappropriate Crew Response
Icing
NormalFlight
Vehicle Failure / Damage
Vehicle Upset
LOCEvent 3 Accidents, 160 Fatalities
(32, 66, 126)45.
46.
47.
48.
Figure 14. LOC Accident Sequences Initiated by Snow / Icing.
Figure 15 shows the 3 LOC sequences that were initiated by abrupt maneuvers and collisions. All of these sequences were initiated by a mid-air collision (1 with another aircraft, and 2 with a flock of birds).
American Institute of Aeronautics and Astronautics
Figure 15. LOC Accident Sequences Initiated by Abrupt Maneuver / Collision.
Figure 16 shows the 7 LOC sequences initiated by vehicle upsets. The precipitating event for these upsets was
undetermined. The last accident associated with Sequence 52 occurred during a low-speed check to activate the alpha floor protection system following maintenance. In this accident, the aircraft stalled on approach and recovery was impaired by the vehicle being configured inappropriately for go-around. It is unclear at this time whether the initial stall condition resulted from incorrect or inappropriate flight procedures or an error in the flight control system.
Figure 16. LOC Accident Sequences Initiated by Vehicle Upsets.
In order to condense the LOC sequences of Figures 7-16 into smaller, more actionable groupings, these sequences can be combined and generalized. In an effort to represent a large majority of the sequences identified in this study. Figure 17 shows the top 10 LOC combined sequences relative to number of accidents and fatalities. Dashed boxes represent factors that occurred in some subset within the sequence. As indicated in Figure 17, this top 10 set of combined LOC sequences represents 86.5% of the accidents and 89.1% of the fatalities considered in this study. This set can be further reduced by generalizing the sequences. Some generalized sequences are shown in Figure 18 along with the associated number of accidents and fatalities. These 7 generalized sequences represent 112 accidents (88.9%) and 5529 fatalities (90.8%).
American Institute of Aeronautics and Astronautics
17
Vehicle Impairment / Failure / Damage
VehicleUpset
NormalFlight LOC
Event
Vehicle Failure / Damage
NormalFlight
LOCEventIV. 14 Accidents, 430 Fatalities:
(4, 6, 16)
I. 19 Accidents, 1004 Fatalities:(1, 5, 17, 18)
Vehicle Impairment / Failure / Damage
External Hazard
NormalFlight
LOCEventIII. 24 Accidents, 851 Fatalities:
(29, 31, 34, 40, 43, 45, 47, 48)VehicleUpset
NormalFlight Inappropriate
Crew Input / Action
Vehicle Problem / External Hazard
VehicleUpset
LOCEventII. 17 Accidents, 1095 Fatalities:
(21, 22, 23, 24)
NormalFlight Inappropriate
Crew InputVehicleUpset
LOCEventV. 7 Accidents, 460 Fatalities:
(26, 36, 46)External Hazard
NormalFlight
External Hazard
Vehicle Impairment / Failure / Damage
Inappropriate Crew Input
VehicleUpset
LOCEventIX. 7 Accidents, 143 Fatalities:
(39, 41)
Vehicle Failure
NormalFlight Inappropriate
Crew Response
External Hazard
LOCEvent
VII. 3 Accidents, 493 Fatalities:(13, 14, 15)
Inappropriate Crew Input
NormalFlight
VehicleUpset
LOCEventX. 4 Accidents, 76 Fatalities:
(27, 37, 38)
Vehicle Impairment / Failure / Damage
External Hazard
Top 10 Totals: 109 Accidents (86.5%), 5425 (89.1%)
American Institute of Aeronautics and Astronautics
19
C. Future Considerations In addition to looking at historical accident data, potential future LOC accident risks should be identified relative
to known (as well as new) precursors. This is more difficult, because (without data) it becomes more speculative. However, the identification of potential future risks might enable the development of a comprehensive intervention strategy that anticipates and mitigates these future potential risks. One area of consideration is airspace operation under the Next Generation (NextGen) Air Transportation System. 7 The NextGen concept of operations provides an integrated view of airspace operations in the 2025 timeframe and includes high-density, all-weather, and self-separation operational concepts. There is also expected to be mixed-capability aircraft operating within the same airspace, including piloted aircraft and unmanned aircraft systems. High-precision 4-D trajectories are envisioned that will enable safely flying with closer spacing to inclement weather, terrain, and other aircraft, and these trajectories can be altered if necessary during the flight. Other areas of consideration include increasing airspace and vehicle system complexity without developing comprehensive methods for their validation and verification (V&V), and increased automation without improved crew interfaces.
In an effort to identify areas of potential future LOC risk in terms of known precursors, Figure 19 illustrates several areas of possible increase in causal and contributing factors with the potential for increased LOC accidents or incidents. If all-weather operations and highly precise trajectories that enable closer spacing to inclement weather increase the probability of an aircraft actually encountering inclement weather during flight, this could result in a larger number of weather-related LOC accidents (particularly in the terminal area). If airspace and vehicle system complexity is increased without comprehensive methods for their V&V, this could lead to a larger number of LOC events initiated by system faults, failures, and errors. If high-density mixed-vehicle operations and high-precision tracking that enables closer spacing between aircraft increase the probability of aircraft encountering other aircraft during flight, this could result in a larger incidence of wake-induced LOC events or ultimately those initiated by vehicle damage resulting from mid-air collisions. Increased automation without improved crew interfaces could result in a higher incidence of LOC events precipitated by inappropriate crew actions.
Increased System Complexity Without Comprehensive V&V
Process
High‐Density Mixed‐Vehicle Operations
Increased Automation Without Improved Crew Interfaces
Figure 19. Potential Areas of Future Increased LOC Risk.
In order to consider LOC sequences that could become more prevalent under NextGen, Figure 20 shows summarized sequences grouped by relevance to NextGen operations. High-density operations are represented by LOC sequences that were initiated by wake vortex encounters or mid-air collisions. All-weather operations are represented by a summary of LOC sequences initiated by weather-related events. Crew-automation vulnerability is
American Institute of Aeronautics and Astronautics
20
represented by LOC sequences that were initiated by system faults and crew errors. Future intervention strategies for preventing LOC events will need to be able to provide interventions for these sequences with an emphasis on takeoffs and landings under wake and wind shear conditions, terminal area maneuvering and landing under vehicle impairment conditions while penetrating external disturbances, and self-separation and abrupt maneuvering for collision avoidance under all-weather and vehicle impairment conditions.
NormalFlight
Wake Vortex Vehicle ProblemVehicleUpset
LOCEvent
3 Accidents, 137 Fatalities:
High‐Density Related Sequences:
NormalFlight
LOCEvent3 Accidents, 189 Fatalities: External
Hazard (Collision)
Vehicle Damage
Figure 20a. Potential LOC Sequences Related to Future Risk (High-Density Related Sequences).
Vehicle Impairment / Failure / Damage
External Hazard
NormalFlight
LOCEvent
24 Accidents, 851 Fatalities:
NormalFlight Inappropriate
Crew InputVehicleUpset
LOCEvent
7 Accidents, 460 Fatalities:
VehicleUpset
External Hazard
NormalFlight
External Hazard
Vehicle Impairment / Failure / Damage
Inappropriate Crew Input
VehicleUpset
LOCEvent
7 Accidents, 143 Fatalities:
Inappropriate Crew Input
NormalFlight
VehicleUpset
LOCEvent
4 Accidents, 76 Fatalities:
Vehicle Impairment / Failure / Damage
External Hazard
All‐Weather Related Sequences:
NormalFlight
LOCEvent4 Accidents, 255 Fatalities: External
Hazard
Vehicle Upset
NormalFlight
LOCEvent
1 Accidents, 125 Fatalities:External Hazard
Inappropriate Crew Response
Figure 20b. Potential LOC Sequences Related to Future Risk (Weather Related Sequences).
American Institute of Aeronautics and Astronautics
21
Inappropriate Crew Input
NormalFlight
VehicleUpset
LOCEvent
9 Accidents, 349 Fatalities:
Vehicle Failure
NormalFlight Inappropriate Crew
Response w/ or w/o Upset / Damage
External Hazard
LOCEvent
3 Accidents, 493 Fatalities:
Crew‐Automation Related Sequences:
Vehicle Impairment / Failure / Damage
NormalFlight Inappropriate
Crew InputVehicleUpset
LOCEvent
6 Accidents, 304 Fatalities:
Vehicle Impairment
External Hazard
NormalFlight
LOCEventInappropriate
Crew Input
Vehicle Upset
1 Accident, 5 Fatalities:
Vehicle Impairment / Damage
Inappropriate Crew Input
VehicleUpset
LOCEvent
NormalFlight
7 Accidents, 741 Fatalities:
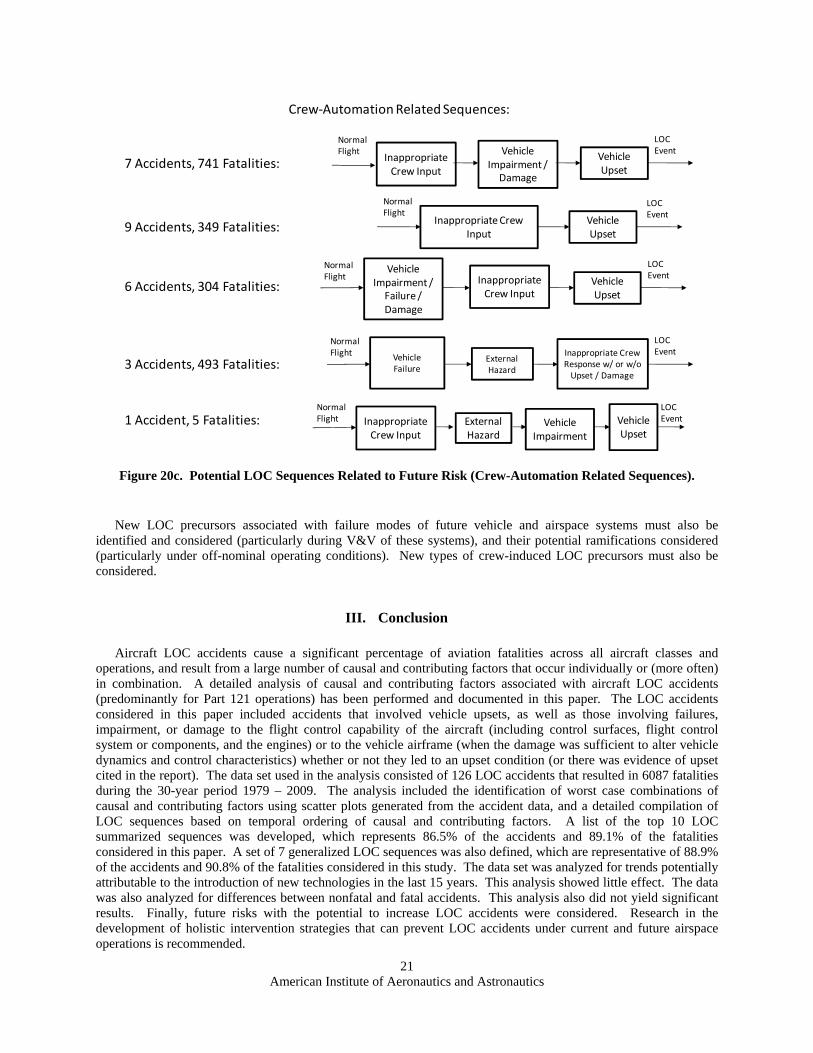
Figure 20c. Potential LOC Sequences Related to Future Risk (Crew-Automation Related Sequences).
New LOC precursors associated with failure modes of future vehicle and airspace systems must also be identified and considered (particularly during V&V of these systems), and their potential ramifications considered (particularly under off-nominal operating conditions). New types of crew-induced LOC precursors must also be considered.
III. Conclusion Aircraft LOC accidents cause a significant percentage of aviation fatalities across all aircraft classes and
operations, and result from a large number of causal and contributing factors that occur individually or (more often) in combination. A detailed analysis of causal and contributing factors associated with aircraft LOC accidents (predominantly for Part 121 operations) has been performed and documented in this paper. The LOC accidents considered in this paper included accidents that involved vehicle upsets, as well as those involving failures, impairment, or damage to the flight control capability of the aircraft (including control surfaces, flight control system or components, and the engines) or to the vehicle airframe (when the damage was sufficient to alter vehicle dynamics and control characteristics) whether or not they led to an upset condition (or there was evidence of upset cited in the report). The data set used in the analysis consisted of 126 LOC accidents that resulted in 6087 fatalities during the 30-year period 1979 – 2009. The analysis included the identification of worst case combinations of causal and contributing factors using scatter plots generated from the accident data, and a detailed compilation of LOC sequences based on temporal ordering of causal and contributing factors. A list of the top 10 LOC summarized sequences was developed, which represents 86.5% of the accidents and 89.1% of the fatalities considered in this paper. A set of 7 generalized LOC sequences was also defined, which are representative of 88.9% of the accidents and 90.8% of the fatalities considered in this study. The data set was analyzed for trends potentially attributable to the introduction of new technologies in the last 15 years. This analysis showed little effect. The data was also analyzed for differences between nonfatal and fatal accidents. This analysis also did not yield significant results. Finally, future risks with the potential to increase LOC accidents were considered. Research in the development of holistic intervention strategies that can prevent LOC accidents under current and future airspace operations is recommended.
American Institute of Aeronautics and Astronautics
22
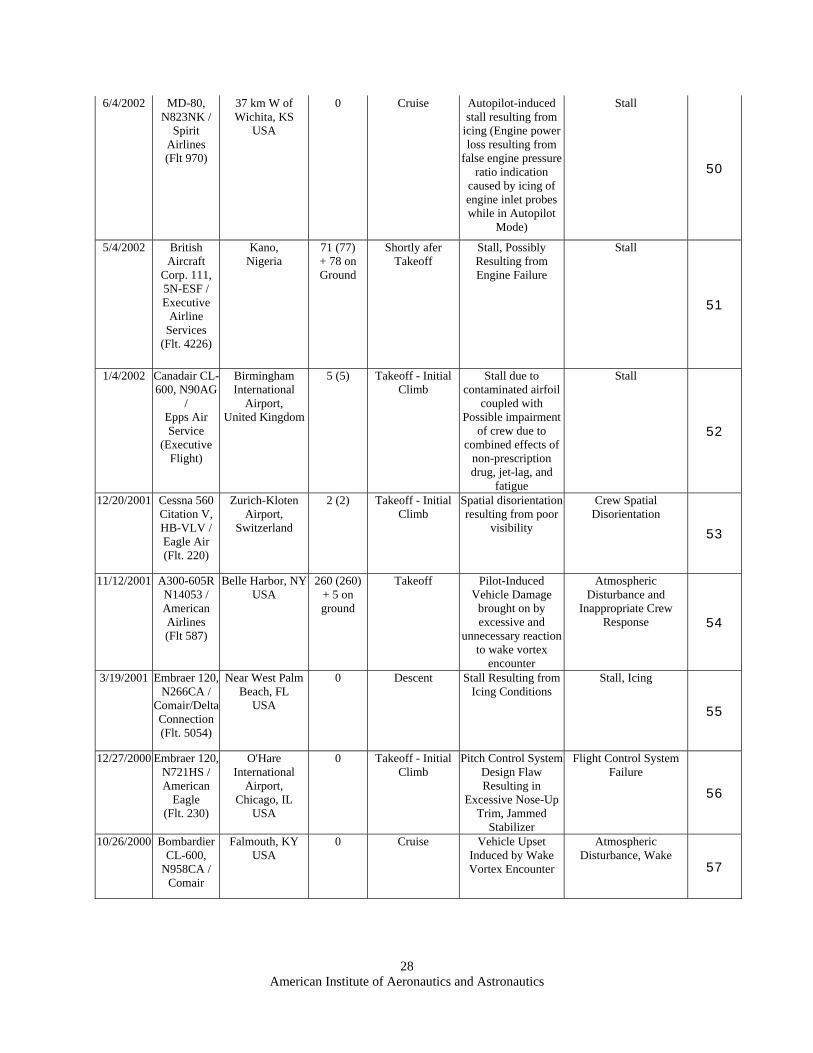
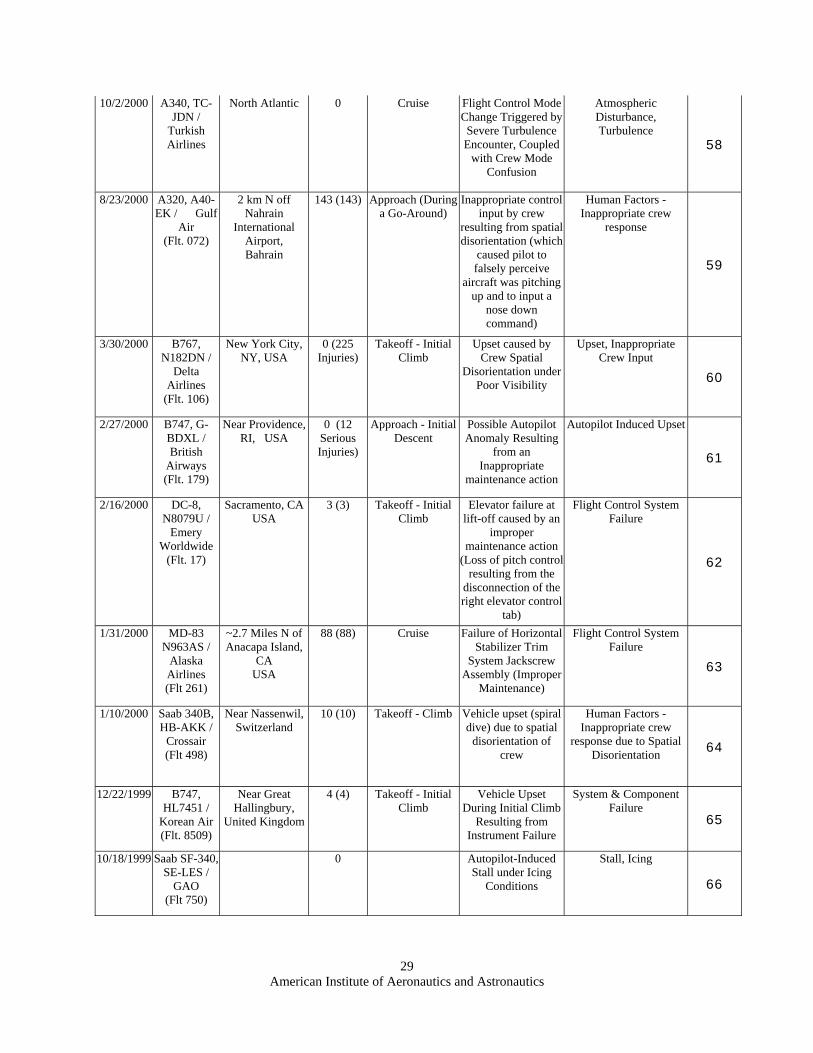
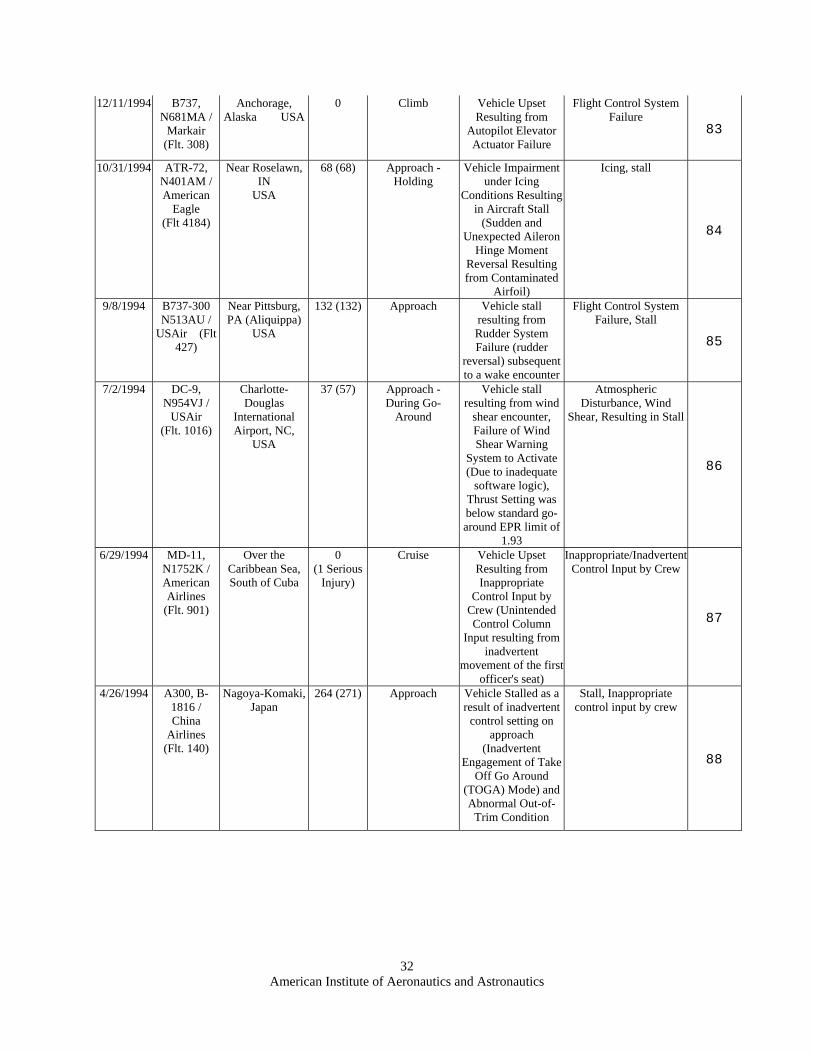
Appendix
Date Aircraft /
Airline Location
Fatalities (Total
Onboard)Phase of Flight
Accident Summary
Probable Primary Cause
Accident No.
9/24/2009 British Aerospace
4121 Jetstream 41, ZS-NRM / SA Airlink
Merebank, Near Durban
International Airport
South Africa
0 Takeoff System / Component Failure - Engine
Engine Failure
1
8/3/2009 B707, EP-SHK /
Saha Air (Flt. 124)
Ahwaz Airport, Iran
0 Cruise Uncontained Engine Failure Resulting in Unknown Level of Vehicle Damage
System / Component Failure - Engine
2
7/13/2009 B737, N387SW / Southwest Airlines
(Flt. 2294)
Near Charleston, WV, USA
0 Cruise Vehicle suffered rapid decompression resulting from a hole
in the fuselage measuring 17"x8"
Damage to fuselage from unknown source
3
6/1/2009 A330, F-GZCP /
Air France
~160 km NNW off Sao Pedro and
Sao Paulo Archipelago in
the Atlantic Ocean
228 (228) Cruise Instrument failure of the Air Data Inertial
Reference Unit (ADIRU), possibly coupled with severe
31 (31) Takeoff Vehicle stall resulting from engine
failure and inappropriate crew
response (Pilot Input Incorrect Rudder
Command)
Engine, stall
117
8/12/1985 B747, JA8119 / Japan Air
Lines (Flt. 123)
Near Ueno Japan
520 (524) Cruise Airframe damage that resulted in loss of control surfaces
(Rupture of aft bulkhead initiated by
fatigue cracks, resulting in
separation of a portion of the
vertical fin and the section of the
tailcone that contains the auxiliary power unit; this damage caused a drop in
hydraulic pressure, which resulted in the inoperability of the control surfaces)
Airframe Failure
118
2/19/1985 B747, N4522V /
China Airlines
(Flt. 006)
550 km NW off San Francisco,
CA USA
0 (2 Serious Injuries)
Cruise In-flight upset following engine
failure resulting from insufficiency of the
autopilot for operation under
abnormal conditions; Crew was distracted
with the engine failure, relied too
heavily on the autopilot, and failed to monitor airplane's flight instruments;
Successful recovery and safe landing
were made by the crew; Airplane suffered major
structural damage during the upset,
descent, and subsequent recovery
Flight Control System Failure - Engines,
Autopilot Insufficiency for Off-Nominal
Operation
119
American Institute of Aeronautics and Astronautics
38
1/21/1985 Lockheed L-188 Electra,
N5532 / Galaxy Airlines
(Flt. 203)
3 km SE of Reno / Tahoe
International Airport, NV
USA
70 (71) Takeoff - Initial Climb
Aircraft stalled as a result of in-flight vehicle anomaly / damage (Failure of
ground crew to secure the air start access door, which caused unexpected
"thunking" noise and vibration during
takeoff - and possible airframe damage)
Stall
120
5/30/1984 Lockheed L-188 Electra,
N5523 / Zantop
International Airlines
(Flt. 931)
Chalkhill, PA USA
4 (4) Cruise Vehicle upset resulting from
instrumentation failure (No. 2 Gyro
Malfunction; Possible conflicting
pitch and roll information to flight
crew), In-flight damage and breakup
resulting from overstress during
upset and attempted recovery
System & Component Failure - Instrumentation
121
7/9/1982 B727, N4737 / Pan
American World
Airways (Flt. 759)
New Orleans, LA USA
145 (145) + 8 on ground
Takeoff - Initial Climb
Microburst wind shear encounter on
takeoff
Atmospheric Disturbance - Wind
Shear 122
1/13/1982 B737, N62AF /
Air Florida (Flt. 90)
1.4 km N of Washington-
National Airport, DC, USA
74 (79) + 4 on ground
Takeoff - Initial Climb
Vehicle stalled as a result of icing conditions that
contaminated the airfoil
Stall / Icing
123
11/11/1979 DC-10, XA-DUH /
AeroNaves (Flt. 945)
Near Luxemburg, Germany
0 Takeoff - Climb to Cruise
Autopilot-Induced stall in vertical speed
mode; Overload failure to elevator
assembly attachments (in-flight
separation)
Stall
124
American Institute of Aeronautics and Astronautics
39
5/25/1979 DC-10-10, N110AA / American
Airlines (Flt. 191)
O’Hare International
Airport Chicago, IL
USA
271 (271) +2
Takeoff (Just After Rotation)
Vehicle stalled as a result of vehicle
damage (separation of Left Engine &
Pylon Assembly & ~3 ft. of Leading
Edge from Left Wing with Uncommanded Retraction of Left
Wing Outboard LE Slats (Resulted from Poor Maintenance));
Failure of Stall Warning System
Airframe Damage / Stall
125
4/4/1979 B727, N840TW /
Trans World Airlines
(Flt. 841)
Near Saginaw, MI USA
0 Cruise Vehicle Upset resulting from control surface failure - Slat Asymmetry:
Aircraft's No. 7 leading edge slat (on its right wing) was
stuck in the extended or partially extended position and could
not be retracted (due to a pre-existing
misalignment and the resulting air loads); No. 7 slat was torn from the aircraft
System / Component Failure - Flight Control
System
126
American Institute of Aeronautics and Astronautics
40
Acknowledgments
This research is dedicated to the memory of Dr. Celeste M. Belcastro of NASA Langley Research Center, who lost her courageous and selfless battle with cancer and passed from this life on August 22, 2008. She dedicated her life and career to aviation safety research, and made numerous technical and leadership contributions in the areas of vehicle health management and safety-critical avionics systems. Just prior to her illness, she had embarked on a research collaboration with her identical twin, Dr. Christine M. Belcastro, to address aircraft loss of control. Her absence from this work will forever be a significant and irreparable loss to the aerospace research community.
The authors wish to thank Dr. Steven D. Young for insight into NextGen and the identification of new LOC precursors for future systems and operations, and to Mr. Kenneth H. Goodrich for numerous suggestions for improvement of the paper during its review.
References
1 “Statistical Summary of Commercial Jet Airplane Accidents, Worldwide Operations, 1959-2008”, Boeing Commercial Airplanes, July 2009. Available at http://www.boeing.com/news/techissues.
2 Lambregts, A. A., Nesemeier, G., Wilborn, J. E., and Newman, R. L., “Airplane Upsets: Old Problem, New Issues”, AIAA Modeling and Simulation Technologies Conference and Exhibit, 2008, AIAA 2008-6867.
3 Evans, Joni K., “An Examination of In Flight Loss of Control Events During 1988–2004”, Alliant Techsystems, Inc., NASA Langley Research Center, Contract No.: TEAMS:NNL07AM99T/R1C0, Task No. 5.2, 2007.
4 Jacobson, Steven R., Foster, John V., Casner, Stephen M., Reehorst, Andrew L., Addy, Harold E., Shah, Gautam H., and Nowinski, Jessica L., “Aircraft Loss of Control Study Final Report”, February 2010.
5 Aviation Safety Network (ASN) Database Available at http://aviation-safety.net/database/ 6 National Transportation Safety Board (NTSB) Database Available at http://www.ntsb.gov/ntsb/query.asp 7 Joint Planning and Development Office, “Concept of Operations for the Next Generation Air Transportation
System”, Version 3, October 2009, Available at http://www.jpdo.gov/library.asp
Filename: Aircraft LOC Accident Analysis - Paper_Belcastro_Final.doc Directory: C:\Documents and Settings\cbelcast\My Documents Template: C:\Documents and Settings\cbelcast\Application
Data\Microsoft\Templates\Normal.dotm Title: Preparation of Papers for AIAA Technical Conferences Subject: Author: Erich Knausenberger Keywords: Comments: Creation Date: 7/14/2010 11:03:00 AM Change Number: 44 Last Saved On: 7/23/2010 3:27:00 PM Last Saved By: cbelcast Total Editing Time: 1,754 Minutes Last Printed On: 7/23/2010 3:27:00 PM As of Last Complete Printing Number of Pages: 40 Number of Words: 10,417 (approx.) Number of Characters: 59,381 (approx.)