Page 1
Aircraft Markets In An Age Of Extremes
Aviation Industry Overview And Forecast
Presentation To AGMA/ABMA 2013 Annual MeetingCarlsbad, CABy Richard AboulafiaVice President, AnalysisTeal Group Corporationwww.tealgroup.comApril 2013
Page 2
Jetliners Are A Serious AnomalyAircraft Markets, Through Good And Bad YearsWorldwide Deliveries By ‘13 $
Value (in 2012) CAGR’03-‘08
CAGR’08-‘12
Change‘08-‘12
Change’11-‘12
Large Jetliners ($88.1 b) 7.4% 12.0% 57.4% 29.4% Business Aircraft ($19.9 b) 17.1% -6.3% -22.9% 5.7%
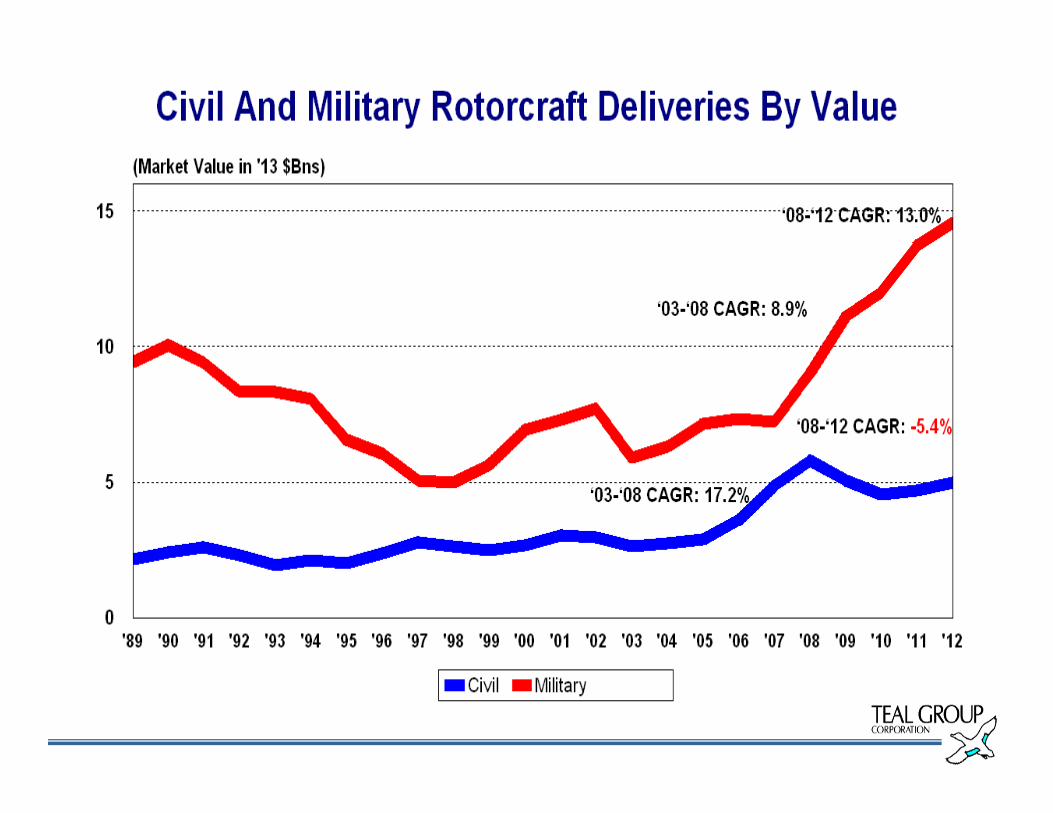
Regionals ($6.2 b) 4.4% -9.6% -33.2% -12.6%Civil Rotorcraft ($4.9 b) 17.2% -5.4% -15.2% 7.6%
Military Rotorcraft($14.7 b) 8.9% 13.0% 62.9% 6.6%
Military Transports ($6.2b) 3.1% -2.0% -7.7% -12.5%
Fighters ($14.3 b) 1.9% 0.5% 2.1% -13.8%
All Civil ($118.9 b) 9.7% 5.2% 22.6% 20.4% All Military ($36.7 b) 3.7% 3.8% 16.2% -7.6%
Total ($155.6 b) 8.0% 4.9% 21.1% 12.4%
Page 3
Civil And Military Aircraft Deliveries
'89 '90 '91 '92 '93 '94 '95 '96 '97 '98 '99 '00 '01 '02 '03 '04 '05 '06 '07 '08 '09 '10 '11 '120
20
40
60
80
100
120(Market Value in 2013 $ Bns)
Civi l Mil i tary
‘03-‘08: 59% (9.7% CAGR)
‘08-‘12: 16.2% (3.8% CAGR)
‘03-‘08: 19.7% (3.7% CAGR)
‘08-‘12: 22.6% (5.2% CAGR)
Page 4
Military And Rotorcraft
Page 5
DoD Investment, O&M FundingUpsides: Asia Pivot, Iran. Downside: Sequestration
Budget Authority
115
140
173190
179
214
239 237
271293 285 284
210 209
235 230220
42 4657 65 69 73 78 77 80 80 81 72 69 68 71 69 72
54 6178 83
97 105
134
165
135 138 134121
100 99 100 106110
FY01 FY03 FY05 FY07 FY09 FY11 FY13 FY15 FY170
50
100
150
200
250
300($ bns)
Procurement RDT&E O&M
Pre-OCO; pre-sequestration
Page 6
A Weak DoD Weapons Investment Cycle
Source: Capital Alpha Partners
Page 7
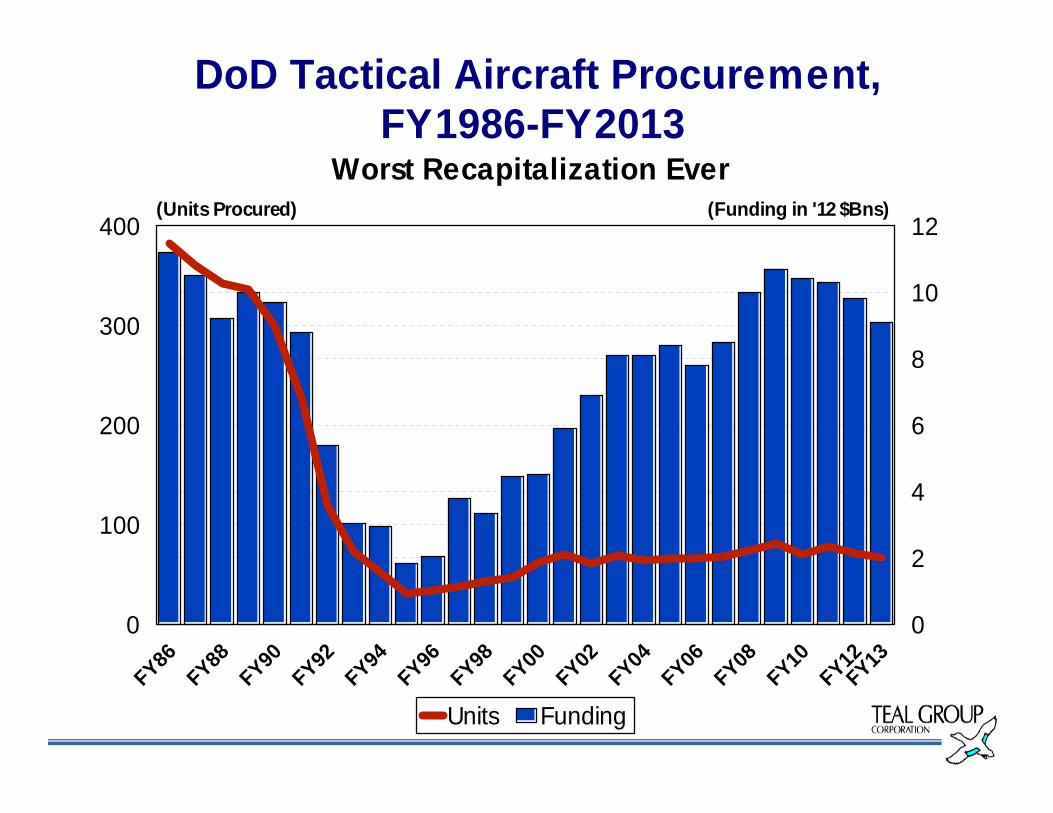
DoD Tactical Aircraft Procurement, FY1986-FY2013
Worst Recapitalization Ever
FY86FY88
FY90FY92
FY94FY96
FY98FY00
FY02FY04
FY06FY08
FY10FY12
FY130
100
200
300
400(Units Procured)
0
2
4
6
8
10
12(Funding in '12 $Bns)
Units Funding
Page 8
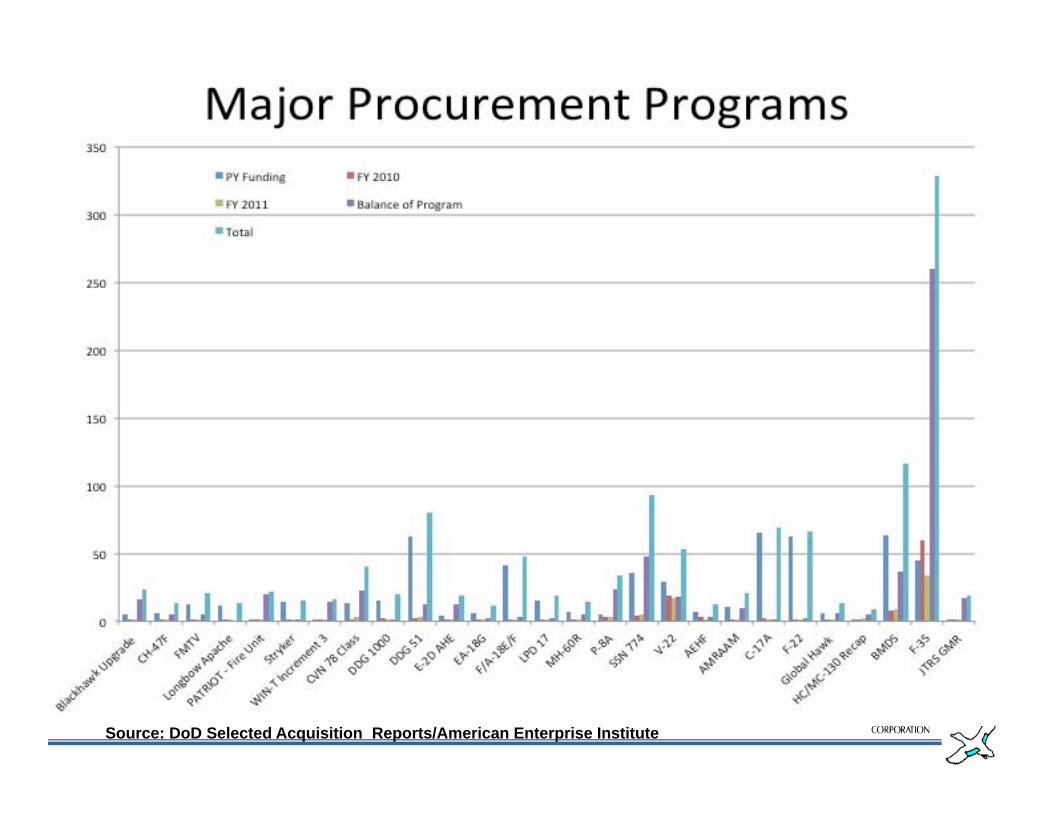
Source: DoD Selected Acquisition Reports/American Enterprise Institute
Page 9
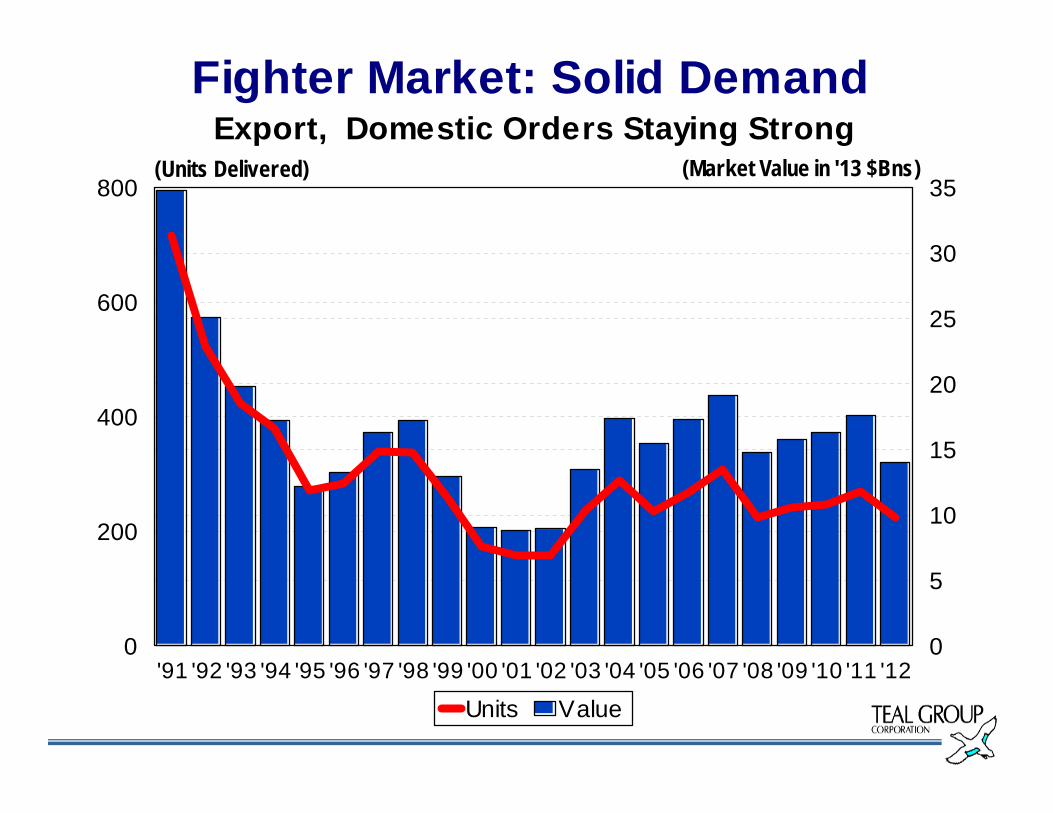
Fighter Market: Solid DemandExport, Domestic Orders Staying Strong
'91 '92 '93 '94 '95 '96 '97 '98 '99 '00 '01 '02 '03 '04 '05 '06 '07 '08 '09 '10 '11 '120
200
400
600
800(Units Delivered)
0
5
10
15
20
25
30
35(Market Value in '13 $Bns)
Units Value
Page 10
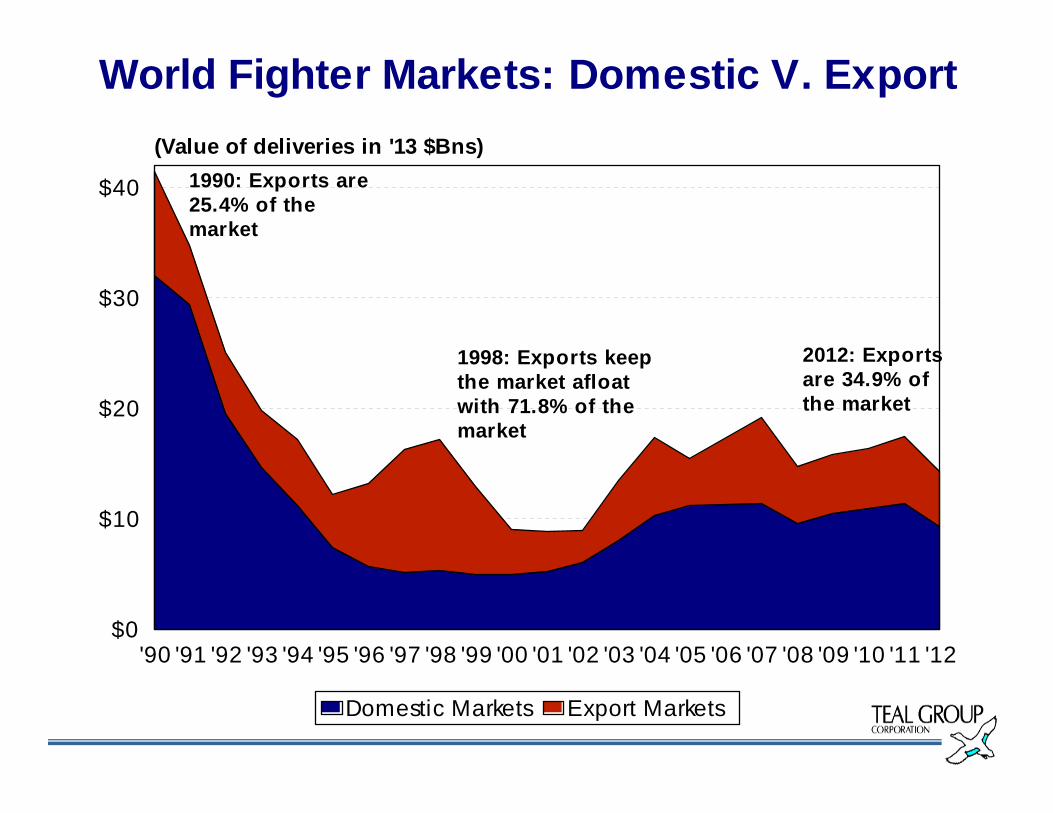
World Fighter Markets: Domestic V. Export
'90 '91 '92 '93 '94 '95 '96 '97 '98 '99 '00 '01 '02 '03 '04 '05 '06 '07 '08 '09 '10 '11 '12$0
$10
$20
$30
$40
(Value of deliveries in '13 $Bns)
Domestic Markets Export Markets
1990: Exports are 25.4% of the market
2012: Exports are 34.9% of the market
1998: Exports keep the market afloat with 71.8% of the market
Page 11
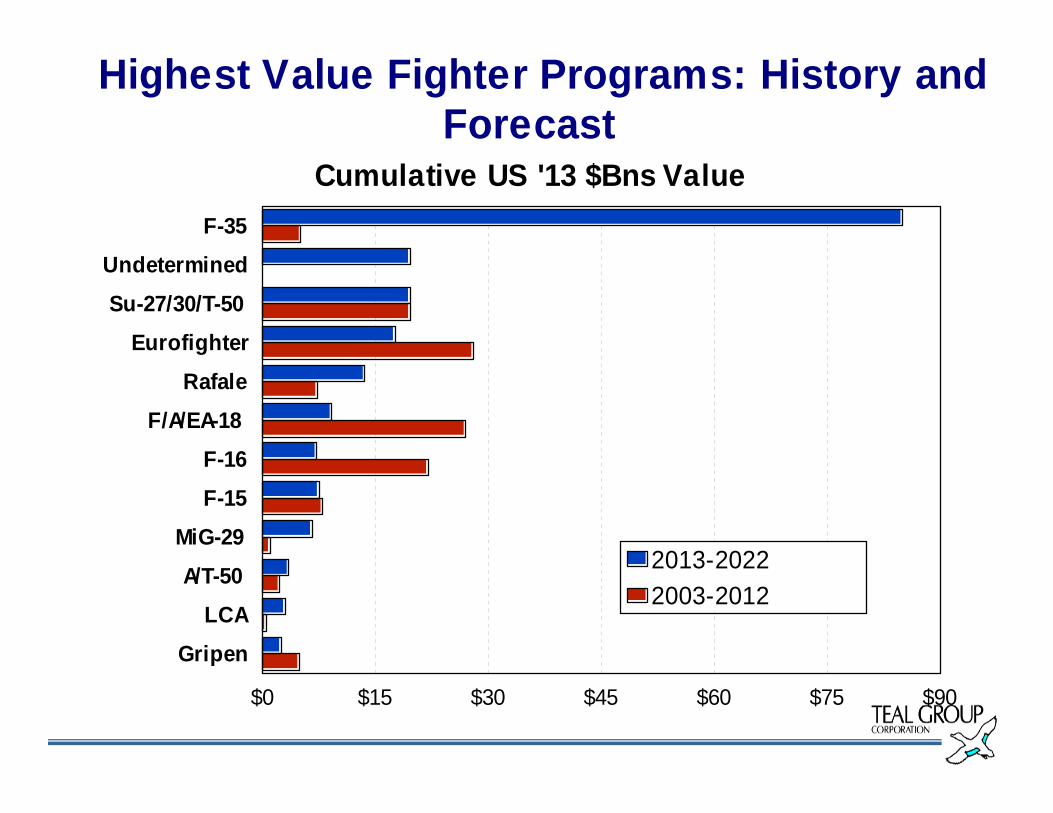
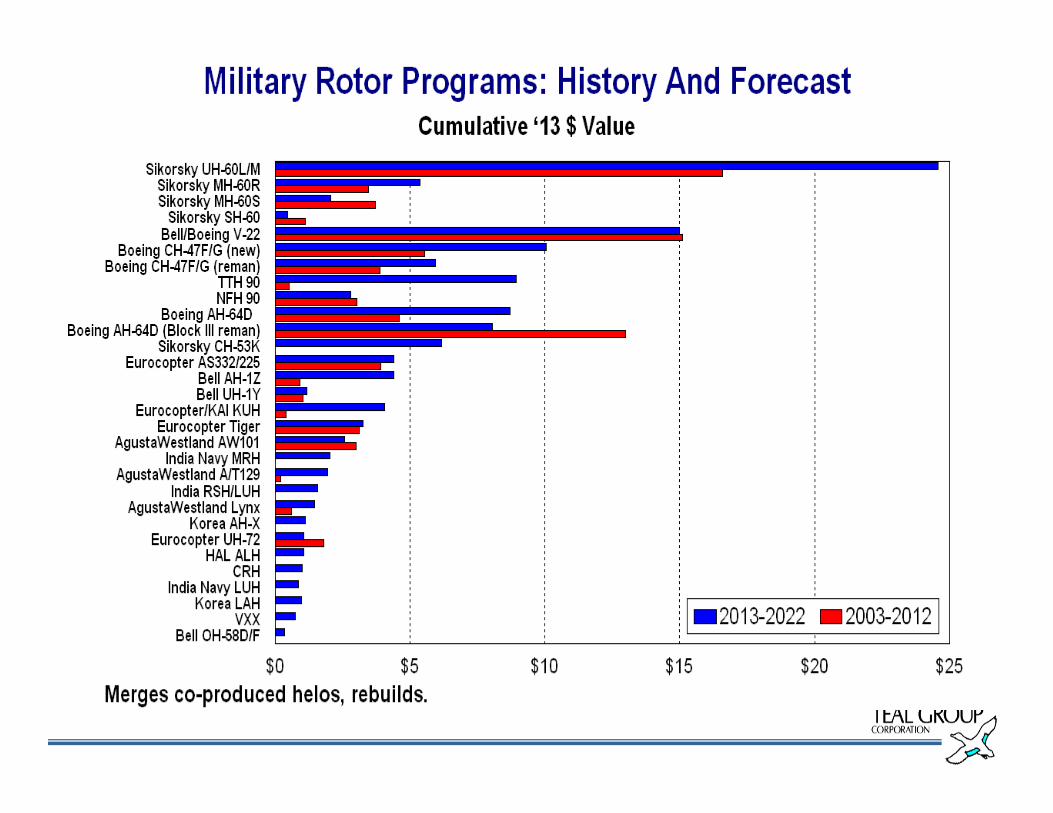
Highest Value Fighter Programs: History and Forecast
Cumulative US '13 $Bns ValueF-35
UndeterminedSu-27/30/T-50
EurofighterRafale
F/A/EA-18F-16F-15
MiG-29A/T-50
LCAGripen
$0 $15 $30 $45 $60 $75 $90
2013-20222003-2012
Page 12
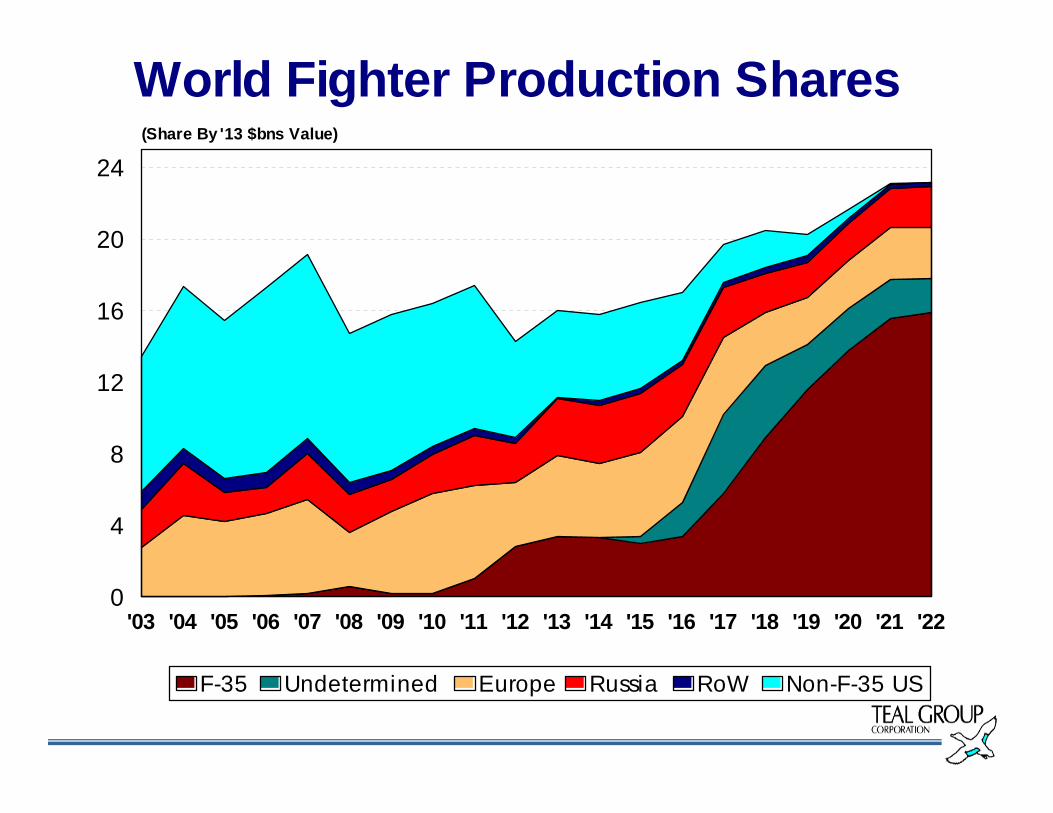
World Fighter Production Shares
'03 '04 '05 '06 '07 '08 '09 '10 '11 '12 '13 '14 '15 '16 '17 '18 '19 '20 '21 '220
4
8
12
16
20
24(Share By '13 $bns Value)
F-35 Undetermined Europe Russia RoW Non-F-35 US
Page 13
Highest Value Undetermined Fighter Competitions
Cumulative US '13 $ Bns Value Through 2022;Red Bars Are F-35-Addressable; All Others Exclude F-35
India (Rafale selected)
South Korea
UAE
Canada
Brazil
Kuwait
Australia
Malaysia
Greece
Qatar
$0 $3 $6 $9
Page 14
F-16 Deliveries: USAF And Export
190189180
5087
4824 12 6 6 3 1 7 4
70 7166
68
5894
52 69 98 102103
3823 24
57 7250
70 6628 39 23 26 38
'89 '90 '91 '92 '93 '94 '95 '96 '97 '98 '99 '00 '01 '02 '03 '04 '05 '06 '07 '08 '09 '10 '11 '120
50
100
150
200
250
USAF Export
Page 15
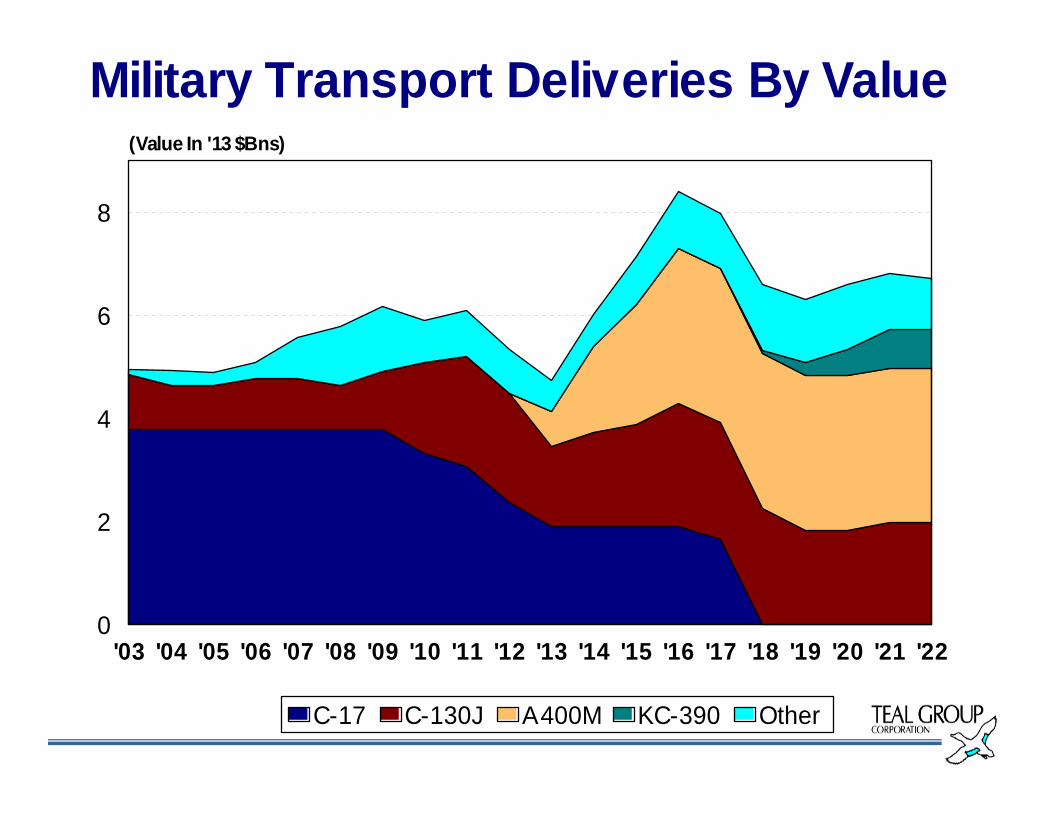
Military Transport Deliveries By Value
'03 '04 '05 '06 '07 '08 '09 '10 '11 '12 '13 '14 '15 '16 '17 '18 '19 '20 '21 '220
2
4
6
8
(Value In '13 $Bns)
C-17 C-130J A400M KC-390 Other
Page 16
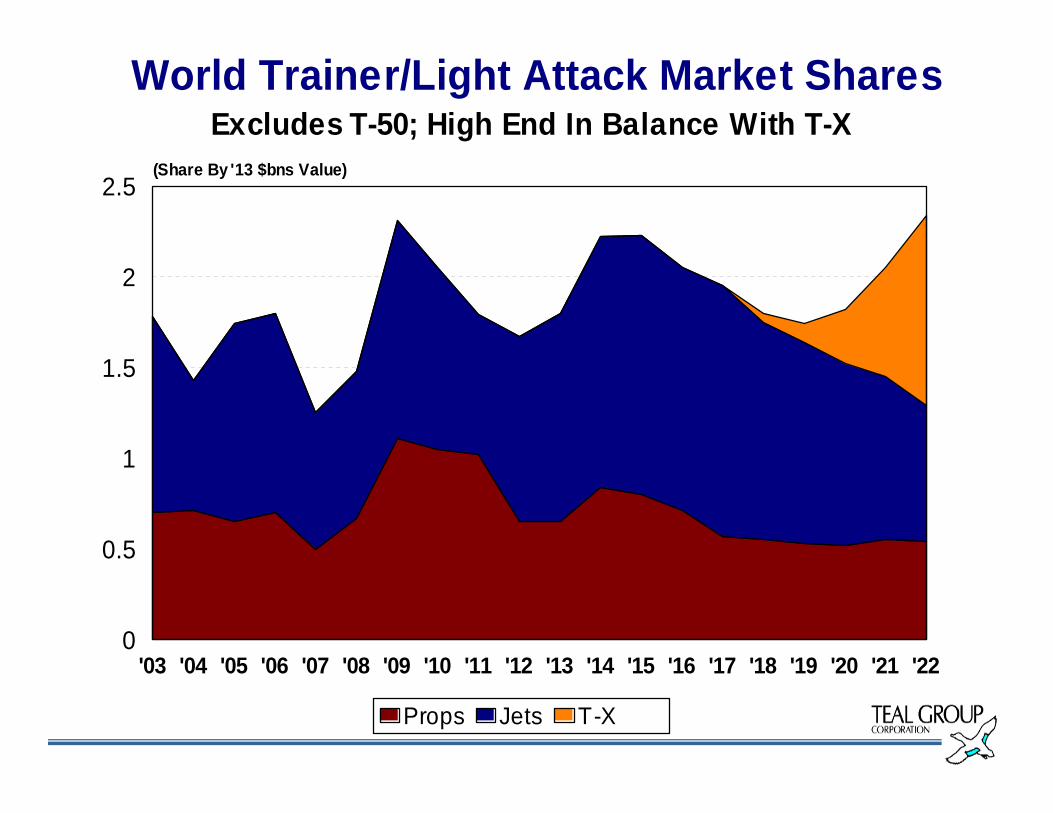
World Trainer/Light Attack Market SharesExcludes T-50; High End In Balance With T-X
'03 '04 '05 '06 '07 '08 '09 '10 '11 '12 '13 '14 '15 '16 '17 '18 '19 '20 '21 '220
0.5
1
1.5
2
2.5(Share By '13 $bns Value)
Props Jets T-X
Page 19
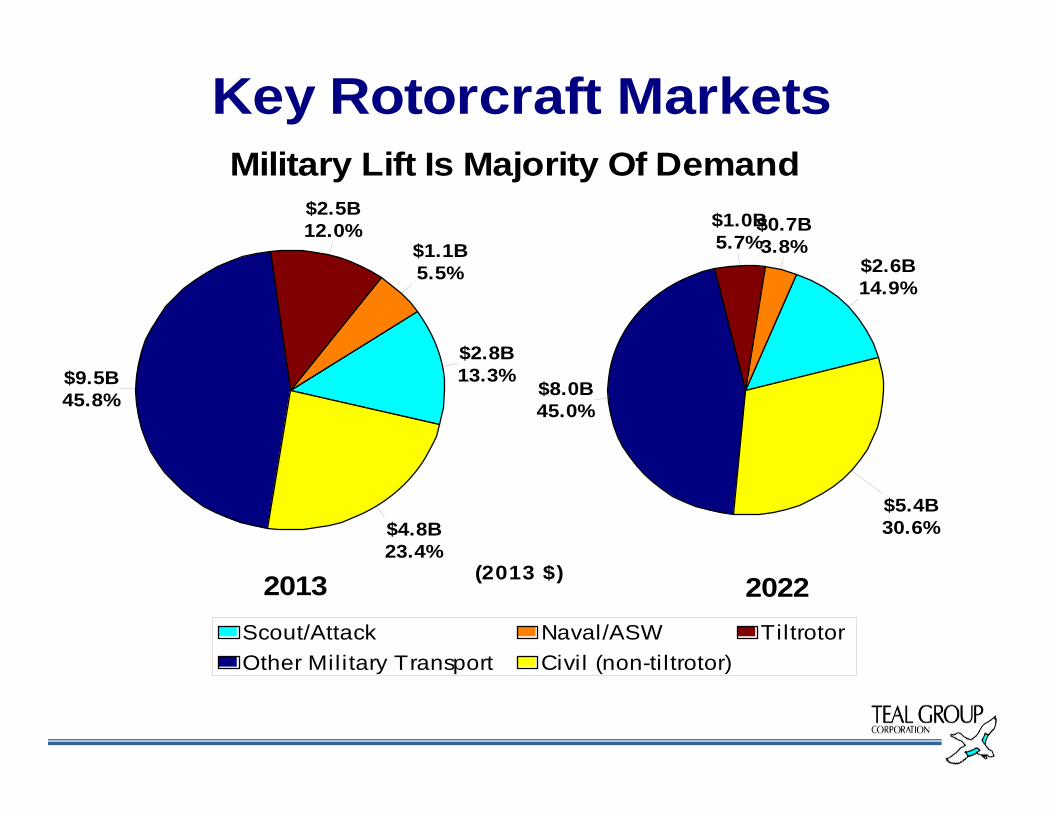
Key Rotorcraft MarketsMilitary Lift Is Majority Of Demand
(2013 $)
$2.8B13.3%
$1.1B5.5%
$2.5B12.0%
$9.5B45.8%
$4.8B23.4%
$2.6B14.9%
$0.7B3.8%
$1.0B5.7%
$8.0B45.0%
$5.4B30.6%
Scout/Attack Naval/ASW TiltrotorOther Military Transport Civil (non-tiltrotor)
20222013
Page 23
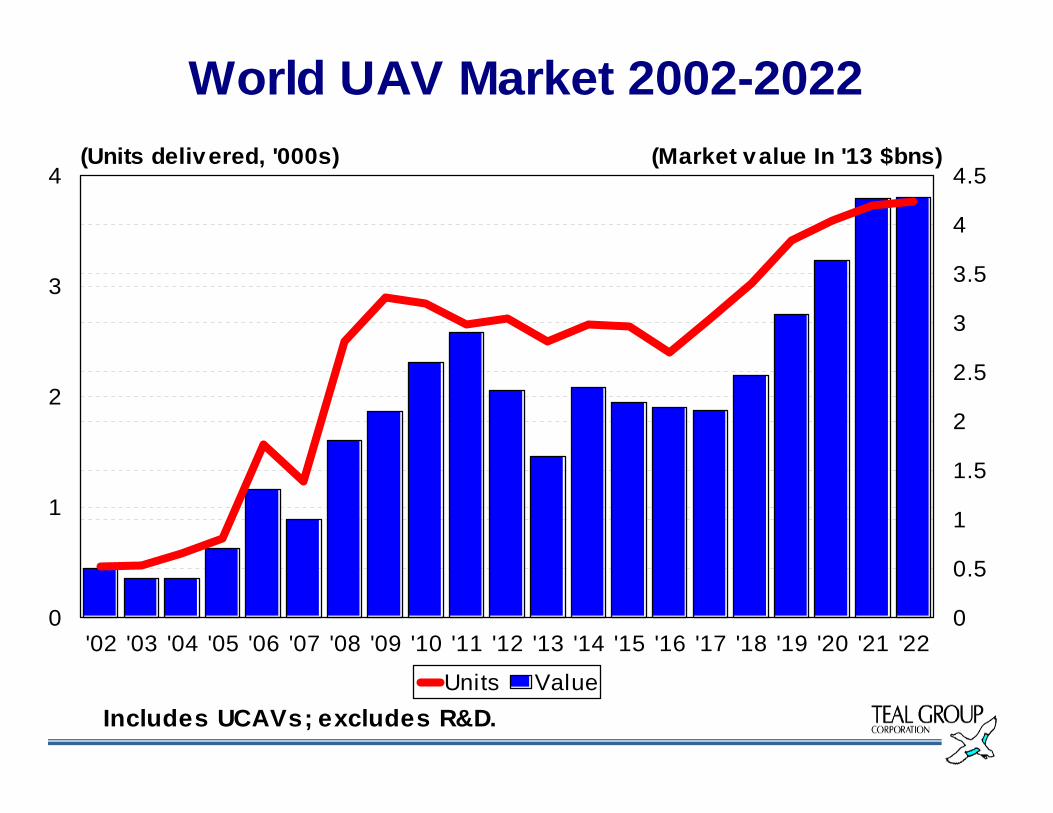
World UAV Market 2002-2022
Includes UCAVs; excludes R&D.
'02 '03 '04 '05 '06 '07 '08 '09 '10 '11 '12 '13 '14 '15 '16 '17 '18 '19 '20 '21 '220
1
2
3
4(Units delivered, '000s)
0
0.5
1
1.5
2
2.5
3
3.5
4
4.5(Market value In '13 $bns)
Units Value
Page 24
Missile/Munition/UAV Forecast
'04 '05 '06 '07 '08 '09 '10 '11 '12 '13 '14 '15 '16 '17 '18 '19 '20 '21 '220
4
8
12
16
20(Market value in '13 $Bns)
AAM ASM ADM ATMAnti-Ship SSM Smart munitions UAVs
Page 25
The Commercial Market
Page 26
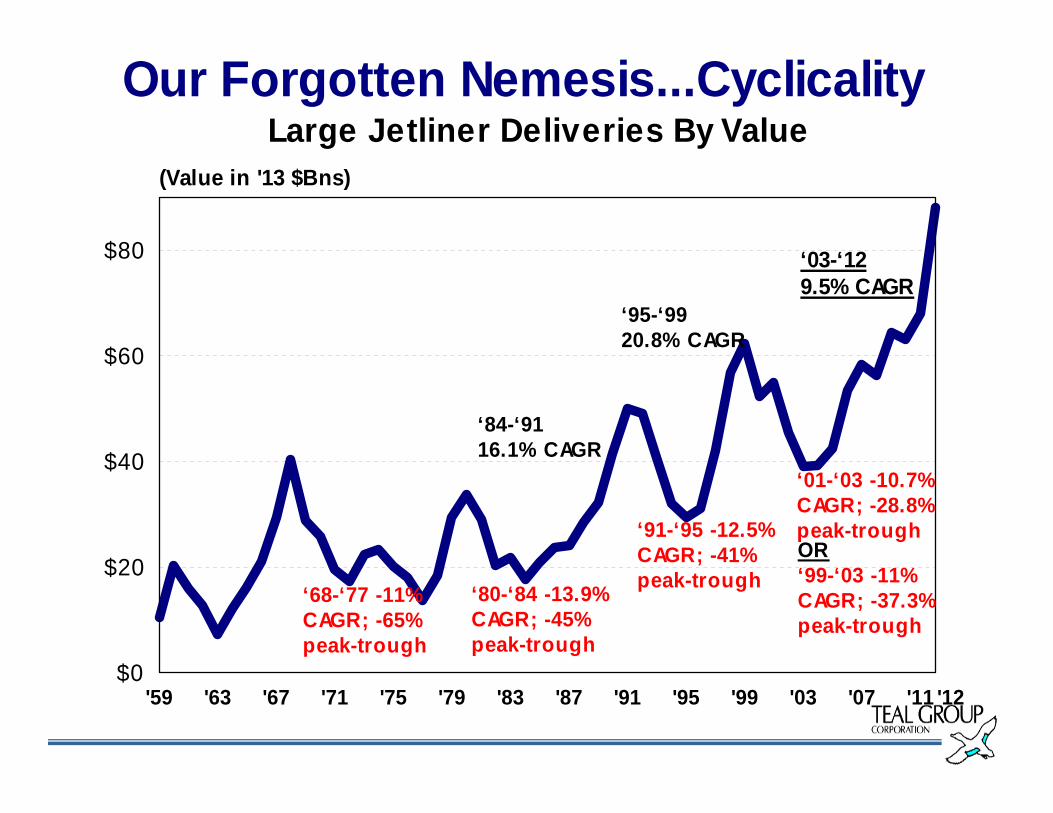
Our Forgotten Nemesis...CyclicalityLarge Jetliner Deliveries By Value
'59 '63 '67 '71 '75 '79 '83 '87 '91 '95 '99 '03 '07 '11 '12$0
$20
$40
$60
$80
(Value in '13 $Bns)
‘01-‘03 -10.7% CAGR; -28.8% peak-trough‘91-‘95 -12.5%
CAGR; -41% peak-trough‘80-‘84 -13.9%
CAGR; -45% peak-trough
‘68-‘77 -11% CAGR; -65% peak-trough
‘84-‘9116.1% CAGR
‘95-‘9920.8% CAGR
‘03-‘129.5% CAGR
OR‘99-‘03 -11% CAGR; -37.3% peak-trough
Page 27
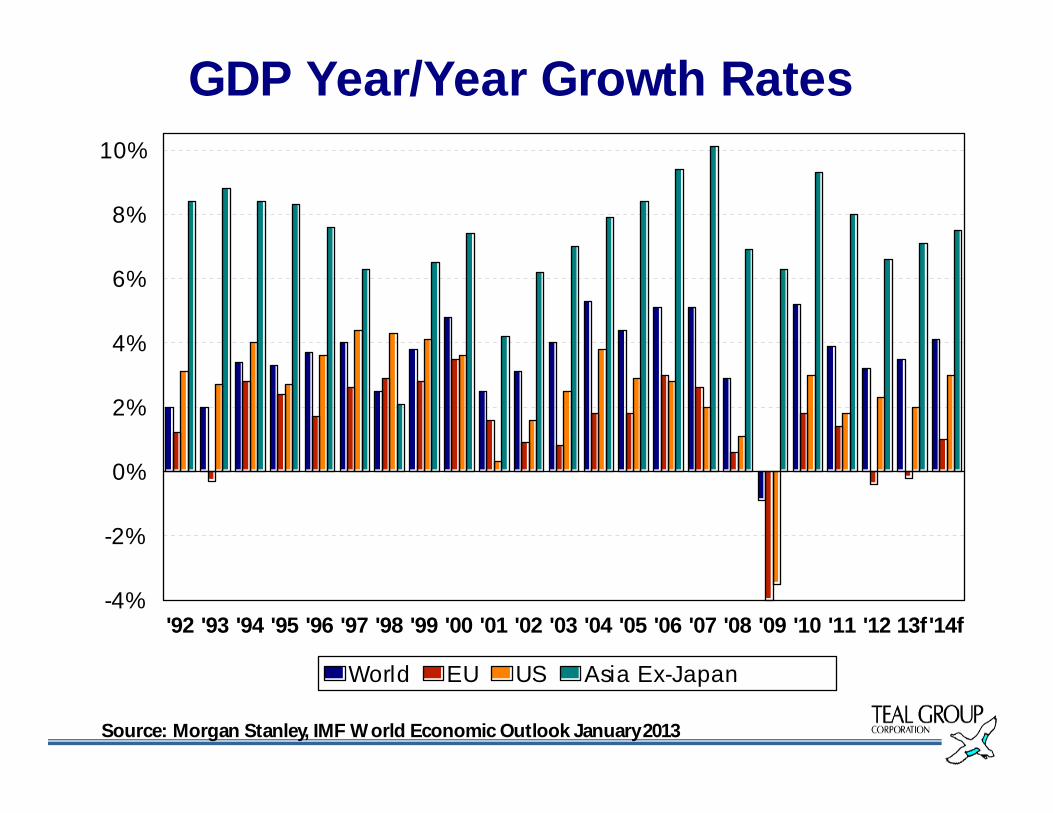
GDP Year/Year Growth Rates
Source: Morgan Stanley, IMF W orld Economic Outlook January 2013
'92 '93 '94 '95 '96 '97 '98 '99 '00 '01 '02 '03 '04 '05 '06 '07 '08 '09 '10 '11 '12 13f'14f
0%
2%
4%
6%
8%
10%
-2%
-4%
World EU US Asia Ex-Japan
Page 28
Y/Y Traffic: Recovery Stalls; Cargo A Concern2012 Totals; RPKs 5.3%, ASKs 3.9%, FTKs -1.5%;
2011: RPKs 6.9%, ASKs 8.2%, FTKs -0.6%
Source: IATA
Jul '0
8SepNov
Jan '0
9MarMay Ju
lSepNov
Jan '1
0MarMay Ju
lSepNov
Jan '1
1MarMay Ju
lSepNov
Jan '1
2MarMay Ju
lSepNov
Jan '1
3Feb
0%
10%
20%
30%
-10%
-20%
RPKs ASKs FTKs
Page 29
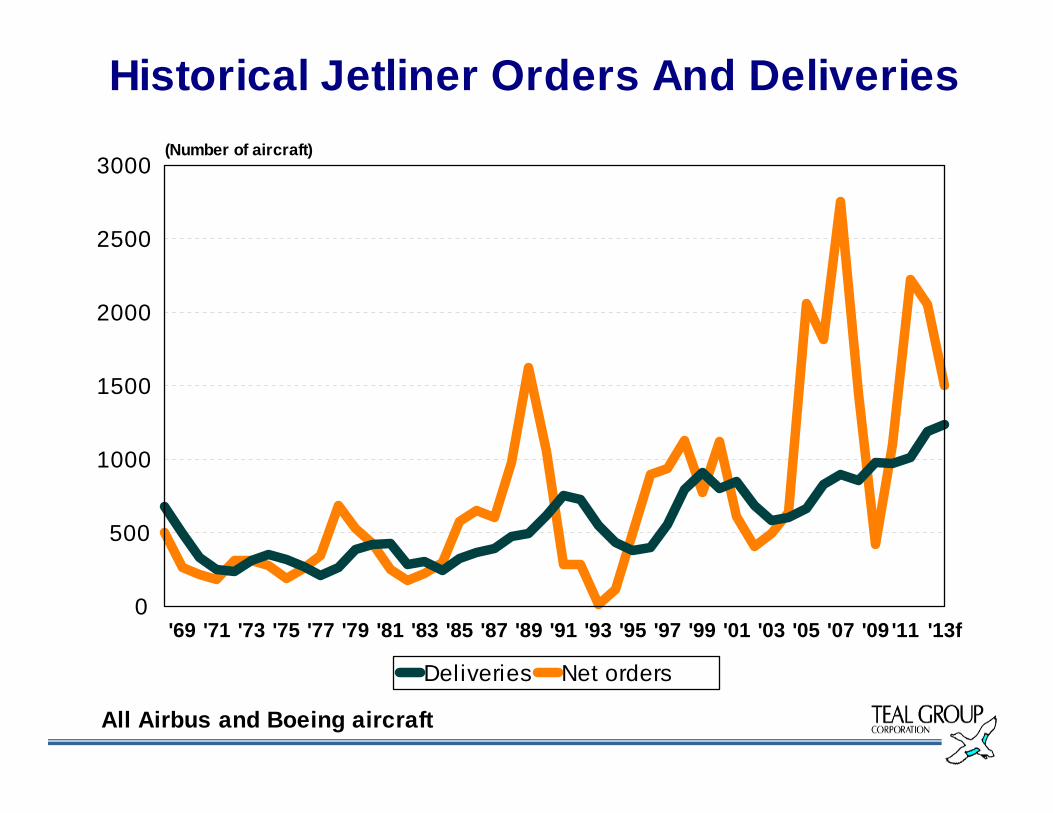
Historical Jetliner Orders And Deliveries
All Airbus and Boeing aircraft
'69 '71 '73 '75 '77 '79 '81 '83 '85 '87 '89 '91 '93 '95 '97 '99 '01 '03 '05 '07 '09 '11 '13f0
500
1000
1500
2000
2500
3000(Number of aircraft)
Deliveries Net orders
Page 30
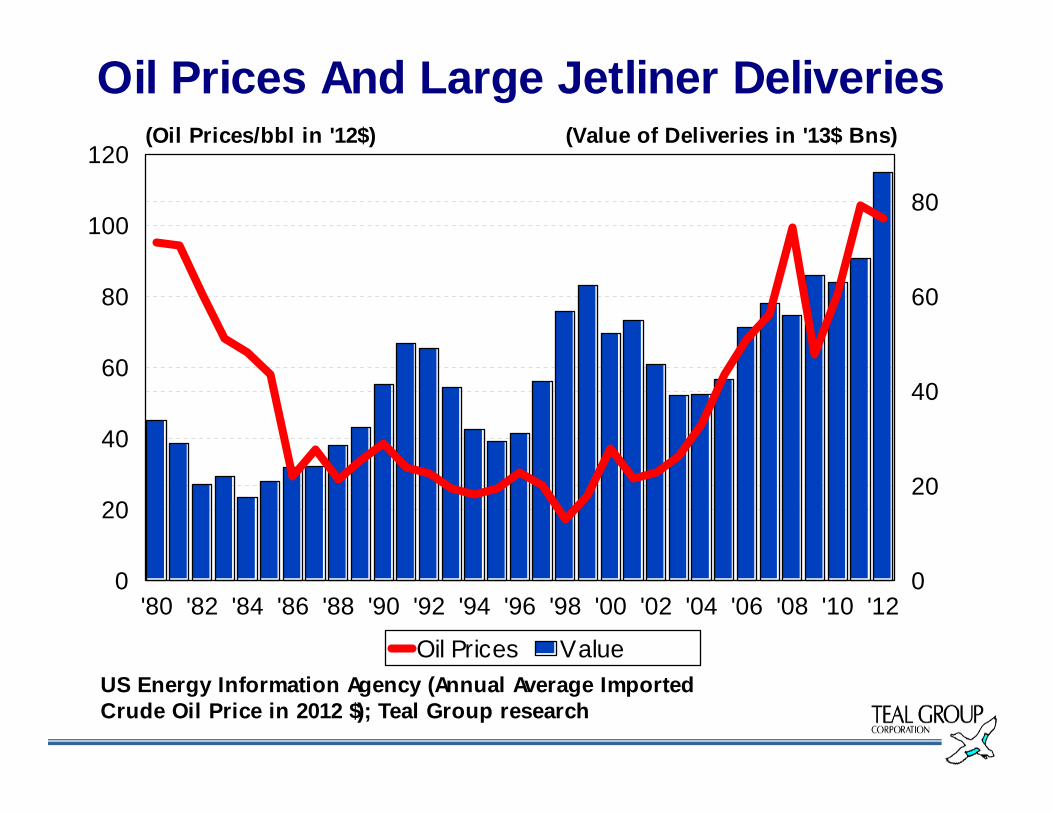
Oil Prices And Large Jetliner Deliveries
US Energy Information Agency (Annual Average Imported Crude Oil Price in 2012 $); Teal Group research
'80 '82 '84 '86 '88 '90 '92 '94 '96 '98 '00 '02 '04 '06 '08 '10 '120
20
40
60
80
100
120(Oil Prices/bbl in '12$)
0
20
40
60
80
(Value of Deliveries in '13$ Bns)
Oil Prices Value
Page 31
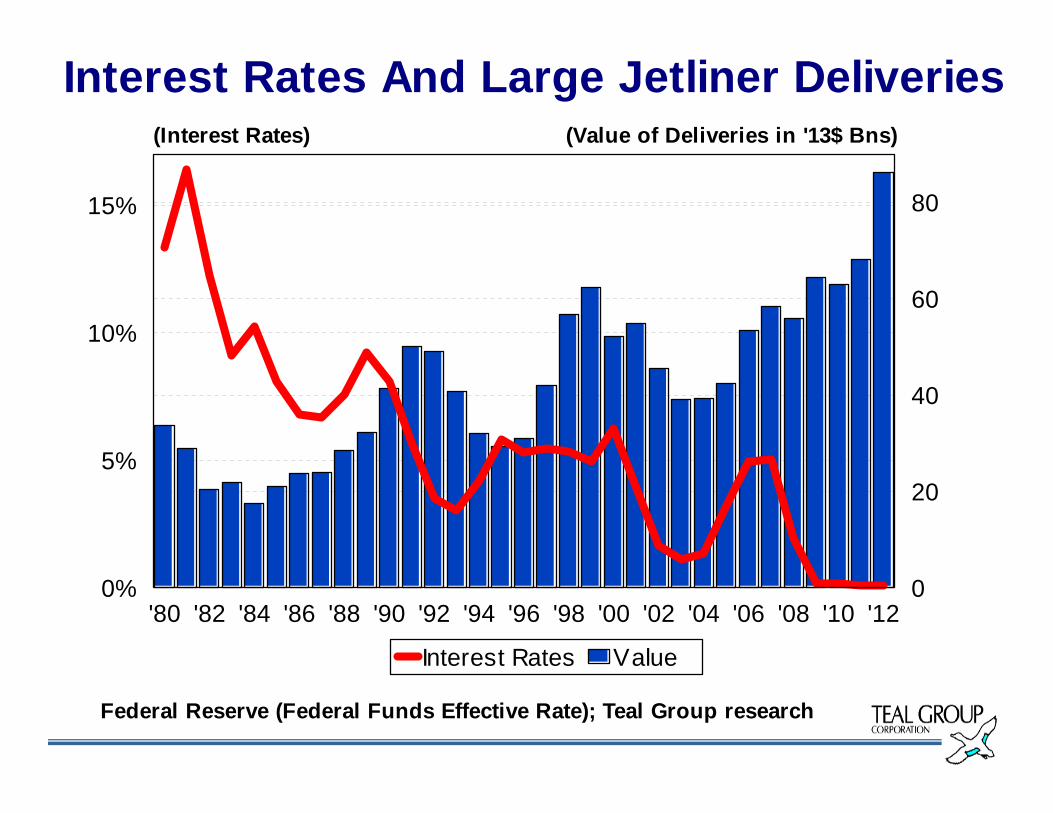
Interest Rates And Large Jetliner Deliveries
Federal Reserve (Federal Funds Effective Rate); Teal Group research
'80 '82 '84 '86 '88 '90 '92 '94 '96 '98 '00 '02 '04 '06 '08 '10 '120%
5%
10%
15%
(Interest Rates)
0
20
40
60
80
(Value of Deliveries in '13$ Bns)
Interest Rates Value
Page 32
Oil Prices And Interest Rates
'80 '82 '84 '86 '88 '90 '92 '94 '96 '98 '00 '02 '04 '06 '08 '10 '12f
0
20
40
60
80
100
120(Oil Prices/bbl in '12$)
0%
5%
10%
15%
20%(Interest Rates)
Oil Prices Interest Rates
Page 33
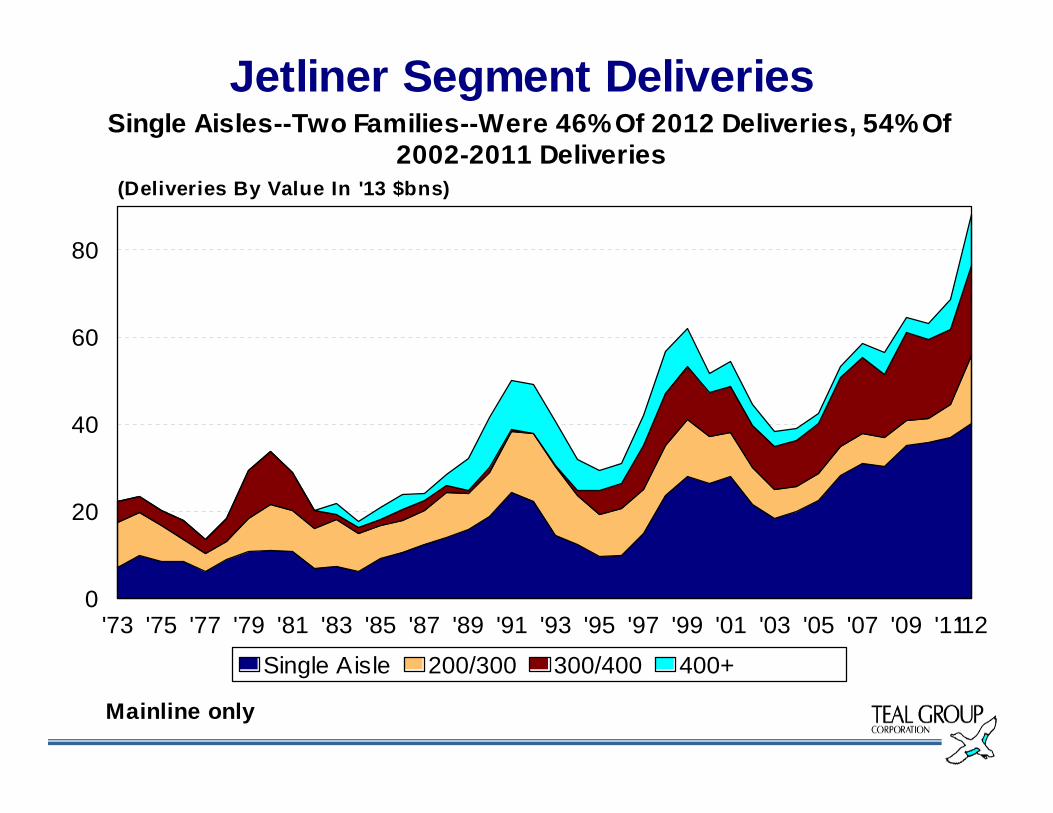
Jetliner Segment DeliveriesSingle Aisles--Two Families--Were 46% Of 2012 Deliveries, 54% Of
2002-2011 Deliveries
Mainline only
'73 '75 '77 '79 '81 '83 '85 '87 '89 '91 '93 '95 '97 '99 '01 '03 '05 '07 '09 '11'120
20
40
60
80
(Deliveries By Value In '13 $bns)
Single Aisle 200/300 300/400 400+
Page 34
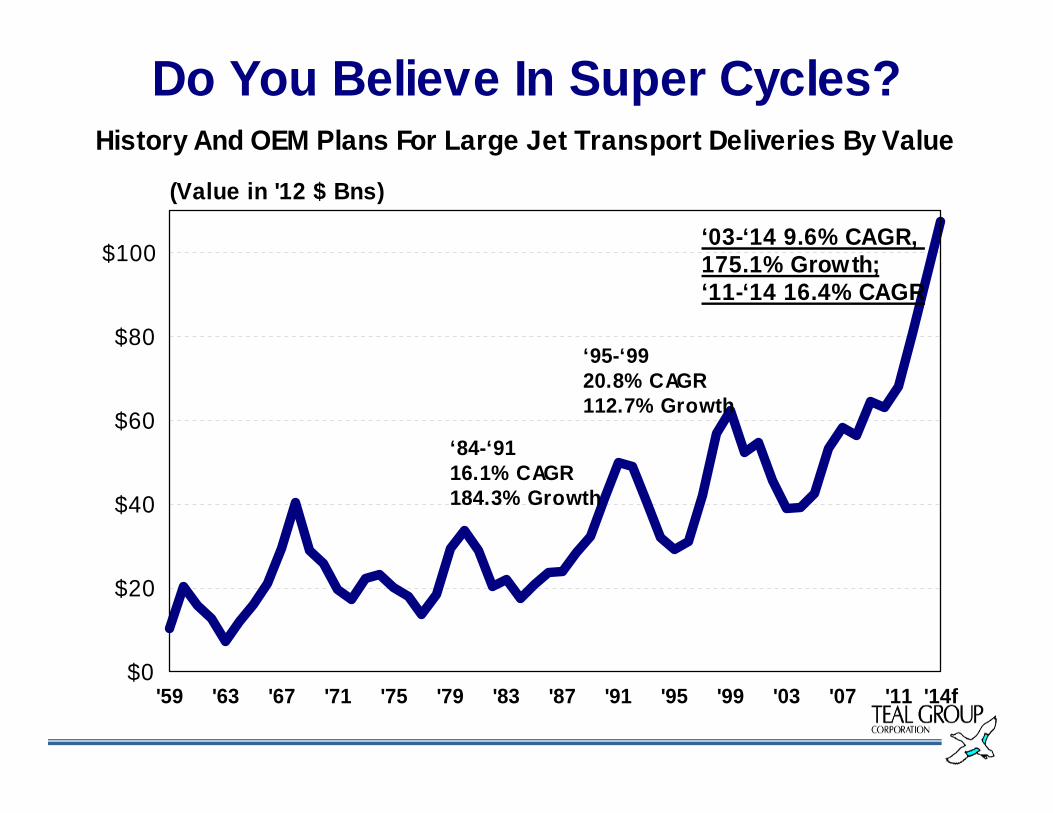
Do You Believe In Super Cycles?History And OEM Plans For Large Jet Transport Deliveries By Value
'59 '63 '67 '71 '75 '79 '83 '87 '91 '95 '99 '03 '07 '11 '14f$0
$20
$40
$60
$80
$100
(Value in '12 $ Bns)
‘84-‘9116.1% CAGR184.3% Growth
‘95-‘9920.8% CAGR112.7% Growth
‘03-‘14 9.6% CAGR, 175.1% Growth;‘11-‘14 16.4% CAGR
Page 35
Commercial Jetliners History And ForecastDangerous Words: It Really Is Different This Time
Airbus, Boeing, CSeries, C919 only; includes KC-46
'03 '04 '05 '06 '07 '08 '09 '10 '11 '12 '13 '14 '15 '16 '17 '18 '19 '20 '21 '220
200
400
600
800
1,000
1,200
1,400
(Units Delivered)
0
20
40
60
80
100
120(Market Value in '13$ Bns)
Units Value
To Drop SA Rates Or Drop Prices?
Page 36
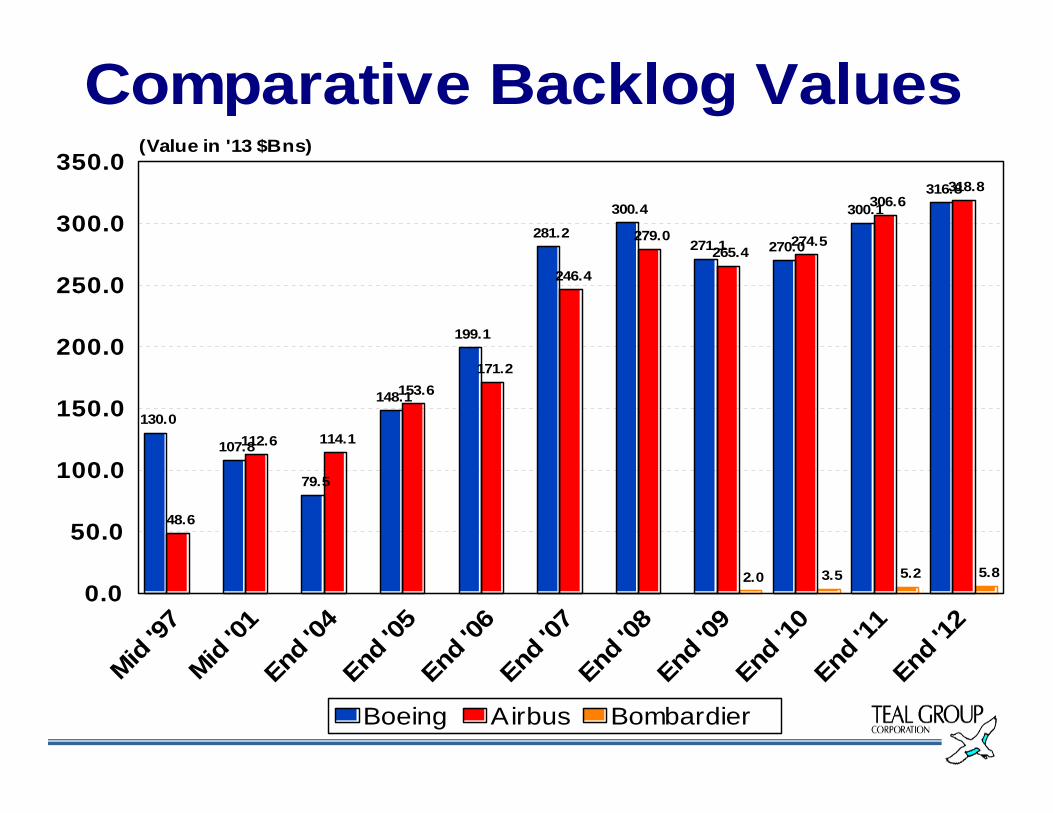
Comparative Backlog Values
130.0
107.8
79.5
148.1
199.1
281.2
300.4
271.1 270.0
300.1 316.8
48.6
112.6 114.1
153.6 171.2
246.4
279.0 265.4
274.5
306.6 318.8
2.0 3.5 5.2 5.8
Mid '97
Mid '01
End '0
4
End '0
5
End '0
6
End '0
7
End '0
8
End '0
9
End '1
0
End '1
1
End '1
2 0.0
50.0
100.0
150.0
200.0
250.0
300.0
350.0(Value in '13 $Bns)
Boeing Airbus Bombardier
Page 37
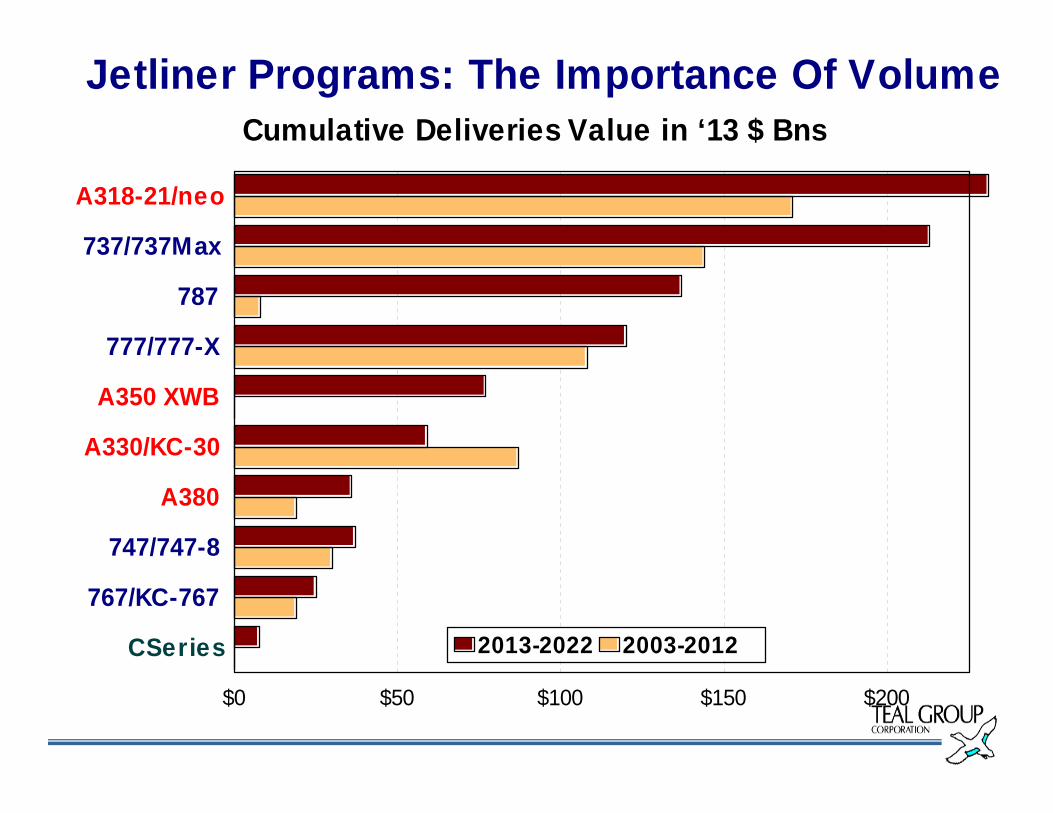
Jetliner Programs: The Importance Of VolumeCumulative Deliveries Value in ‘13 $ Bns
A318-21/neo
737/737Max
787
777/777-X
A350 XWB
A330/KC-30
A380
747/747-8
767/KC-767
CSeries
$0 $50 $100 $150 $200
2013-2022 2003-2012
Page 38
Market Share Outlook By Deliveries ValueThe Duopoly Endures
'78 '80 '82 '84 '86 '88 '90 '92 '94 '96 '98 '00 '02 '04 '06 '08 '10 '12 '14 '16 '18 '20 '220
20
40
60
80
100
(Value in '13 $Bns)
Boeing Airbus Douglas/Lockheed Bombardier/COMAC
Page 39
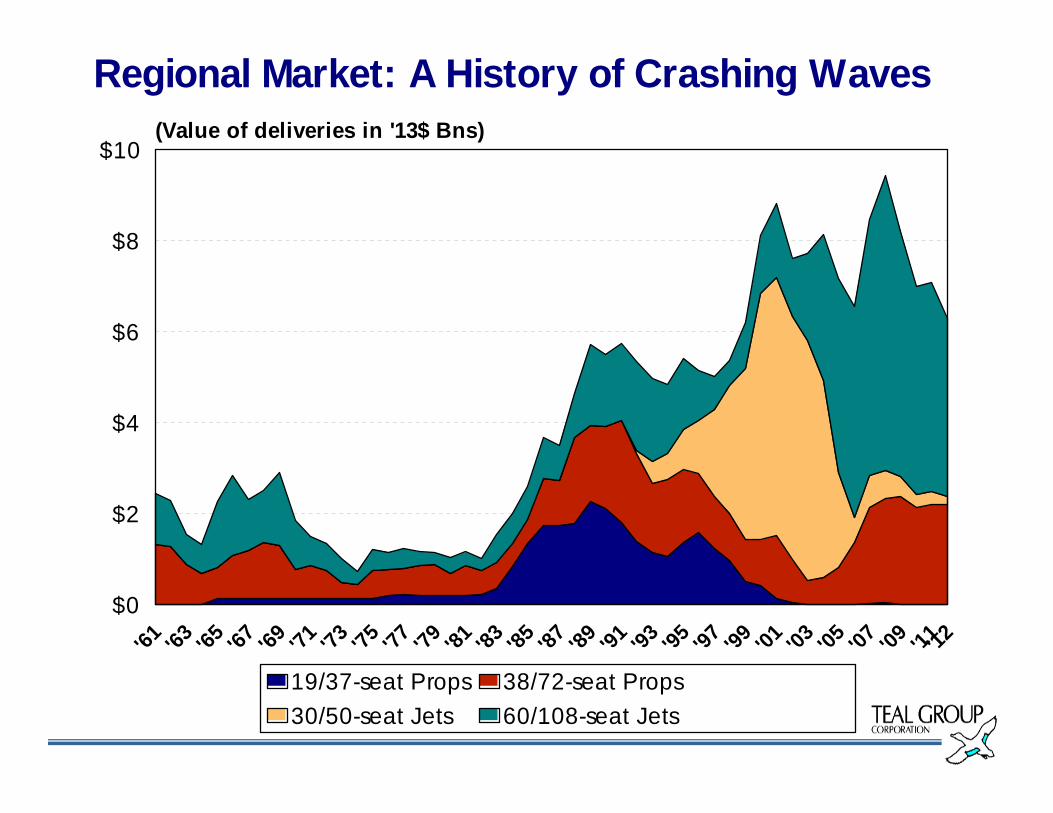
Regional Market: A History of Crashing Waves
'61 '63 '65 '67 '69 '71 '73 '75 '77 '79 '81 '83 '85 '87 '89 '91 '93 '95 '97 '99 '01 '03 '05 '07 '09 '11'12$0
$2
$4
$6
$8
$10(Value of deliveries in '13$ Bns)
19/37-seat Props 38/72-seat Props30/50-seat Jets 60/108-seat Jets
Page 40
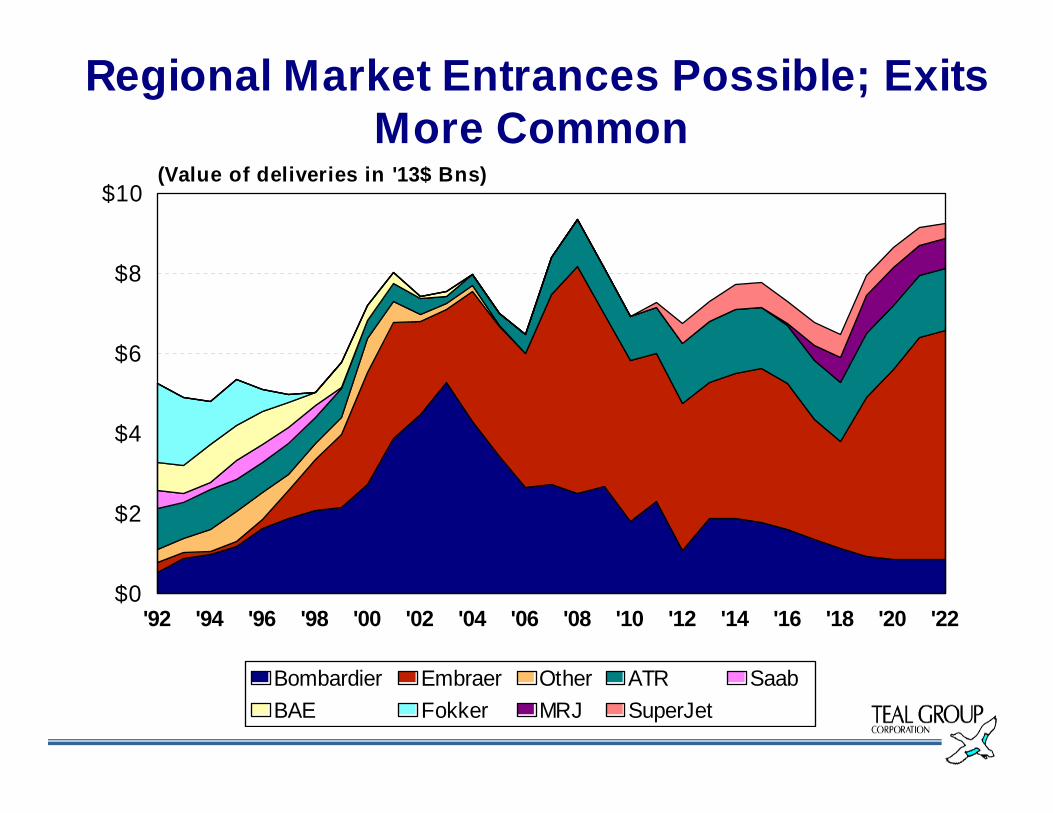
Regional Market Entrances Possible; Exits More Common
'92 '94 '96 '98 '00 '02 '04 '06 '08 '10 '12 '14 '16 '18 '20 '22$0
$2
$4
$6
$8
$10(Value of deliveries in '13$ Bns)
Bombardier Embraer Other ATR SaabBAE Fokker MRJ SuperJet
Page 41
Business Aircraft
Page 42
Business Aircraft Deliveries And Corporate Profits
Source: US BEA, Teal Group Research
'64 '66 '68 '70 '72 '74 '76 '78 '80 '82 '84 '86 '88 '90 '92 '94 '96 '98 '00 '02 '04 '06 '08 '10 '120
500
1,000
1,500
2,000
(Corp. Profits in $ Bns)
0
5
10
15
20
25
30(Deliveries -'13 $Bns)
Corporate Prof its Value of Deliveries
Page 43
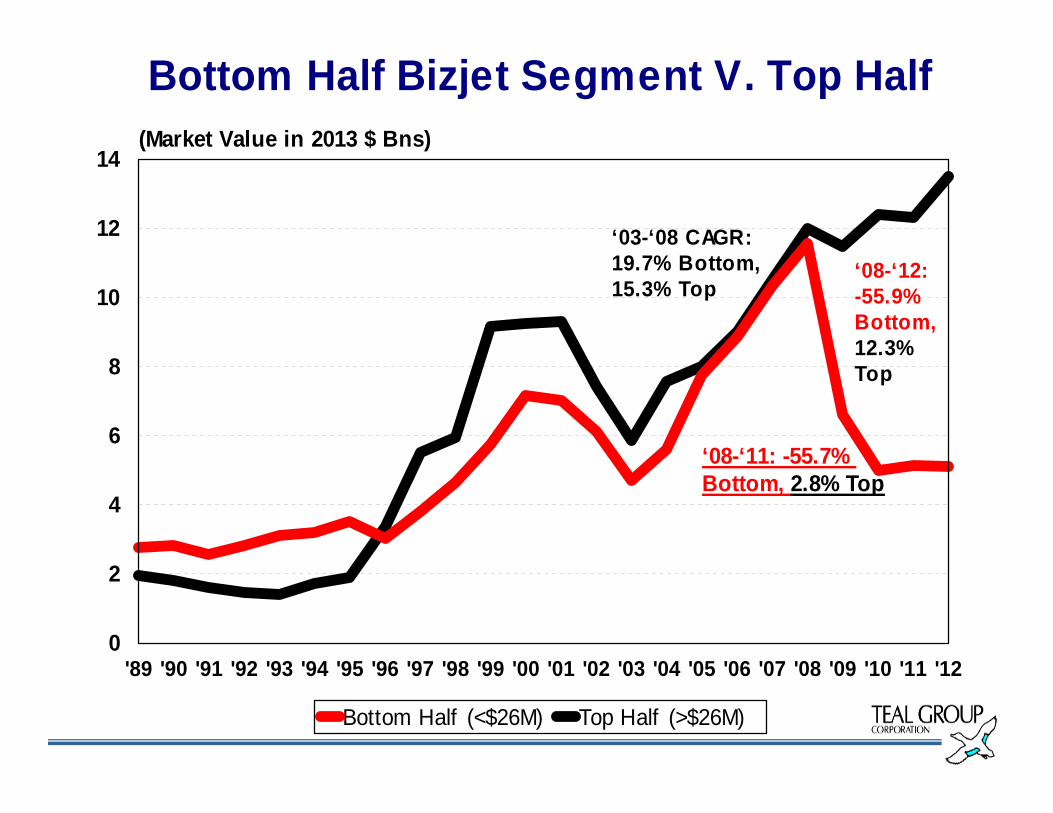
Bottom Half Bizjet Segment V. Top Half
'89 '90 '91 '92 '93 '94 '95 '96 '97 '98 '99 '00 '01 '02 '03 '04 '05 '06 '07 '08 '09 '10 '11 '120
2
4
6
8
10
12
14(Market Value in 2013 $ Bns)
Bottom Half (<$26M) Top Half (>$26M)
‘03-‘08 CAGR: 19.7% Bottom, 15.3% Top
‘08-‘12: -55.9% Bottom, 12.3% Top
‘08-‘11: -55.7% Bottom, 2.8% Top
Page 44
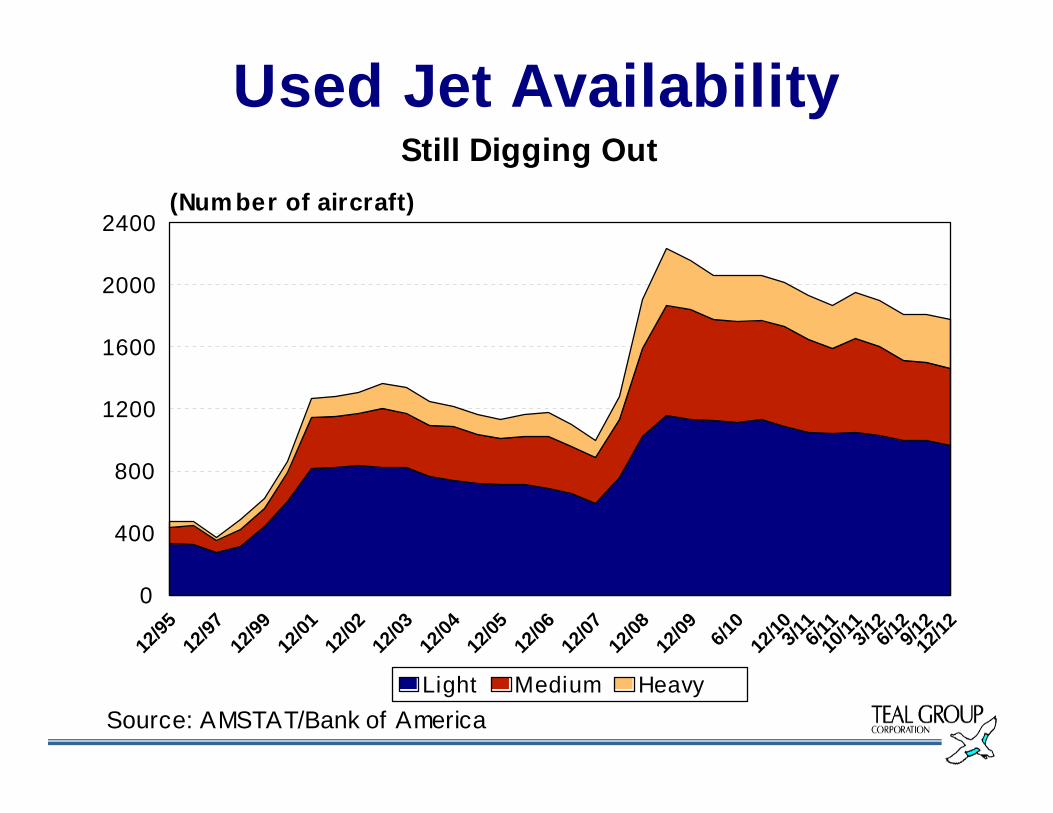
Used Jet AvailabilityStill Digging Out
Source: AMSTAT/Bank of America
12/95
12/97
12/99
12/01
12/02
12/03
12/04
12/05
12/06
12/07
12/08
12/09 6/1
012
/103/116/1
110
/113/126/1
29/1
212
/120
400
800
1200
1600
2000
2400(Num ber of aircraft)
Light Medium Heavy
Page 45
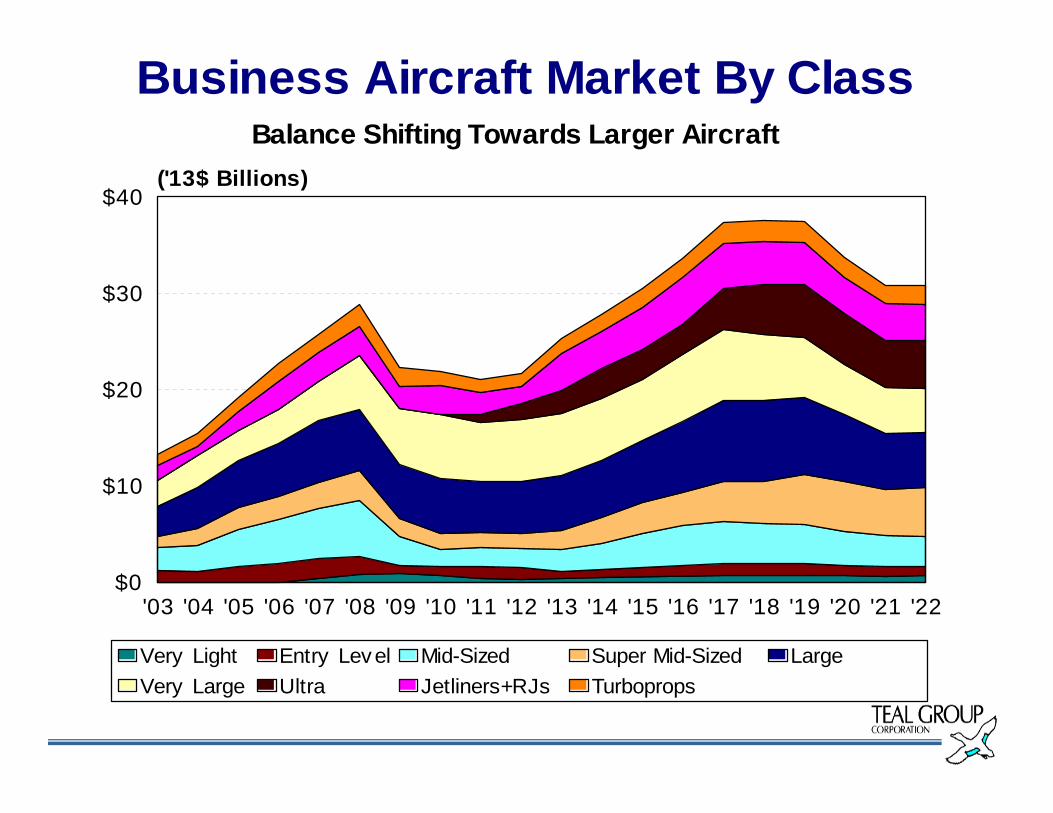
Business Aircraft Market By ClassBalance Shifting Towards Larger Aircraft
'03 '04 '05 '06 '07 '08 '09 '10 '11 '12 '13 '14 '15 '16 '17 '18 '19 '20 '21 '22$0
$10
$20
$30
$40('13$ Billions)
Very Light Entry Level Mid-Sized Super Mid-Sized LargeVery Large Ultra Jetliners+RJs Turboprops
Page 46
Top 20 Aviation Programs: Volume MattersCumulative Deliveries Value in ‘13 $ Bns
Airbus A320/NeoBoeing 737NG/MAX
Boeing 787Boeing 777
Lockheed F-35Airbus A350XWB
Airbus A330Bombardier Global
Embraer E-JetsBoeing 777-X
Boeing 747Airbus A380
Sikorsky H-60Gulfstream 650
Airbus A400MBoeing 767/KC-46
Gulfstream 550Lockheed C-130J
Gulfstream 450/P42Eurofighter
$0 $60 $120 $180 $240
2013-2022 2003-2012
Page 47
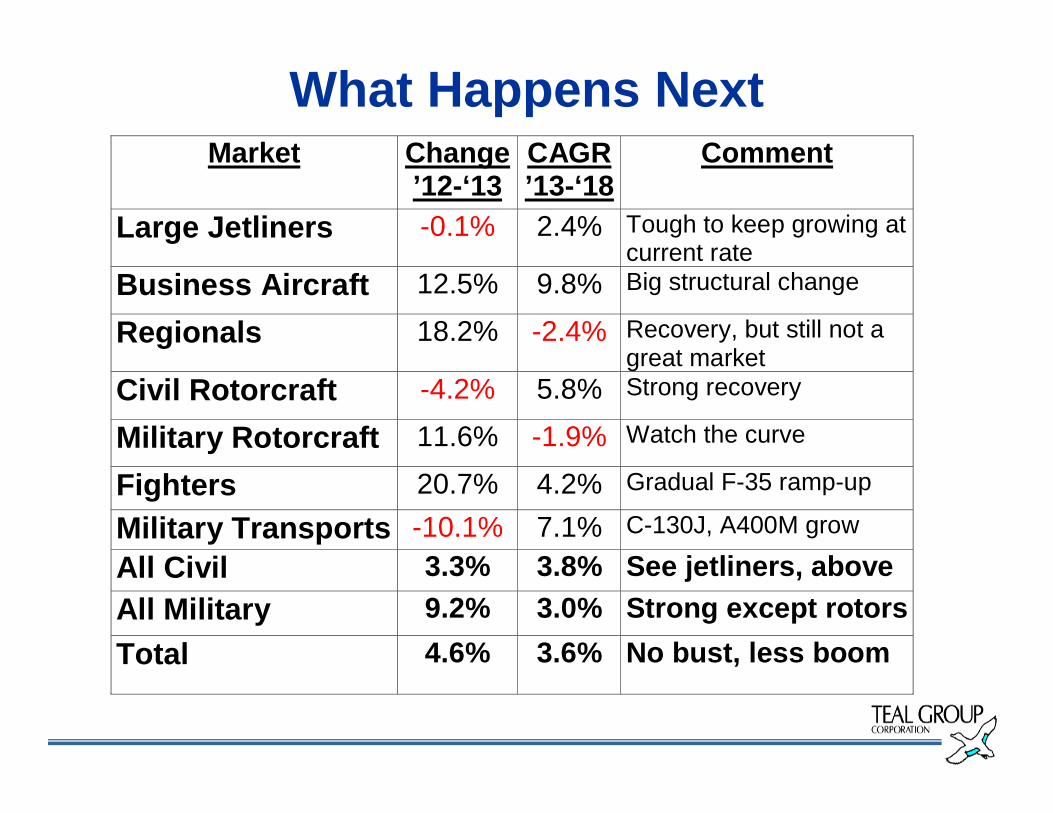
What Happens NextMarket Change
’12-‘13CAGR ’13-‘18
Comment
Large Jetliners -0.1% 2.4% Tough to keep growing at current rate
Business Aircraft 12.5% 9.8% Big structural change
Regionals 18.2% -2.4% Recovery, but still not a great market
Civil Rotorcraft -4.2% 5.8% Strong recovery
Military Rotorcraft 11.6% -1.9% Watch the curve
Fighters 20.7% 4.2% Gradual F-35 ramp-up
Military Transports -10.1% 7.1% C-130J, A400M grow
All Civil 3.3% 3.8% See jetliners, above All Military 9.2% 3.0% Strong except rotorsTotal 4.6% 3.6% No bust, less boom
Page 48
Aircraft Production 2003-2022Largely Sheltered From The Storm; Long-Term Growth, Too
'03 '04 '05 '06 '07 '08 '09 '10 '11 '12 '13 '14 '15 '16 '17 '18 '19 '20 '21 '220
40
80
120
160
200(Market Value in '13 $ Bns)
Fighters Business Aircraft RotorcraftMi l i taryTransports/Trainers/Other Jetl iners/Regional AC