NASA Contractor Report 165928 AIRCRAFT SURFACE COATINGS ENERGY EFFICIENT TRANSPORT PROGRAM BOEING COMMERCIAL AIRPLANE COMPANY P.O. BOX 3707, SEATTLE, WA 98124 Contract NAS!-15325, Task 4.4 • A._ ¢'b ,,_ National Aeronautics and Space Administration Langley Research Center Hampton, Virginia 23665 https://ntrs.nasa.gov/search.jsp?R=19840020709 2020-04-30T11:15:28+00:00Z
BOEING COMMERCIAL AIRPLANE COMPANYP.O. BOX 3707, SEATTLE, WA 98124
Contract NAS1-15325, Task 4.4
June 1982
325
1or
ese
t-
National Aeronauhcs andSpace Administration
Langley Research CenterHampton, VirgLn_a23665
FOREWORD
This is tl_e final report on surface coatings work accomplished under Task 4.4, Air-craft Surface Coatings_ Contract NASI-1532L This task is a continuation of workinitiated under Contract NASI-I#7#2 and reported in documents CR 158954 and CR159288.
Technical investigations were conducted from 3anuary 1980 to February 1982.D. B. Middleton, in the Aircraft Energy Efficiency Project Office (ACEEPO), LangleyResearch Center, was the NASA technical monitor. The work was done by thePreliminary Design department of the Vice President-Engineering organization,Boeing Commercial Airplane Company, and by Avco Systems Division, as a majorsubcontractor. Participating personnel were:
Boeing Avco
G. W. Hanks
Program ManagerH. R. Gelbach
Syste ms TechnologyR. M. Rouleau
Project Manager
R. L. KreitingerProject Manager
D. George-FalvyAerodynamics Technology
L. R. ElviganMaterials Technology
3. S. KautzkyEconomic Analysis
M. 3. Omoth
Systems Technology
Special acknowledgement is given to Dennis Parks and 3eff Swindells of Conti-nental Airlines and to Ralph Stockton and Ed Robertson of Delta Air Lines for theircooperation in managing and reporting the flight service evaluations for theirrespective airlines.
The project is indebted to 3im Hall of the NASA-Langley Terminal ConfiguredVehicle Project Office (TCVPO) and the personnel who participated in the dragmeasurement flight tests for their expertise and total cooperation.
Principal measurements and calculations used during this study were in customaryunits.
B,0 ABBREVIATIONS AND SYMBOLS ...............................
4.0 STUDY RESULTS .............................................
4.1 Drag Measurement Test ...................................4.1.1 Test Description ..................................4.1,2 Test Results .....................................4. I. 3 Conclusions ......................................
4.2 Flight Service Evaluations .................................4,2.1 Continental Airlines Evaluation .....................4,2.2 Delta Air Lines Evaluation .........................4,2,3 Conclusions ......................................
Summary of Icing Tests .....................................
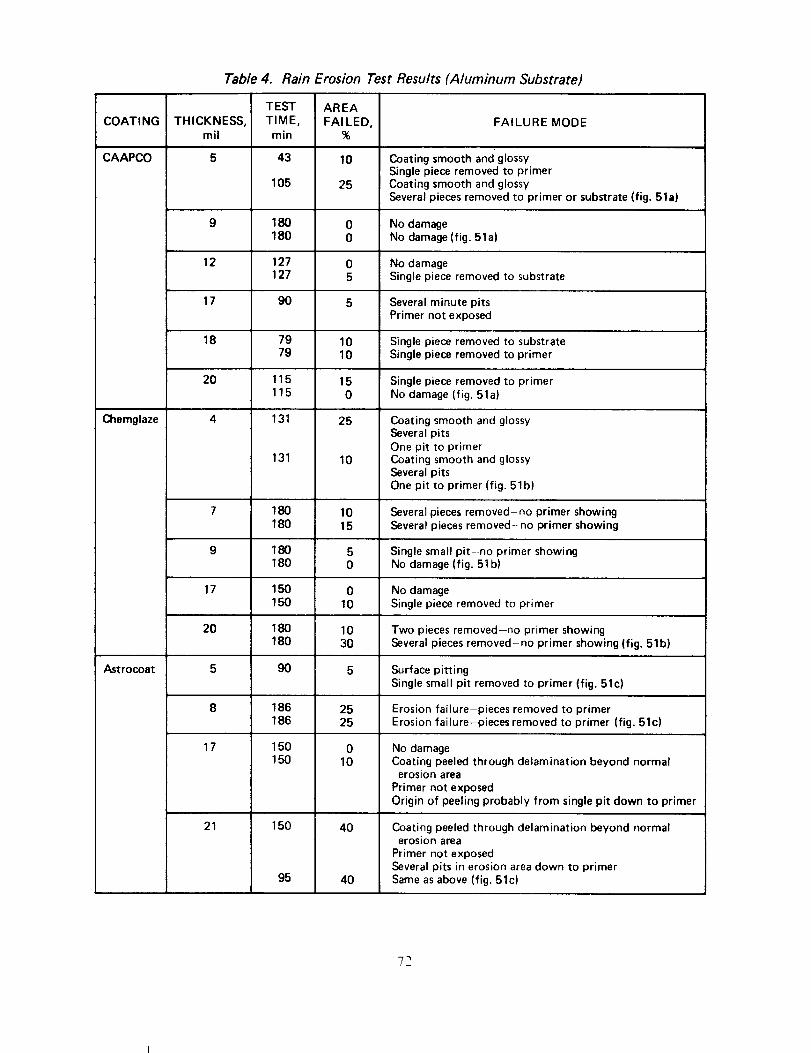
Rain Erosion Test Results (Aluminum Substrate) ...............
Adhesion Test Results ......................................
Peel Test Results ..........................................
Rain Erosion Test Results (Nonmetallic Substrate) ..............
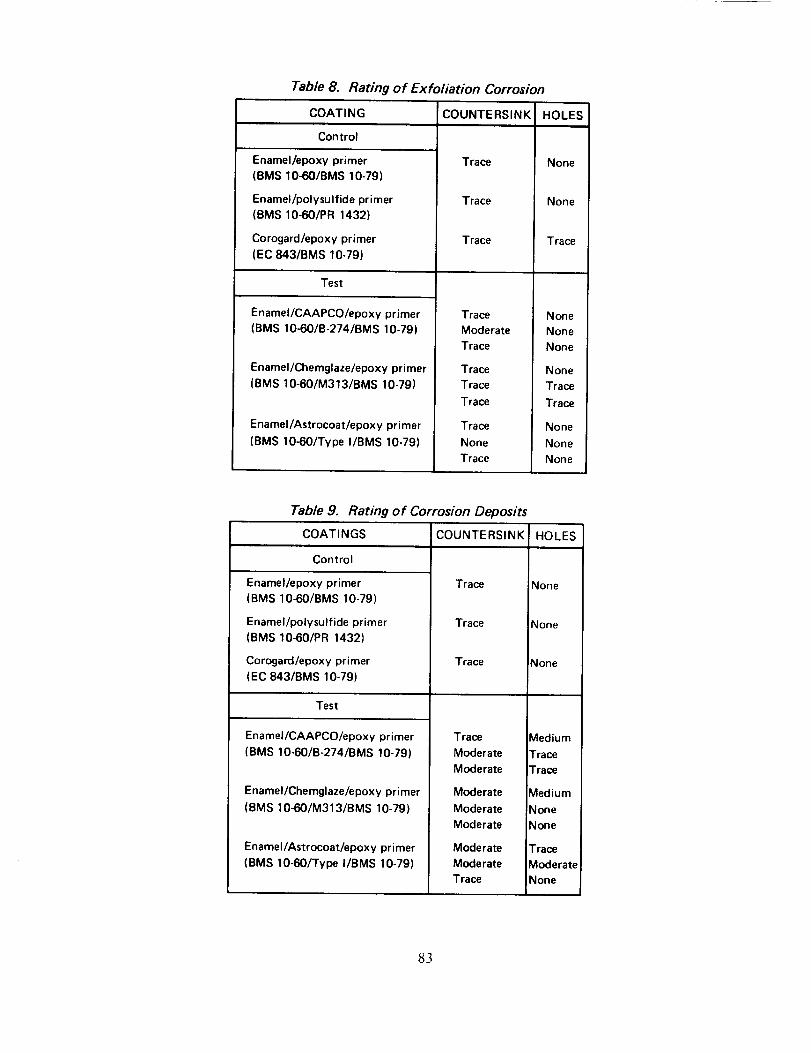
Rating of Exfoliation Corrosion ..............................
Rating of Corrosion Deposits ................................
24 000-hr Cycle Requirements for Painting
and Coating Applications ....................................
Painting and Coating Areas and Weights
of Applied Materials ........................................
Material Costs .............................................
Page
35
45
56
72
77
78
79
83
83
9O
91
92
B-I
B-2
B-3
B_
B-5
B--6
Test Conditions Summary: Uncoated .........................
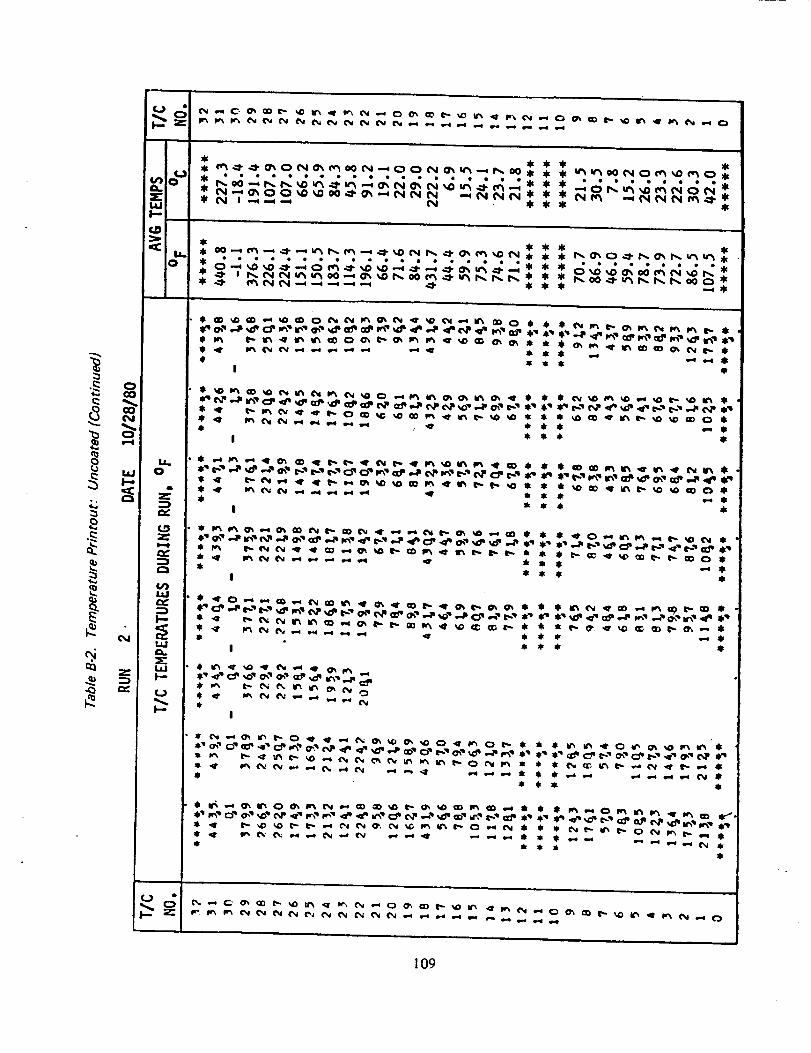
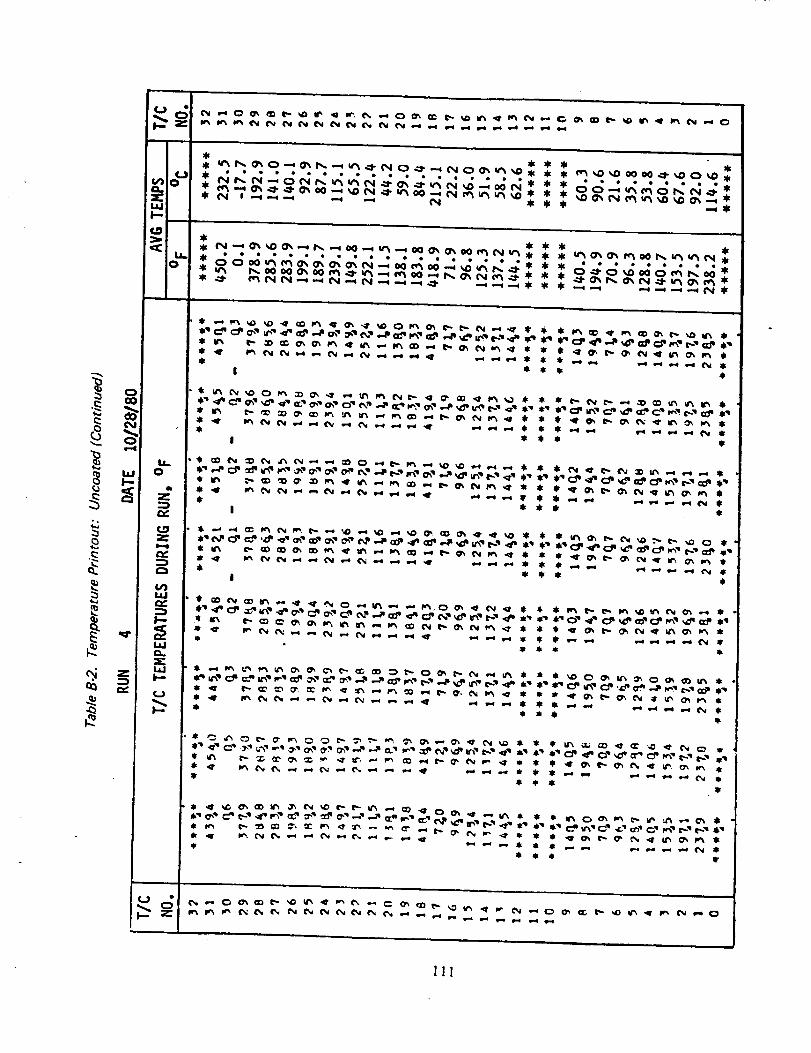
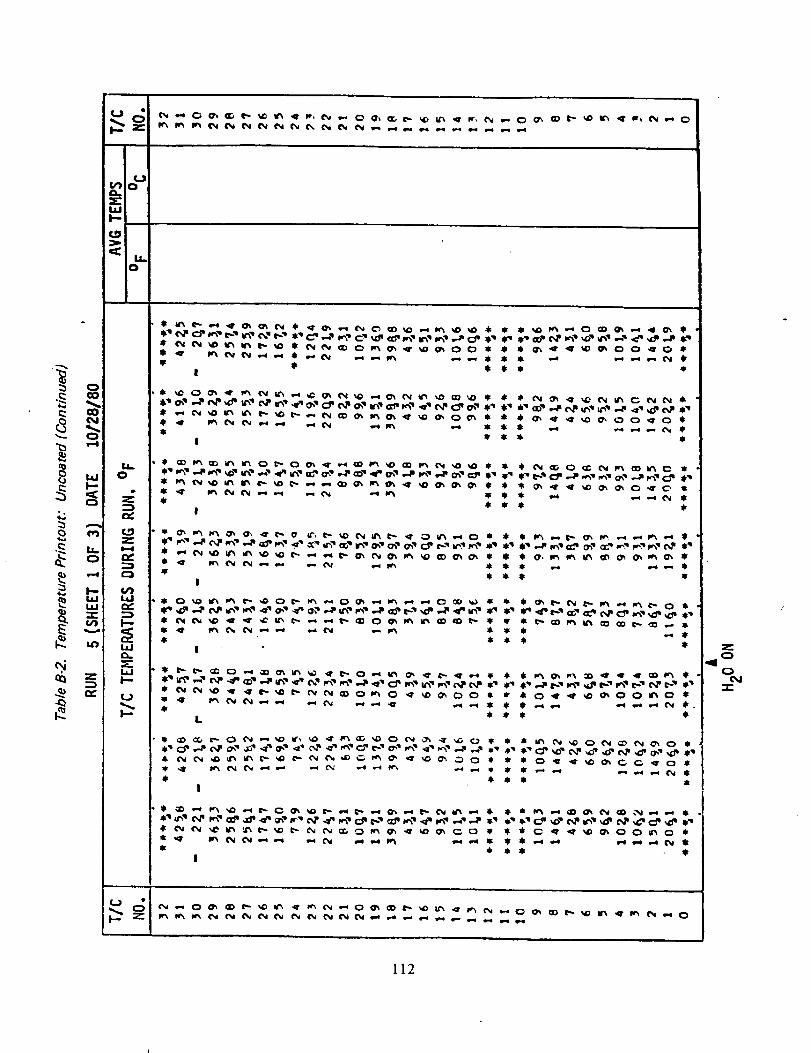
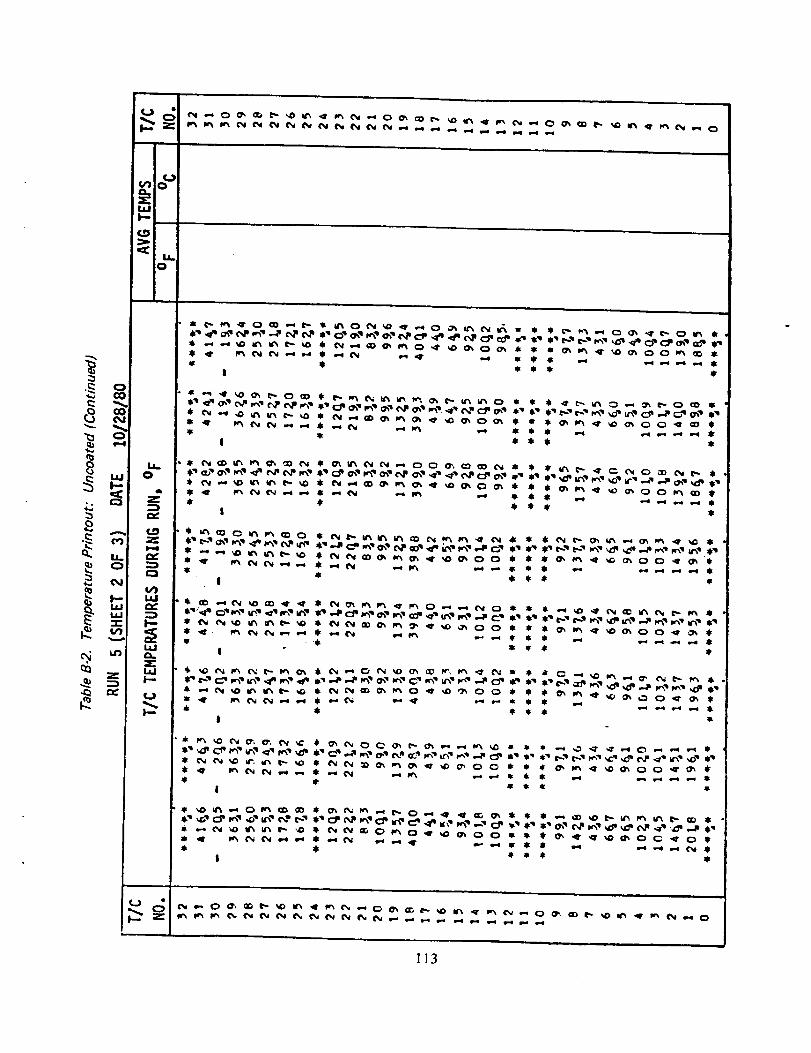
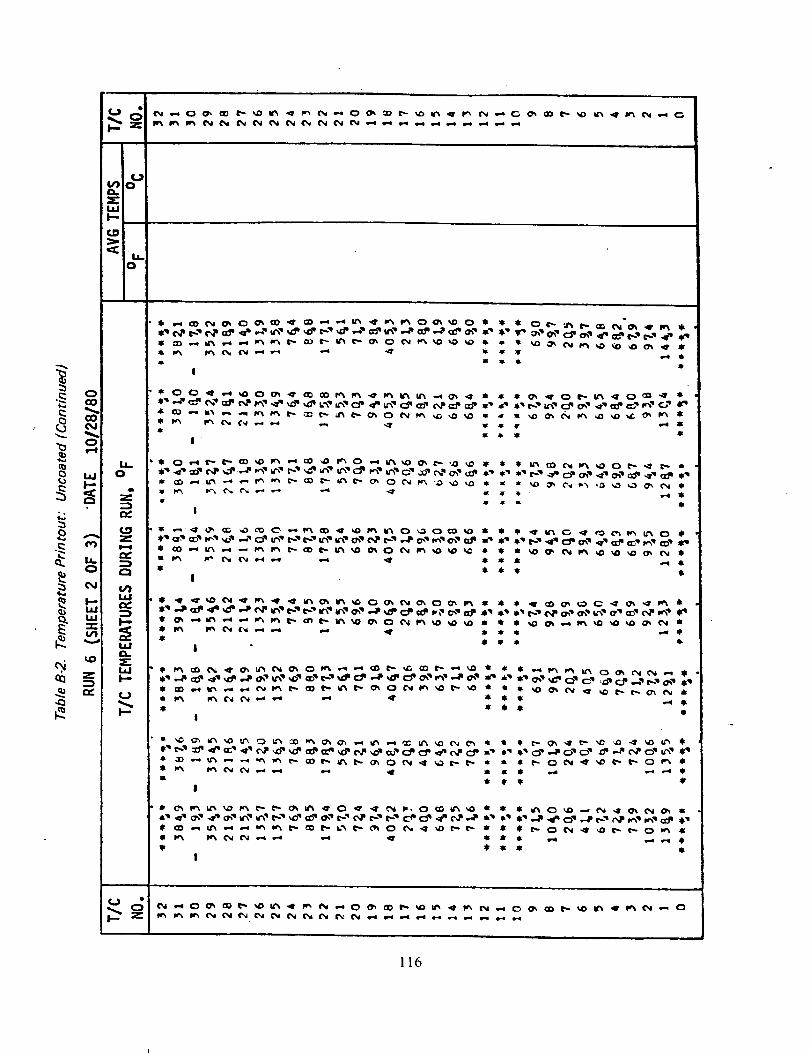
Temperature Printout: Uncoated ............................
Test Conditions Summary: CAAPCO B-274 ...................
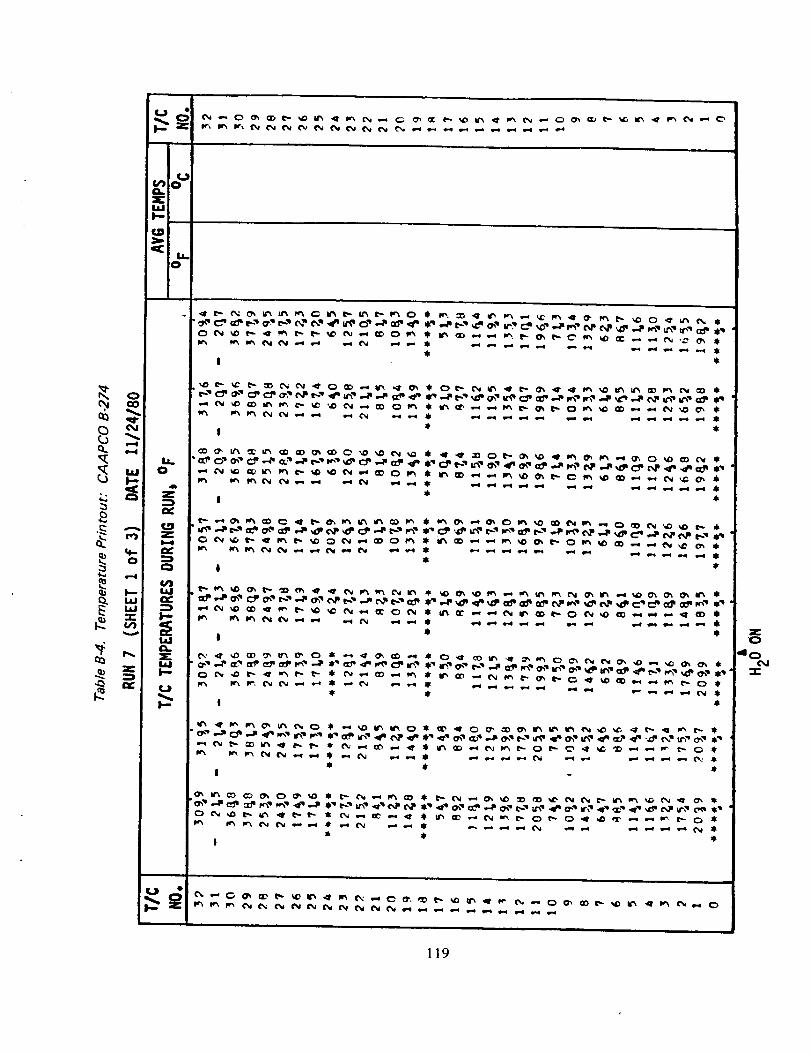
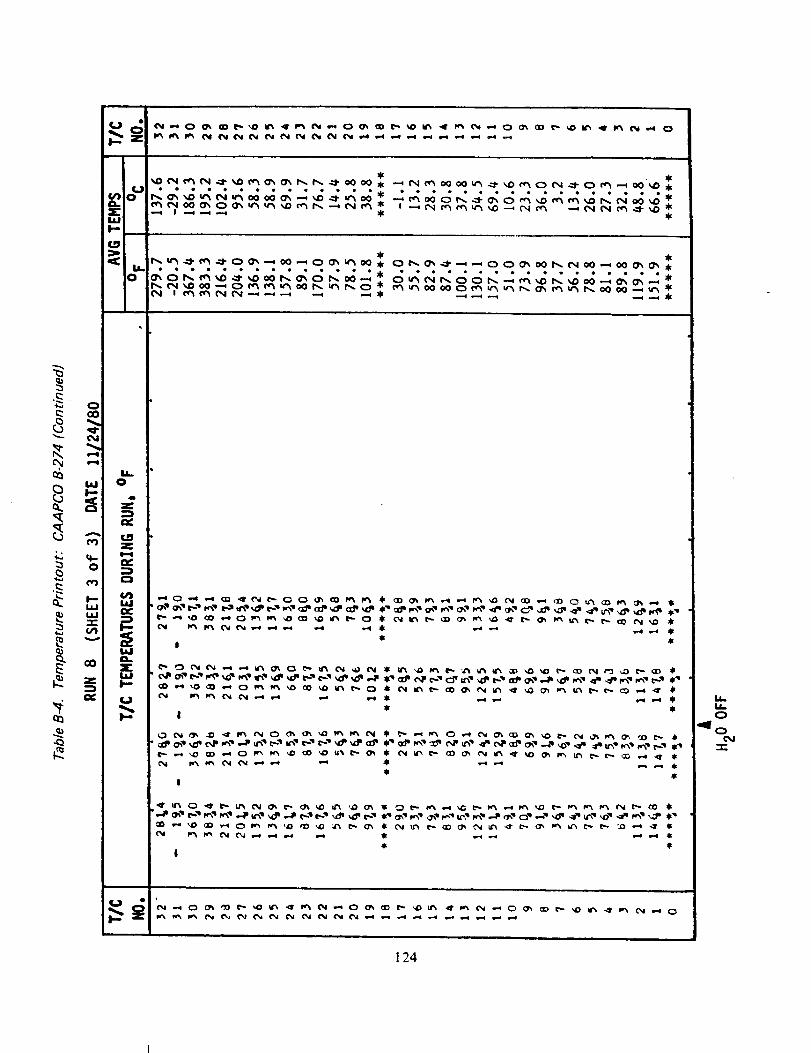
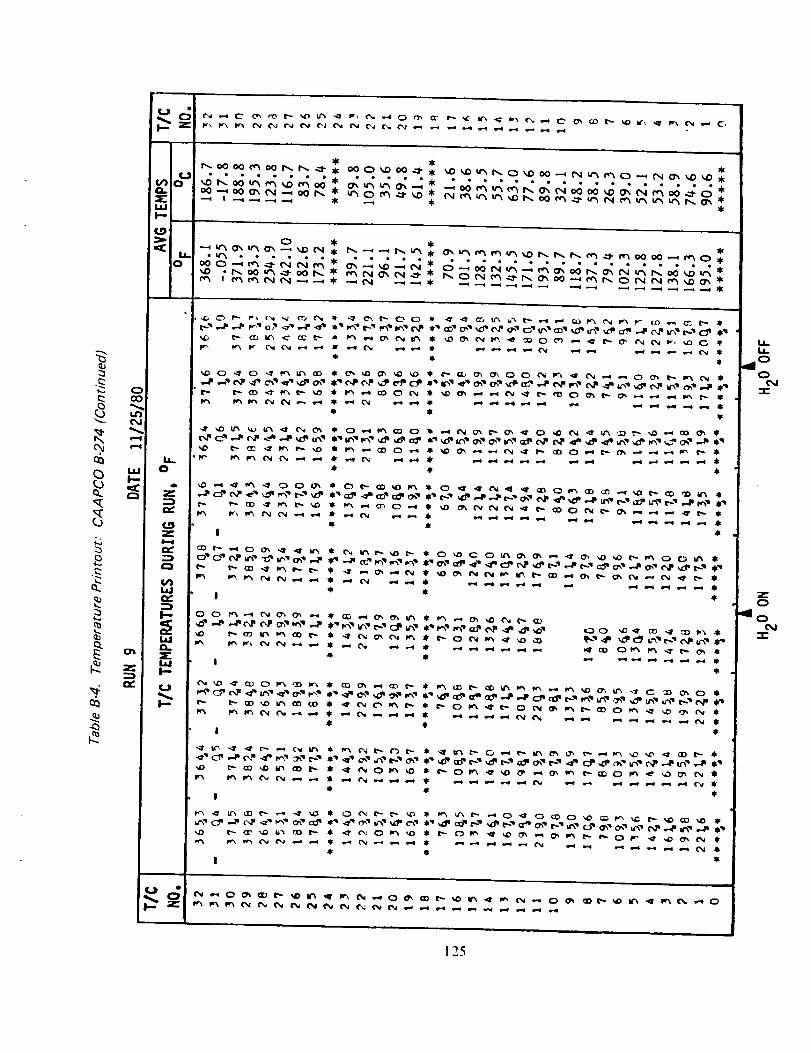
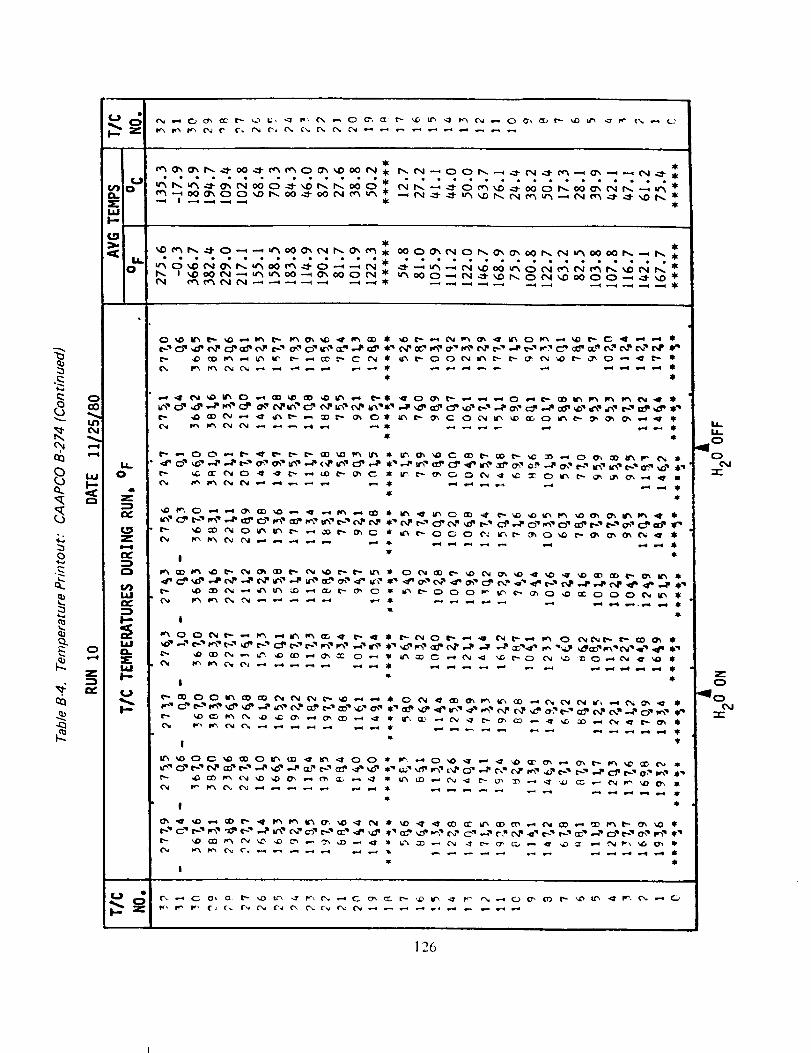
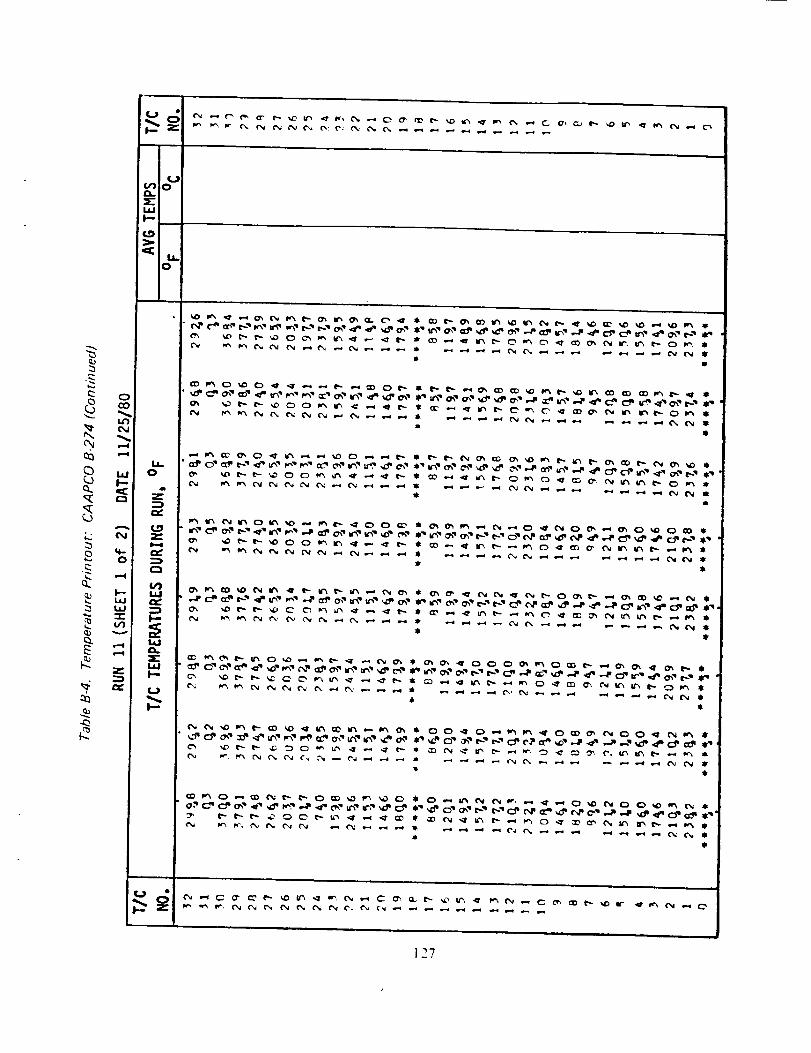
Temperature Printout: CAAPCO B-274 .......................
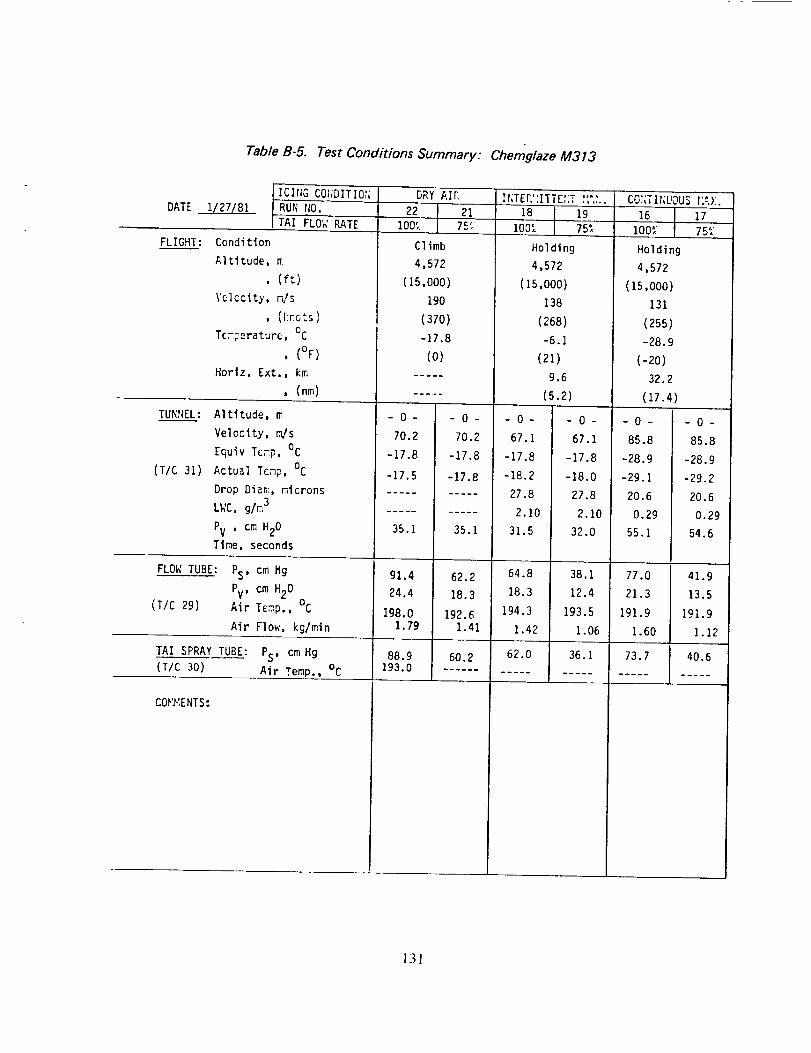
Test Conditions Summary: Chemglaze M313 ...................
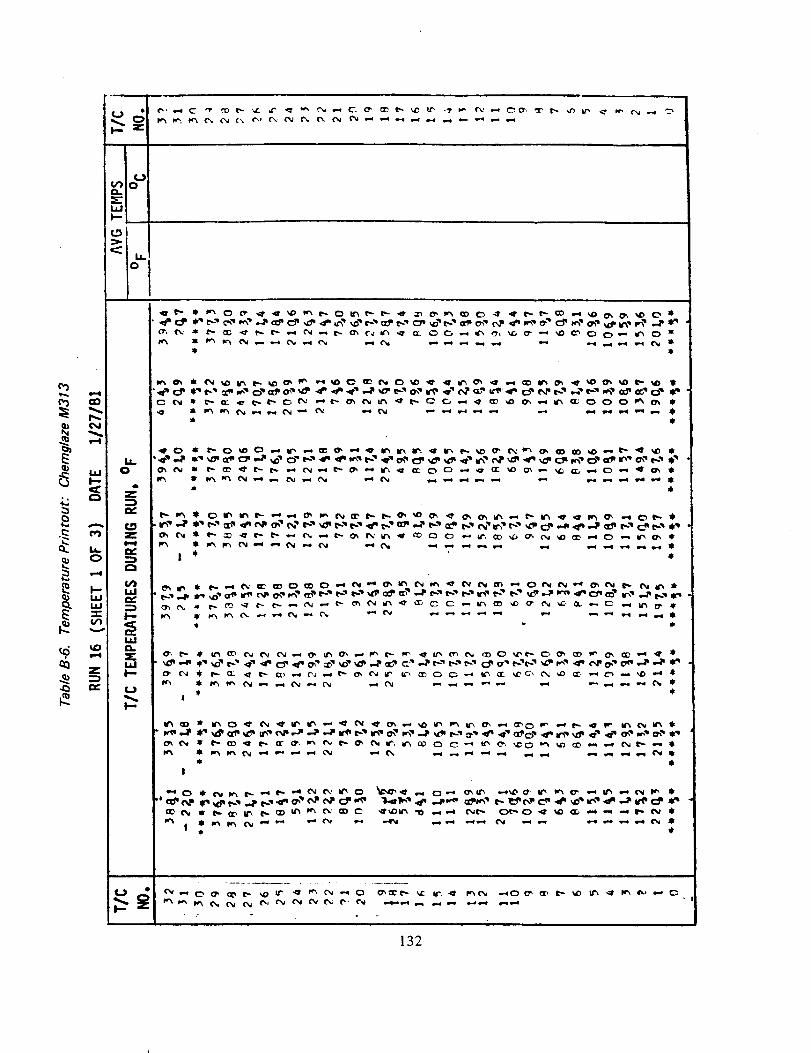
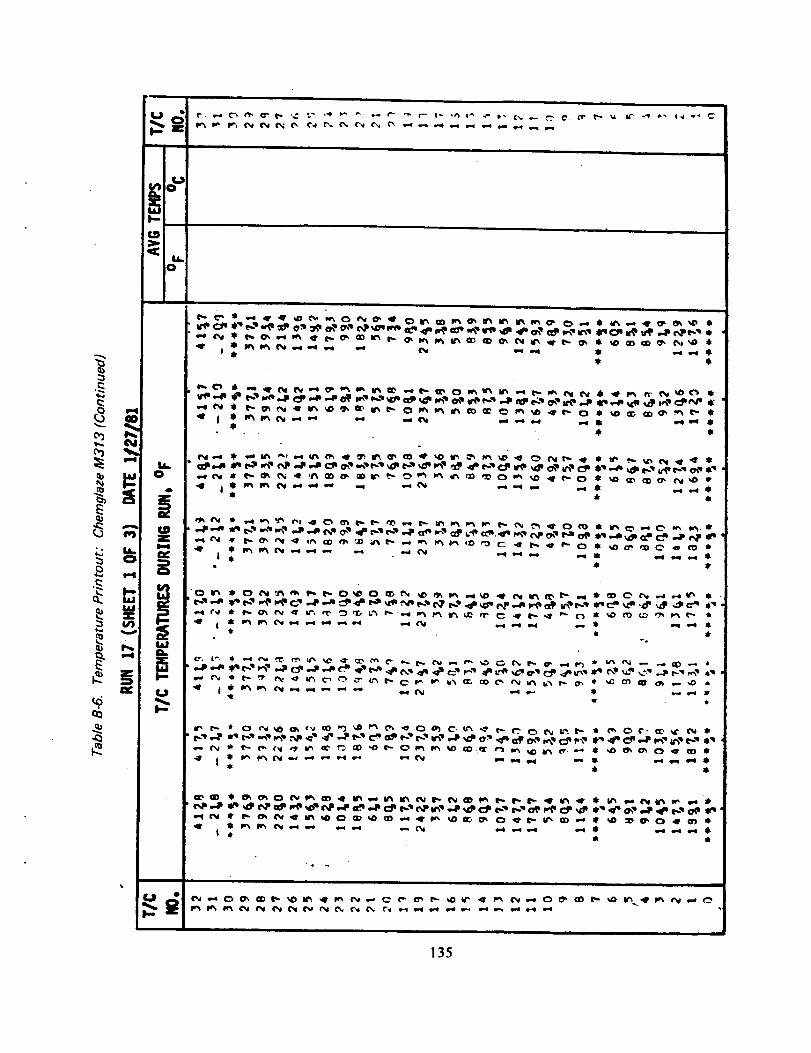
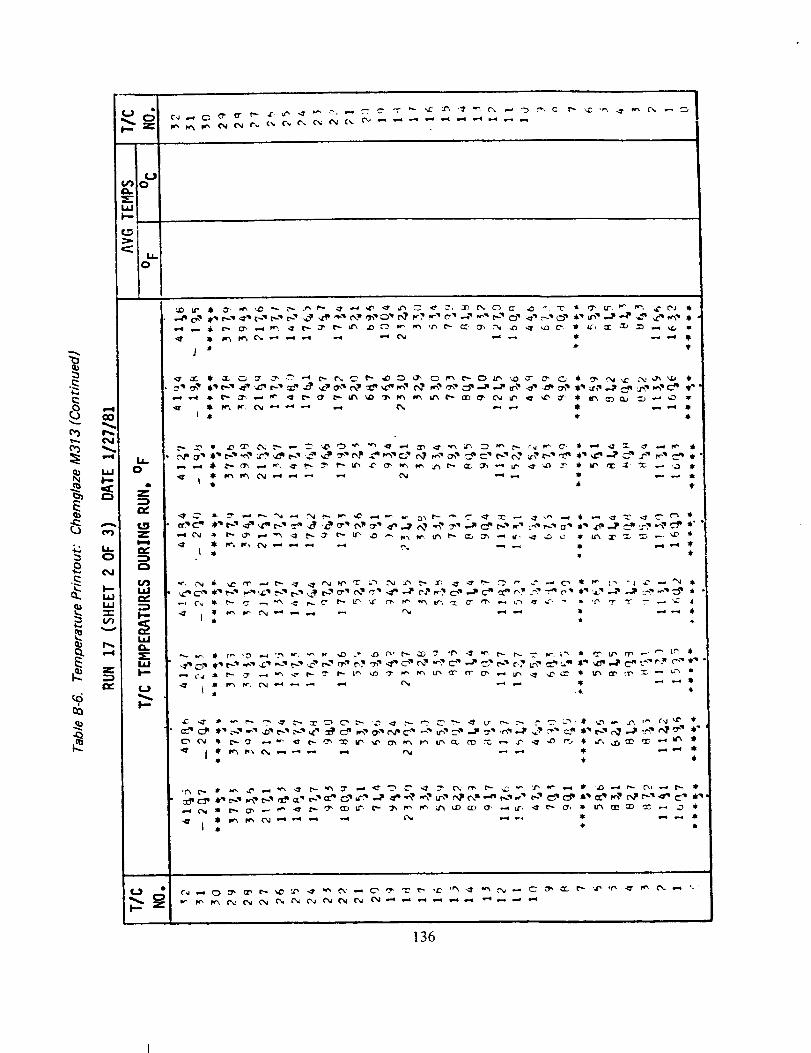
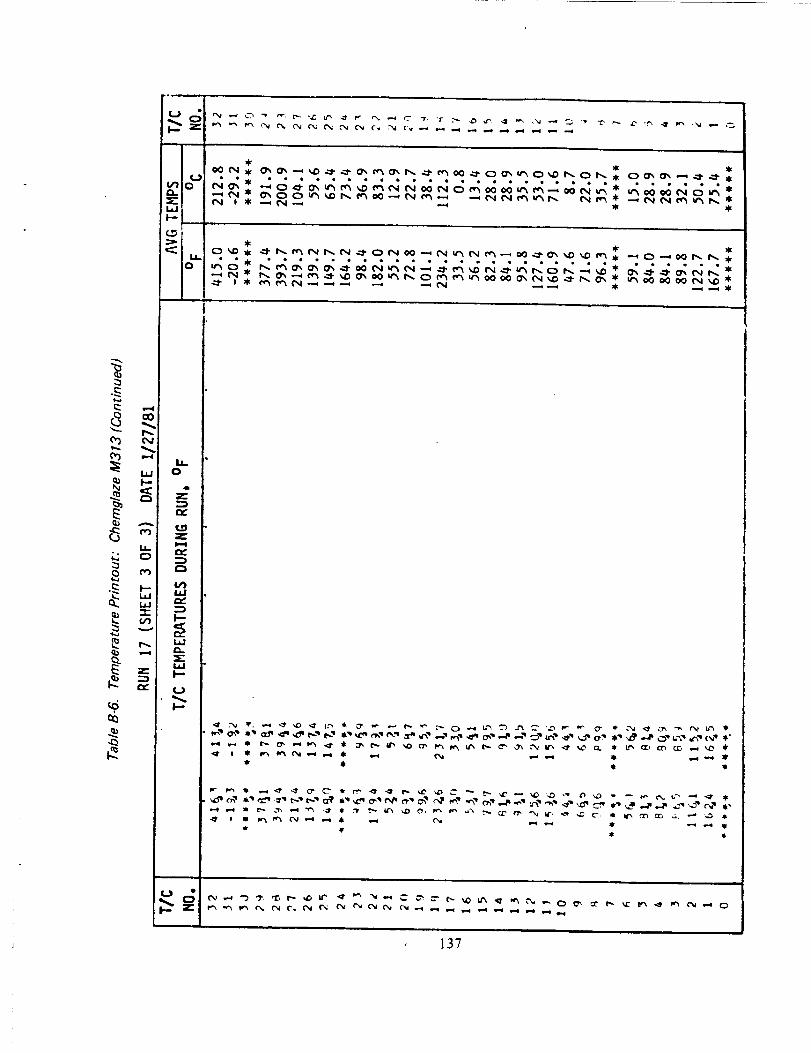
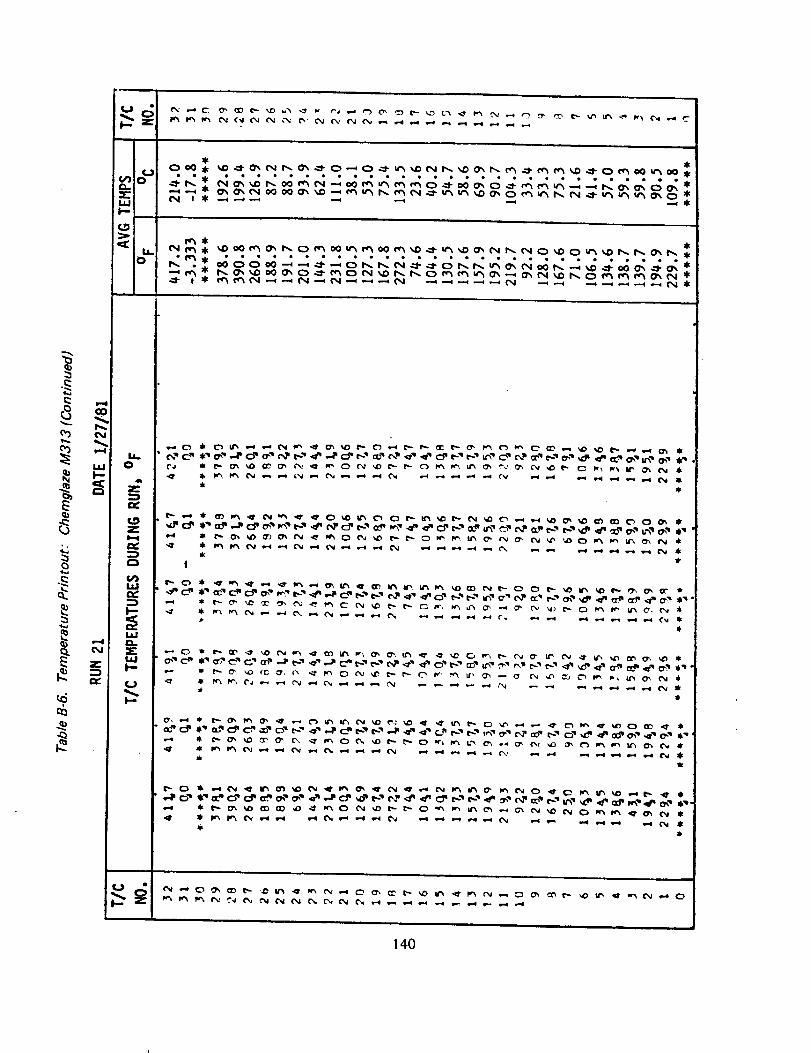
Temperature Printout: Chemglaze M313 ......................
107
108
118
119
131
132
C-I
C-2
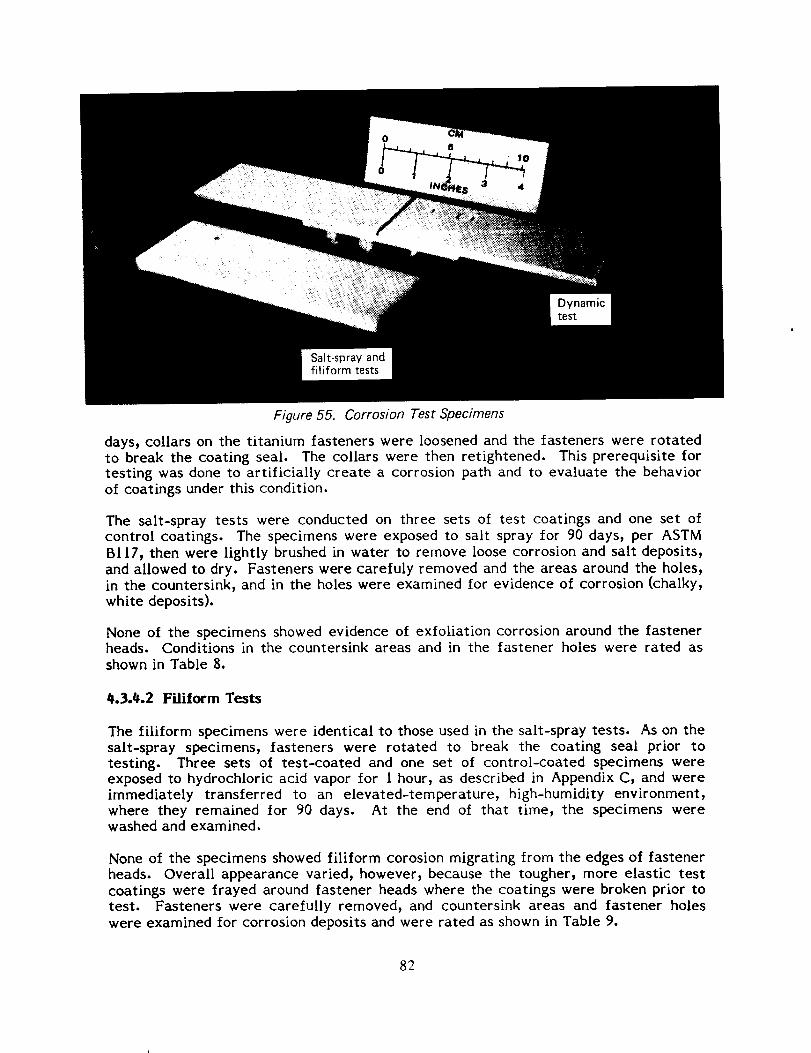
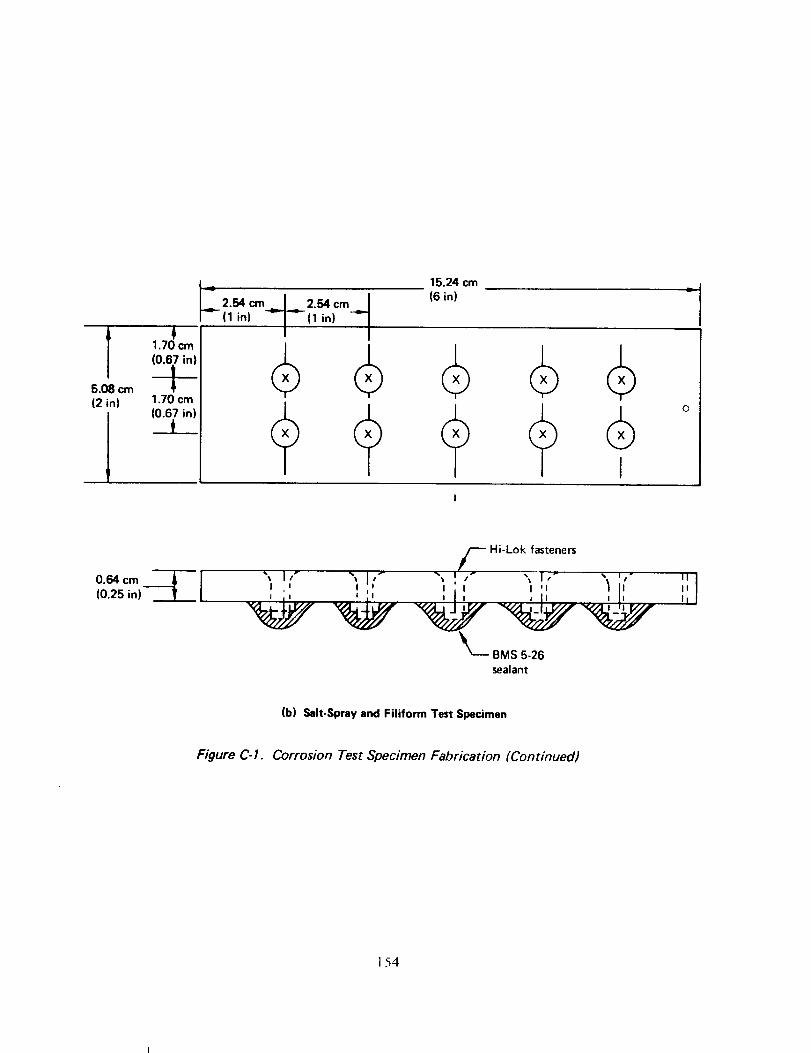
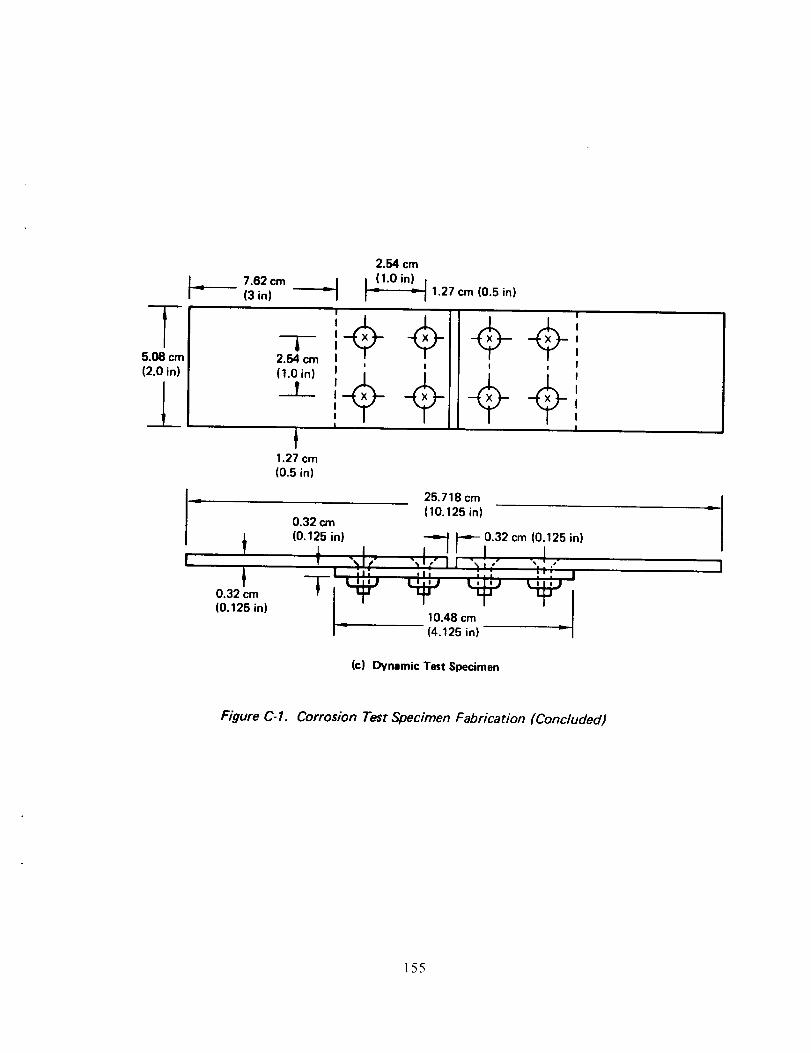
Corrosion Test Specimens ...................................
Potentiostat Test Data .....................................
156
158
xi
1.0 SUMMARY
Previous work on aircraft surface coatings, reported in NASA CR 15895¢ (ref. 1) andCR 159255 (ref. 2)9 led to the selection of liquid spray-on elastomeric polyurethanesas best candidate materials. Further work on three commercially available productsof this type, CAAPCO B-27% Chemglaze M313 and Astrocoat Type 19 is reported inthis document. Drag measurement flight tests9 airline service evaluations, andadditional laboratory tests were conducted. A cost/benefit assessment was made,based on test results. Principal conclusions from the current study were:
Drag Measurement Flight Tests
CAAPCO applied to the wing upper surface in place of rough Corogard (averagemeasured roughness 1801Jin) reduced airfoil section profile drag 2.4969 which isequivalent to about 0.496" airplane drag in cruise. The estimated drag reductionfrom CAAPCO applied to both wing and empennage surfaces is about 0.696.
A badly eroded wing leading edge on the 737 could cause a drag penalty ofabout 0.396 at cruise.
Airline Service Evaluations
When properly applied to leading edges, CAAPCO and Chemglaze have anerosion life of about 6500 and 5000 flight-hours, respectively. The erosion lifeof Astrocoat is significantly less.
CAAPCO requires an epoxy primer for best adhesion. Chemglaze can besatisfactorily applied over either a wash primer or an epoxy primer.
Laboratory Tests
Leading-edge coatings do not significantly affect thermal anti-icing systemperformance.
Coatings applied from the leading edge to the rear spar will not causeprecipitation static interference with communication and navigation equipment.
A lightning-strike analysis should be performed before applying coatins to wingareas containing fuel that are immediately above wing-mounted engines.
Composite leading edges (fiberglass-epoxy9 graphite-epoxy, Kevlar-epoxy andhybrid Kevlar-graphite-epoxy) were found to have very short erosion lives.When protected by a 9-rail coating, the best specimen in rain erosion tests wasCAAPCO on fiberglass-epoxy with an erosion durability roughly equivalent touncoated 2024 ST aluminum.
In laboratory tests, the coatings with a polyurethane enamel topcoat providedcorrosion protection equal to, or better than, current systems. Long-termeffects of the operating environment were not evaluated.
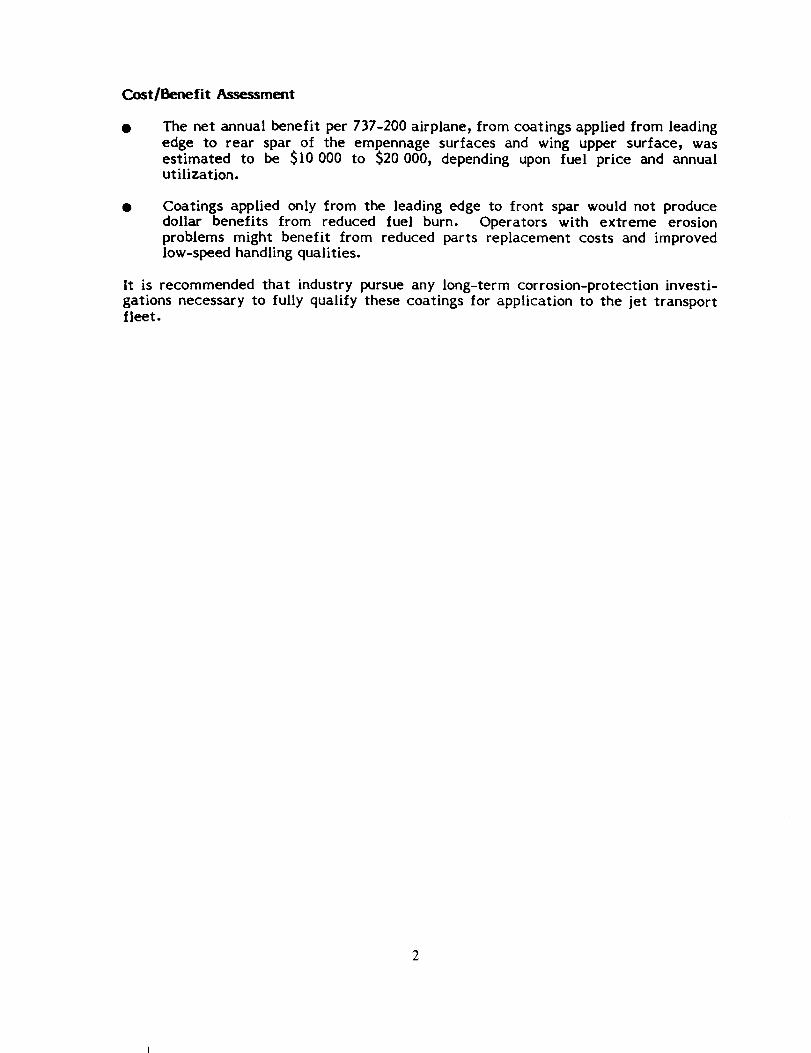
Cost/Benefit Assessment
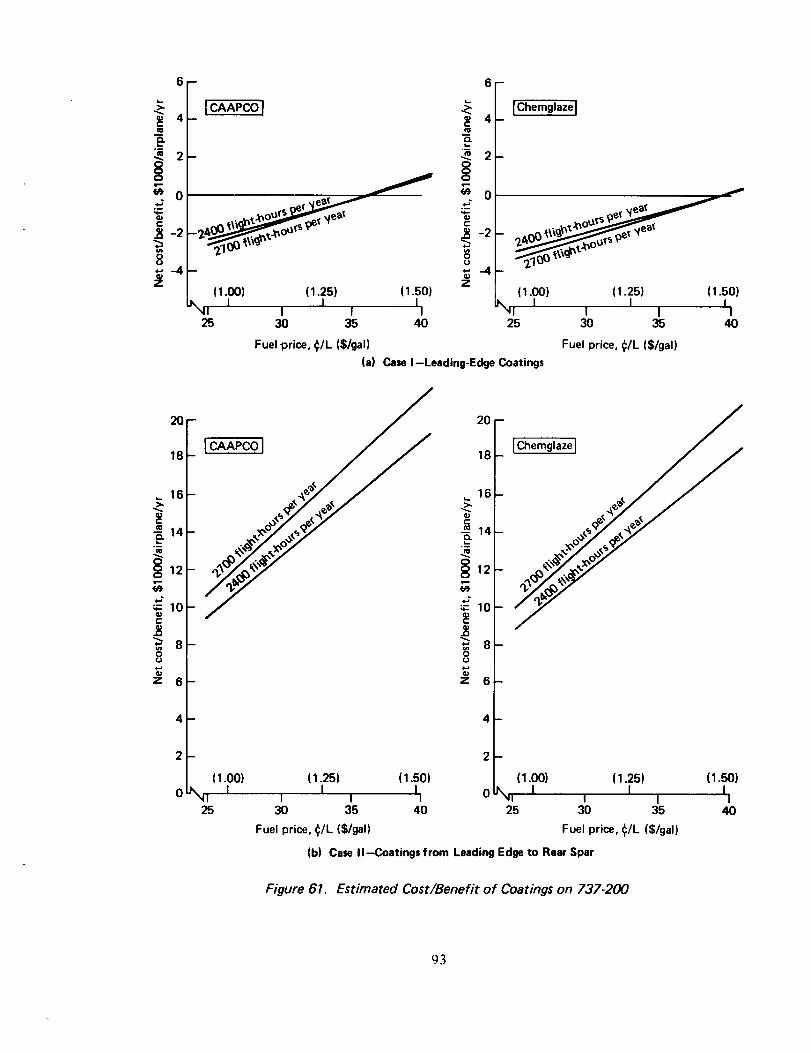
The net annual benefit per 737-200 airplane, from coatings applied from leadingedge to rear spar of the empennage surfaces and wing upper surface, wasestimated to be $10 000 to $20 000, depending upon fuel price and annualutilization.
Coatings applied only from the leading edge to front spar would not producedollar benefits from reduced fuel burn. Operators with extreme erosionproblems might benefit from reduced parts replacement costs and improvedlow-speed handling qualities.
It is recommended that industry pursue any long-term corrosion-protection investi-gations necessary to fully qualify these coatings for application to the jet transportfleet.
2
2.0 INTRODUCTION
Under the energy efficient transport (EET) element of the NASA-sponsored AircraftEnergy Efficiency (ACEE) program, surface coatings were investigated to findsmooth, durable materials that would reduce airplane drag and would protect externalsurfaces from erosion and/or corrosion, Three principal areas of investigation werefollowed during the program, as shown in Figure 1, Three series of laboratory testswere conducted; leading candidate materials were evaluated in revenue service byContinental Airlines (CO) and by Delta Air Lines (DL); and drag changes due tocoatings were measured in flight tests conducted at NASA-Langley Research Center,
The first series of laboratory tests identified three elastomeric polyurethane spray-oncoatings as the best potential candidates out of a field of 9 liquid coatings and 60film-adhesive systems. Two of the candidate coating% CAAPCO 1:3-274 and Chem-glaze M313, were applied to the leading edges of wing slats and the horizontal tail ofa CO 727 and flown l# months in the Air Micronesia route system. Results of theinitial laboratory tests and details of the coating application to the CO 727 arereported in Reference I.
During the second series of laboratory tests, most of the effort was directed towardevaluating and reducing the susceptibility of elastomeric polyurethanes to synthetic-type hydraulic fluids, such as Skydrol or Hyjet IV. During these tests and in
Laboratory tests
Flight service evaluations
Drag measurement test
Reports
1977 1978 1979 1980 1981 1982
Continental I
Delta
iI
• • •
CR 158954 CR 159288 CR 165928"
(ref. 1) (ref. 2)
*Shadedbarsrepresentwork reportedherein
Figure 1. Aircraft Surface Coatings Program
3
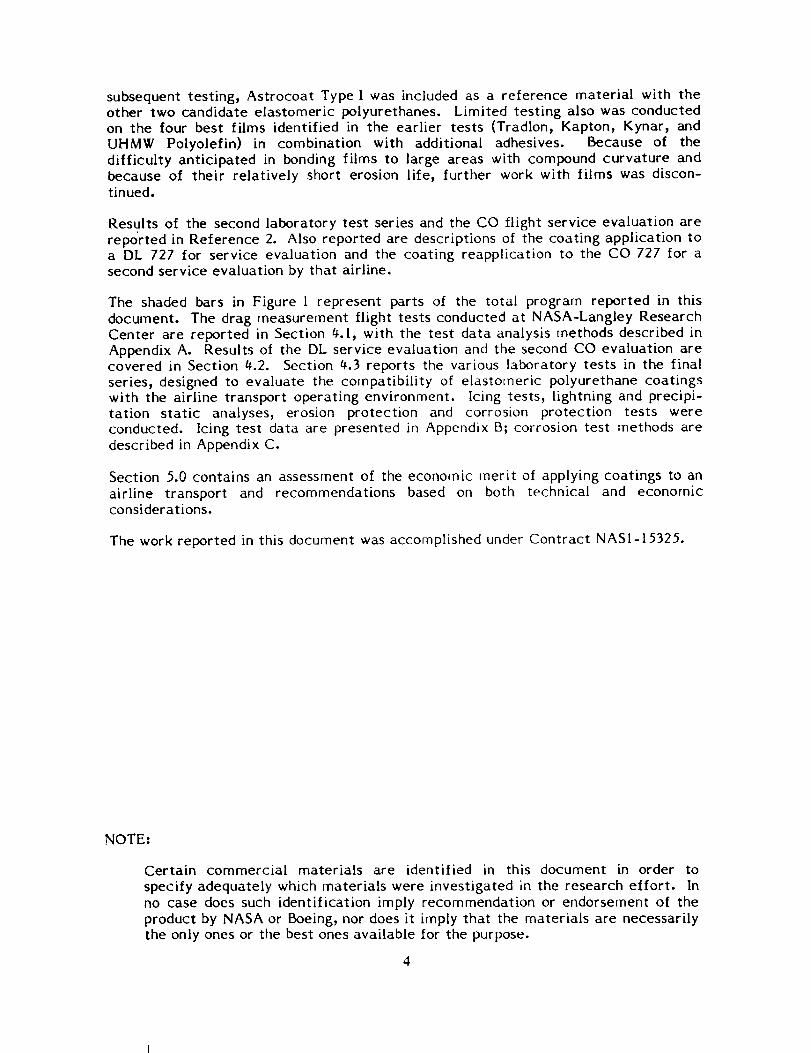
subsequenttesting, Astrocoat Type I was included as a reference material with theother two candidate elastomeric polyurethanes. Limited testing also was conductedon the four best films identified in the earlier tests (Tradlon, Kapton, Kynar, andUHMW Polyolefin) in combination with additional adhesives. Because of thedifficulty anticipated in bonding films to large areas with compoundcurvature andbecauseof their relatively short erosion life, further work with films was discon-tinued.
Results of the secondlaboratory test series and the CO flight service evaluation arereported in Reference 2. Also reported are descriptions of the coating application toa DL 727 for service evaluation and the coating reapplication to the CO 727 for asecond service evaluation by that airline.
The shaded bars in Figure 1 represent parts of the total program reported in thisdocument. The drag measurement flight tests conducted at NASA-Langley ResearchCenter are reported in Section 4.1, with the test data analysis methods described inAppendix A. Results of the DL service evaluation and the second CO evaluation arecovered in Section 4.2. Section 4.3 reports the various laboratory tests in the finalseries, designed to evaluate the compatibility of elastomeric polyurethane coatingswith the airline transport operating environment. Icing tests_ lightning and precipi-tation static analyses, erosion protection and corrosion protection tests wereconducted. Icing test data are presented in Appendix B_ corrosion test methods aredescribed in Appendix C.
Section 5.0 contains an assessment of the economic merit of applying coatings to anairline transport and recommendations based on both technical and econornicconsiderations.
The work reported in this document was accomplished under Contract NAS1-15325.
NOTE:
Certain commercial materials are identified in this document in order to
specify adequately which materials were investigated in the research effort. Inno case does such identification imply recommendation or endorsement of theproduct by NASA or Boeing, nor does it imply that the materials are necessarilythe only ones or the best ones available for the purpose.
3.0 ABBREVIATIONS AND SYMBOLS
ACEE
AFB
AFML
ASTM
Aircraft Energy Efficiency program
Air Force base
Air Force Materials Laboratory
American Society for Testing and Materials
C
C
Cd
CD
CI
CL
CMI
CO
Cp
DA
DL
chord
coulomb, charge transfer
section drag coefficient
airplane drag coefficient
section lift coefficient
airplane lift coefficient
continuous maximum icing
Continental Airlines
local static pressure
dry air
Delta Air Lines
e
EET
freestream condition (subscript)
energy efficient transport
FAR
FOD
FTMS
Federal Aviation Regulation
foreign object damage
Federal Test Methods Standard
hp
ID
IMI
kPa
pressure altitude
inside diameter
intermittent maximum icing
kilopascal (pounds force per square inch)
L liter
M
M
m
mA
max
MEK
MIBK
MMO
Mach number
freestream Mach number
meter) magnification factor
milliampere
maximum
methyl ethyl ketone
methyl isobutyl ketone
Mach number) maximum operating
NASA National Aeronautics and Space Administration
Po
Ps
Pv
atmospheric pressure
static pressure
velocity pressure
QB
QC
QT
average current multiplied by time
maximum current
total charge in coulombs
r a
ref.
R/m, Rift
surface roughness
reference
freestream unit Reynolds number
SD
SREF
distance between spars
reference area
T
TAI
T/C
TCV
TD
timer total temperature
thermal anti-icing
thermocouple
Terminal Configured Vehicle
dwell time
u/Ue
UHMW
UV
velocity ratio
ultrahigh molecular weight
ultraviolet
V
VMO
aircraft velocity
velocity, maximum operating
WBL
w/a
wing buttock line
weight to pressure ratio
distance from surface
x/c chord thickness ratio
A
0
#
difference
corrected momentum thickness
air density
7
#.0 STUDY RESULTS
The four areas of investigation--drag measurement test, flight service evaluations,environmental (laboratory) tests, and cost/benefit assessment--are described in thissection and the results are presented. Additional information on some of the uniquetests is contained in the appendixes.
4.1 DRAG MEASUREMENT TEST
A flight test program was conducted at NASA-Langley Research Center to investi-gate the effects of surface coatings on airplane drag. The tests were flown on theB737 Terminal Configured Vehicle (TCV) shown in Figure 2. The airplane provided atest surface on the inboard wing that was free of leading-edge devices that mightaffect upper surface boundary layer flow and influence test results. The test surfacealso provided a representative jet transport air[oil section on which measurementscould be taken at full-scale Reynolds numbers.
Because the three elastomeric polyurethanes being investigated (CAAPCO, Chem-glaze, and Astrocoat) had nearly identical surface smoothness characteristics_ onlyCAAPCO was used in the program. It was believed that testing the other twomaterials would give redundant results with increased expense. CAAPCO wascompared to Corogard paint, bare, and enamel paint surfaces in the test series.
LAH6LEYRESEARCHCENTER
515
Figure 2. Test Airplane: NASA TCV B737 Research Aircraft
9
4.1.1 TEST DESCRIPTION
This section contains a brief description of the test setup, surface configurations
tested, instrumentation, test procedure, philosophy of test analysis, and data process-
ing. Complete details are reported in Reference 3.
4.1.1.1 Test Airplane and Experimental Layout
The principal requirements for a suitable test vehicle were (1) the capability of
achieving flight conditions, i.e., speed, altitude, Mach numbers, and Reynolds
numbers typical of jet transport airplanes; (2) test surface characteristics representa-
tive of transport airplanes; and (3) proper instruments for high-precision data
gathering.
Figure 3 shows the location of the test surface on the airplane and the principal
instrumentation used. The various surface coatings were applied to a 2.03m- (g0-in-)
wide strip on the inboard left wing, extending between the Ig% span station and the
32% span station and terminating at the aft end at the hinge line of the inboardspoiler. The same area of the right wing was stripped of paint to the bare metal
surface and was retained in that condition throughout the test to provide a constant
baseline reference surface. Evaluation of the various surface coatings was made
principally by a side-to-side comparison from measurements taken simultaneously onthe test surface and the base reference surface. This method ensured that
comparison of the two surfaces was made at exactly the same flight conditions. Tofurther validate the evaluation, the left side test surface was also tested in the barecondition and differences between the two surfaces were taken into account.
• Existing paint _ I ' 1." I / r- WBL1BO• Bare surface / _1 i L / /
• CAAPCO coating | \l/%JF_ I I .'.:":_ | f-- Reference surface
Inboard spoiler - at WBL 154
• Surface pressuredistribution measurements
• Bare surface on both sides r'_ / Zbelts ]
i
Figure 3. Experiment Layout
Inboard rake atat WBL 141
10
The principal instrumentation consisted of a pair of boundary layer rakes mounted onthe wing near the downstream edge of the reference surface and test surface (7396 ofthe local wing chord). The rakes mounted at the surface midspan (WBL 14L) were theprimary data source, and the outboard rakes (WBL 154) provided backup data.
Chordwise pressure distributions along the center of the test section (WBL 14l) weremeasured during flight 2, using multitube plastic belts (Strip-a-tube) bonded to thewing surface. These measurements provided an experimental data base for thecalculation of boundary layer growth along the test surface.
I1.1.1.2 Surface Configurations Tested
Boundary layer measurements were made of five surface configurations: the paintedsurface, which existed prior to the test; the bare surface; the bare surface with roughleading edge; Corogard; and CAAPCO coating.
The existing paint on the test airplane was a nonstandard enamel coating, applied bya NASA contractor several years ago. Although there were no major discrepancies onthe upper surface test section, there were numerous small lumps and specks. Ingeneral, the surface condition was typical of a medium-time airplane in airlineservice.
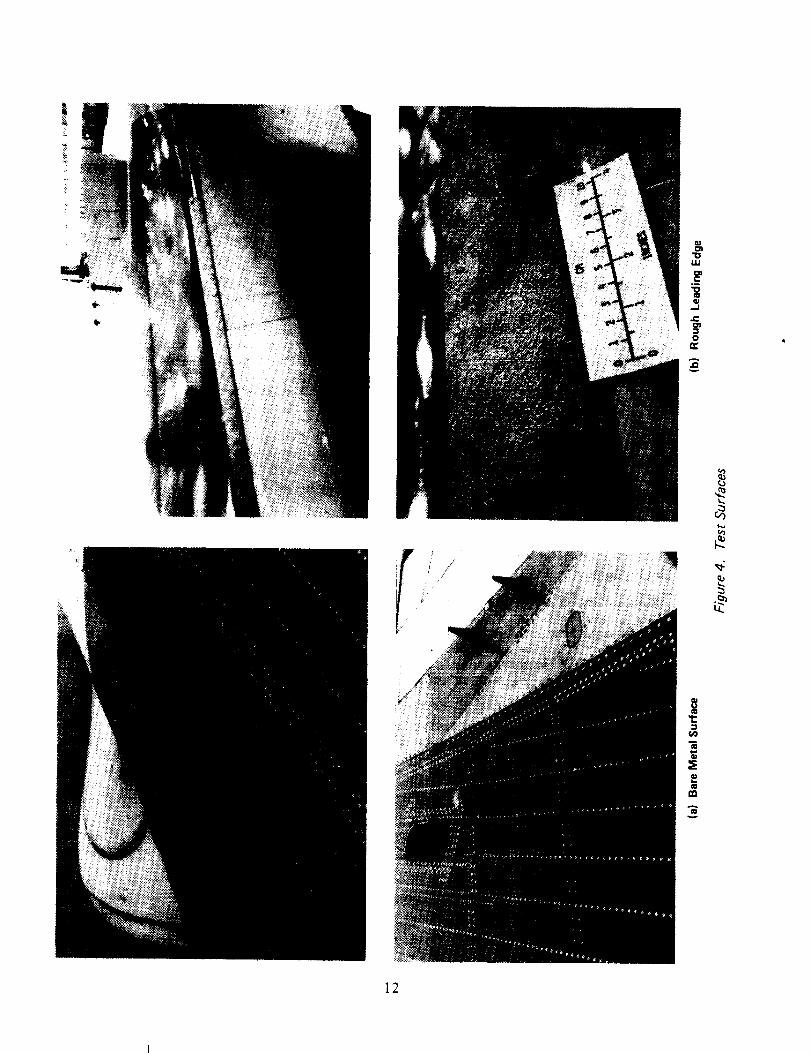
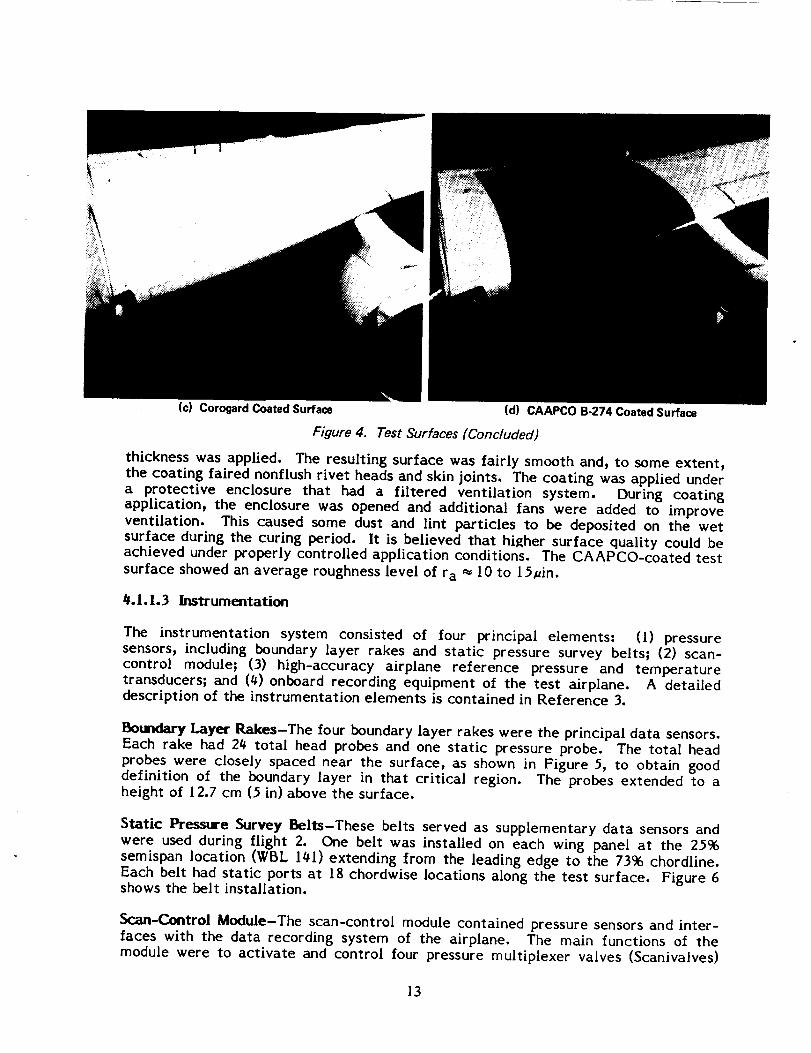
The bare metal surface shown in Figure 4a was very smooth (surface roughness, ra30 #in), however, numerous rivet heads protruded from the surface up to about0.I mm (0.004 in). In addition, spanwise skin butt joints across the test section hadsmall gaps I to 3 mm (0.04 to 0.12 in) wide, with aerodynamic putty in the largergaps. There were occasional skin joint mismatches of up to 0.25 mm (0.01 in).Because these surface imperfections were comparable to the thickness of the viscoussublayer, they produced some incremental drag above the profile drag of a perfectlysmooth wing. The bare surface chosen as a baseline configuration, therefore, was notan ideal, hydraulically smooth surface, but one that had discrete roughness elements.
The roughened leading edge (fig. Qb) was included among the test configurations toobtain data on the effects of an eroded leading edge on drag. The simulation wasaccomplished by applying metallic grit to the leading edge on the Left wing testsurface for flight 3a. The roughened strip was about 76 mm (3 in) wide. The grit sizewas No. 50_ 0.50 mm (0.02 in), with a nominal density of about 15 particles per squarecentimeter (100 particles per square inch). For a comparison to a severely erodedleading edge on an airline transport, refer to Figure 28, Section 4.2.1.2.
Corogard paint (fig. 4c) was tested to obtain an additional reference to which theCAAPCO B-27g elastomeric polyurethane surface coating could be compared. Coro-gard is widely used on large transport airplanes because of its excellent corrosionprotection characteristics, however, it produces a certain level of roughness thatvaries with application techniques. Surveys reported that Corogard roughnessaveraged about r a = 150 +30/_in on Boeing production airplanes. Duplication of thisroughness level was intended for the present experiment; however, the coatingultimately was slightly rougher than desired, registering a mean value of aboutra _ 160 /_in. The Corogard was applied from the front spar back to the spoiler hingeline, i.e., past the boundary layer rakes.
The CAAPCO coating (fig. 4d) applied ahead of the front spar was approximatelyt2-mil thick. Aft of the front spar, where erosion protection is not critical, a 5-rail
thickness was applied. The resulting surface was fairly smooth and, to some extent,the coating faired nonflush rivet heads and skin joints. The coating was applied undera protective enclosure that had a filtered ventilation system. During coatingapplication, the enclosure was opened and additional fans were added to improveventilation. This caused some dust and lint particles to be deposited on the wetsurface during the curing period. It is believed that hi{_her surface quality could beachieved under properly controlled application conditions. The CAAPCO-coated testsurface showed an average roughness level of r a _ 10 to 15/_in.
_.1.1.3 Instrumentation
The instrumentation system consisted of four principal elements: (I) pressuresensors, including boundary layer rakes and static pressure survey belts; (2) scan-control module; (3) high-accuracy airplane reference pressure and temperaturetransducers; and (0) onboard recording equipment of the test airplane. A detaileddescription of the instrumentation elements is contained in Reference 3.
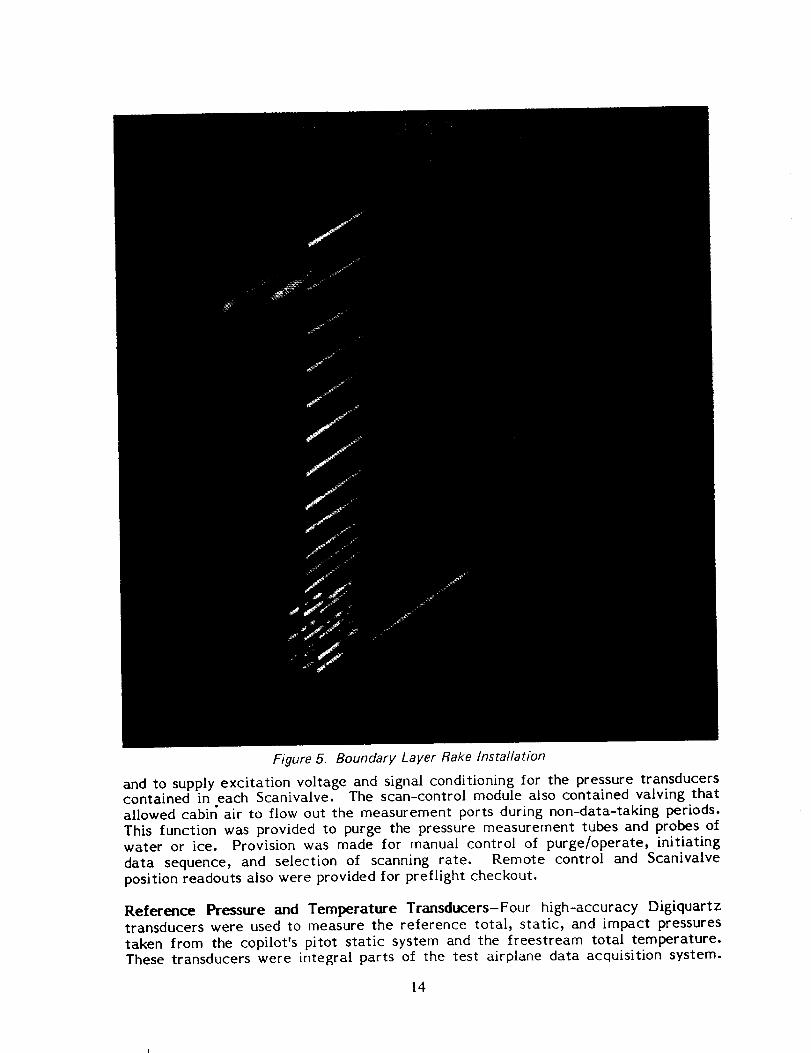
Boundary Layer Rakes-The four boundary layer rakes were the principal data sensors.Each rake had 20 total head probes and one static pressure probe. The total headprobes were closely spaced near the surface, as shown in Figure 5, to obtain gooddefinition of the boundary layer in that critical region. The probes extended to aheight of 12.7 cm (5 in) above the surface.
Static Pressure Survey Belts-These belts served as supplementary data sensors andwere used during flight 2. One belt was installed on each wing panel at the 25%semispan location (WBL 101) extending from the leading edge to the 73% chordline.Each belt had static ports at 15 chordwise locations along the test surface. Figure 6shows the belt installation.
Scan-Control Module-The scan-control module contained pressure sensors and inter-faces with the data recording system of the airplane. The main functions of themodule were to activate and control four pressure multiplexer valves (Scanivalves)
13
Figure 5. Boundary Layer Rake Installation
and to supply excitation voltage and signal conditioning for the pressure transducerscontained in each Scanivalve. The scan-control module also contained valving thatallowed cabir_ air to flow out the measurement ports during non-data-taking periods.This function was provided to purge the pressure measurement tubes and probes ofwater or ice. Provision was made for manual control of purge/operate, initiatingdata sequence) and selection of scanning rate. Remote control and Scanivalveposition readouts also were provided for preflight checkout.
Reference Pressure and Temperature Transducers-Four high-accuracy Digiquartztransducers were used to measure the reference total, static) and impact pressurestaken from the copilot's pitot static system and the freestream total temperature.These transducers were integral parts of the test airplane data acquisition system.
14
Figure 6. Static Pressure Survey Belt Installation
The total and static pressures from these sources were transmitted to one channel ofeach Scanivalve and recorded with the scanned rake pressure data. This arrangement
provided an updated recalibration at each scanning cycle.
Onboard Data Recording Equipment-The test airplane onboard data recordingequipment consisted of a 100-channel digital tape recorder and three 8-channeloscillographs for online data monitoring and quick-look data recording.
In addition to variables essential to the data analysis, other variables, such asairspeed, altitude, angle of attack, pitch and yaw angles, and fuel quantity, wererecorded for identification of flight conditions.
4.1.1.4 Test Procedure
Tests evaluating surface coating drag were incorporated into the TCV flight testprogram on a concurrent basis and were usually performed after the airplane hadcompleted its primary mission at the Wallops Island test site. The drag tests wereflown in tightly controlled off-shore corridors designated by Air Traffic Control.
There were five test flights and one supplementary test during flight 3a, when theroughened leading edge was tested. The following flights and test configurations arelisted chronologically:
15
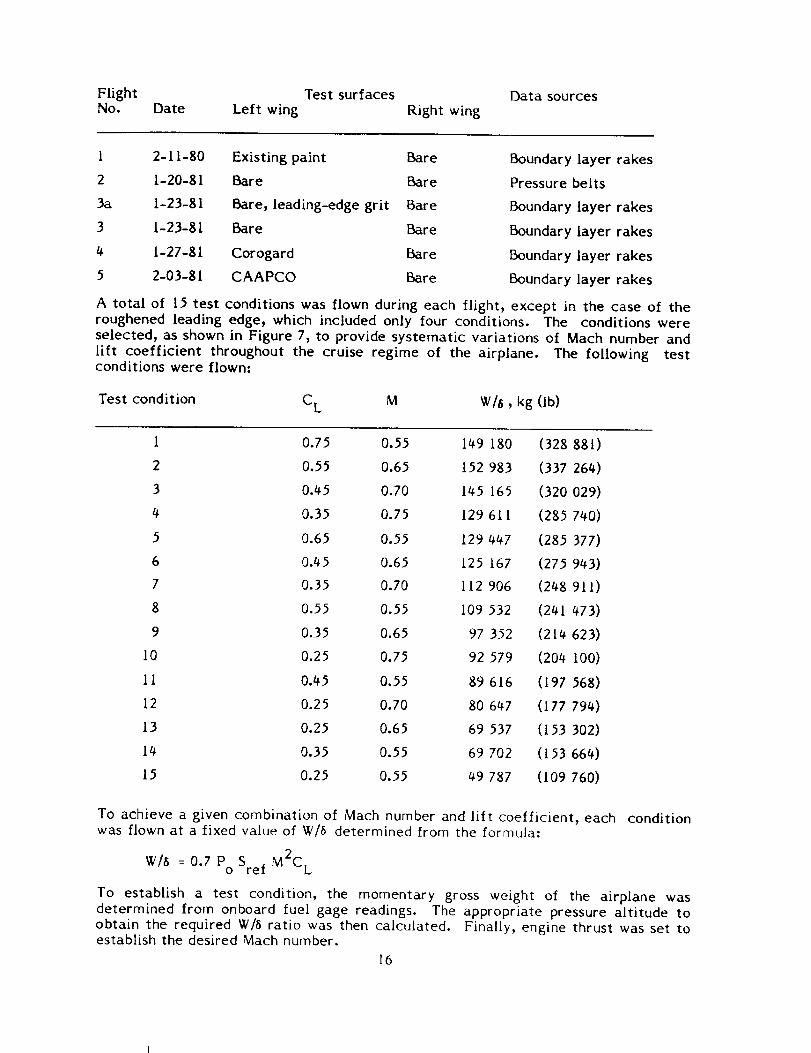
FlightNo. Date
Test surfacesLeft wing Right wing
Data sources
1 2-11-80 Existing paint Bare
2 1-20-81 Bare Bare
3a 1-23-81 Bare, leading-edge grit Bare
3 1-23-81 Bare Bare
4 1-27-81 Corogard Bare
5 2-03-81 CAAPCO Bare
Boundary layer rakes
Pressure belts
Boundary layer rakes
Boundary layer rakes
Boundary layer rakes
Boundary layer rakes
A total of 15 test conditions was flown during each flight_ except in the case of theroughened leading edge_ which included only four conditions. The conditions wereselected_ as shown in Figure 7, to provide systematic variations of Mach number andlift coefficient throughout the cruise regime of the airplane. The following testconditions were flown:
Test condition C L M W/a, kg (lb)
1 0.75 0.55 149 180 (328 881)
2 0.55 0.65 152 983 (337 264)
3 0.45 0.70 145 165 (320 029)
4 0.35 0.75 129 611 (285 740)
5 0.65 0.55 129 447 (285 377)
6 0.45 0.65 125 167 (275 943)
7 0.35 0.70 112 906 (248 911)
8 0.55 0.55 109 532 (241 473)
9 0.35 0.65 97 352 (214 623)
10 0.25 0.75 92 579 (204 100)
11 0.45 0.55 89 616 (197 568)
12 0.25 0.70 80 647 (177 794)
13 0.25 0.65 69 537 (153 302)
14 0.35 0.55 69 702 (153 664)
15 0.25 0.55 49 787 (109 760)
To achieve a given combination of Mach number and lift coefficient, each conditionwas flown at a fixed value of W/B determined from the formula:
W/a = 0.7 Po Sref M2CL
To establish a test condition, the momentary gross weight of the airplane wasdetermined from onboard fuel gage readings. The appropriate pressure altitude toobtain the required W/8 ratio was then calculated. Finally, engine thrust was set toestablish the desired Mach number.
16
12(4) hp = 0 km 2
= 0.25= 680 km/h (867 knl
O
X
_.=n,.,v
O
X
OZ
O
e,,
10 (3)
6
4 hpmax= 10.67 km (35 000 ft)
0 I I j I I I0.3 0.4 0.5 0.6 0.7 0.8 0.9
Math No., M
Range of Test ConditionsFigure 7.
During each condition, after the airspeed and altitude were stabilized and sideslip
was zeroed, a minimum of 2 minutes was allowed for data taking. This permitted at
least two full scanning cycles. Airspeed and altitude were held constant during thedata recording; the maximum allowable deviations from the nominal values were
_+5.5 km/h (_+3 kn) and _+7.6m (_+25 ft), respectively. There were about 3 to 5 minutes
between test conditions to change and stabilize speed and altitude. The usual
duration of the entire test sequence was about I hour 20 minutes.
4.1.2 TEST RESULTS
The section pressure distributions frown flight 2 were used, according to the method
described in Reference 3, to convert boundary layer momentum losses measured at
73% chord of the upper surface to full-chord section profile drag increments at the
measurement station. Boundary layer data from flight 3 (both test panels bare metal)
were compared and a correction factor was applied to the right wing reference panel
data. This permitted boundary layer changes due to coatings or paint (flights 2, %and 5) to be evaluated from data taken simultaneously on left and right wing panels.
17
Results of the boundary layer surveys and drag evaluations are presented in the
following paragraphs.
4.1.2.1 Boundary Layer Surveys
Results of the boundary layer surveys are presented in the following order:
I. Bare surfaces on both panels (flight 3)2. Corogard paint versus bare surface (flight 4)3. CAAPCO coating versus bare surface (flight 5)4. Rough leading edge (flight 3a)3. Existing paint versus bare surface (flight l)
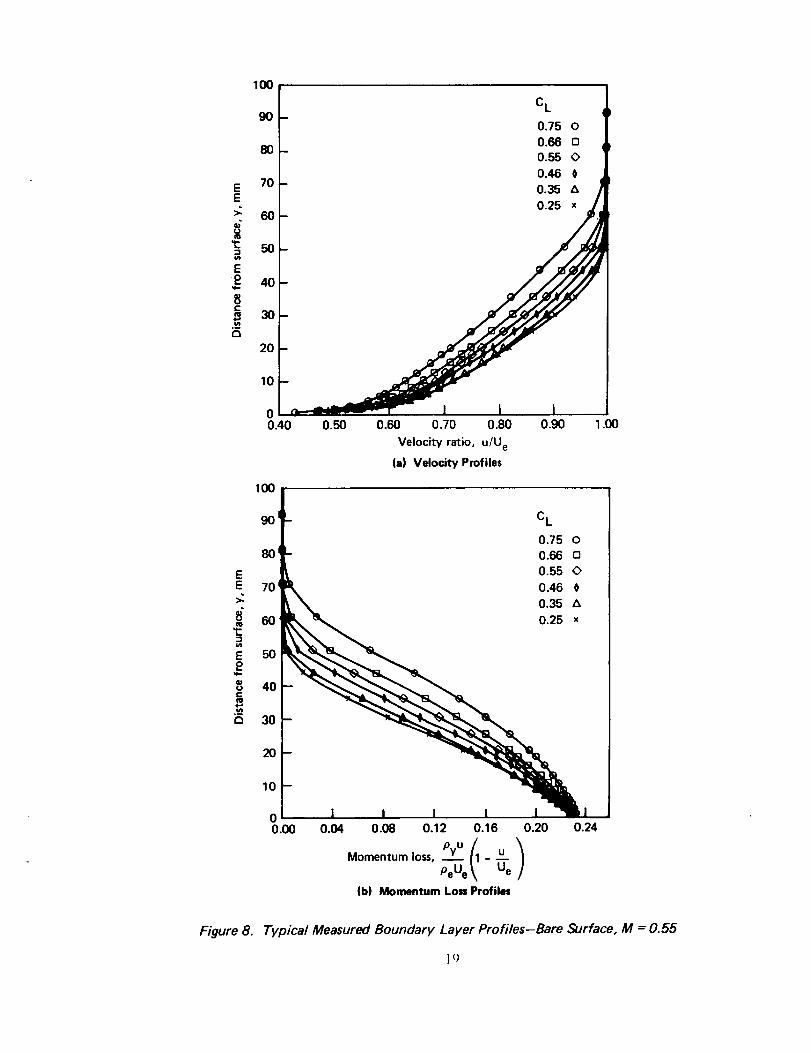
Bare-to-Bare-Surface Comparison-A typical set of measured boundary layer profilesis presented in Figure 8. These profiles show velocity variations and momentum lossvariations across the boundary layer for varying lift coefficient and constant Machnumber. The measurements indicate a very orderly behavior of the boundary layer,with steady increase in the velocity defect and momentum loss as lift coefficientincreases. The thickness of the boundary layer at the measurement station variesfrom about 50 to 80 mm (2 to 3 in). Figure 9 shows a comparison between theboundary layer profiles measured on the left and right wing panels. The profiles arenearly identical, both in terms of velocity defect and momentum defect. There is_however, a slight difference in the value of momentum thickness (derived byintegration of momentum loss profile) that was consistent and, therefore, not arandom error.
Figure I0 shows the corrected momentum thickness data comparing left and rightsides. Considering the greatly expanded scale, differences between the two sides arevery small, although at high lift coefficients the right side tends to show valuesslightly higher than those of the left side.
Corogard-to-Bare-Surface Comparison-Figure II illustrates a typical set of mea-sured boundary layer profiles for the Corogard-coated surface and the bare referencesurface. Corogard shows an increased velocity defect and momentum loss throughoutthe boundary layer and slightly increased local velocity (i.e., shear) next to thesurface. The case shown represents an average flight condition. At lower liftcoefficients (i.e._ higher Reynolds numbers) the increments are higher, whereas athigher lift coefficients (i.e., lower Reynolds numbers) the Corogard surface showslittle or no increment in momentum thickness relative to the bare surface. Theresults, in terms of adjusted momentum thickness increments and correspondingsection drag coefficient increments_ are presented in Figure 12. Distinct trends ofincreasing _,Cd with decreasing lift coefficients are evident. This apparent depen-dency on lift coefficient, however_ mainly reflects Reynolds number effects, asshown in Section 4.1.3.
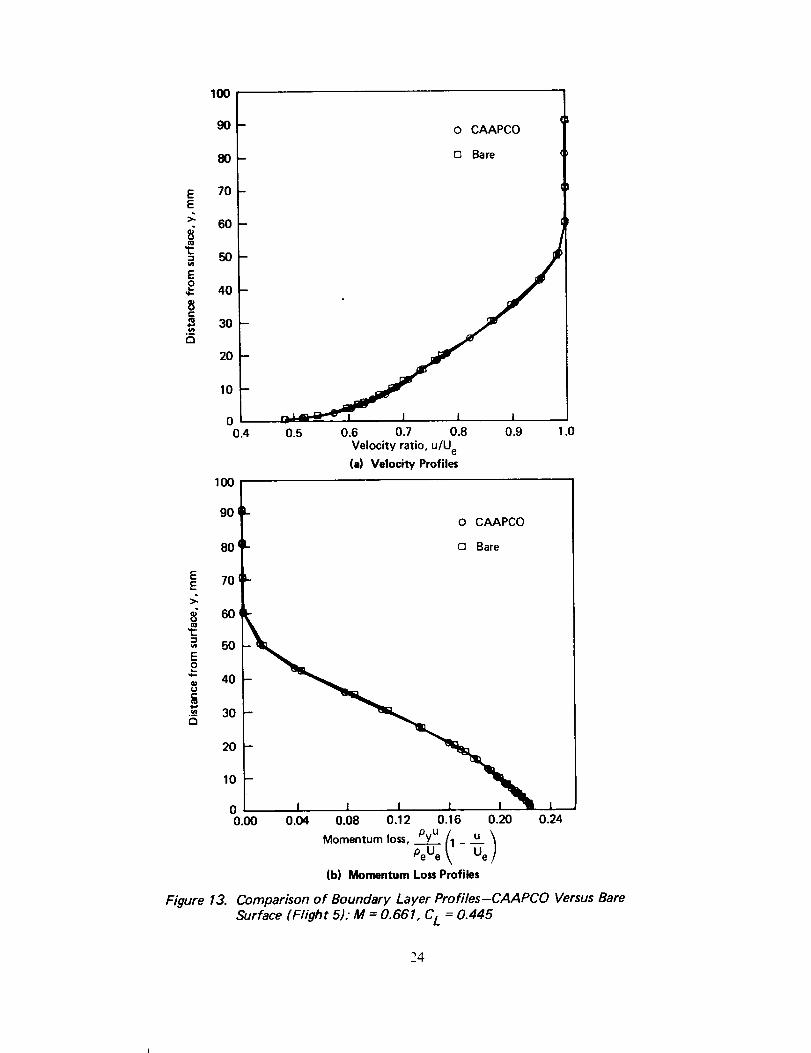
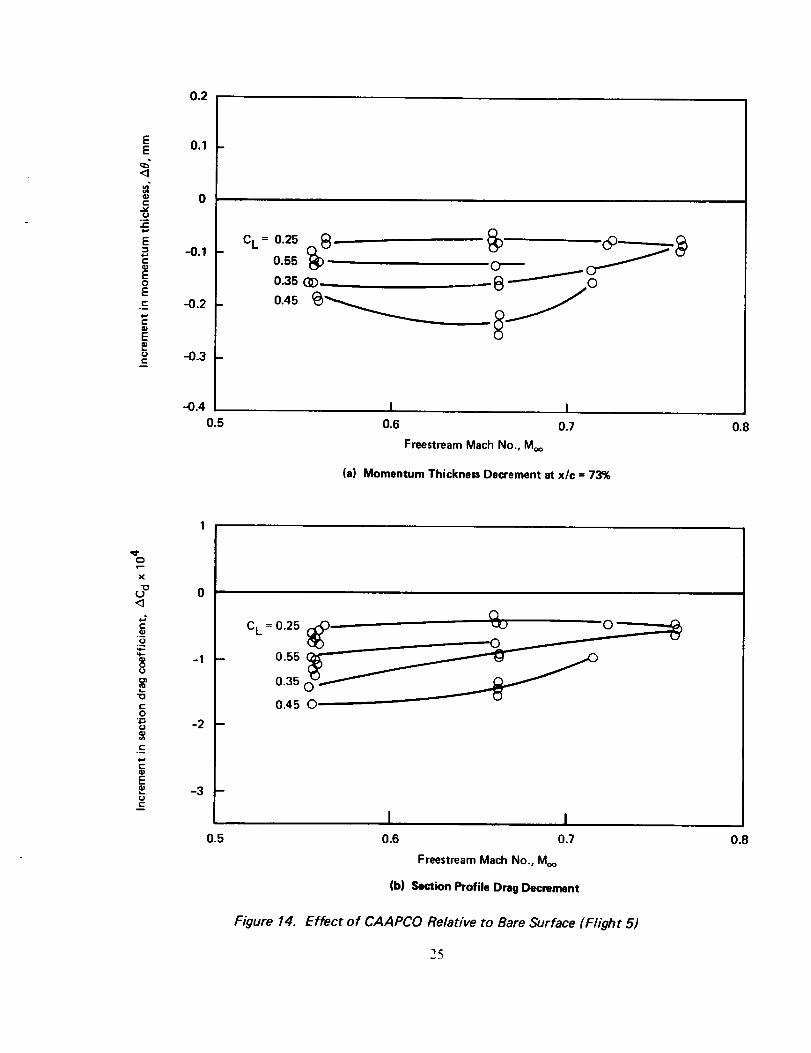
CAAPCO-to-Bare-Surface Comparison-The CAAPCO-coated surface is comparedwith the bare reference surface in Figure I3. The measurements show very smalldifferences in the velocity profiles or in the momentum loss profiles. However, whenthe measured momentum thickness is adjusted for differences between the referencepanel and the bare test panel9 the CAAPCO coating exhibits a lower momentumthickness than the bare surface. A small decrement in momentum thickness for theCAAPCO-coated surface is present throughout the entire range of test conditions.The decrements in 0 and the corresponding decrements in section drag coefficientare shown in Figure 14.
Figure 11. Comparison of Boundary Layer Profiles-Corogard and Bare
Surface (Flight 4); M = 0.716, CL = 0.251
3_
0.5
EE
<3
t-
._o
E2e-
EO
E,m
¢g
E
(Je"
m
0.4
0.3 --
0.2 -
0.1 -
0
0.5
C L = 0.25
0.35
0.45
O
O
O
O
o _-
O
O
Q O
O
0.55 00
I o I0.6 0.7 0.8
Freestream Mach No., Moo
(a) Momentum Thickness Increment at x/c = 73%
04--
X
(J
<14_r-
._
.o_
CD
8
"0
0
St.E
C
4
3
C L = 0.25
1 B
00.5
Figure 12.
o.__.__.O
O
0.35 Q 00 0
0.45 0 _0
0.55 0O
O
O
oO
0.6 0.7
Freestream Mach No., Moo
(b) Section Profile Drag Increment
Incremental Effect of Corogard Relative to Bare Surface (Flight 4)
0.8
23
190
90 - o CAAPCO
80- m Bare
_ 70
_ 8o
EP 40
_5
20
10
0.4 0.5 0.6 0.7 0.8 0.9 1.0
Velocity ratio, u/U e
(a) Velocity Profiles
100
90 L.
80 L
0 CAAPCO
0 Bare
70 L
_ 8o_ 50E
@ 40
20
10
0 I0.90 0.04 0.08 0.12 0.16 0.20 0.24
Momentum loss, PePYUu-----e(1- -'U'eU)
(b) Momentum Loss Profiles
Figure 13. Comparison of Boundary Layer Profiles-CAAPCO Versus Bare
Surface (Flight 5); M = 0.661, CL = 0.445
24
0.2
EE
<3=-¢Dt-,v
E2r-
E
OE
E
U
0.1
-0.1
-0.2 --
-0.3 -
-0.4
0.5
CL = 0.25 _8-0.55
0.35 GD--
o45
I I
0.6 0.7
Freestream Mach No., Moo
(a) Momentum Thickness Decrement at x/c = 73%
0.8
,¢Ov--
X
"OL)<3
+.*
(J
CO4_¢J
E.=(Je-
-1 -
-3
0.5
O
0.35
0.45 O
Figure 14.
I I0.6 0.7
Freestream Mach No., Moo
(b) Section Profile Drag Decrement
Effect of CAAPCO Relative to Bare Surface (Flight 5)
0.8
2S
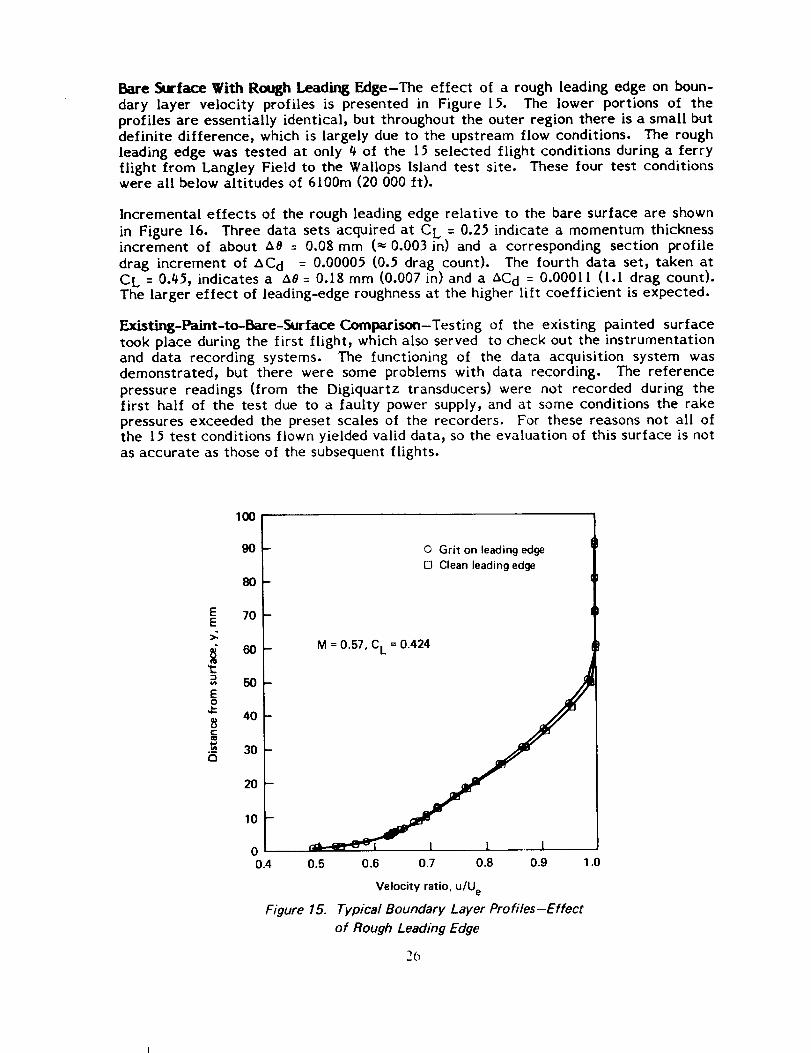
Bare Surface With Rough Leading Edge-The effect of a rough leading edge on boun-dary layer velocity profiles is presented in Figure 15. The lower portions of the
profiles are essentially identical, but throughout the outer region there is a small butdefinite difference, which is largely due to the upstream flow conditions. The roughleading edge was tested at only 4 of the 15 selected flight conditions during a ferryflight from Langley Field to the Wallops Island test site. These four test conditionswere all below altitudes of 6100m (20 000 ft).
Incremental effects of the rough leading edge relative to the bare surface are shownin Figure 16. Three data sets acquired at C L = 0.25 indicate a momentum thicknessincrement of about A0 = 0.08 mm (-_ 0.003 in) and a corresponding section profiledrag increment of AC d = 0.00005 (0.5 drag count). The fourth data set, taken atCL = 0.45, indicates a A0 = 0.18 mm (0.007 in) and a AC d = 0.00011 (l.[ drag count).The larger effect of leading-edge roughness at the higher lilt coefficient is expected.
Existing-Paint-to-Bare-Surface Comparison-Testing of the existing painted surfacetook place during the first flight, which also served to check out the instrumentationand data recording systems. The functioning of the data acquisition system wasdemonstrated, but there were some problems with data recording. The referencepressure readings (from the Digiquartz transducers) were not recorded during thefirst half of the test due to a faulty power supply, and at some conditions the rakepressures exceeded the preset scales of the recorders. For these reasons not all ofthe 15 test conditions flown yielded valid data) so the evaluation of this surface is notas accurate as those of the subsequent flights.
EE
aE2
0
_5
lOO
9o
8o
70
6o
50
P
40-
30-
20-
10 -
00.4
Figure 15.
O Grit on leading edge
[] Clean leading edge
M = 0.57, C L = 0.424
0.5 0.6 0.7 0.8 0.9 1.0
Velocity ratio, u/U e
Typical Boundary Layer Profiles-Effect
of Rough Leading Edge
2O
0.5
EE
=-¢bc"
.1¢
.2
E
¢-
EO
Ec-
t.>t-
0.4
0.3
0.2
0.1 i
0
-0.10.5
CL= 0.45
O
O
C L = 0.25
O
O%
I l0.6 0.7 0.8
Freestream Mach No., Moo
(e) Increment in Momentum Thickness
0e--
X
"O
C)
<3
c-Q)
=
(J
O_
_0
0
¢J
EP¢JC
m
0
-1
0.5
C L = 0.45
C L = 0.25
O_1 0
O
0
0 0
I I0.6 0.7
Freestream Mach No., Moo
(b) Increment in Section Drag Coefficient
Figure 16. Effect of Rough Leading Edge (Flight 3a)
27
0.8
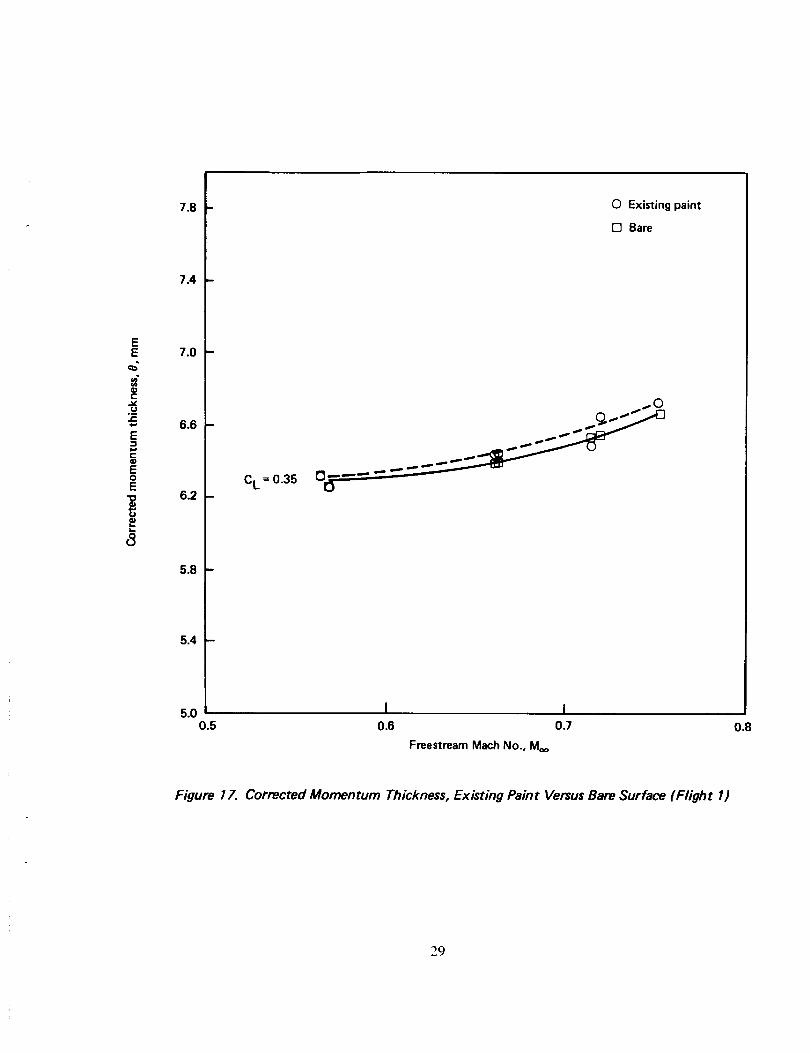
The painted surface showed a small increase in velocity defect compared to the barereference surface. Howeverj the momentum thickness data derived from themeasurements indicated that the increments between the two test surfaces were not
always consistentt as shown in Figure 17 for a typical set of test conditions (C L =0.35). The painted surface appeared to have slightly higher drag than the baresurface, although the increments are about the same magnitude as the experimentaldata scatter.
1_.1.3 CONCLUSIONS
The test provided a set of highly accurate basic data showing the effects of varioussurface finishes, including bare metal, Corogard, CAAPCO, polyurethane enamel, andleading-edge roughness, on boundary layer properties. The Corogard applied at thetest site was slightly rougher than is typical of factory applications. A severelyeroded leading edge was simulated with No. 50 grit.
The effects of the measured boundary layer differences were converted to incre-ments in section profile drag at the test stations on the 737 wing, and thecorresponding effects on total airplane drag were estimated. These effects arepresented in the following sections.
#.l.3.1Secti_ _
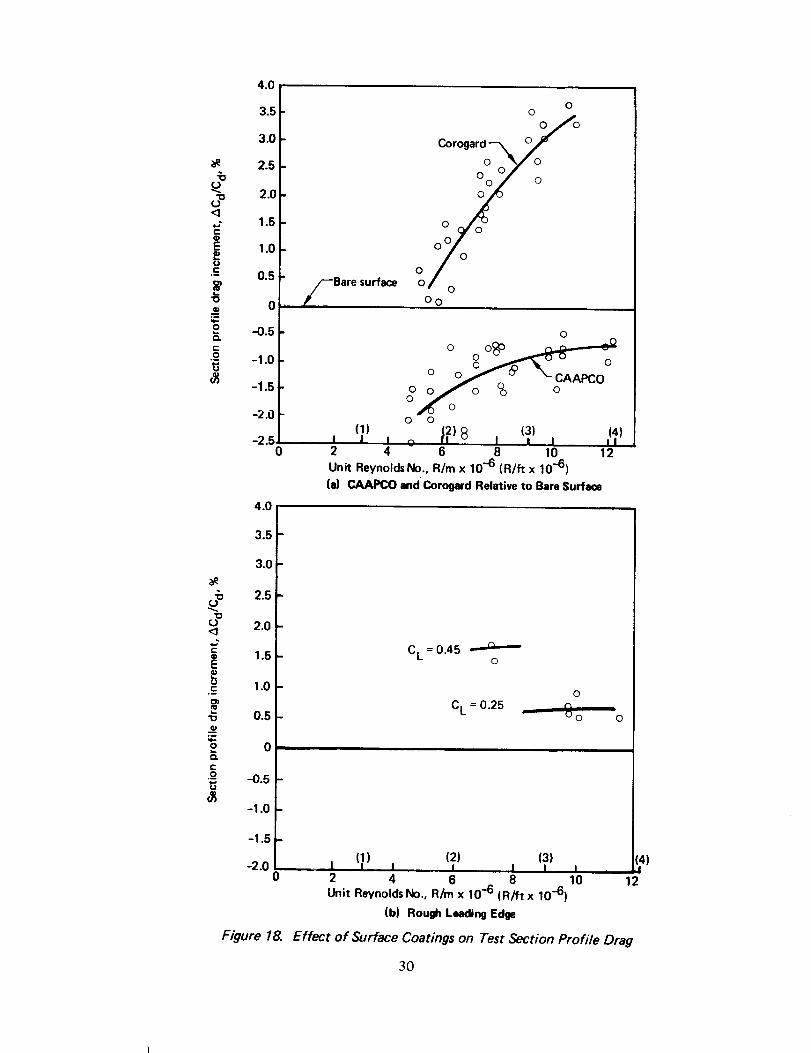
Final drag evaluation results for each test surface are presented in Figure 15 assection profile drag increments plotted as a function of freestream unit Reynoldsnumber. The data were plotted in this form because classic experiments indicatethat unit Reynolds number is the primary factor in distributed roughness effects.
Bare-to-bare-surface comparisons indicated a small difference in section profile dragbetween the left and right wing test sections, which amounted to an average of about0.3596. No definite trends were discernible with Reynolds number, Mach number, orlift coefficient. This drag difference found on the baseline configuration wasaccounted for when assessing effects of the other surface coatings tested:
CAAPCO coating produced a lower drag than the bare reference surface, about0.7596 to 296 of the section profile drag. At a typical cruise Reynolds numberof 6.5 million per meter (2 million per foot), the section drag decrement is1.#96. The 2% decrement is applicable to lower Reynolds numbers or higher liftcoefficients.
Corogard surface showed a clear trend of increasing drag with increasing unitReynolds number when the latter exceeded a certain limit below which thesurface was indicated to be hydraulically smooth. This critical Reynoldsnumber was about #.9 million per meter (1.5 million per foot) for the particularsurface tested. At the highest Reynolds numbers of this test, the sectionprofile drag increment was about 3.596. At a typical cruise Reynolds number of6.5 million per meter (2.0 x 10 million per foot) the increment was 1.296.
The rough leading edge test showed a drag increment amounting to about 0.6596of the section profile drag at three test conditions flown at C L = 0.25 and about1.696 at one condition flown at C L = 0.#5.
28
EE
C
.__
E
c
E0E
7.8
7.4
7.0
6.6
6.2 m
5.8 -
5.4 -
0
C L = 0.35 O_
0 Existing paint
[] Bare
5.o, I i0.5 0.6 0.7
Freestream Mach No., Moo
0.8
Figure 17. Corrected Momentum Thickness, Existing Paint Versus Bare Surface (Flight I)
29
"oO
"oO<34-*r-eL)
E==U
(-
q,.
2o.c-
.9
q_(J<34.*
E
bt-
"o
N-
O
O.¢-
._o
4.0
3.5
3.0
2.5
2.0
1.5
1,0
0.5
0
-0,5
-1.0
-1.5
-2.0
-2.50
4.0
3.5"
3.0
2.5
2.0
1.5
1.0
0.5
0
-0.5-
-1.0 -
-1.5 -
-2.00
Figure 18.
Bare surface
O(3
Oo
O
O O
°,Loo o
(,) }2)8 (3)! I 1 o ! i !2 4 6 8 10 12
Unit Reynol_ No., R/m x 10 .-6 (R/It x 10-6)
(a) CAAPCO andCorogard Relative to Bare Surface
CL = 0.45o
o
CL = 0.25 _ _ o 0
1 (2) (3)I (i) I I i I2 4 6 8
Unit Reynolds No., R/m x 10 -6 (R/ft x 10-6)
(b) Rough Leading Edge
I10
Effect of Surface Coatings on Test Section Profile Drag
3O
(_4)12
The existing painted surface showed a slightly higher drag level than the baresurface. The increments, however, were of the same magnitude as theexperimental scatterband, so these results were not conclusive.
4.1.3.2 Conversion to Airplane Drag
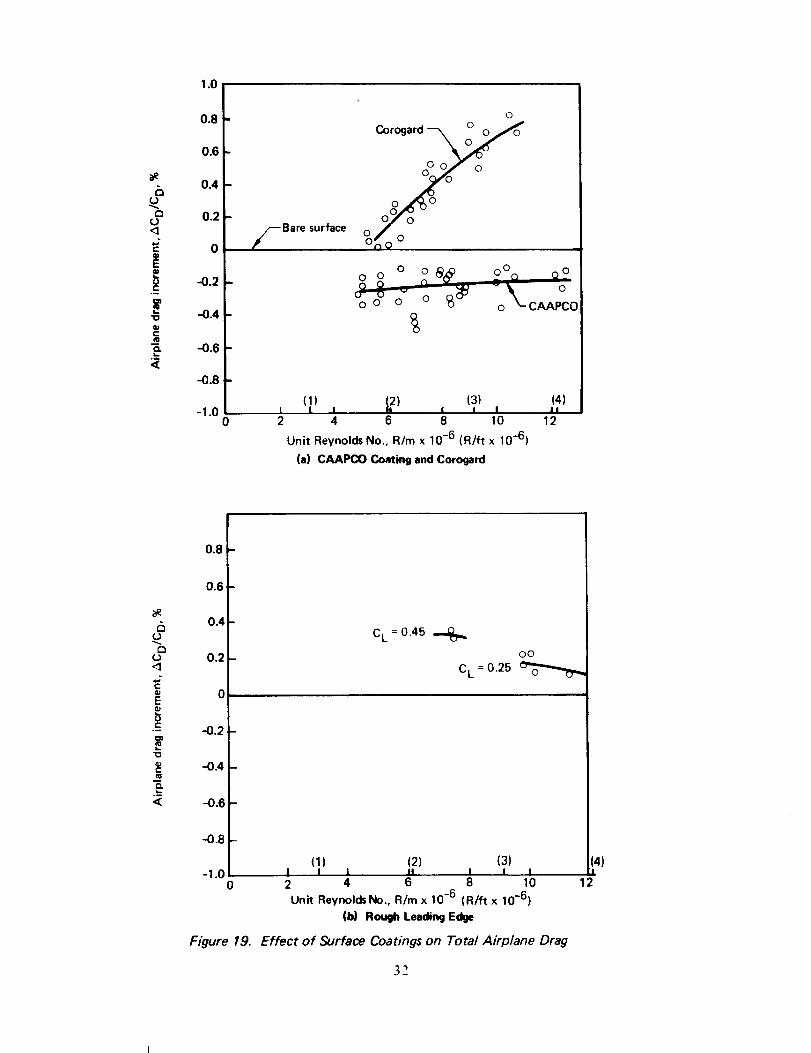
To accurately determine the effect on total airplane drag, additional measurementswould have to be made at enough spanwise stations to permit integration over theentire wingspan. If, however, it is assumed that the same section drag coefficientincrements occur at all spanwise stations, the total airplane drag increments can beestimated. Results of such calculations are presented in Figure 19. For the Corogarddata only, an adjustment was made for differences in the amount of Corogard atvarious stations on production 737 airplanes. For the test airplane, 57.5% chord wascovered with Corogard at the test station, while 42% is an appropriate average forthe entire wing upper surface of production airplanes. This adjustment is consideredappropriate because the Corogard data exhibit typical distributed roughness charac-teristics. For CAAPCO and the roughened leading edge, however, the data behave asif discrete roughness elements are involved. Hence the effects may not vary in asimple manner with coated areas, and the drag coefficient increments were assumedto be independent of spanwise location:
At a typical cruise condition, C L = 0.45 and R = 6.5 million per meter(2.0 million per foot)9 the total airplane drag increments relative to the baresurface for the test airplane are estimated to be:
CAAPCO
CorogardRough leading edge
0.2% decrease0.2% increase0.3% increase
The Corogard drag increments observed at higher Reynolds numbers are equi-valent to as much as 0.75% airplane drag. A precise assessment of the effectsof these drag increments on the fuel consumption of an airplane in airlineoperation must be based on a complete mission profile analysis. The effects onfuel consumption are addressed in Section 4.¢.
As indicated by this test, CAAPCO produces a small drag benefit. The benefitis thought to result from smoothing fasteners and joints in the bare metal;therefore, this benefit may vary considerably at other span stations or for otherairplanes. Before CAAPCO could be used in the inspar region, corrosionprotection equivalent to Corogard would have to be thoroughly demonstrated.
_.2 FLIGHT SERVICE EVALUATIONS
Continental Airlines (CO) and Delta Air Lines (DL) conducted evaluations on the
candidate coatings applied to wing slat and horizontal tail leading edges for erosionprotection. Airline maintenance personnel applied the coatings with normal paintspray equipment during periods of scheduled maintenance.
4.2.1 CONTINENTAL AIRLINES EVALUATION
CO conducted two flight service evaluations of surface coatings in series. The firstevaluation, flown in the Air Micronesia route system, began in September 1978 andended in November 1979. Results from that 14-month evaluation in the harsh Pacificenvironment are reported in Reference 2. The second evaluation began in December
31
1,0
(J<1
t-
(Je-
qO
E
<C
0.8
0.6
0.4
0.2
0
-0.2
-0.4
-0.6
-0.8
-1.0
Bare surface
O
Corogard
Z °0 0
°On9 °
(1) (2) (3) (4)I I I II I I I i,
2 4 6 8 10 12
Unit Reynolds No., R/m x 10 .6 (R/ft x 10-6)
(a) CAAPCO Coating and Corogard
O
¢3L)<3
E
C
<_
0.8
0.6-
0.4-
0.2-
0
-0.2
-0A -
-0.6
-0.8
-1.00
C L = 0.45
OO
C L = 0.25
(1) (2) (3)I I i II I I I2 4 6 8 10
Unit ReynoldsNo., R/m x 10 -6 (R/ft x 10-6)
(b) Rough Leading Edge
Figure 19. Effect of Surface Coatings on Total Airplane Drag
1979 when the airplane was [Lying U.S. domestic routes. In October 1980, this
airplane was transferred to the Air Micronesia system and was destroyed in an
accident I month later. The right outboard horizontal tail leading edge, which had
been coated in the laboratory with the three test coatings and which had been servingas a control part, was removed intact and installed on another Air Micronesia 727
until October 1981. Results of the second CO evaluation, emphasizing results on the
control part, are reported in the following paragraphs.
4.2.1.1 Coating Configuration
Coatings were applied to wing slat leading edges and the outboard half of the
horizontal tail leading edge (fig. 20). All field coated parts were primed with BMS
I0-79 epoxy primer and coated with approximately 12 rail of either CAAPCO B-270
or Chemglaze M313. The slat coatings were a strip of constant 9.53-cm- (3.75-in-)
wraparound width at the leading edge, whereas the horizontal tail coatings tapered
from 25-cm- (I l-in-) wraparound width at the inboard end to 15 cm (6 in) at the tip.
The right outboard horizontal tail leading edge had been coated in Avco SystemsDivision laboratories with g9-cm- (35-in-) long panels of each of the three candidate
materials indicated in Figure 20. A I2.7-cm (J-in) strip of bare metal separated the
coatings to obtain an indication of bare-metal erosion that would occur during theflight service evaluation (the part was new when coated and installed on the
airplane). CO maintenance personnel coated the opposite left leading edge with
CAAPCO only. The right leading edge served as a control part for comparing the
durability o[ laboratory-appLied coatings with that of coatings applied by airline
personnel during scheduled maintenance.
33
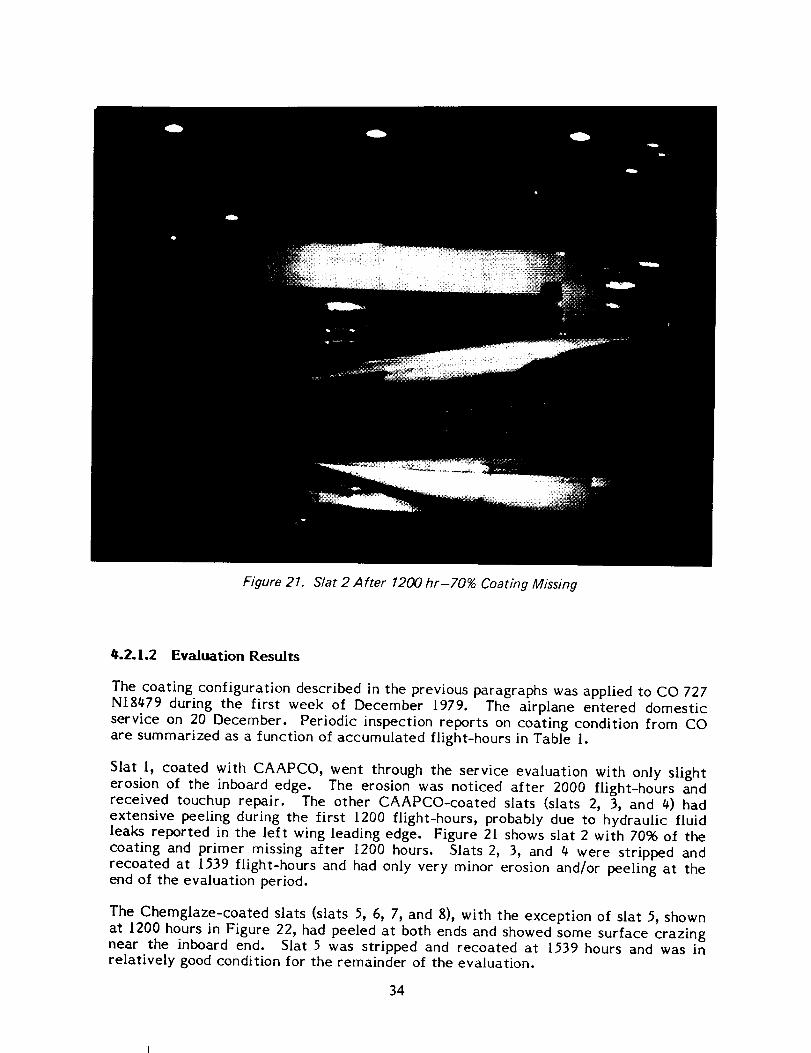
Figure 21. Slat 2 After 1200 hr-70% Coating Missing
_.2.l.2 Evaluation Results
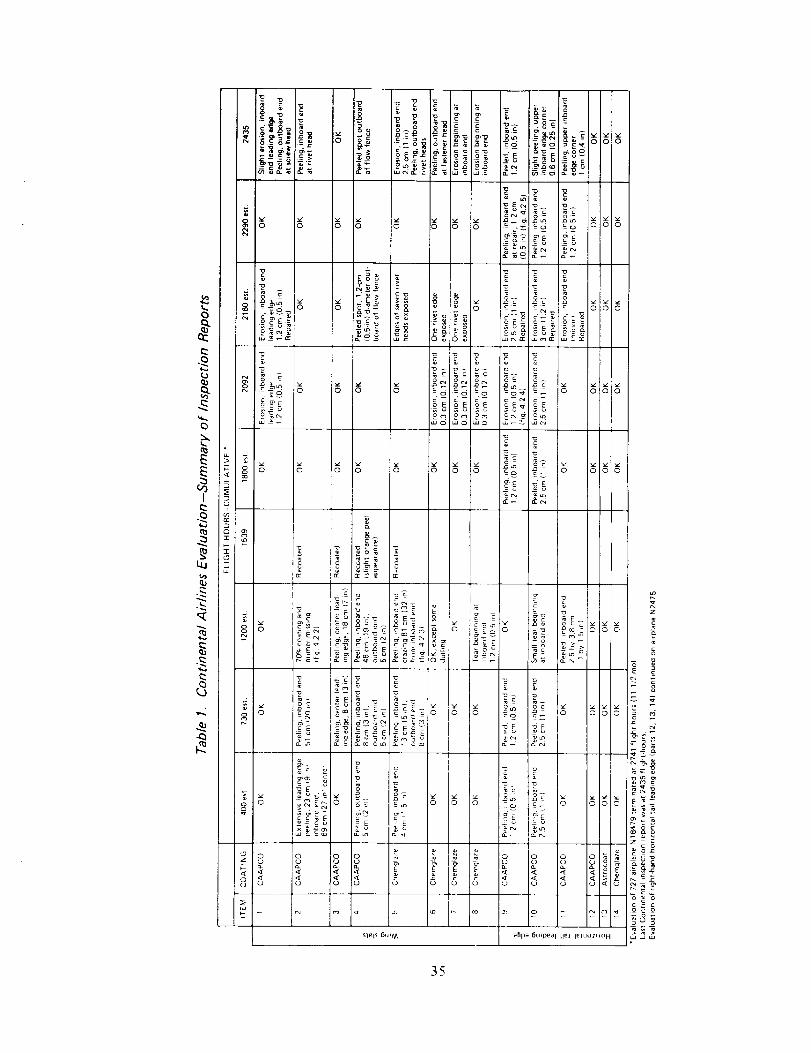
The coating configuration described in the previous paragraphs was applied to CO 727NIg479 during the first week of December 1979. The airplane entered domesticservice on 20 December. Periodic inspection reports on coating condition from COare summarized as a function of accumulated flight-hours in Table I.
Slat 19 coated with CAAPCO, went through the service evaluation with only slighterosion of the inboard edge. The erosion was noticed after 2000 flight-hours andreceived touchup repair. The other CAAPCO-coated slats (slats 2, 3, and 4) hadextensive peeling during the first 1200 flight-hours, probably due to hydraulic fluidleaks reported in the left wing leading edge. Figure 21 shows slat 2 with 70% of thecoating and primer missing after 1200 hours. Slats 2, 3, and 4 were stripped andrecoated at 1539 flight-hours and had only very minor erosion and/or peeling at theend of the evaluation period.
The Chemglaze-coated slats (slats 5, 6, 7, and g), with the exception of slat 5, shownat 1200 hours in Figure 22, had peeled at both ends and showed some surface crazingnear the inboard end. Slat 5 was stripped and recoated at 1539 hours and was inrelatively good condition for the remainder of the evaluation.
34
uJ
E
I gt
o
(D
..q
-_o- o
I=._E
c_
8Q.
8
ud
•-_: _-_ __o_ oE_= o_, o_,_-- r_-_ _ _,o _'o
_._._ w= o _ x
o -o -_ -o',_E-- E_'E_ E--N,oE oE _E oE_:
g _ g g g g _-o _ g
o_ c_ c_ o
_ ° ___ -_ _oo
_- _ "_ ,
c c _ c- c-
u IU
slels 6u_f_
_c
oenl , o -
_ ggg_cE _
0 0 0
555
_- z
_n _:
{E "SE _ r,;
_ __< "_ < '- r--
aBpa 6mpea I l!el lelUOZ!JOH _-_u__ _
35
Figure 22. Slat 5 After 1200 hr-Peeling at Inboard End
The three CAAPCO-coated panels (items 9, 10, and 1[) on the left outboardhorizontal tail experienced early edge peeling at the inboard ends that extendedabout 1.2 to 2.5 cm (0.5 to [ in) into the coated leading edge. Figure 23 shows thiscondition at the inboard end of item 9 after 2092 flight-hours. Shortly thereafter (at2160 hours)) touchup repair of these areas was attempted and) after a cure time ofabout 40 hours) the airplane returned to flight status. The next field inspection) at2290 flight-hours) revealed that the repairs were not properly accomplished andpeeling recurred) as shown in Figure 24, The touchup repairs on items I) 9) 10) and i I
required 5 labor-hours to complete.
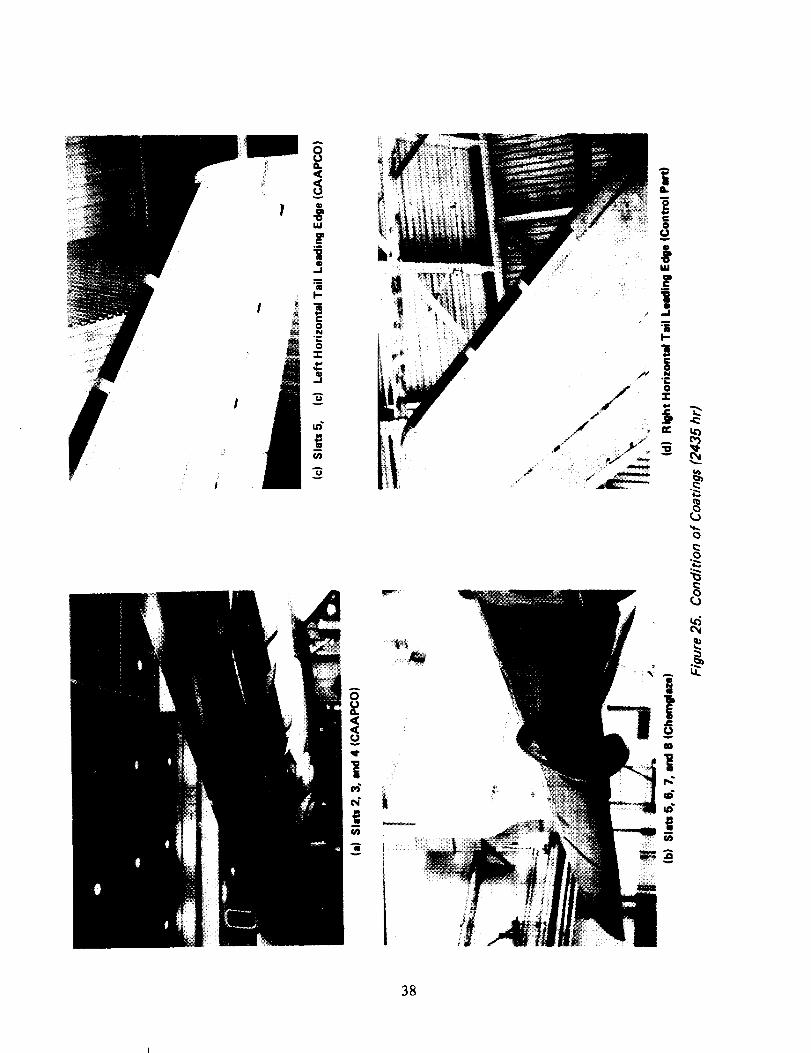
The last inspection was conducted at 2435 flight-hours) just before airplane N18479was transferred to Air Micronesia service. Photos taken then (figs. 25a, b, c, d) show
the generally good appearance of the coatings. The small discrepancies identified inTable 1 are not apparent.
The flight service evaluation of coatings on N18479 was terminated at 2741 flight-hours. During that time, coatings on the horizontal tail control part had not beenrepaired and showed no evidence of deterioration. It was decided that the evaluationof that part should continue so that the durability of laboratory-applied coatingscould be assessed. The control part, therefore, was transferred to airplane N2475 andwas flown an additional 8 months in Air Micronesia service.
36
Figure 23. Erosion at Inboard End of Item 9 (2092 hr)
I
Figure 24. Peeling of Touchup Repair on Inboard End of Item 9 (2290 hr)
3?
38
The control part was inspected at Guam after 3815 flight-hours (fig. 26a). Chem-glaze) on the outboard panel) and CAAPCO, on the inboard panel, were in goodcondition. The Astrocoat center panel) (fig. 26b) had three small spots on the leadingedge where the coating had eroded down to bare metal.
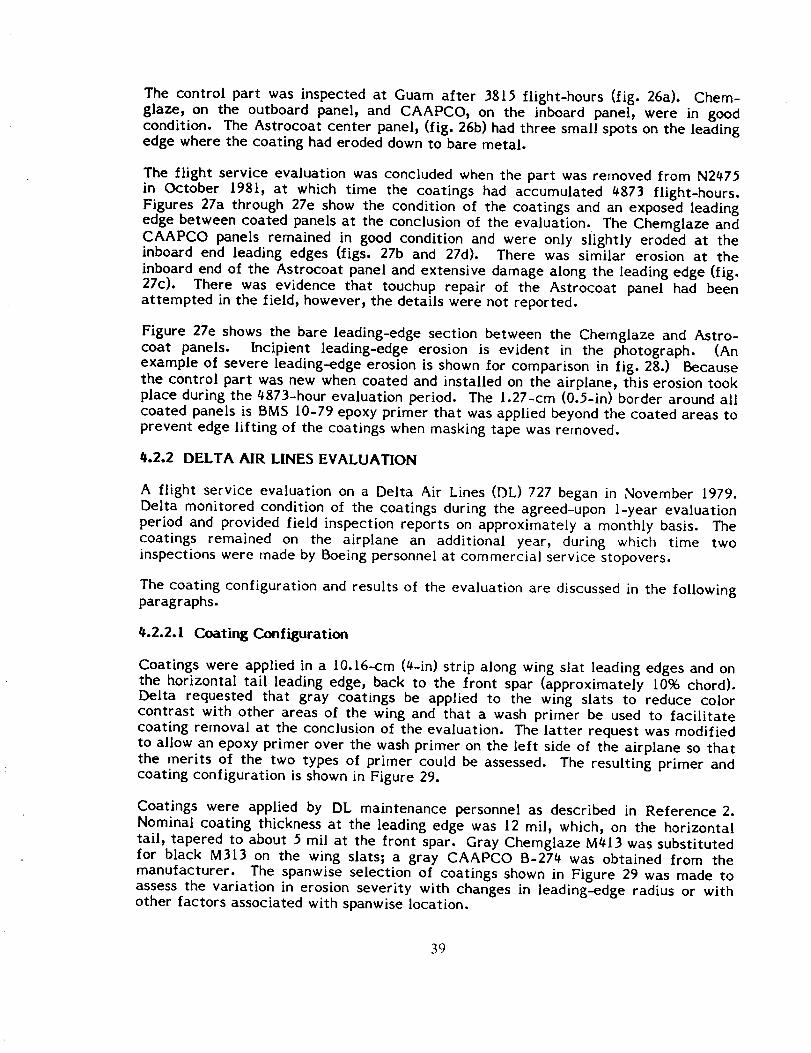
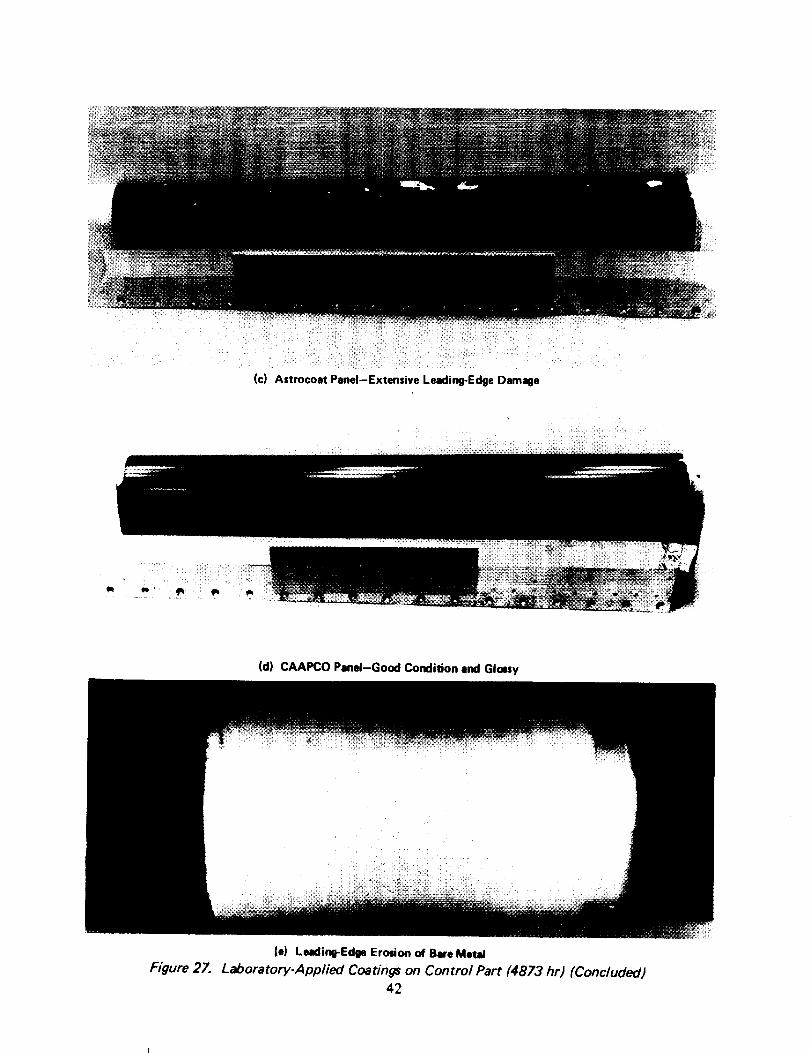
The flight service evaluation was concluded when the part was removed from N2475in October 1981) at which time the coatings had accumulated 4873 flight-hours.Figures 27a through 27e show the condition o[ the coatings and an exposed leadingedge between coated panels at the conclusion of the evaluation. The Chemglaze andCAAPCO panels remained in good condition and were only slightly eroded at theinboard end leading edges (figs. 27b and 27d). There was similar erosion at theinboard end of the Astrocoat panel and extensive damage along the leading edge (Jig.27c). There was evidence that touchup repair of the Astrocoat panel had beenattempted in the field) however) the details were not reported.
Figure 27e shows the bare leading-edge section between the Chemglaze and Astro-coat panels. Incipient leading-edge erosion is evident in the photograph. (Anexample o[ severe leading-edge erosion is shown for comparison in fig. 28.) Becausethe control part was new when coated and installed on the airplane) this erosion tookplace during the $873-hour evaluation period. The 1.27-cm (0.5-in) border around allcoated panels is BMS 10-79 epoxy primer that was applied beyond the coated areas toprevent edge lifting of the coatings when masking tape was removed.
4.2.2 DELTA AIR LINES EVALUATION
A [light service evaluation on a Delta Air Lines (DL) 727 began in November 1979.Delta monitored condition o[ the coatings during the agreed-upon l-year evaluationperiod and provided field inspection reports on approximately a monthly basis. Thecoatings remained on the airplane an additional year_ during which time twoinspections were made by Boeing personnel at commercial service stopovers.
The coating configuration and results of the evaluation are discussed in the followingparagraphs.
4.2.2.1 Coating Configuration
Coatings were applied in a 10.16-cm (4-in) strip along wing slat leading edges and onthe horizontal tail leading edge, back to the front spar (approximately 10% chord).Delta requested that gray coatings be applied to the wing slats to reduce colorcontrast with other areas of the wing and that a wash primer be used to facilitatecoating removal at the conclusion o[ the evaluation. The latter request was modifiedto allow an epoxy primer over the wash primer on the left side of the airplane so thatthe merits of the two types o[ primer could be assessed. The resulting primer andcoating configuration is shown in Figure 29.
Coatings were applied by DL maintenance personnel as described in Reference 2.Nominal coating thickness at the leading edge was 12 rail, which, on the horizontaltail) tapered to about 5 mil at the front spar. Gray Chemglaze M_I3 was substitutedfor black M313 on the wing slats; a gray CAAPCO B-274 was obtained from themanufacturer. The spanwise selection ol coatings shown in Figure 29 was made toassess the variation in erosion severity with changes in leading-edge radius or withother [actors associated with spanwise location.
39
(a) Control Part Coating Panels
(b) Astrocoat Center Panel-Three Small Erosion Spots on Leading Edge
Figure 26. Laboratory-Applied Coatings on Control Part (3815 hr)
4O
(a) Three Coated Panels on Control Part After Service Evaluation
(b) Chemglaze Panel-Good Condition, Except Some Dulling
Figure 27. Laboratory-Applied Coatings on Control Part (4873 hr)
Laboratory-Applied Coatings on Control Part (4873 hr) (Concluded)42
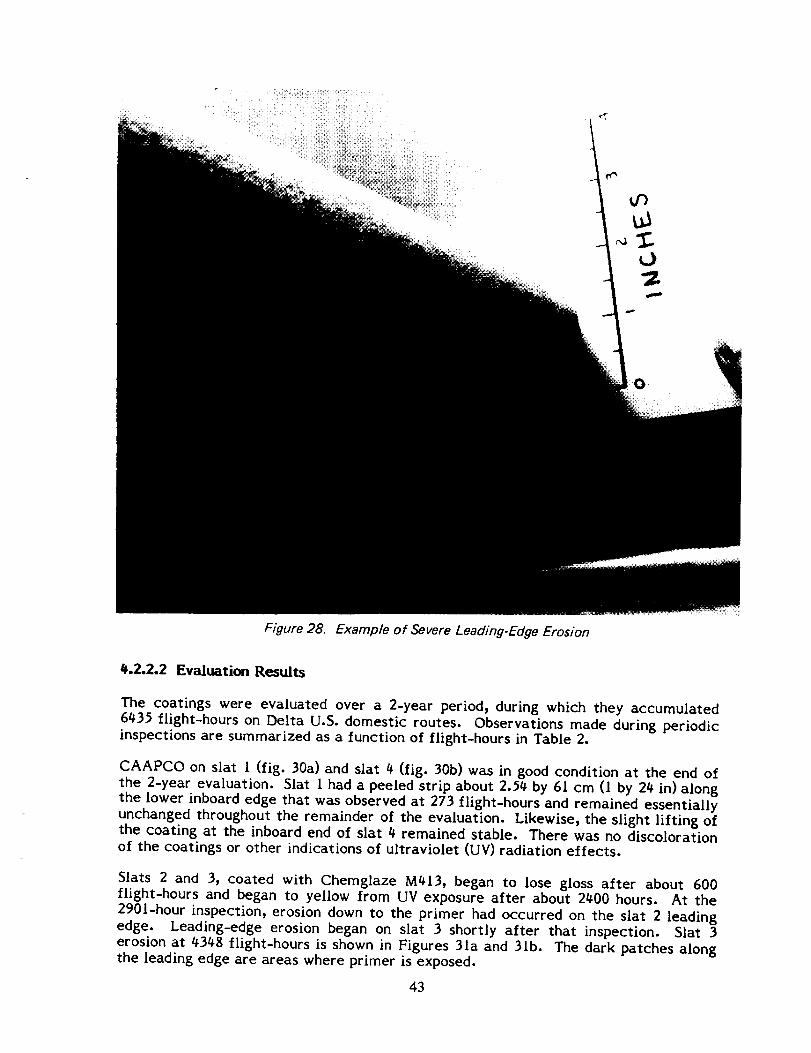
Figure 28. Example of Severe Leading-Edge Erosion
_.2.2.2 Evaluation Results
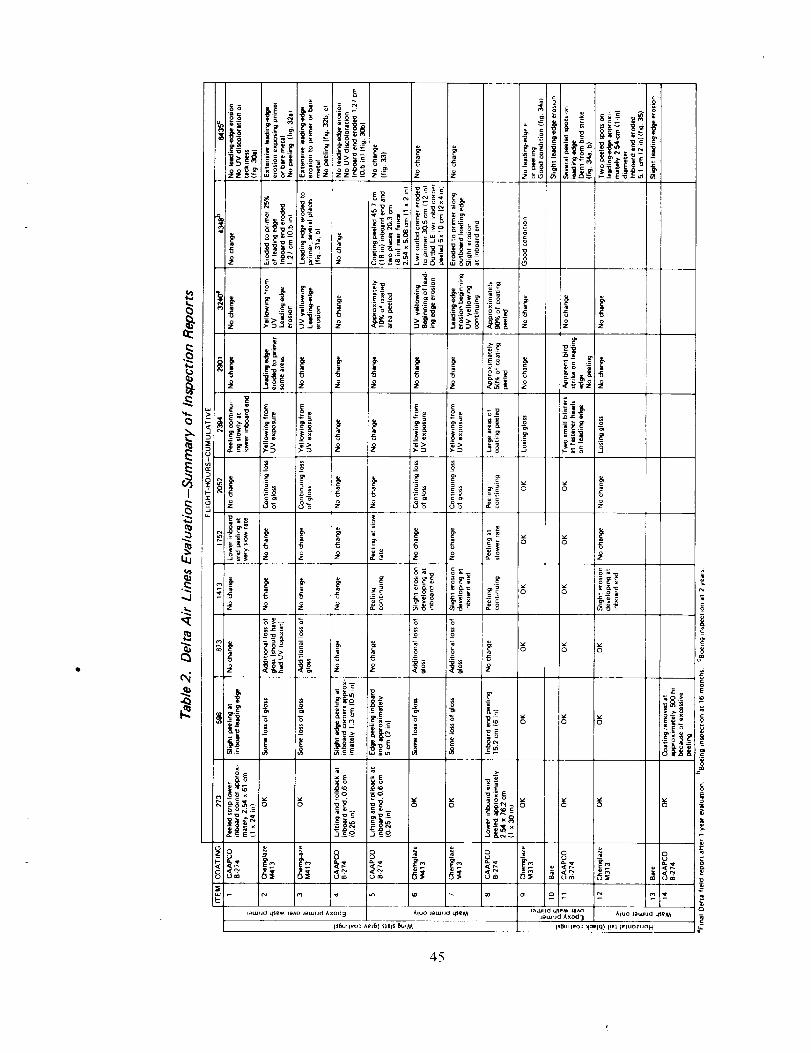
The coatings were evaluated over a 2=year period, during which they accumulated6#35 flight-hours on Delta U.S. domestic routes. Observations made during periodicinspections are summarized as a function of flight-hours in Table 2.
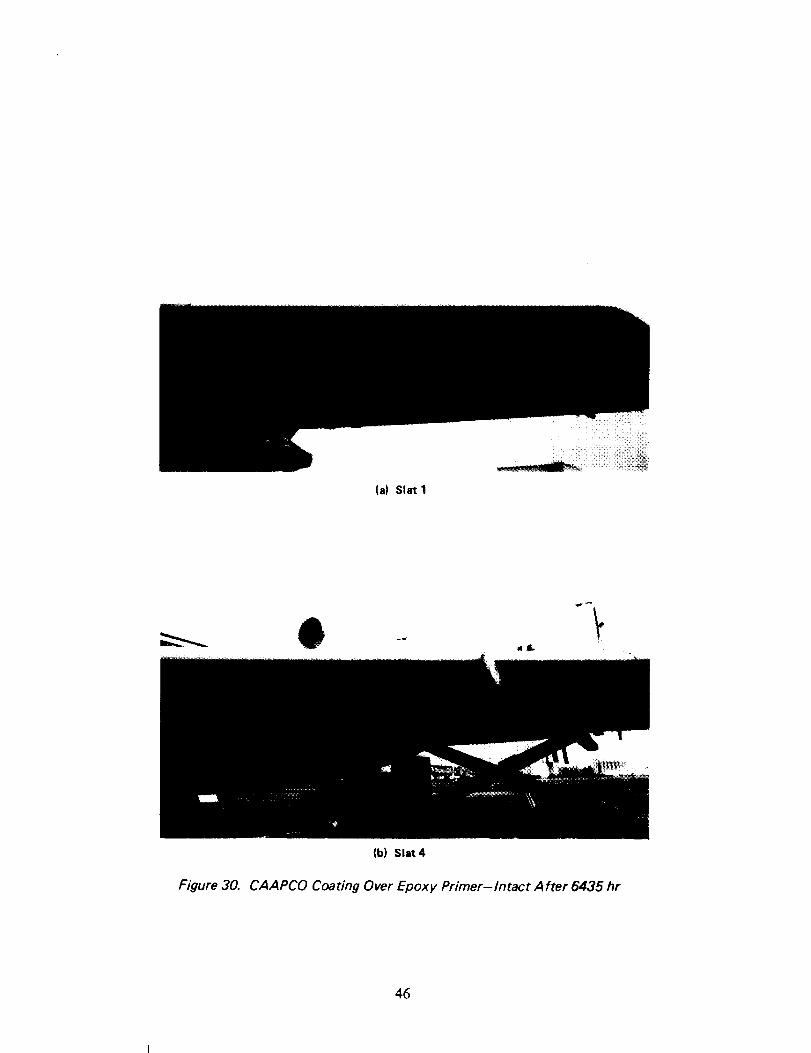
CAAPCO on slat I (fig. 30a) and slat # (fig. 30b) was in good condition at the end ofthe 2-year evaluation. Slat I had a peeled strip about 2.54 by 61 cm (1 by 2# in) alongthe lower inboard edge that was observed at 273 flight-hours and remained essentiallyunchanged throughout the remainder of the evaluation. Likewise, the slight lifting ofthe coating at the inboard end of slat _ remained stable. There was no discolorationof the coatings or other indications of ultraviolet (UV) radiation effects.
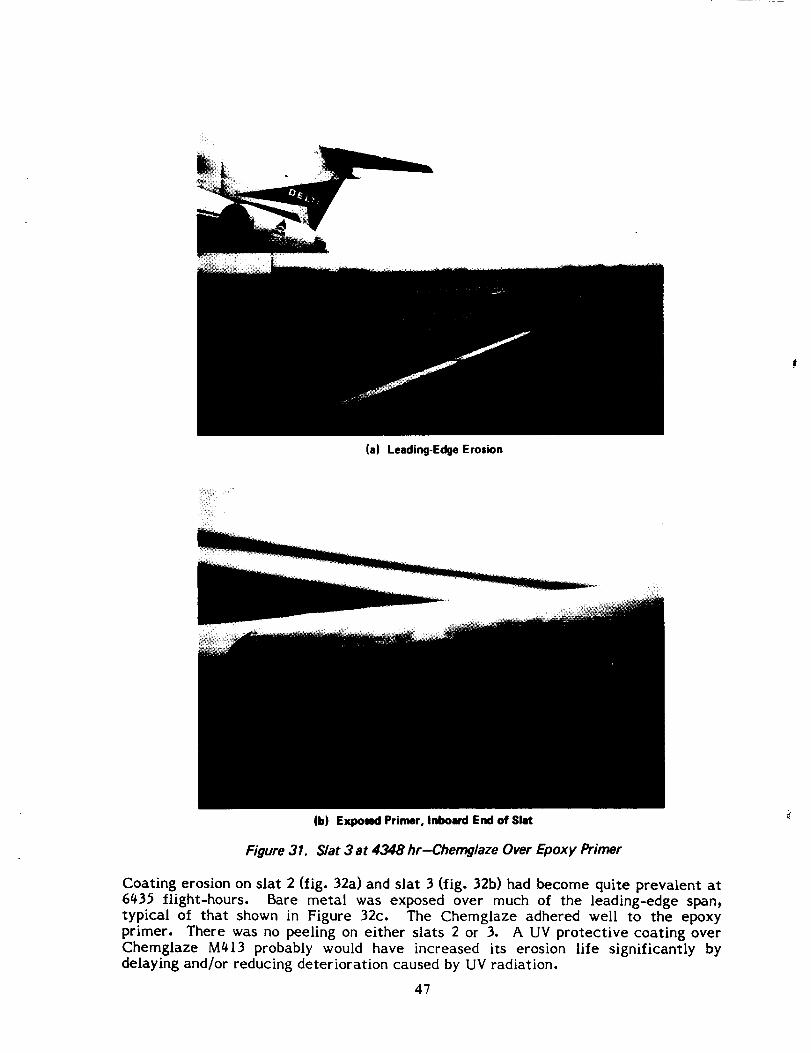
Slats 2 and 3, coated with Chemglaze M#13, began to lose gloss after about 600flight-hours and began to yellow from UV exposure after about 2_00 hours. At the2901-hour inspection, erosion down to the primer had occurred on the slat 2 leadingedge. Leading-edge erosion began on slat 3 shortly after that inspection. Slat 3erosion at 43#8 flight-hours is shown in Figures 31a and 3lb. The dark patches alongthe leading edge are areas where primer is exposed.
43
RIGHT-HAND SIDE OF AIRPLANE
ITEM WASH PRIMER COATING COLOR
®
Hughson 9924
Hughson 9924
Hughson 9924
Hughson 9924
Hughson 9924
CAAPCO B-274
Chemglaze M413
Chemglaze M413
CAAPCO B-274
Chemglaze M313
Gray
(_ - Uncoated Black
(_) Hughson 9924 CAAPCO B-274
LEFT-HAND SIDE OF AIRPLANE
ITEM EPOXY PRIMER COATING COLOR
®
®
Figure 29.
BMS 10-79
BMS 10-79
BMS 10-79
BMS 10-79
BMS 10-79
BMS 10-79
CAAPCO B-274
Chemglaze M413
Chemglaze M413
CAAPCO B-274
Chemglaze M313
Uncoated
CAAPCO B-274
Gray
Black
De/ta Air Lines Surface Coatings Configuration
44
0
I
t_
N
o
_a0_
#
:_ ®.c _
!z
'i!
=I'_ x_-E_
_o
8
5
I_ _ _
_o_ _ _ o_ _
__ _ _ _._
_=,_ -_ _,_ 8
i
gg _ e
_ o
8"s 8"s :_ _ 8"s 8"s_o
_ _ _o _
_ _ ____
gg ._
!
_o_ _ _ _
_ _ ._>
_am*_d k xo(l _
O- c._> e
!.
8
(..) a_
I$_!_eo3 _:)elq ) I!el le_,uoz!_OH
45
.c
._g =_ _
@
e
u.
_!_!i!!_i_i_!i_iiii_iiiiiii!iii_iiii_i_iiii_i_ii_
(a) Slat 1
aJL.
(b) Slat 4
Figure 30. CAAPCO Coating Over Epoxy Primer-Intact After 6435 hr
46
(a) Leading-Edge Erosion
(b) Exposed Primer, Inboard End of Slat
Figure 31. Slat 3 at 4348 hr-Chernglaze Over Epoxy Primer
Coating erosion on slat 2 (fig. 32a) and slat 3 (fig. 32b) had become quite prevalent at6#3_ flight-hours. Bare metal was exposed over much of the leading-edge span,typical of that shown in Figure 32c. The Chemglaze adhered well to the epoxyprimer. There was no peeling on either slats 2 or 3. A UV protective coating overChemglaze M#13 probably would have increased its erosion life significantly bydelaying and/or reducing deterioration caused by UV radiation.
4?
iiii_iiii/_
(a) Leading-Edge Erosion on Slat 2
(b) Leading-Edge Erosion on Slat 3
(c) Bare Metal Exposed on Slat 3 Leading Edge
Figure 32. Chemg/aze Coating Over Epoxy Primer (6435 hr)
48
On the right wing, where only wash primer was applied as an undercoating, theCAAPCO coating on slats 5 and g peeled extensively. Peeling at the inboard end ofslat 5 began early in the evaluation and grew to about 45.7 cm (lg in). In addition,two strips about 20.3 cm (8 in) wide had peeled down to the primer, as is visible inFigure 33. Slat g began peeling early in the evaluation and continued peeling untilessentially all the coating was gone at 32_0 flight-hours. This slat received damagerepair before being coated, and surface preparation prior to coating possibly was notas thorough as it was for the other parts.
Figure 33. Slat 5 at 6435 hr-Primer Exposed in Two Peeled Areas
Slats 6 and 7 showed leading-edge erosion and UV discoloration similar to, but not assevere as, that on the Chemglaze-coated slats on the left side of the airplane (slats 2and 3). Except for a small 5- by 10-cm (2- by 4-in) area at the lower inboard cornerof slat 6, there was no peeling on either slat. This implies that the adhesive bondbetween Chemglaze and wash primer is satisfactory and that an epoxy primer is notnecessary with Chemglaze.
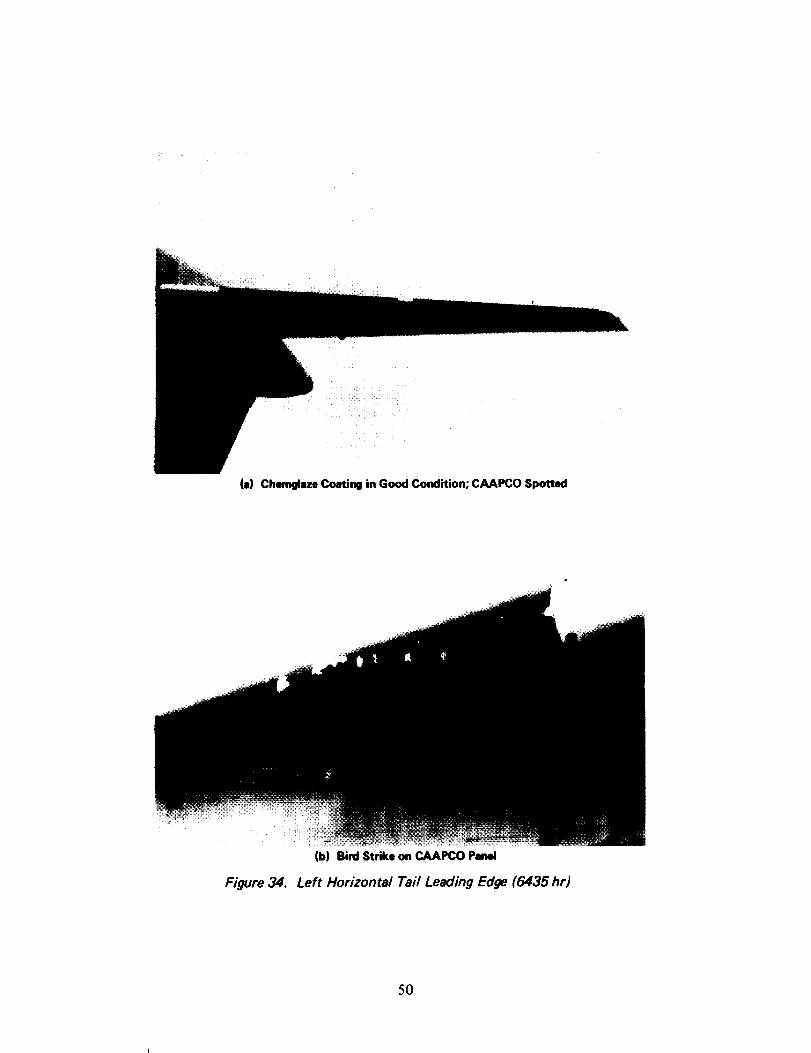
Chemglaze M313, on the left outboard horizontal tail leading edge (fig. 34a), survivedthe evaluation in good condition. The coating began losing gloss after about 2400flight-hours; however, at the end of the evaluation the coating showed no peeling orleading-edge erosion. The adjacent inboard section, coated with CAAPCO, hadseveral peeled spots along the leading edge. Figure 3_b is a closeup of the CAAPCOleading edge just inboard of midspan. The photo shows a dent in the vicinity ofpeeled spots, which is the result of a bird strike reported at the 2901-hour inspection.Peeling in that area began about 2000 flight-hours later.
The right horizontal tail leading edge is shown at 6435 hours in Figure 35. Theinboard panel, coated with Chemglaze, had erosion at the inboard end that grew toabout $ cm (2 in) by the end of the evaluation. Also, there were two peeled spots on
the leading edge about 2.54 cm ([ in) in diameter. The outboard panel began losingCAAPCO coating very early_ and the coating had to be removed at about 500 hours.
49
(a) Chemglaze Coating in Good Condition; CAAPCO Spotted
(b) Bird Strike on CAAPCO Panel
Figure 34. Left Horizontal Tail Leading Edge (6435 hr)
5O
Figure 35. Inboard Pane/at 6435 hr-Erosion at Inboard End
4.2.3 CONCLUSIONS
The following were concluded from the flight service evaluations:
CAAPCO applied over an epoxy primer, such as BMS-10-79, is the most durablecoating system, with a life in excess of 6500 flight-hours.
The life of Chemglaze M413 would be increased significantly by adding a UVprotective topcoat. Chemglaze M313 and M413 demonstrated good adhesionover either a wash primer or an epoxy primer.
It is important that the substrate be thoroughly cleaned prior to application ofeither coating.
The erosion life of either CAAPCO or Chemglaze is greater than that forAstrocoat.
4.3 ENVIRONMENTAL TESTS
Laboratory tests and analyses were conducted to determine the suitability of thecandidate elastomeric polyurethane coatings to certain operational factors in the
airline transport environment. The compatibility of coatings with thermal anti-icingsystems, their effect on lightning strike and precipitation static, and their ability toprotect the substrate from erosion and corrosion were investigated.
#.3.1 ICING TESTS
Icing tunnel tests were run on a wing leading-edge slat model to determine if
CAAPCO and Chemglaze coatings were compatible with the operation of airplanethermal anti-icing (TAI) systems. The tests provided information on the effects ofreduced thermal conductivity on ice prevention and elimination, the effects of
elevated temperatures on coating adhesion and durability, and the ability of thecoatings to shed ice without damaging the coatings.
51
Tests had been performed previously in the same tunnel with the model uncoated to
establish Model 767 TAI system airflow rate and temperature requirements for
certification. Those flow rates and temperatures were duplicated for the coating
tests. Three representative flight conditions within the FAR Part 25 icing
envelopes (fig. 36) that were run in the previous tests were repeated for the coatingtests.
4.3.l.l Test Description
Icing Tunnel-The tests were conducted in the Boeing icing tunnel, which has a 38.1-by 50.8-cm (1_- by 20-in) test section, The icing tunnel and associated instrumen-
tation are shown schematically in Figure 37. The closed-circuit-type tunnel producesvelocities up to 87.2 m/s (195 mi/h) and ambient air temperatures down to -28.9°C(-20°F). A set of spray nozzles ahead of the test section introduces water into the
airstream. Quantity of water and droplet size are regulated to match a predeter-mined liquid water content,
8_
Altitude,1000m(1000 ft)
-(25)
7-
6--(20)
5-
--(15)
4-
3---(10)
2-
-(5)
1-
(-40)
o t-4O
3
\\
\\\
---- Continuous maximum
_ /_ Intermittent maximum
\.X,_ Test Conditions :
_ E3 Continuous maximum (holding)
_ _ A Dry air (climb)® Intermittent maximum (holding)
A \®
II
\ I\ t
\ I\ I
\,.____ J
(-20) (0) (20) (40)I I I l
i i ! i-30 -20 - 10 0 10
Ambient temperature, °C (OF)
Figure 36. FAR Part 25 Icing En ve/opes
52
I Motor ]
Tunnel
temperature To
_" n_orzaz_'es (_ i.,___TeSt_o_..=,. I _ ambient
f_L_ -- if? _ Test mode"_- I
r __ Direction L, ("_=_-- -. Coldr of airflow = [7-. ix_._l,___._ room
r c
_= High-pressure air
r®
Electrical heater
Cold air
Hot air
Figure 37. Schematic of Icing Tunnel
High-pressure air passes through a filter, a heater, and into an instrumented flowtube where temperature and pressures are measured to provide TAI system airmassflow data. TAI air temperature is measured by a therrnocouple located within thespray tube in the model. Both temperature and flow rate are regulated by a systemof valves, which are adjusted manually.
A viewing window in the side of the test section allows the model to be observed andphotographed during runs.
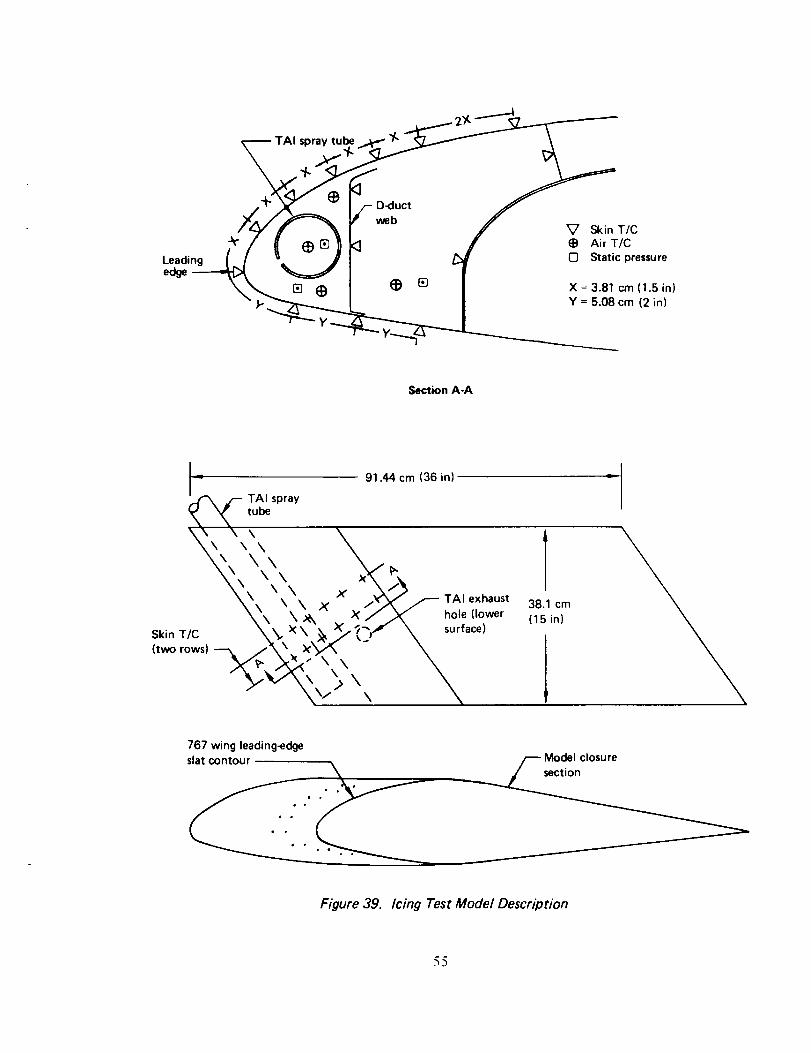
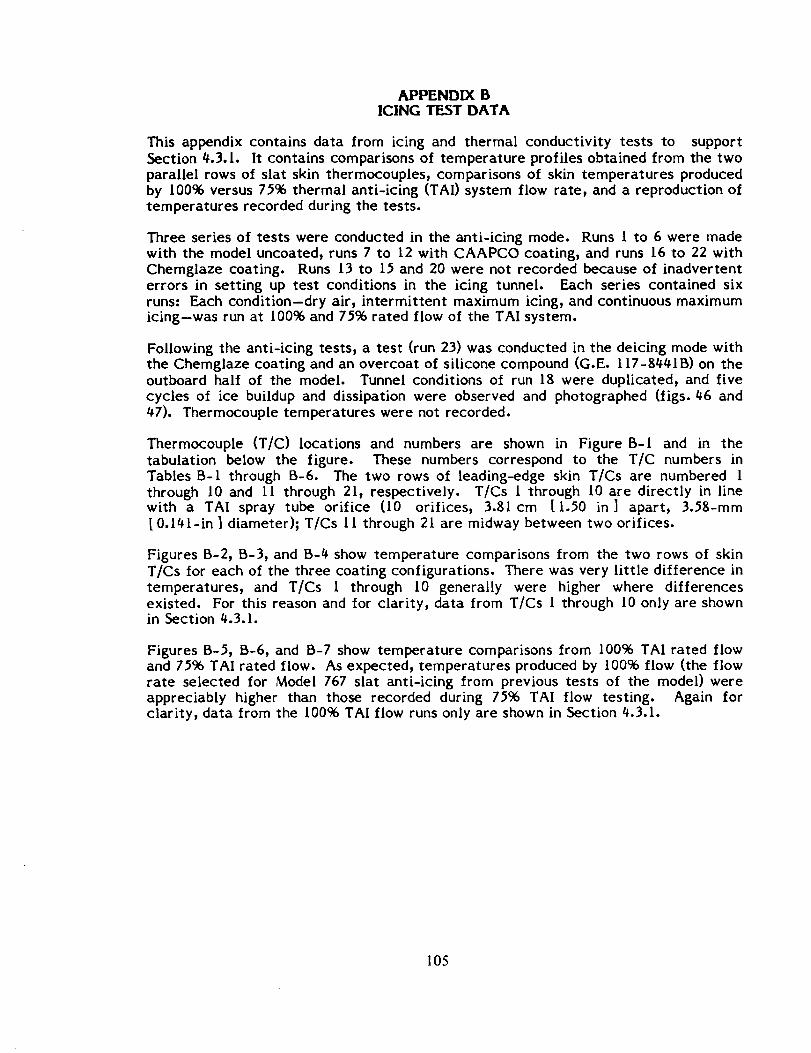
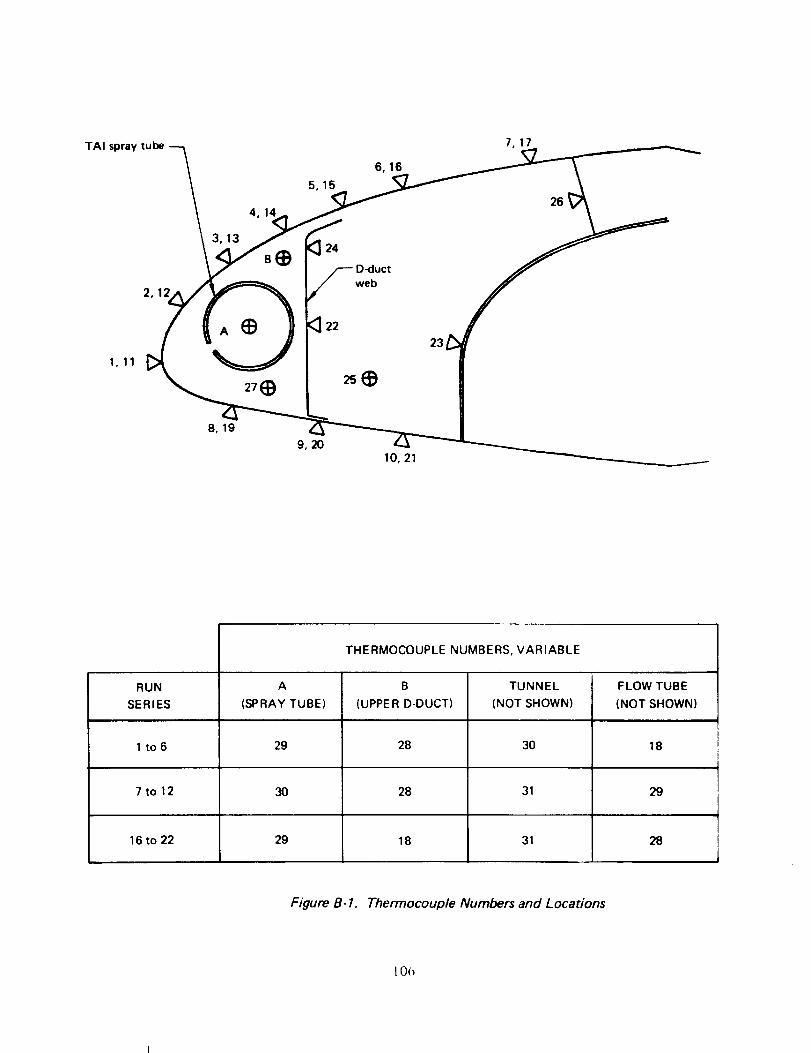
Model Description-Figure 38 shows the icing test model. The forward 30.¢8 cm(12 in) of chord length is contoured to the dimensions of a 767 full-scale wingleading-edge slat. The aft section is a slab-sided closure panel containing noinstrumentation. As shown in Figure 39, the nose section contains the TAI spraytube, which has 10 bleed holes directed toward the leading edge. The bleed holes are3.81 cm (1.5 in) apart and have a 3.58-mm (0.l_l-in) diameter. Two rows ofthermocouples (T/C) are installed in the exterior skin. The inboard row (T/C ithrough 10) is in line with a spray tube bleed hole; the outboard row (T/C 11 through21) is located midway between bleed holes. TAI air passes into the vented D-duct,
into the aft plenum area, and exhausts from the model through a hole in the lowersurface skin, aft of the D-duct web.
The TAI spray tube, D-duct, and aft plenum contain temperature and pressureinstrumentation. Temperatures from the skin and air T/Cs were recorded on tape bya Fluke Data Logger. Pressures were measured on manometers and recordedmanually.
53
!!!ii__?i_!_!i_ii!ii!__¸¸ ,_,,,, _
Figare 38. Icing Test Model
54
_--TA,spra,,u!___f -I
._'_" I_ f D-duct f
/_//_ web / _ Skin T/C
/ E _I_[] _ <] J" • Air TIC
Leading (_ / _== _v j _ [] Static pressure
edge _ -_=f 1_ [] | lX= 3.8 cm (1.5 in)\ X : 3:8& cm (2 in)
Section A-A
I= 91.44 cm (36 in)
Z-- TAI spray
\ \ - - _ -'Y'xv'/ _ TAI exhaust_\ _.\ X ,"-A /_\ \ ,X_ "_ / X hole (lower
T/r" \-\ _ X "_'/_-",P _ _ surface)Skin.,,., \ y \ _./ _ , \(two rows) ---_. /_\. X_ ""
._"_..-_,<\,\ \_"_" _,._ \,
38.1 cm
(15 in)
767 wing leading-edgeslat contour /--- Model closure
Figure 39. Icing Test Model Description
55
4.3.1.2 Test Procedure
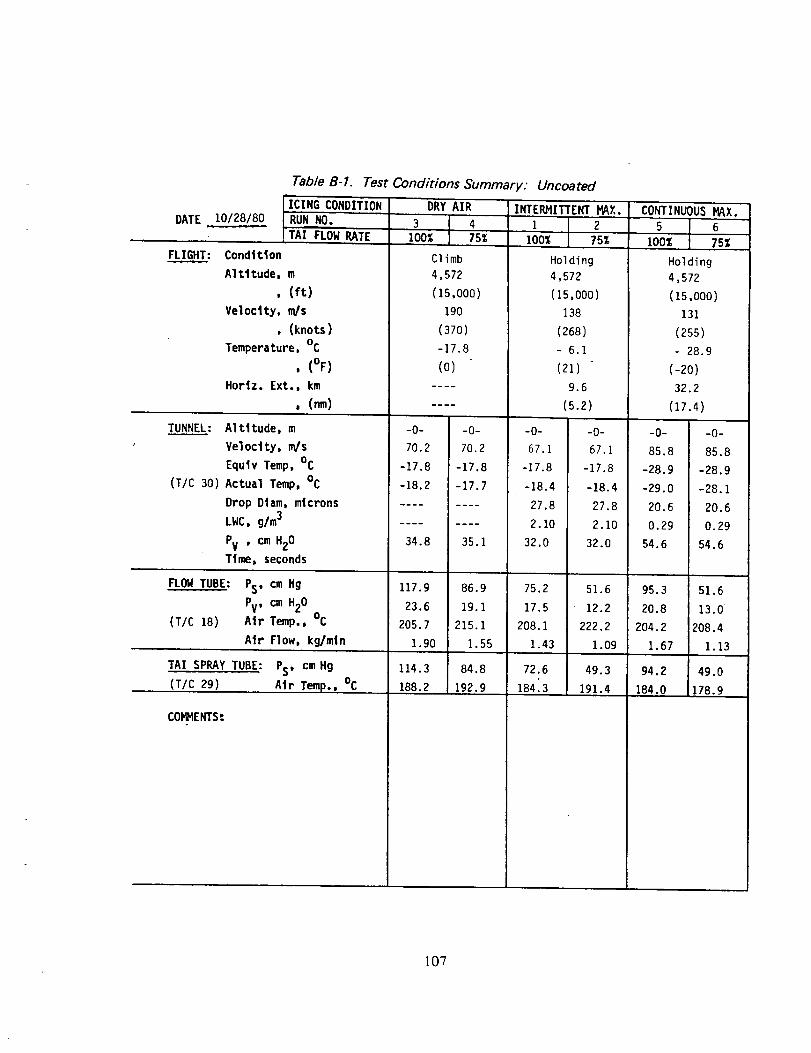
The icing tests performed are summarized in Table 3. The first series of tests wererun on the uncoated model to duplicate selected simulated flight conditions tested forthe Model 767 ice protection certification program. Three icing conditions weretested with the system operating in the anti-icing mode: intermittent maximum icing(IM[) during holding at 4572m (t5 000 ft)_ continuous maximum icing (CMI) for thesame flight conditionp and climb through dry air (DA) at 4572m (15 000 ft). The lastcondition produced the highest temperatures within the leading edge and is ofinterest because these temperatures represent the upper limits to which the D-duct,the leading-edge coatings, skin9 and the internal structure were subjected.
Table 3. Summary of Icing Tests
RUN COATINGNO.
1 Uncoated
2
3
4
5
6
7 CAAPCO B-274
8
9
10
11
12
16 Chemglaze M313
17
18
19
21
22
23
ICING CONDITION
Intermittent maximum
Intermittent maximum
F LOW, %
100
75
Dry air 100
Dry air 75
Continuous maximum
Continuous maximum
Continuous maximum
Continuous maximum
1 O0
75
100
75
Intermittent maximum 100
Intermittent maximum 75
Dry air
Dry air
Continuous maximum
Continuous maximum
Intermittent maximum
Intermittent maximum
Dry air
Dry air
100
75
100
75
100
75
75
100
TAI SYSTEM
OPERATING MODE
Anti-icingI
Anti-icing
Chemglaze M313 Intermittent maximum 100 Deicing
The test method varied somewhat with the test condition. In all cases, tunnelvelocity and temperatures and TAI flow rate and temperature were stabilized beforethe test began. Continuous maximum icing was simulated by introducing water at acontrolled rate and drop size for a period of time equivalent to the airplane traveling32.2 km (20 mi). During this time, thermocouple temperatures were continuouslyrecorded. Intermittent maximum icing was simulated by the same method_ exceptthat the duration of the run was equivalent to traveling only 9.2 km (6 mi). No waterwas introduced into the tunnel during dry air tests. This condition represented TAIsystem operation in preparation for predicted icing conditions in the vicinity of theairplane [light path. Each of the three conditions was run with the TA[ systemoperating at 100% airflow rate (the flow rate selected for Model 767 operation) andat 7596 flow rate. The latter rate was included for interpolation of test data in casethe Model 767 airplane flow rates were revised subsequent to the test.
56
The same test conditions were repeated with CAAPCO B-27_ and Chemglaze M3[3
coatings on the model. In each case, the coatings were applied over the entire
leading-edge section, back to the forward edge of the closure section (fig.38). The
coatings were approximately 12 railthick at the leading edge, tapering to approxi-
mately 5 mil at the aIt edges.
Following the anti-icing tests, a run was made in the deicing mode to observe icebuildup and shedding characteristics of Chemglaze coating. Prior to the test, theoutboard half of the coated area was overcoated with a thin layer of icephobicsilicone compound (G.E. I17-8_/_IB), which was an experimental ice preventativeused on U.S. Army helicopter blades. When the run was made, the tunnel wasstabilized in the intermittent maximum icing condition. Visual observations weremade and photographs were taken.
The model was mounted in the tunnel at a +4-deg angle of attack for all runs. Thisangle represented a best compromise between climb and cruise attitudes and was thesetting used during Model 767 certification testing.
0.3.1.3 Test Results
Results of the icing tests are summarized below. More detailed supplementary dataare contained in Appendix B.
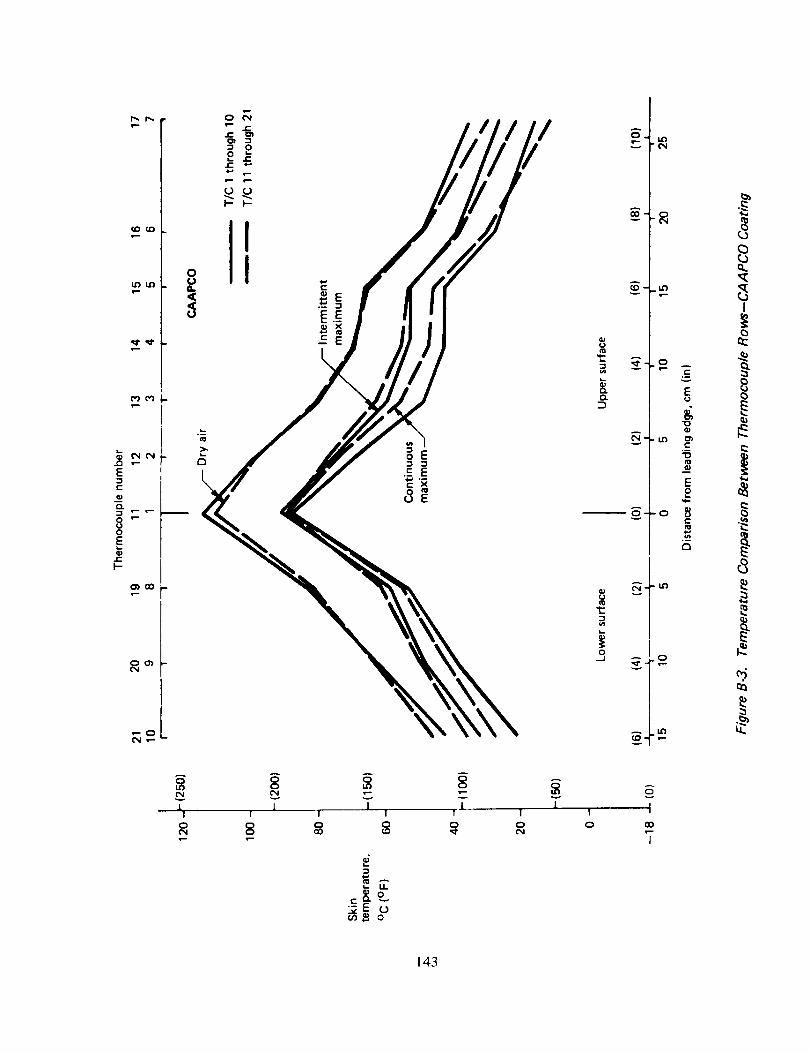
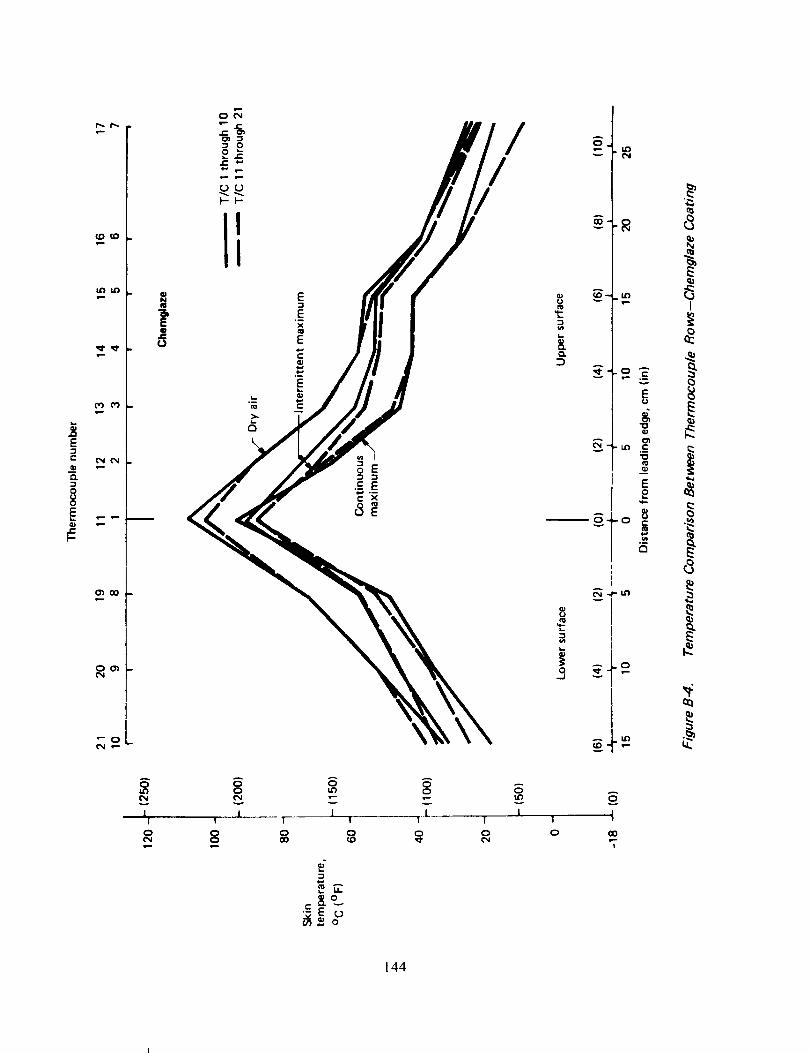
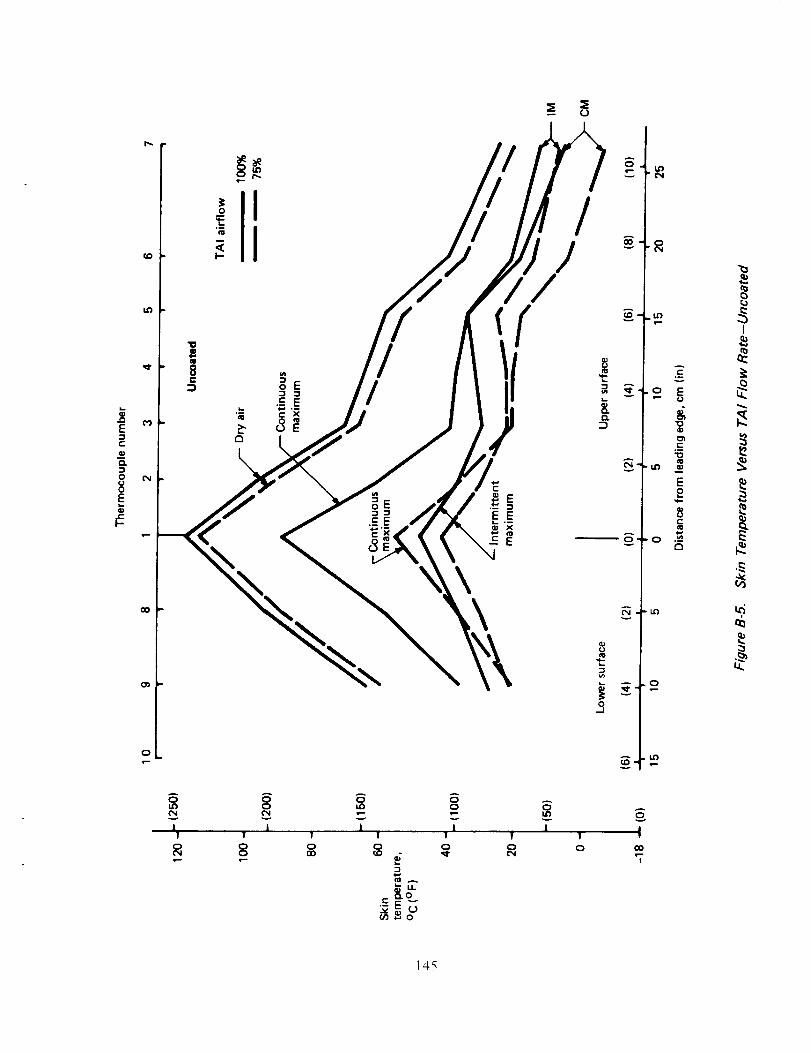
Figure 40 compares slat
I0I
-(250)
-(50)
i
120
100
Skin 80
temperature,
°C(°F) 60
40
20
-18 (0)
skin temperatures of the coated and uncoated model
Thermocouple number
9 8 1 2 3 4 5 6i I I I I I i
Uncoated
_ Chemglaze
-(150)'(200) /f_%X___ CAAPCO
-(100)
ILower surface I Upper surface
(6) (4) (2) (0) (2) (4} (6)
', _ _ I _ _ ,i15 10 5 0 5 10 15
Distance from leadingedge,cm (in)
Figure 40. Skin Temperature Profile-Continuous Maximum Icing
(8) (1i I
2O 25
57
configurations for the continuous maximum icing condition. Maximum temperaturesof about 90°C (194°F) occurred at the leading edge for the three coating configura-tions. Aft of the leading edge, the uncoated upper surface stabilized at temperaturesslightly below those of the coated surfaces. Figure 41 shows the coated model in theicing tunnel at the conclusion of continuous maximum icing runs. The upper photo(CAAPCO coating) shows an area of thin ice (about I mm thick) on the lower inboardsurface, well aft of the leading edge. Although not evident in the photograph, mostof the surface was wet and skim ice of a similar thickness was formed on the uppersurface aft of the truncation line.
In general, the icin_ tendencies of CAAPCO and Chemglaze were similar. TheChemglaze coating (fig. 41b) accumulated a thin ice film near the inboard leadingedge and, like CAAPCO, a trace of ice was formed well aft of the leading edge onthe upper and lower surfaces. Excessive ice formation within about 5 cm (2 in) ofeither end of the model was discounted because of restricted TAI air circulation inthose areas and heat absorption by the model endplates.
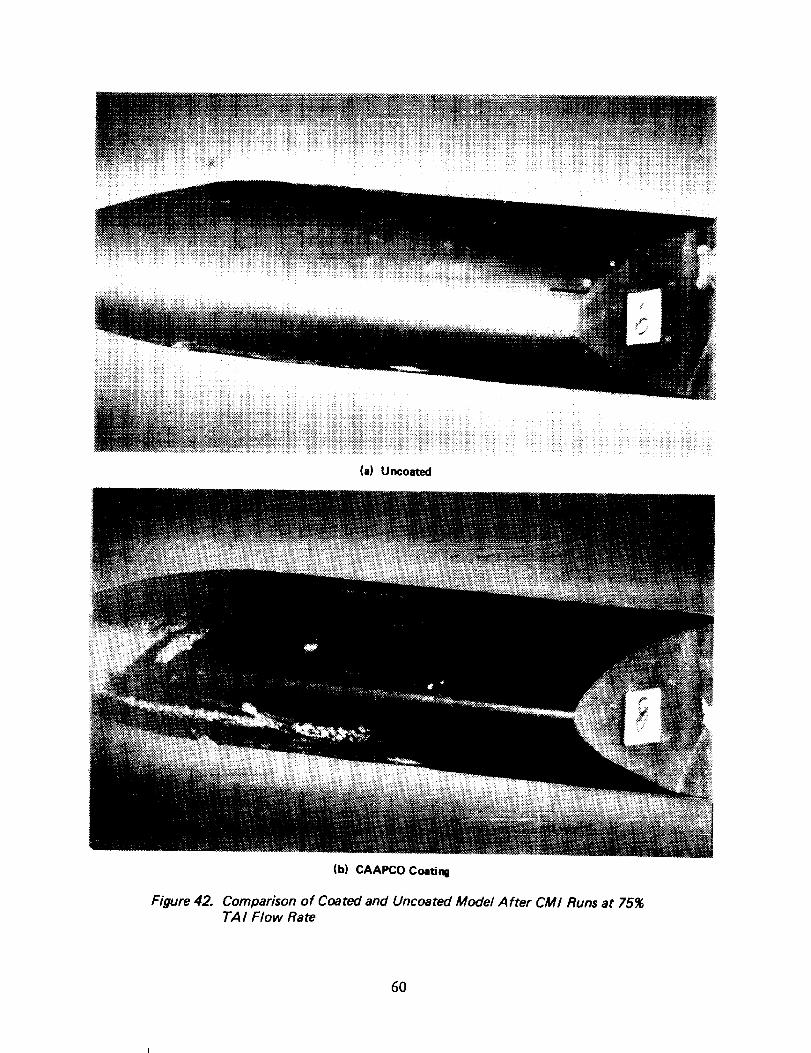
Figures _2a and 42b compare ice formation on the uncoated versus the CAAPCO-coated surface. These runs were made for the continuous maximum icing conditionwith TAI flow reduced to 7596. Runback on the uncoated surface formed a thin skim
of ice just forward of the truncation line, whereas with the CAAPCO coating, theline of ice formation moved forward. On the lower surface, ice formation moved toapproximately 7.5 cm (3 in) of the leading edge and built up to about 3 mm in spots.Figure 42 shows that there is a slight reduction in rate of heat transfer through thecoating that, at the reduced rate of TAI airflow (75% of rated), results in marginalanti-icing performance.
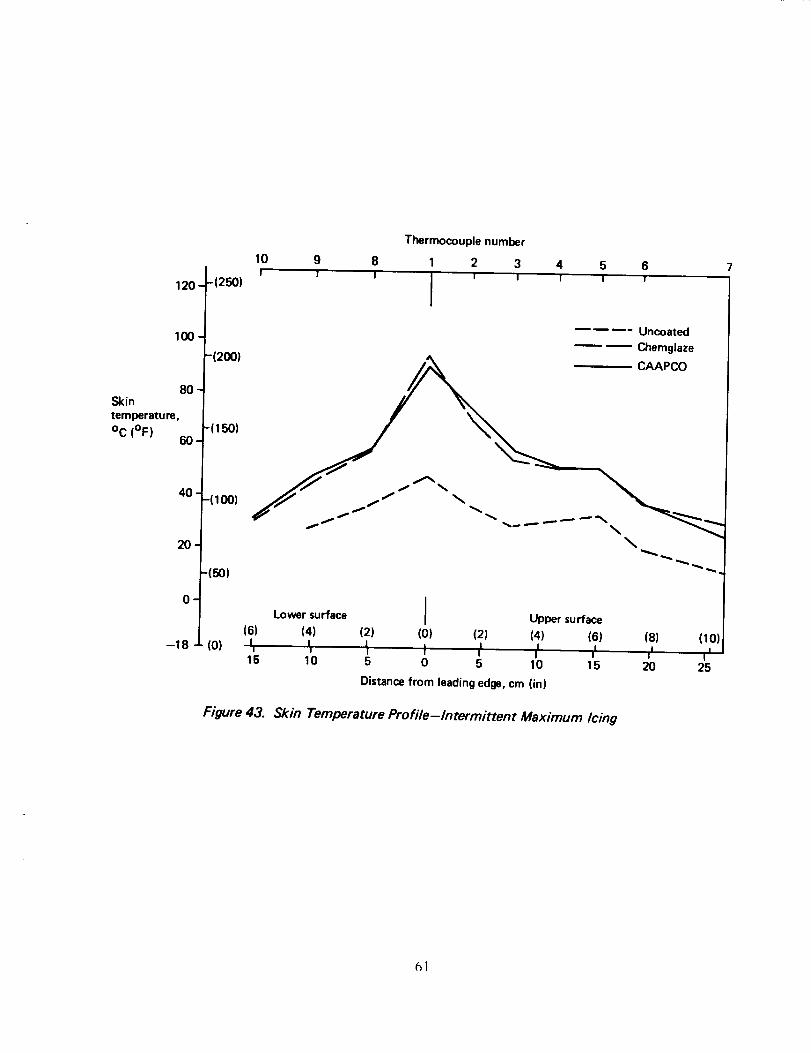
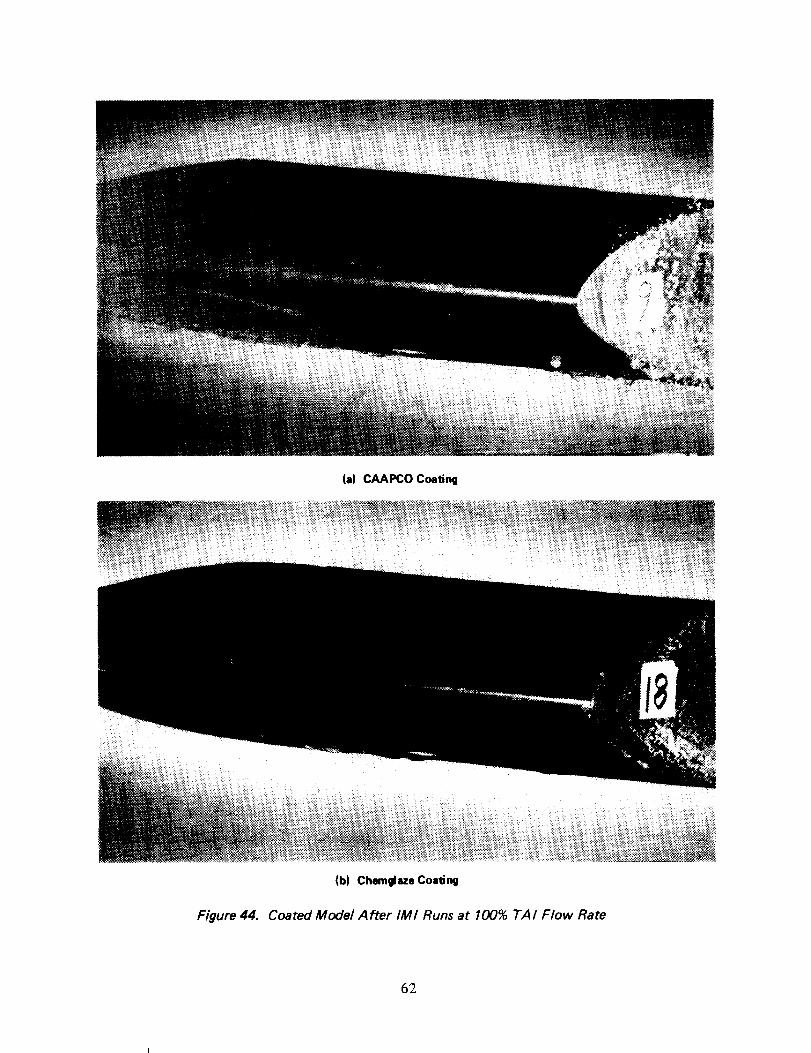
Results of the intermittent maximum icing tests are shown in Figure 43. Skintemperatures with either CAAPCO or Chemglaze applied are nearly identical and areconsiderably higher than for the uncoated surface. The difference in temperatures ismost pronounced at the leading edge, where the coating thickness is the greatest,i.e, 12 rail. Temperatures aft of the leading edge stabilized at values higher thanthose for the continuous maximum icing runs (fig. 40) because the intermittent icingruns were of shorter duration, simulating flight through 9.6 km (6 mi) of icingconditions. Figure _4 shows the model after the intermittent maximum icing runs.Both of the coatings picked up a thin skim of ice along the aft edges of the coatedarea. Ice on the lower surface extended far enough forward to be visible in thephotographs. The uncoated model, under the same test conditions, accumulated athin skim of ice aft of the truncation line, which is just aft of the heated nose sectionof the slat.
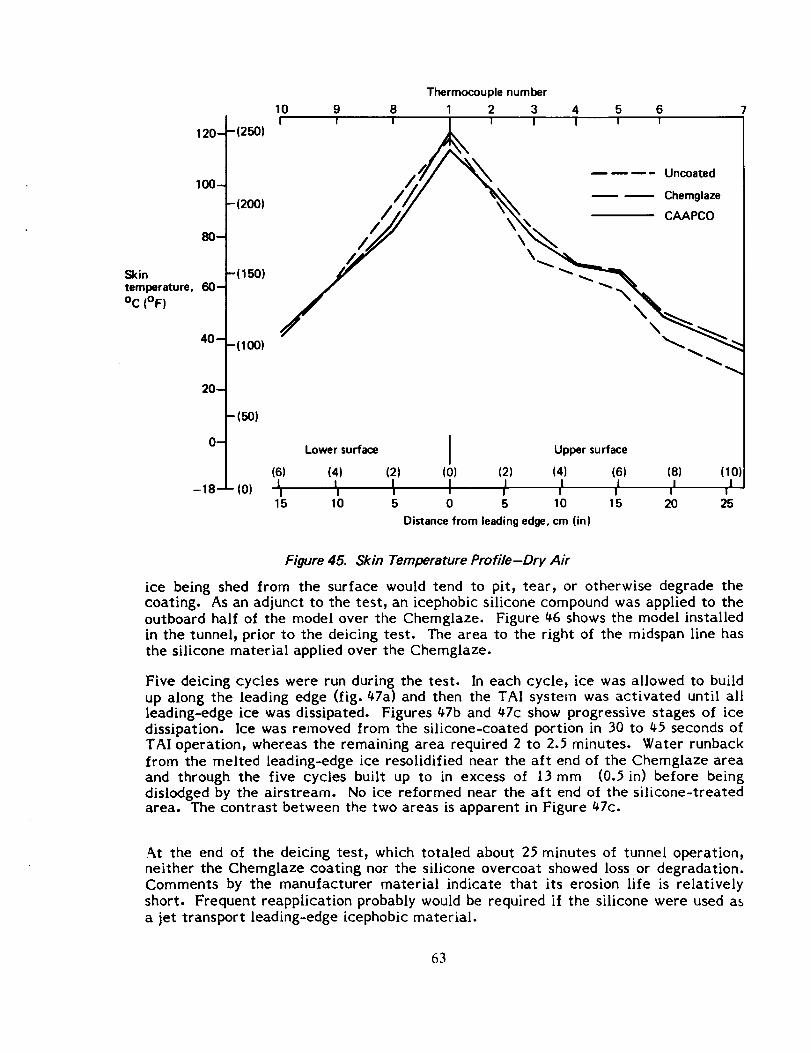
The dry air tests were performed to obtain maximum skin temperature profilesexpected during normal TAI system operation. In these tests, the model does notbenefit fro,n the cooling effect of water in the airstream. As seen in Figure 45, skintemperatures at the leading edge are approximately 30oc (54OF) higher than for thecontinuous and intermittent maximum icing conditions. There is a negligibletemperature difference between the two coatings; however, the uncoated uppersurface exhibited slightly lower temperatures as the distance from the leading edgeincreased. The maximum temperatures of about 120oc (250OF) at the leading edgeproduced no evident effect on the coatings. There was no evidence of hardening,blistering, peeling, or discoloration.
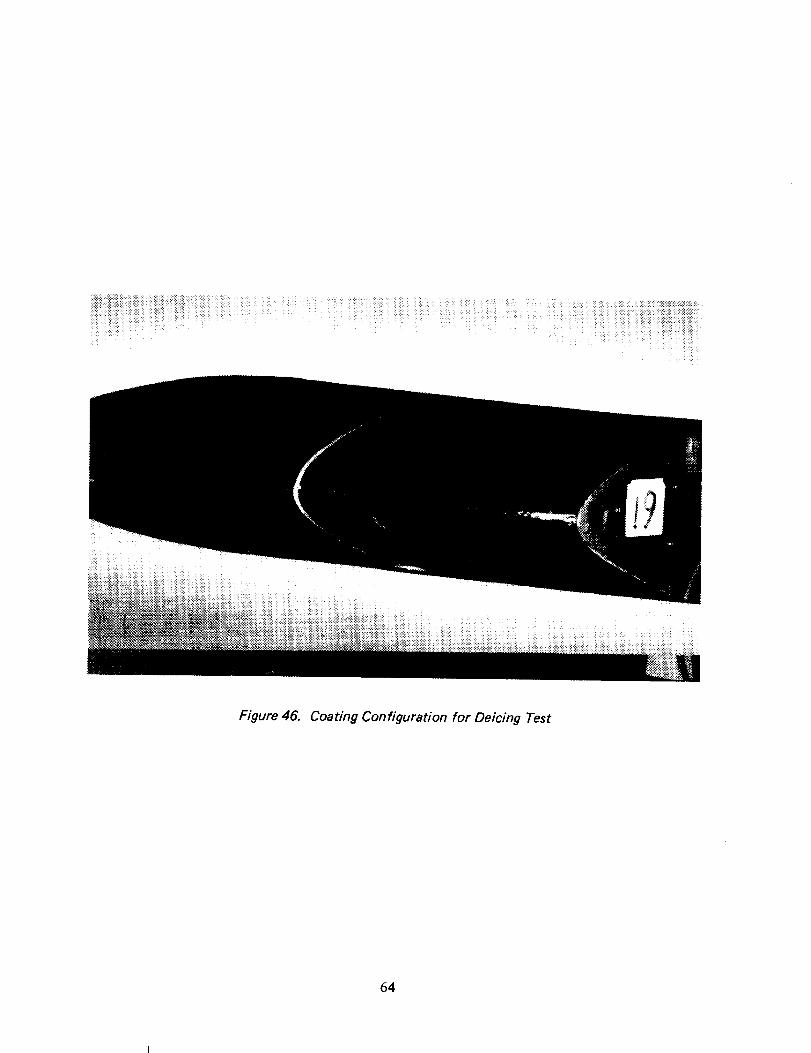
At the conclusion of the anti-icing tests, the model with the Chemglaze coating wastested in the deicing mode of operation. The purpose of this test was to determine if
58
(a) CAAPCOCoating
(b) Chemgl--e Coatinll
Figure 41. Coated Model After CMI Runs at 100_ TA I Flow Rate
59
(a) Uncoated
Figure 42.
(b) CAAPCO Coating
Comparison of Coated and Uncoated Mode/After CM/ Runs at 75%TAI Flow Rate
6O
120 -
100-
80-Skintemperature,
°C (OF) 60-
40
20 ¸
O"
-18
-(250)
Thermocouple number
10 9 8 1 2 3 4 5 6I I I I I I I I I
IUncoated
Chemglaze
-(200) _ CAAPCO
-(150)
-(100) .--....-, __'_._ _
\
-(_)
(0)
ILower surface I Upper surface
(6) (4) (2) (0) (2) (4) (6) (8) (10
a, _ _ I 'i i ,' ,' ,'15 10 5 0 5 10 15 20 25
Distance from leading edge, cm (in)
Figure 43. Skin Temperature Profile-Intermittent Maximum Icing
61
(a) CAAPCO Coating
Figure 44. Coated Model After IMI Runs at 100% TAI Flow Rate
62
120-
100-
0-
Skintemperature, 60-
oc (OF)
40-
20-
--
-(250)
-(200)
-(150)
-(100)
-(5O)
-18-- (0)
Thermocouple number
10 9 8 1 2 3 4 5 6 7
I I I _ I I I I I
_,_/ "_ - Uncoated
/7/ \\ . ,,z,,Ii./ - o.,oo
Upper surface
(6) (4) (2) (0) (2) (4) (6) (8) (10]
I I, I / ,I ,I ,I ,I15 10 5 0 5 10 15 20 25
Distance from leading edge, cm (in)
Lower surface
Figure 45. Skin Temperature Profile-Dry Air
ice being shed from the surface would tend to pit, tear, or otherwise degrade the
coating. As an adjunct to the test, an icephobic silicone compound was applied to the
outboard half of the model over the Chemglaze. Figure 46 shows the model installed
in the tunnel, prior to the deicing test. The area to the right of the midspan line has
the silicone material applied over the Chemglaze.
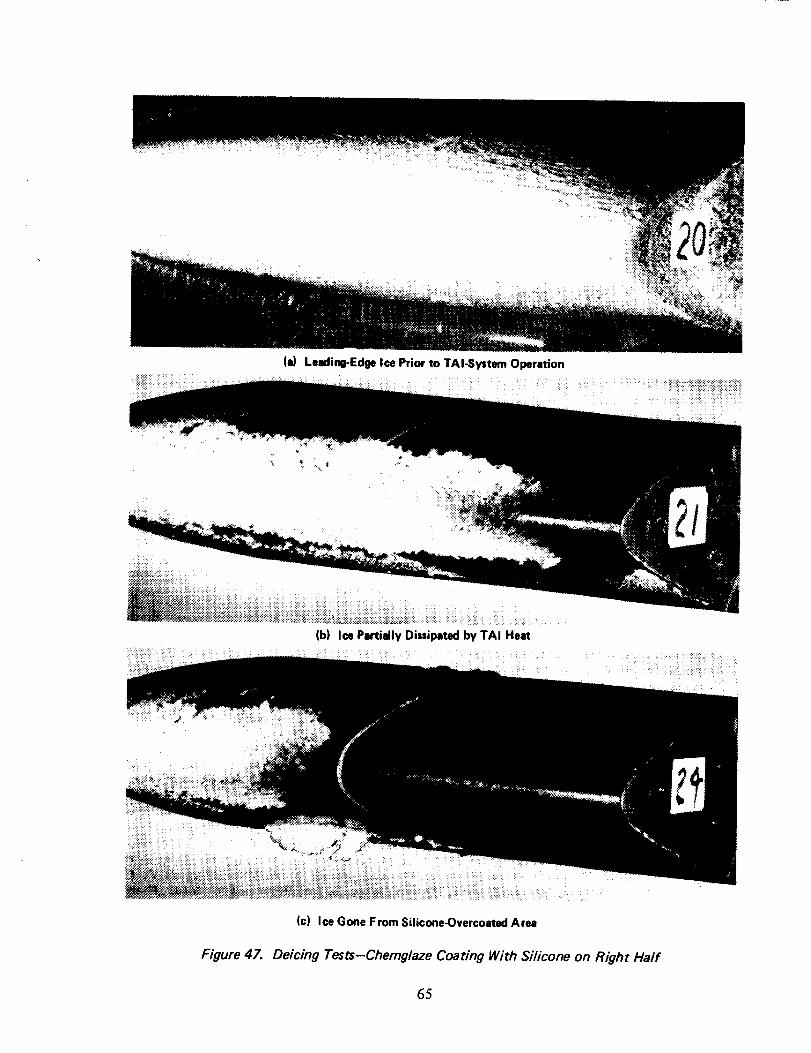
Five deicing cycles were run during the test. In each cycle, ice was allowed to build
up along the leading edge (fig. 47a) and then the TAI system was activated until all
leading-edge ice was dissipated. Figures 47b and 47c show progressive stages of ice
dissipation. Ice was removed from the silicone-coated portion in 30 to 45 seconds of
TAI operation, whereas the remaining area required 2 to 2.5 minutes. Water runback
from the melted leading-edge ice resolidified near the aft end of the Chemglaze area
and through the five cycles built up to in excess of 13 mm (0.5 in) before being
dislodged by the airstream. No ice reformed near the aft end of the silicone-treatedarea. The contrast between the two areas is apparent in Figure 47c.
At the end of the deicing test, which totaled about 25 minutes o[ tunnel operation,
neither the Chemglaze coating nor the silicone overcoat showed loss or degradation.
Comments by the manufacturer material indicate that its erosion life is relatively
short. Frequent reapplication probably would be required if the silicone were used as
a jet transport leading-edge icephobic material.
63
Figure 46. Coating Configuration for Deicing Test
64
(a) Leading-Edge Ice Prior to TAI-System Operation
(b) Ice Partially Dissipated by TAI Heat
(c) Ice Gone From SUicone-Overcoatad Area
Figure 47. Deic/ng 7"ests-Chemg/aze Coating With Si/icone on Rigl_t Ha/f
65
{tJ.l.4 CarJusions
The limited icing tests performed with CAAPCO and Chemglaze coatings indicatedthat:
Thermal anti-icing systems, at normal temperature and airflow settings, wouldfunction satisfactorily in either the anti-icing or deicing mode with coatedsurfaces.
The coatings showed no effects from exposure to the elevated temperatures ofthe TAI system.
• Ice shed from the model did not remove or otherwise degrade the coatings.
4.3.2 LIGHTNING AND PRECIPITATION STATIC ANALYSES
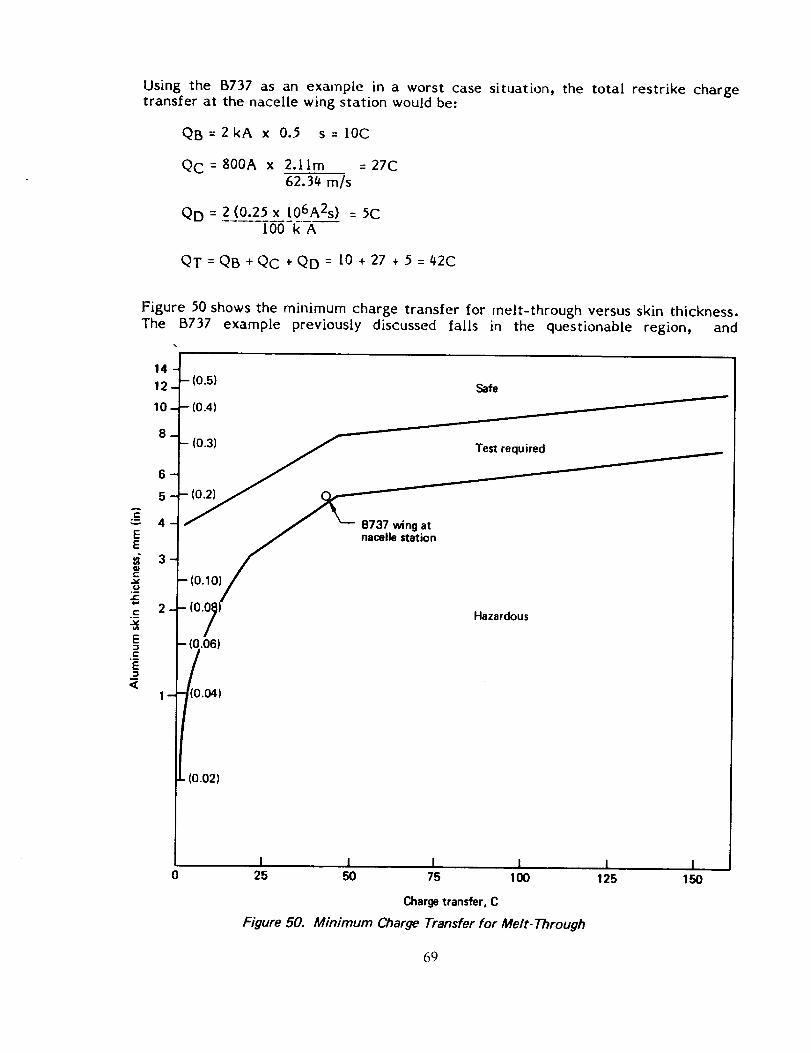
Investigations were made to evaluate the effects of coatings on atmosphericelectrical charge dissipation. The lightning-strike investigation was limited toanalysis of a typical transport (B737) to illustrate the method used to assessconfiguration-oriented areas of concern. The precipitation static (P-static) investi-gation included both test and analysis. P-static results were not configurationsensitive.
_.3.2.1 Lightning Analysis
Various areas of a jet transport are classified in three zones for lightning analyses(fig. 48). Zone ! areas are those most susceptible to initial strike attachment. Theyinclude the tips of wing and tail surfaces, the body nose radome, and the inlet cowlsof nacelles. Zone 2 areas are aft of zone 1 areas and have a high probability of sweptstroke reattachment. The fuselage, nacelles aft of the nose cowl, and wing areasadjacent to wing-mounted nacelles are in zone 2. The remaining areas are in zone 3and have a low probability of lightning arc attachment.
Zone 2 areas contain primary structure and are the focus of lightning hazardanalyses. The objective of the analyses is to determine if there is enough conductingmaterial to dissipate a typical worst case charge without causing melt-through in thestructure. Zone 2 areas that contain fuel are of particular interest because theexcessive heat accompanying melt-through could ignite fuel vapors. If the wing areaimmediately behind the wing-mounted engines contains fuel, it becomes critical for ahazard analysis. None of the zone I areas contain primary structure and, therefore,are not areas of special concern.
The lightning phenomena that take place are illustrated in Figure 49. The waveformis divided into four components. The initial stroke (component A) occurs in a zone 1area, such as a nacelle nose cowl. The terminus of the lightning channel continues tomove aft into zone 2 until a dielectric surface (coated wing surface) is encountered.
When the potential gradient exceeds the dielectric breakdown strength of thecoating, the channel attaches to the aluminum substrate where it dwells for a shortperiod. During the dwell time, a highly ionized plasma flows aft over the wing in theairstream until dielectric breakdown recurs and causes a restrike (component D).This process is repeated until the trailing edge is reached. The total chargetransferred during the restrike phenomenon is the sum of the charges in componentsB, C, and D:
66
D
Zone 1
Zone 2
Zone 3
Figure 48.
Initial attachment point with probability of flash hang-on.
High probability of swept stroke reattachment from zone 1.
Using the B737 as an example in a worst case situation, the total restrike chargetransfer at the nacelle wing station would be:
QB =2kA x 0.5 s = 10C
QC : 800A x 2.11m = 27C
62.34 m/s
QD = 2 (0.2_ x 106A2s) = 5C100 kA
QT =QB+QC ÷QD : 10 +27 + 5 =q2C
Figure 50 shows the minimum charge transfer for melt-through versus skin thickness.
The B737 example previously discussed falls in the questionable region, and
14
12 0.5) Safe
8(0.3)
.06)
0.04)
B737 wing atnacelle station
Test required
Hazardous
(0.02)
I I I I25 50 75 100
Charge transfer, C
Figure 50. Minimum Charge Transfer for Melt-Through
I I125 150
69
simulated lightning tests shouldbe performed on a full-scale model before applying a
dielectric coating to the inspar surface above the nacelle. If tests show that a
potentially hazardous condition would be created, then the coating should be omitted
from the inspar area adjacent to the nacelle or, if possible, a conductive materialshould be added to the coating in that area to reduce its dielectric strength.
_.3.2.2 P-Static Analyses
P-static tests were conducted during the first phase of the surface coatings program,
prior to the first flight service evaluation of CAAPCO and Chemglaze. The purposeof the tests was to clear the materials for P-static interference when applied to wing
and horizontal tail leading edges only. Test results are reported in Reference I.
Test results were reviewed relative to an extension of the coating applications back
to the rear spar of wing and tail surfaces. The coating configuration analyzed
consisted of a [2-rail application of CAAPCO, Chemglaze, or Astrocoat at the
leading edge, tapering to 5 rail at the front spar; the surface between front and rear
spars was dual-coated with 3 to 4 rail of the eIastomer and a I- to 2-rail topcoat of
polyurethane enamel for Skydrol protection. The analysis showed that coating
configuration would produce no P-static interference with communication or naviga-
tion equipment aboard an airplane.
t_.3.2.3 Conclusions
The following conclusions were reached as a result o[ the lightning and P-static
analyses:
Airplanes with wing fuel in the immediate vicinity of wing-mounted engines
should be analyzed for lightning-strike effects when a dielectric coating is
applied.
The example analysis of a B737 wing at the nacelle station showed that a
dielectric coating in that area would produce marginally safe conditions when
exposed to lightning strike. Lightning tests should be performed on a full-scalemodel to deter_nine if safety would be compromised.
If an unsafe area is identified, the coating should be omitted from that
immediate area or a conductive material should be added to the coating.
CAAPCO, Chemglaze, or Astrocoat applied from the leading edge to rear spar
of wing and tail surfaces will not cause P-static interference with communica-
tion and navigation equipment.
t_.3.3 EROSION RESISTANCE
Two series of tests were conducted to investigate: (i) coating durability as a
function of coating thickness and (2) the erosion protection afforded to nonmetallic
leading edges by coatings.
Both test series included rain erosion testing in the AFML whirling-arm facility at
Wright-Patterson Air Force Base, Ohio. Test velocity was 22g m/s (500 mi/h),
rainfall rate was 2.54 cm/h (I in/h), and drop size was l.g mm (0.071 in). The second
test series, on nonmetallic substrates, included coating-adhesion and peel tests.
70
#.3.3.1 Optimum Coating Thickness
Much of the rain erosion testing conducted in this study and elsewhere was done on
12-rail-thick coatings. Because coating thickness affects airplane weight and
application costs, it was of interest to determine the minimum coating thickness that
could be applied without sacrificing durability.
Test Description-To find optimum coating thickness, tests were run on aluminum
substrate specimens with coatings of CAAPCO, Chemglaze, and Astrocoat ranging in
thickness from 4 rail to 21 rail. Prior to coating, the specimens were grit blasted,
alodined, and primed with 0.7 to 1.0 rail of BMS 10-79 epoxy primer. After coating,the specimens were allowed to cure a minimum of 7 days at room temperature.
Specimens were run in pairs, with a specimen mounted at either end of the whirling
arm. Runs generally were terminated when deterioration of one of the specimens
was observed through the closed-circuit TV monitor. There were a few exceptions to
this rule, however, as can be seen in Table 4. If neither specimen showed
deterioration within Ig0 minutes run time, the test was terminated and the coatingswere considered very durable.
Test Results--Table g summarizes test results. Test time to initial coating failure,
percentage of the coated surface affected (percentage of area failed), and mode of
failure are noted. The results observed for each coating are discussed below.
CAAPCO B-274. All specimens had a smooth, glossy surface. Typical mode of
failure was a single pit in the coating, exposing the primer or substrate, as shown in
Figure 51a. The .Lmil coating lost one 5-ram (0.2-in) piece, exposing the substrate,
and two smaller pits, exposing the primer. Scuffing or loss of coating, visible at the
ends of most specimens, was due to end cla(nps that held the specimens in the testfixture.
The two 9-rail specimens shown in Figure 51a ran the lull 150 minutes without
apparent damage. One of the two 20-rail specimens lost a 5-ram (0.2-in) piece after
I 15 minutes of testing. The other specimen of the pair remained in good condition.
CAAPCO coatings also were tested at thicknesses of 12, 17, and 18mil. One of the
12-mil specimens lost a single piece about 3 by 5 mm (0.12 by 0.20 in)after 127
minutes of testing; the other remained in good condition. The single 17-rail specimen
(tested with the 5-rail Astrocoat specimen) had minor damage after 90 minutestesting. The IS-rail specimens each had a single piece removed after 79 minutes
testing, exposing the primer or substrate.
Chemglaze M313. All specimens had a smooth, glossy surface. The most prevalent
mode of failure was loss of patches of coating that did not expose either the primeror substrate. The only exceptions were the 4-rail specimens and one of the 17-mil
specimens, which were each pitted down to the primer in one place.
Results of the #-, 9-, and 20-rail tests are shown in Figure 51b. The 4-rail test wasterminated at 131 minutes when several small patches of coating were lost. The 9-
rail coatings were in generally good condition after 180 minutes, except for one area
of partial coating loss about 2 by 4 mm (0.08 by 0.16 in) on one of the specimens.When the 20-rail tests were terminated at 180 minutes, both specimens had lost
sizable patches of coating.
?I
Table 4. Rain Erosion Test Results (Aluminum Substrate)
TEST AREA
COATING THICKNESS, TIME, FAILED, FAILURE MODEmil min %
CAAPCO 5 43 10 Coating smooth andglossySingle piece removed to primer
105 25 Coating smooth and glossySeveral pieces removed to primer or substrate (fig. 51a)
9 180 0 No damage180 0 No damage (fig. 51a)
12 127 0 No damage127 5 Single piece removed to substrate
17 90 5 Several minute pitsPrimer not exposed
18 79 10 Single piece removed to substrate79 10 Single piece removed to primer
20 115 15 Single piece removed to primer
115 0 No damage (fig. 51a)
Chemglaze 4 131 25
131 10
Coating smooth and glossySeveral pitsOne pit to primerCoating smooth and glossySeveral pitsOne pit to primer (fig. 51b)
7 180 10 Several pieces removed- no primer showing180 15 several pieces removed-no primer showing
9 180 5 Single small pit-no primer showing180 0 No damage (fig. 51 b)
17 150 0 No damage150 10 Single piece removed to primer
20 180 10 Two pieces removed-no primer showing180 30 Several pieces removed-no primer showing (fig. 51b)
Astrocoat 5 90 5 S_rface pittingSingle small pit removed to primer (fig. 51c)
8 186 25 Erosion failure-pieces removed to primer186 25 Erosion failure-pieces removed to primer (fig. 51c)
17 150150
15021
010
4O
4095
No damageCoating peeled through detamination beyond normal
erosion areaPrimer not exposed
Origin of peeling probably from single pit down to primer
Coating peeled through delamination beyond normalerosion area
Primer not exposedSeveral pits in erosion area down to primerSame as above (fig. 51c)
__.
5 rail105 min
4 mil131 min
9 mil180 min
CM
012345678910I I 1 I I I I I I I I
(a) CAAPCO B-274
9 mil
180 min
CM
0 1 2 3 4 5 6 7 8 9 '10I I I I i I 1 I I I I
=
(b) Chemglaze M313
20 mil115 min
20 mil
180 rain
8 mil186 min
CM .....0 1 2 3 4 5 6 7 8 9 10I I I I l I I I , J l I
(c) Astrocoat Type I
Figure 51. Rain Erosion Specimens Tested at Various Coating Thicknesses (Aluminum Substrate)
73
The 7-rail specimens had several patches of coating missing after 180 minutes, andone specimen had several very small pits. In no place was the primer exposed.Testing of 17-rail specimens was terminated at 150 minutes when a large patch ofcoating was lost from one of the two specimens. The other specimen was in goodcondition.
Astroc_t Type I. All specimens had a glossy, orange peel surface. Four thicknessesof coatings were tested, three of which are shown in Figure Sic. The 5-rail specimenhad a single pit that exposed the primer after 90 minutes and several minute surfacepits visible under a magnifying glass. The g-rail specimens were allowed to runlg6 minutes, at which time they had several small coating pits; the primer was
exposed in two places on each specimen. The 21-rail specimens had several pittedareas along the leading edge, the deepest of which exposed the primer and appearedto be the origin of large coating delamination patches that extended nearly to thetrailing edge.
A pair of 17-mil specimens was tested 150 minutes before a leading-edge pitoccurred in one specimen, causing a narrow strip of the coating outer layer to peelback to the trailing edge. The other specimen was in good condition.
Coating Thickness, Conclusions-Figure 52 shows test duration to time of coatinginitial failure as a function of coating thickness. Coatings tested in the 7- to 9-railthickness range were in the best condition after the full lg0-minute allotted testtime. The CAAPCO and Chemglaze specimens were in good condition, with theexception of a single pit in one of the Chemglaze specimens. The g-rail Astrocoatspecimens were the only ones to run longer than the allotted time. The specimenswere pitted along the leading edge after 186 minutes testing, and it can only bepresumed that they were damaged during the last few minutes of testing.
Coatings of 9-mil thickness in lieu of the previously recommended 12 rail for areas ofhigh erosion would reduce airplane weight by a few kilograms and would reduceapplication time and cost.
4.3.3.2 Nonmetallic Leading Edges
Several fiber-epoxy materials have been developed for aircraft application to reduceweight and, eventually, to reduce cost. The characteristics of four of these materialswere investigated relative to potential leading-edge applications. Kevlar-epoxy,fiberglass-epoxy, graphite-epoxy, and hybrid Kevlar-graphite-epoxy specimens werecoated with each of the three candidate coatings and subjected to adhesion, peelstrength, and rain erosion tests. The coatings were approximately 9 rail thick. Adescription of the specimens and test results follows.
Specimen Prel_ration-Two types of specimens were prepared: flat plate specimens10.16 by 15.24 by 0.32 cm (4 by 6 by I/g in) for the adhesion and peel strength testsand curved, leading-edge specimens 6.1 cm (2.4 in) long for the rain erosion tests.Figure 53 shows curved specimens of each of the four substrates. The materials usedwere:
Graphite Specification BMS 8-212Type lI, class 1Grade 190 (0.0074)
Specimens were fabricated of multiple layers of fabric (or tape) with alternating+45-deg orientation. The hybrid specimens were built up of alternating layers ofgraphite and Kevlar, with a top layer of Kevlar. Following layup, all specimens werecured in an autoclave at 177oc (350OF) and 586 kPa (85 Ibf/in2). After curing, thespecimens were prepared for coating by the following procedure;
I.
2.3.tt.5.6.7.8.
o
Clean with Toluene, MEK, or MIBK solvent.Abrade manually with 150 or finer grit abrasive.Repeat step I.Apply static conditioner filler (pinhole filler).Apply laminar surfacer.Apply BMS I0-21 type I conductive coating.Apply BMS 10-79 type II epoxy primer.Apply 9-mil elastomeric polyurethane coating (CAAPCO B-27% ChemglazeM313, or Astrocoat Type I).Cure a minimum of 7 days.
AcR1_sion Tests--Dry and wet adhesion tests were performed on coated flat platespecimens per FTMS 141, method 6301. In both tests9 a series of parallel lines are
_Adheslon fadure at coating-primer surface.-Few small blisters.
scribed down to the substrate through the coating. A second series of lines are then
scribed diagonally to the first series to form a grid of diamond-shaped coatingpatches. (In the wet adhesion tests, this is done after the specimens have been
immersed in distilled water at room temperature for 7 days.) A strip of 2.5#-cm
(l-in) 3M 250 tape is applied to the coated surface with a minimum pressure of
34.5 kPa (5 Ibf/in 2) and removed within 5 minutes with an abrupt motion 90 deg to
the surface. If coating patches adhere to the tape, the coating fails the adhesiontest.
Results of the adhesion tests are presented in Table 5. CAAPCO and Chemglazecoatings passed both dry and wet adhesion tests on the four substrate materials. A
few small blisters were observed in the CAAPCO wet adhesion specimens, however,they did not cause adhesion failure. The Astrocoat exhibited poor wet adhesion andall of the four substrate specimens failed this test. Adhesion of Astrocoat to
graphite in the dry tests also was marginal, and one of the two specimens failed.
Adhesion of the coatings to these fiber-epoxy substrates might be improved withmodified surface preparation procedures, however, the scope of work in this instancedid not permit such experimentation to take place.
Peel Tests--Tests were performed on flat plate specimens to determine the peelstrength of the coatings on the four substrate materials. Parallel cuts to the
substrate were scribed through the coatings 2.54 cm (l in) apart per ASTM D903. The
edge of the scribed strip was clamped in jaws that pulled 90 deg to the surface at arate of 5.08 cm/min (2 in/min). A scale attached to the jaws measured pull force.
Test results are shown in Table 6. Adhesion of the CAAPCO coatings was so great
that a free tab to initiate the test could not be produced. The peel strength ofChemglaze averaged about I.I I kg/cm (6.25 Ib/in) for all specimens, with only a +496
variation between substrates. The average peel strength of Astrocoat specimens_vas
0.65 kg/cm (3.6# Ib/in), with about +596 variation between substrates. In all cases,the release lace was between the coating and primer.
Early in the Surface Coatings program, a peel strength goal of l.g5 kg/cm (10 Ib/in)
was set for coatings in areas of high erosion and 0.56 kg/cm (3 Ib/in) for coatings in
low erosion areas (ref. 1). Subsequent testing with aluminum substrates indicated
that coatings with about 0.g9 kg/cm (5 Ib/in) peel strength would be satisfactory inareas of high erosion.
Rain Exosion Tests--Specimens were tested in pairs and run until failure of either one
or both specimens occurred. Each of the substrate materials is discussed individually
with the effect of coating systems. Test results are summarized in Table 7. Figure
54 compares bare specimens before and after testing and shows the best coating(after test) with each substrate material.
Graphite. Graphite performed the best of the uncoated specimens, enduring 12.g
minutes of rain erosion testing. The next best uncoated specimen (fiberglass) lasted
only 8.9 minutes. Even at the failure point, the extent of damage was not as seriousas with the other uncoated specimens.
Each of the coated graphite specimens endured for approximately the same length of
time (about 40 minutes), but both CAAPCO and Chemglaze failed because ofadhesion loss and Astrocoat [ailed because of erosion.
Fiberglass. The uncoated fiberglass specimens eroded through the outer ply in
8.9 minutes. With the CAAPCO coating, erosion life was increased tenfold to
90.2 minutes. This combination exceeded the durability of any of the other coatedspecimens by a factor greater than two. The failure mode was loss of adhesion.
The Chemglaze coating [ailed in adhesion after 38.4 minutes of testing, and Astro-coat failed through erosion after 35.6 minutes.
Kevlar. Uncoated Kevlar had virtually no rain erosion resistance, and it began to failimmediately upon exposure. Within 1.4 minutes, serious failure occurred: Individual
strands were severed, destroying the cross-weaved structure of the outer ply. Kevlarcoated with CAAPCO increased rain erosion resistance from 1.4 minutes to 16.8
minutes. The coating did not adhere very well to the substrate, causing failure byloss of adhesion (blistering), followed by intercoat adhesion failure between layers of
the CAAPCO coating. Failure of the Chemglaze and Astrocoat specimens was
initiated by failure of the substrate, which was shattered by rain impingement,
followed by blistering and peeling of the coating. The Chemglaze and Astrocoatspecimens lasted 32.4 and 24.$ minutes, respectively.
78
SUB-STRATE
Graphite
Fiberglass
Kevlar
Kevlar-
graphite(hybrid)
Table 7.
COATI NG
Uncoated
Rain Erosion Test Results (Nonmetalfic Substrate)
AREAERODED,%
100
TESTTIME,min
12.812.8
CAAPCO 5 39.50 39.5
Chemglaze 10 38.70 38.7
Astrocoat
Uncoated
CAAPCO
Chemglaze
Astrocoat
Uncoated
CAAPCO
1010
90
95
10
0
1515
100
100
025
10
0
100100
Chemglaze
Astrocoat
43.143.1
8.9
8.9
90.2
90.2
38.438.4
35.635.6
1.4
1.4
16.816.8
32.4
32.4
24.5
24.5
FAILURE MODE
First ply eroded
First ply damaged
Erosion-adhesion failure
Adhesion damage: blistered over 5% of area
Adhesion failure: blistered over 60% of areaAdhesion damage: blistered over 40% of area
Rain erosion failureRain erosion failure
Erosion failure
First ply removedErosion failureFirst ply removed
Adhesion failure: blistered over 10% of areaSingle, small rain-erosion pit through to substrateAdhesion failure: blistered over 15% of areaBlister removed to primer in one small area (5%)
Adhesion failure: blister broken through to substrateAdhffsion damage: blistered over 10% of area
Erosion failure: pitted through coating to substrateErosion failure: pitted
Erosion failure: cut through first plyFailure began immediatelySame as above
Adhesion damage: blistered over 25% of areaAdhesion failure and intercoat-adhesion failureBlistered over 90% of area
Adhesion failure: blistered over 25% of area; one small pitthrough blister to substrateSubstrate-adhesion failure: blistered over 75% of area
Substrate failure followed by adhesion failureCut through blister and damaged first plyNo damage
Uncoated 1.4 Cut through layer of Kevlar to layer of graphite1.4 Same as above
CAAPCO 0 17.5 No damage5 17.5 Adhesion failure: blistered over 75% of area
Chemglaze 0 34.45 34.4
Astrocoat 32.132.1
010
No damageSubstrate failure: blistered over 90% of area
Kevlar punctured to graphite layer in small pit
Undamaged
Adhesion-substrate failure: eroded through Kevlar layer tographite layer; blistered over 55% of area
Test Conditions:
Velocity 224 m/s (500 mi/h)Rain rate 2.54 cm/h (1 in/h)Drop size 1.8 mm (0.056 in)
79
Pretest Bare Coated
Kevlar
1.4 min Chemglaze32.4 min
Hybrid
1.4 rain
2:
Chemglaze34.4 min
Graphite
Astrocoat43.1 min
Fiberglass
8.9 min
Figure 54. Comparison of Nonmetallic Rain Erosion Test Specimens
80
Hybrid. The hybrid composite tested was composed of alternating layers of graphiteand Kevlar, with an outer layer of Kevlar. Because the outer layer was Kevlar, thenet effect was to perform almost identically with the Kevlar specimens. Modes offailure and endurance times for each of these were similar to those for Kevlar; theonly notable exception was an increase of about $ minutes in the failure time forAstrocoat.
Nonmetallic Leading Edges)Conclusions-Neither Kevlar nor hybrid substrates aresuitable for areas exposed to high-impact rain erosion. The structure of the coatedand uncoated Kevlar and hybrid specimens is subject to rapid destruction in rainerosion environments. Although the coated graphite and fiberglass substrates aremore durable, only the CAAPCO-fiberglass combination can be considered marginallyacceptable for commercial jet transport leading-edge application. Perhaps modifiedapplication procedures, including use of a different primer, might eliminate theadhesion mode of failure and thereby greatly increase the durability of coatedgraphite or fiberglass leading edges.
4.3.4 CORROSION PROTECTION
The primary function of paint or coating systems applied to aircraft structure is toprotect the structure from corrosion. Various paint and primer systems are incurrent usage on the load-bearing skins of the wing and empennage, between frontand rear spars (inspar area). These systems provide good corrosion protection, exceptthat they tend to fail at fastener heads or skin joints where there is some relativemovement under stress cycling. It was thought that the elastomeric qualities ofelastomeric polyurethanes could overcome this deficiency. If so, these materialscould be used on inspar areas and the potential drag benefits discussed in Section ¢.1could be realized.
Salt-spray, filiform, and dynamic tests were conducted on coated 7075-T6 aluminum-alloy specimens (fig. 55) to obtain an initial evaluation of the corrosion protectioncapabilities of elastomeric polyurethanes. Test methods are described in Appendix C.Six coating systems were evaluated: Three elastomeric test coatings were comparedto three control coatings that currently are used on commercial transports. The testcoatings included CAAPCO, Chemglaze, and Astrocoat, each with an undercoat ofepoxy primer and a topcoat of polyurethane enamel for protection from synthetic-type hydraulic fluid. The three control coatings included polyurethane enamel over apolysulfide primer, polyurethane enamel over an epoxy primer, and Corogard paintover an epoxy primer. The coating systems and test specimens are described inAppendix C.
After each test series, the specimens were visually examined and rated for corrosiondensity and distance of migration, according to the following system:
0 = no corrosion1 = trace corrosion2 = moderate corrosion3 = medium corrosion4 = excessive corrosion
= extremely heavy corrosion
4_.3.4.1 Salt-Spray Tests
After the coatings on the salt-spray (and filiform) test specimens had cured for 7
81
Figure 55. Corrosion Test Specimens
days9 collars on the titanium fasteners were loosened and the fasteners were rotatedto break the coating seal. The collars were then retightened. This prerequisite fortesting was done to artificiaUy create a corrosion path and to evaluate the behaviorof coatings under this condition.
The salt-spray tests were conducted on three sets of test coatings and one set ofcontrol coatings. The specimens were exposed to salt spray for 90 days_ per ASTMB1179 then were lightly brushed in water to remove loose corrosion and salt deposits_and allowed to dry. Fasteners were carefuIy removed and the areas around the holes_in the countersink_ and in the holes were examined for evidence of corrosion (chalky9white deposits).
None of the specimens showed evidence of exfoliation corrosion around the fastenerheads. Conditions in the countersink areas and in the fastener holes were rated asshown in Table 8.
4.3.4.2 Filiform Tests
The filiform specimens were identical to those used in the salt-spray tests. As on thesalt-spray specimens_ fasteners were rotated to break the coating seal prior totesting. Three sets of test-coated and one set of control-coated specimens wereexposed to hydrochloric acid vapor for ! hour, as described in Appendix C_ and wereimmediately transferred to an elevated-temperature9 high-humidity environment_where they remained for 90 days. At the end of that time, the specimens werewashed and examined.
None of the specimens showed filiform corosion migrating from the edges of fastenerheads. Overall appearance varied_ however_ because the tougher_ more elastic testcoatings were frayed around fastener heads where the coatings were broken prior totest. Fasteners were carefully removed_ and countersink areas and fastener holeswere examined for corrosion deposits and were rated as shown in Table 9.
82
Table 8.
COATING
Rating of Exfoliation Corrosion
COUNTERSINK HOLES
Control
Enamel/epoxy primer
(BMS IO-60/BMS 10-79)
Enamel/polysulfide primer
(BMS 10-60/PR 1432)
Corogard/epoxy primer
(EC 843/BMS 10-79)
Test
Enamel/CAAPCO/epoxy primer
(BMS lO-60/B-274/BMS 10-79)
Enamel/Chemglaze/epoxy primer
(BMS 10-60/M313/BMS 10-79)
Enamel/Astrocoat/epoxy primer
(BMS 10-60/Type I/BMS 10-79)
Trace None
Trace None
Trace Trace
Trace None
Moderate None
Trace None
Trace None
Trace Trace
Trace Trace
Trace None
None None
Trace None
Table 9.
COATINGS
Control
Rating of Corrosion Deposits
COUNTERSINK
Enamel/epoxy primer
(BMS 10-60/BMS 10-79)
Enamel/polysulfide primer
(BMS 10-60/PR 1432)
Corogard/epoxy primer
(EC 843/BMS 10-79)
Test
Enamel/CAAPCO/epoxy primer
(BMS 10-60/B-274/BMS 10-79)
Enamel/Chemglaze/epoxy primer
(BMS 10-60/M313/BMS 10-79)
Enamel/Astrocoat/epoxy primer
(BMS 10-60/Type I/BMS 10-79)
HOLES
Trace None
Trace None
Trace None
Trace Medium
Moderate Trace
Moderate Trace
Moderate Medium
Moderate None
Moderate None
Moderate Trace
Moderate Moderate
Trace None
83
The test coatings present tough nonporous barriers to corrosion and depend on theirelastomeric characteristics to prevent coating fracture. When the coatings aredeliberately fractured) as in this test9 they do not contain a corrosion inhibitor) asdoes Corogard. Therefore_ a corrosion concentration cell develops at the interface ofthe coating and substrate, and greater corrosion deposits are produced than withCorogard. Table 9 shows more deposits for the test coatings than for the controlcoatings.
4.3.4.3 Dynamic Tests
Dynamic tests were devised to evaluate the coatings after exposure to the simulatedoperational conditions to which a wing upper surface skin would be subjected.Corrosion-inducing factors were combined with cyclic stress loading of the specimensto cause movement of fasteners and create a corrosion path if the coatings failed.The test consisted of a series of five parts conducted in sequence:
I. Condensing humidity 2 weeks2. Weatherometer I week3. Cyclic loading 250 cycles#. Salt spray I week5. Potentiostat measure current flow
(corrosion penetration)
The test series was repeated three times) using the same specimens. During eachseries) the tension stress level was increased during cyclic loading. Appendix Ccontains a description of the specimens) coating systems) and test procedures. Tablesof potentiostat test data are also included.
The potentiostat test apparatus, shown schematically in Appendix C_ provided aconstant potential between the coating surface over a fastener head and thecorresponding aluminum plate in the specimen. The amount of current flowingthrough this circuit_ measured at 2-minute intervals for I0 minutes_ was proportionalto the degree of corrosion penetration or coating failure.
Average current flow for each of the three control coatings is shown in Figure 56 forthe three potentiostat tests. The three control coatings registered a current flow ineach of the potentiostat tests. Enamel over polysulfide primer (coating A) had acurrent of I mA at the end of the first test_ which increased to 7.3 mA in the secondtestp and to 7.2 mA in the third test. Enamel over epoxy primer (coating B) wasslightly lower in the first test_ 0.6 mA, but increased to 7.4 mA in the second test_and to [l.7 mA at the end of the third test. Corogard (coating C) registered acurrent of only 0.04 mA in the first test, but increased an order of magnitude to 0.76mA in the second test_ and ai_ain doubled to 1.7 mA in the third test. The three testcoatings (coatings I_ II_ and lid showed essentially zero current in all of the tests9 theexception being a very slight current in the order of I A on all of the four fastenerheads.
At the conclusion of the dynamic tests_ the specimens were inspected for visualevidence of corrosion. It was noted that the cyclic loading had caused somefracturing at the coating surface at fastener heads of all specimens. On the testcoating specimens, only the enamel topcoat was broken_ and the elastomericpolyurethane basecoat remained intact. Fasteners were removed and the holes andcountersink areas evaluated for exfoliation corrosion. No corrosion was observed onthe test coating specimens. The control coating specimens showed trace corrosion.
84
10
1.0:"r-
00.1--
0.010
A
B
A w ww
I, II, Ill-no current [. 1st test !I I I I I
2 4 6 8 10Time, min
10
1.0
L_0.1
D
E0.01 I
0
v
I, II, I I I-no current I • 2d test [i p
I I I I I
2 4 6 8 10
Time, min
t-
O
0.1
0.010
I, II, Ill-no current I "3d test Ii, I i I I,
2 4 6 8 10
Time, min
Legend:
Control coatings
A Enamel/polysulfide primer
B Enamel/epoxy primer
C Corogard
Test coatingsI Enamel/CAAPCO/epoxy primer
II Enamel/Chemglaze/epoxy primer
III Enamel/Astrocoat/epoxy primer
Figure 56. Potentiostat Test Results
Following the visual inspection, the specimens were subjected to metallographic
examination of the countersink areas. Evidence of corrosion revealed in macropho-
tographs corrolated well with potentiostat test data. A typical fastener countersink,
with fastener removed, was photographed at $.IX enlargement. The specimens were
bisected through the center of the holes and photographs were taken at I00X,
showing a section at the top of the countersink wall. Figures 57 and 58 show these
photos of the control coating specimens and test coating specimens_ respectively.
Control coating A (refer to fig. 56 for description) is shown in Figure 57a. The left
photo shows discoloration that was common, in various degrees, on all specimens.
The right photo, however, reveals an area of corrosion undercutting the countersink
face. The dotted line was added to indicate the area missing. Coating A showed a
high current in the potentiostat tests.
Control coating B (fig. 57b) shows a larger area of corrosion at the top edge of the
countersink. This coating had the highest potentiostat current flow. Control coatingC, Corogard, is shown in Figure 57c. Although this coating had a low potentiostatcurrent, there is no evidence of corrosion on the countersink face. It is believed that
aluminum particles in the Corogard contributed to a current path.
85
X8.1 (a) Control Coating A X100
X8.1 (b) Control Coating B
Figure 57.
.i!iii_ ¸ _ i iiiii!iiiiiiiiiiii iiiiiiiiii_iil
X8.1 (c) Control Coating C (Corog=_l} XlO0
Macrophotographs of Fasterner Countersinks in Control Coating Specimens-Dynamic Tests
86
The test coatings in Figure 58 show no corrosion in the countersink area. The barrierprovided by the elastomeric polyurethane basecoats (CAAPCO, Chemglaze, Astro-coat) did not break down, as confirmed by the potentiostat tests, which showed zerocurrent flow.
4.3.4.4. Conclusions
The following conclusions were reached as a result of testing for corrosion:
Test-coating specimens showed slightly more corrosion than control-coatingspecimens when the coatings were fractured by turning the fasteners prior toexposing the specimens to a corrosive environment. The test coatings are toughand superior in their ability to resist fracture; but when deliberately fractured,the frayed surface presents a larger area of potential corrosion attack.
Corogard, which has displayed outstanding corrosion protection in field experi-ence, performed the best of the three control coatings in the dynamic tests.The enamel/epoxy primer (BMS I0-60/BMSI0-79) and enamel/polysulfide primer(BMS I0-60/PR1432) control coating offered much less corrosion protection.
None of the test coatings showed corrosion penetration at fastener heads duringthe dynamic tests.
The cyclic loads and temperatures used in the dynamic tests were more severe thanthose designed for in service. Tension stress levels during cyclic loading tests wereapproximately 155, 193, and 241 MPa (22 550, 25 000, and 35 000 Ibf/in 2) as comparedto a service design stress level of about 124 MPa (18 000 Ibf/in2). Temperaturesduring cyclic loading were -540C (-650F). Although the enamel topcoat over the testcoatings fractured under these conditions, it is anticipated that the topcoat wouldremain intact under normal service conditions. Extended service evaluation of the
test coatings is recommended to determine if aging in an airline environment has aneffect on their corrosion-protection performance.
4.1+ COST/BENEFIT ASSESSMENT
The cost/benefit analysis of Reference 2 was updated to reflect changes in material,labor, and fuel costs and to reflect results from the airline service evaluations anddrag measurement flight tests. The example airplane used in this assessment was the737 because the drag measurements were obtained on the NASA 737 test airplane.Fleet operating assumptions are listed below:
2400 and 2700 flight-hours per year556 km (300 nmi)
Costs of materials were based on quantity purchases for a fleet of 30 airplanes. Thetwo annual utilization rates represent an average experienced by the entire fleet of737s and higher utilization experienced by airlines whose route structures permitmore efficient usage.
Two cases were examined, as shown in Figure 59. Case I evaluated the benefits fromcoatings applied to leading edges for erosion protection. Although the drag testsdiscussed in Section 4.1 identified a drag penalty due to rough leading edges, airlines
Macrophotographs of Fastener Countersinks in Test Coating Specimens-Dynamic Tests
88
Case I
Leading edge to front spar
Case II
Leading edge to rear spar
Figure 59. 737 Coating Application Areas
with severe erosion problems consider this secondary to reducing leading-edgemaintenance. In extreme cases, leading edges become pitted after I000 to 1200hours, depending on the routes flown, rainfall and contaminants in the air, and tosome extent, airplane geometry. Repeated bufiings reduce the leading-edge skinthickness to a limit (e.g., 25% reduction on B737) that eventually requires replace-ment of parts.
The case I analysis was based on a 9-mil coating of CAAPCO or Chemglaze appliedfrom leading edge to front spar. The 0.3% drag penalty identified in Section 4.1 wasassessed to a rough wing leading edge; no additional penalty was assumed for roughempennage leading edges. The analysis also assumed one buffing per year wasrequired for uncoated leading edges; however, no charge was included for replace-ment of parts.
Case II extends the coating coverage to the rear spar. The area between spars (inspararea) had a 4.5-rail CAAPCO or Chemglaze basecoat, covered with a 2-rail topcoatof polyurethane enamel. This coating provided good corrosion protection for theinspar area and produced a drag reduction. In case II, a drag benefit of 0.$5% wasused, based on the findings of Section 4.1. This benefit came from replacing wingupper surface Corogard with the coating system (0.4% drag reduction), smooth wingleading edge (0.3%), and the coating system applied to both sides of empennagesurfaces in place of paint (0.15%). No drag credit was assumed for coating the winglower surface because of the many access panels in that area and exposure to foreignobject damage (FOD).
4.4.1 COST ANALYSIS
All costs were calculated in 19gl dollars. Changes in costs from the analysis ofReference 2 resulted from changes in labor and material costs and from a re-evaluation of coating life based on results of the flight service evaluations by Deltaand Continental. It was concluded from these evaluations that the projected life ofCAAPCO in a rain erosion environment should be increased from 6000 to 6500 flight-hours and that Chemglaze should be reduced from 6000 to 5000 flight-hours.
Table l0 shows the number of applications of paint, CAAPCO, or Chemglaze over a2q 000-hr cycle and the total time (flow-hours) and labor-hours involved per
89
Table 10. 24 O00_r Cycle Requirements for Painting and Coating Applications
STANDARD PAINT CAAPCO COATING ICHEMGLAZE COATINGAPPLICATIONS
Factory
Number of applications
Flow-hours per application
Labor-hours per application
Field leading_dge recoat
Number of applications
Flow-hours per application
Labor-hours per application
Field total recoat
Number of applications
Flow-hours per application
Labor-hours per application
CASE I CASE I I
a
5
4
b
1
64
56
4
4
b
1
64
102
CASE I
1
84.5
99
3
84.5
132
CASE I I
1
94.5
218
2
84.5
132
1
94.5
327
CASEI
1
76
74
4
76
98
CASE II
1
86
176
3
76
98
1
86
264
aField leading_dge buffing.
bField total repaint.
application. The factory application was at time of airplane production using
standard paint spray [acilities in a paint hangar. The field applications were assumed
to have been accomplished in airline maintenance hangars by skilled painters. The
labor-hours [or field applications were arbitrarily increased 33% over [actory labor-hours for case I and 50% for case [l because of the dif[erent facilities available and a
lower frequency of field application (learning curve effect).
Table I l contains a summary of the areas covered and the weights of each element of
the standard paint system and the coating systems when applied to a 737 airplane.
The weight increase in each coating system over the standard paint system results in
a fuel-burn penalty that is shown in Figure 60. Table 12 shows the cost of materials
involved in each application of paint or coating.
The total cost increments of coating systems over those of the standard paint
configuration ranged between $6 000 and $I0 000 prorated on an annual basis,
depending on airplane utilization, coating system applied, and extent of application
(case [ or case II). The greatest cost increment was in [low time, or greater airplane
downtime, to allow for proper curing of the coatings. The second most important
cost factor was labori the least significant factor was materials costs. No credit was
taken for any possible of[setting benefits from reduced maintenance to leading edges
and inspar structure, other than an annual buffing (4 labor-hours) of uncoated leading
edges.
4.4.2 BENEFIT ANALYSIS
Results of the analysis performed on a 737-200 airplane are presented in Figure 61.
Coating the wing and empennage leading edges only (case l, shown in fig. 61a), would
not return a net benefit to the operator until the price o[ fuel increased aboveoresent levels. The breakeven fuel price is about 36¢/L ($l.37/gaI) for CAAPCO and
90
Table 11. Painting and Coating Areas and Weights of Applied Materials
CASE I CASE II
AREA. WEIGHT, AREA. WEIGHT,m2 (ft _) kg (Ib) m2 (ft _) kg (Ib)
Painting
Primer
Corogard
Polyurethane enamel
Total
Coating
Primer
Coating
Polyurethane enamel
Total
Weight differential(coating-painting)
400
AJ_
J¢
=;
3O0¢l
Ee_
_=-_ 200CC
.E
m
C
IO0
45.8 (493)
45.8 (493)
0 (0)
m
CAAPCO
1.25 (2.76)
12.07 (26.62)
0 (0)
13.32 (29.38)
13.32 (29.38)
CHEMGLAZE
1.25 (2.76)
14.09 (31.06)
0 (0)
15.34 (33.82)
15.34 (33.82)
86.3 (929)
40.4 (435)
45.9 (494)
127.1 (1368)
127.1 (1368)
81.3 (875)
2.36
3.45
3.13
8.94
CAAPCO
3.47 (7.66)
22.79 (5O.25)
5.56 (12.25)
31.82 (70.16)
22.88 (50.94)
(5.2)
(7.61)
(6.91)
(19.72)
CHEMGLAZE
3.47 (7.66)
26.59 (58.62)
5.56 (12.25)
35.62 (78.47) I
26.68 (58.75)
10O0)
-(8OO)
6OO)
Case II
(400)
Chemglaze
Case I CAAPCO
(2OO)
ChemglazeCAAPCO
0
(20) (40) (60) (80)I I I |
I I I
10 20 30
Increase in OEW, kg (Ib)
Figure 60. 737-200 Fuel-Burn Sensitivity, to Increase in Weight
()1
!
4O
Table 12. Materia/ Costs
COMPONENTCOST, $
Painting
Primer
Corogard
Polyurethane enamel
Coating
Primer
Polyurethane enamel
CAAPCO
Chemglaze
CASE I
TOTALCOST,$
m
MATERIAL COSTDIFFERENCECOAT-PAINT, $
18
489 507
265 283
m
507
283
COMPONENTCOST, $
CASE I I
TOTALCOST ,$
33
248
53 334
49
93
941 1083
518 660
MATER IAL COSTDIFFERENCECOAT-PAINT, $
m
D
p
B
749
326
_0_./L ($1.31/gal) for Chemglaze. These results were based on a 0.3% drag reductionbenefit from preserving a smooth wing leading edge in contrast to flying with a
severely eroded wing leading edge. Because the effects of empennage leading-edge
erosion were not measured during the drag tests described in Section 4.1, no
additional drag benefits were assumed from these surfaces. Some airlines, flying in
extreme erosion environments, must replace leading edges after several buffings. No
credit was included in the analysis for reduced costs for parts replacement.
Case II results are shown in Figure 6Ib. Significant benefits came from extending the
CAAPCO or Chemglaze coating systems back to the rear spar of wing and
empennage. The combined effects of smooth leading edges, replacing Corogard on
wing upper surfaces with coating and replacing empennage paint with coating--for anestimated drag reduction of 0.$$%-produced net savings of $I0 000 to $20 000 per
airplane per year, depending on utilization and the price of fuel.
As stated earlier in this document, the drag increment from Corogard found in the
flight tests discussed in Section 4.1 was for an application that was somewhat rougherthan the average for the existing fleet (160 #in versus l_0 /sin average), and recent
application techniques now produce Corogard surfaces of about a 90 to 100 _in
roughness. To compensate for this difference in roughness, no penalty was includedin the analysis for the rapid increase in Corogard drag with increase in Reynolds
number found in the drag measurement flight tests. Therefore, only the Corogard
drag penalty during high-altitude cruise was included.
Benefits from using the coatings on other types of aircraft are beyond the scope of
this assessment. Many factors influence the cost/benefit results that are peculiar to
airplane geometry and airplane usage. It is speculated that the 737 assessment would
apply, in general, to other jet transports: coatings applied to leading edges only for a
reduction in fuel burn produce marginal benefits; coatings applied from the leading
edge to rear spar produce significant savings. In some cases, however, it might be
desirable to apply coatings to the leading edges to preserve low-speed handling
qualities or to reduce costs of parts replacement, aside from fuel-burnconsiderations.
92
6 m
_4
N o
_-2
m
ICAAPCO1 -_- _ 4
_ _o
L.Ar_ _ I_ -2
¢j
_--4
(1.100) (1.25) (1.50)I z"41 I I I
25 30 35 40
Fuel price, ¢/L ($/gal)
(a)
I Chemglaze I
(1.00) ( 1.25) ( 1.50)I I I
NI I I I25 30 35 40
Case I-Leading-Edge Coatings
Fuel price, ¢/L ($/gal)
20
18
16
-- 14
12
10
8
¢3
z 6
20ICAAPCOI 18
14
_ lO
- g 8
- Z 6
4 M
2-
( 1.00)
oi_ I25
2 m
( 1.25) ( 1.50) ( 1.00)
i I o J,,,,II I 130 35 40 25
Fuel price, ¢/L ($/gal)
( 1.25) (1.50)I I
I I I30 35 40
Fuel price, ¢/L ($/gal)
(b) Case II-Coating$ from Leading Edge to Rear Spar
Figure 61. Estimated Cost/Benefit of Coatings on 737-200
93
5.0 CONCLUSIONS AND RECOMMENDATIONS
The test and analyses of surface coatings conducted under Contracts NASl-14742 andNAS1-15325 showed two elastomeric polyurethane spray-on products, CAAPCOB-274 and Chemglaze M313, to be effective erosion deterrents when applied toleading edges. These materials, when applied to inspar areas with a polyurethaneenamel topcoat, provide good protection from corrosion and from attack by synthe-tic-type hydraulic fluid (e.g., Skydrol or Hyjet IV). These coatings tend to mask smallexcrescences in the substrate surface and present a smooth surface that results in areduction in airplane drag.
The following conclusions and recommendations are derived from results of a dragmeasurement test, airline service evaluations, laboratory environmental tests, and acost/benefit assessment described in this document.
5.1 CONCLUSIONS
5.1.1 DRAG MEASUREMENT TEST
The effects of coatings on wing boundary layer were measured on a 737 in flighttests. The effects on drag were also estimated, based on the boundary layer data.The results shown below are wing upper surface effects during cruise. Greatereffects would be expected if coated areas had included the empennage surfaces.
CAAPCO B-274 applied to the 737 wing upper surface showed a section profiledrag reduction of 0.75% to 1.5% relative to the bare metal surface, dependingon Reynolds number. This is equivalent to about 0.2% reduction in total
airplane drag at a cruise unit Reynolds number of 6.5 million per meter (2.0million per foot).
Corogard Taint applied to the wing upper surface inspar area (average measuredroughness of 160 in) increased section profile drag 0.5% to 3.5%9 depending onReynolds number. This increase is equivalent to an increase in total airplanedrag of about 0.2% at cruise unit Reynolds number (6.5 million per meter). Thedrag increment increases rapidly with increase in Reynolds number.
At a typical cruise condition (C L = 0.4_), a simulated badly eroded wing leadingedge increased the section profile drag 1.6%, which is equivalent to about 0.3%airplane drag for erosion along the entire span. The drag increment becomesgreater at higher lift coefficients.
The masking characteristics and surface smoothness of Chemglaze M313 aresimilar to CAAPCO B-274, therefore, it can be assumed that Chemglaze wouldproduce equal drag benefits.
5.1.2 FLIGHT SERVICE EVALUATIONS
Airline evaluations of CAAPCO and Chemglaze coatings (and to a limited degree,Astrocoat) applied to leading edges for erosion prevention led to the followingconclusions:
CAAPCO B-274 is the most durable of the three coatings tested. Whenproperly applied over an epoxy primer (BMS 10-79 or equivalent), it has aleading-edge life in excess of 6500 flight-hours in normal airline service.
95
Chemglaze M313 has a leading-edge life in excess of 5000 flight-hours. Itdemonstrated good adhesion when applied over either a wash primer or epoxyprimer.
It is essential that the substrate be thoroughly cleaned prior to application ofeither type of primer,
Spot repair of the coatings in the field can best be accomplished during layup forscheduled maintenance to allow sufficient time for proper reapplication andcuring. Major repair can be completed in 4g hours with the aid of heat lamps toaccelerate curing.
• The erosion life of CAAPCO and Chemglaze is greater than that for Astrocoat.
5.1.3 ENVIRONMENTAL TESTS
Laboratory tests to evaluate the compatibility of coatings with the jet transportoperating environment showed that:
Coatings can be used on leading edges equipped with thermal anti-icing (TAI).The coatings will withstand TAI elevated temperatures and will not signifi-cantly degrade TA] system performance.
If an airplane has wing-mounted nacelles and fuel contained in the wing in thatimmediate area, a lightning strike analysis should be performed before applyingcoatings to that area.
Coatings will not cause precipitation static interference with communicationand navigation equipment.
Dual coatings of CAAPCO, Chemglaze, or Astrocoat with a polyurethaneenamel topcoat provide good corrosion protection when applied to inspar areas.The elastomeric properties of the basecoat prevent coating fracture at fastenerheads. In dynamic tests, the dual coatings compared favorably with Corogardfor corrosion protection.
Rain erosion tests indicated that a 9-rail coating is as durable as thickercoatings in a high erosion environment. (Note: At this coating thickness, noneof the three materials failed within the lg0-minute time limit for testing atAFML. Therefore, the comparative erosion life of the three materials was notdetermined from this particular test. Previous erosion tests and flight serviceevaluation results led to the conclusions regarding their relative durability.)
Because of their poor resistance to rain erosion_ composite materials, such asgraphite-epoxy, fiberglass-epoxy, Kevlar-epoxy or a hybrid of Kevlar-graphite-epoxy, are unsuitable as leading edges in high- speed transport aircraft. A9-rail protective coating of elastorneric polyurethane increased the erosion lifethree-to tenfold; however, even with the coating, the most durable specimentested (CAAPCO over fiberglass) had an erosion life roughly equivalent to 1year in airline service. This is less than half the erosion life of CAAPCO overan aluminum substrate.
96
5.1.4 COST/BENEFIT ASSESSMENT
A cost/benefit assessment of coatings applied to the 737-200 showed thatcoatings applied only to leading-edge areas for erosion protection producemarginal benefits at fuel prices less than 36¢/L ($1.37/gal). This did not includeany possible additional benefits from reduction of costs of replacing leadingedges if coatings are not used.
Coatings on the 737-200 from leading edge to rear spar show a potential annualbenefit of $10,000 to $209000 per airplane, depending on utilization rate and theprice of fuel.
5.2 RECOMMENDATIONS
The two elastomeric polyurethane coatings (CAAPCO B-274 and Chemglaze M313)investigated under Contracts NAS1-14742 and NAS1-15325 were found to providegood protection against leading-edge erosion and a potential reduction in airplanedrag. Corrosion protection to structural skins was evaluated in laboratory tests andtentatively found to be superior to that of currently used protective systems. Thelong-term corrosion protection characteristics of these coatings must be thoroughlyinvestigated, however, before they can replace current coating systems on structuralskins. The effects of environmental factors such as ozone, ultraviolet radiation,temperature and pressure cycling, exposure to aircraft fluids and stress cycling mustalso be evaluated over long-term inflight service to ensure that the corrosionprotection demonstrated in the laboratory endures.
It is recommended that industry pursue necessary and sufficient additional corrosionprotection investigations of these coatings to fully qualify them for application to thejet transport fleet.
97
6.0 REFERENCES
o Boeing Commerical Airplane Company (BCAC).
Study, NASA CR 158954, 3anuary 1979.
Aircraft Surface Coatings
e BCAC. Aircraft Surface Coatings Study-Verification of Selected Materials,
NASA CR 179288, September 1980.
o BCAC. Flight Test Evaluation of Drag Effects of Surface Coatings on the
NASA Boeing 737 TCV Airplane, NASA CR 165767, 3une 1981.
_e Nash, 3. F. and Bradshaw, P. "The Magnification of Roughness Drag by
Pressure Gradients," 3ournal of the Royal Aeronautical Society_ Vol. It 3anuary
1967.
99
APPENDIX ADRAG TEST DATA ANALYSIS
Analysis Method
The test analysis method is described in Reference 3) following is a discussion of theprincipal steps, First, the boundary layer velocity profiles were determined from themeasured total pressure loss within the boundary layer, Then, the momentum lossprofile was calculated and was integrated to obtain the momentum thickness, Thesecalculations were performed by an existing Boeing computer program, A-55, "Turbu=lent Boundary Layer Profile Analysis,"
Measurements were taken at the 7396 chord location. Therefore, the increments inmomentum thickness had to be extrapolated to the trailing edge to express theresults in terms of section profile drag. This was done by calculating boundary layergrowth along the test section from measured surface static pressure distributions andderiving a magnification factor that translates a given increment in momentumthickness, measured at the rake location, into a corresponding increment in sectionprofile drag coefficient:
ACd = m
where 40 = 01eft -0right is the momentum thickness difference between the left andright wing test sections) and m is the magnification factor.
The boundary layer growth calculations were performed by another existing Boeingcomputer program, TEM 139, "A Finite Difference Method To Calculate the BoundaryLayer Development on an Infinite Yawed Wing." The magnification factor wascalculated following a method given by Nash and Bradshaw (ref. 4).
This calculation yields incremental drag coefficients based on the chord of the testsection. The ultimate objective--to determine effects of the various surfaceconfigurations on total airplane drag--is complicated by a number of factors thatmust be taken into consideration, e.g., the chordwise extent of the coated area alongthe entire span and local flow conditions that also vary along the span. Assumingthat similar conditions and effects exist at all spanwise stations, conversion factorsfor airplane drag can be calculated.
Data Processing
The data processing and test analysis were accomplished in six steps) as shown inFigure A-I. NASA provided raw data tapes that contained time histories of 16variables, including boundary layer rake pressures) reference total) static anddynamic pressures, total temperature) remaining fuel weight, airspeed, altitude, andangle of attack. Each measured quantity was recorded at the rate of 40 readings persecond. Because the data-taking interval during each of the 15 test conditions lastedabout 2 minutes (two scanning cycles)) the basic tapes contained a large volume ofdata (some 1.2 million readouts per flight).
The first step of the data-reduction process was to filter, average, and reformat thedata contained in the raw data tapes. An auxiliary computer program was written toaccomplish this task and provided an interface between the recorded data and thecomputer programs used to analyze the data. Data that were unreasonably out ofrange (stray points) were deleted) and the mean and standard deviations were
101
EXPERIMENTALPRESSUREDISTR IBUTIONS
EXTRAPOLATE TO ITRAILING EDGE
l NASA RAW DATA TAPE I
1FILTER, AVERAGE AND REFORMAT
GENERATE A55 __INPUT FILES
BOUNDARY I BOUNDARY
LAYER LAYERPROFI LES I NTEG RATED
PARAMETERS
8 CORRECTIONS tFOR Cp
VARIATION
I EXTRACT 0 tINCREMENTS
Step 1
Step 2
Step 3
Step 4
Step 5
I CALCULATE t
.= SECTION AND
"[ AIRPLANE DRAGINCREMENTS
Step 6
Figure A-1. Data Processing Sequence
102
computed for each remaining data point. Based on the standard deviation, if thescatter in a set of data was too large, these data were deleted. Most of the data)however, fell within very narrow scatter bands (_+0.196), thus only very few datapoints were actually deleted. Another main function of the interface program was togenerate average values of the test variables. The boundary layer rake data and thereference pressure data were averaged for each scan position. Those variables thatwere essentially constant during a given test condition (such as airspeed, altitude) andtemperature) were averaged for the entire scanning cycle. The averaged data thenwere adjusted for such small-scale perturbations as zero shift, amplifier sensitivitydrift) or slight variations in airspeed during a scanning cycle.
In the second step of the data-reduction process) input files were generated for thetwo principal computer programs used in the test analysis: the boundary layer profileanalysis program (A-55) and the boundary layer growth analysis program (TEM 139).
The third step constituted processing the test data by the A-$$ and TEM 139
computer programs. Data from flights I, 3) 4, and 5 (i.e., the boundary layer surveydata) were processed by A-55, and the surface pressure survey data from flight 2were processed by TEM 139. From the output of A-55, two plot files were generated,which allowed machine plotting of the test results. One file included the boundarylayer profile parameters (i.e., those variables that are dependent on height), and theother contained the global or integrated parameters.
In the fourth step of data processing) a correction was applied to the boundary layermomentum thickness data to compensate for slight differences in the local static
pressures, Cp) between the left and right wing test sections.
During the fifth step, momentum thickness increments between the left and rightwing test sections were extracted from the data. In parallel with this task, theapplicable magnification factors were determined for each test condition based onresults of the boundary layer calculations made by TEM 139.
The sixth step of the data reduction process consisted of translating the localmomentum thickness increments measured at the rake location (7396 test sectionchord) into section profile drag increments and, ultimately, extrapolation of thesection profile drag increments in terms of total airplane drag increments.
The section pressure distributions from flight 2 were used) according to the methoddescribed in Reference 3, to convert boundary layer momentum losses measured at7396 chord of the upper surface to full-chord section profile drag increments at themeasurement station. Boundary layer data from flight 3 (both test panels bare metal)were compared and a correction factor was applied to the right wing reference paneldata. This permitted boundary layer changes due to coatings or paint (flights l, 2, 4,and $) to be evaluated from data taken simultaneously on left and right wing panels.
103
APPENDIX BICING TEST DATA
This appendix contains data from icing and thermal conductivity tests to supportSection 4.3.l. It contains comparisons of temperature profiles obtained from the twoparallel rows of slat skin thermocouples, comparisons of skin temperatures producedby I00% versus 75% thermal anti-icing (TAI) system flow rate, and a reproduction oftemperatures recorded during the tests.
Three series of tests were conducted in the anti-icing mode. Runs l to 6 were madewith the model uncoated, runs 7 to 12 with CAAPCO coating, and runs 16 to 22 withChemglaze coating. Runs 13 to 15 and 20 were not recorded because of inadvertenterrors in setting up test conditions in the icing tunnel. Each series contained sixruns: Each condition-dry air, intermittent maximum icing, and continuous maximumicing-was run at 100% and 75% rated flow of the TAI system.
Following the anti-icing tests, a test (run 23) was conducted in the deicing mode withthe Chemglaze coating and an overcoat of silicone compound (G.E. 117-g441B) on theoutboard half of the model. Tunnel conditions of run Ig were duplicated, and fivecycles of ice buildup and dissipation were observed and photographed (figs. 46 and47). Thermocouple temperatures were not recorded.
Thermocouple (T/C) locations and numbers are shown in Figure B-I and in thetabulation below the figure. These numbers correspond to the T/C numbers inTables B-I through 13-6. The two rows of leading-edge skin T/Cs are numbered Ithrough I0 and II through 21, respectively. T/Cs 1 through I0 are directly in linewith a TAI spray tube orifice (I0 orifices, 3.gi cm [ 1.50 in ] apart, 3.58-mm[ 0.141-in ] diameter); T/Cs I 1 through 21 are midway between two orifices.
Figures B-2, B-3, and B-4 show temperature comparisons from the two rows of skinT/Cs for each of the three coating configurations. There was very little difference intemperatures, and T/Cs I through 10 generally were higher where differencesexisted. For this reason and for clarity, data from T/Cs l through 10 only are shownin Section 4.3.1.
Figures B-5, B-6, and B-7 show temperature comparisons from 100% TAI rated flowand 75% TAI rated flow. As expected, temperatures produced by 100% flow (the flowrate selected for Model 767 slat anti-icing from previous tests of the model) wereappreciably higher than those recorded during 75% TAI flow testing. Again forclarity, data from the 100% TAI flow runs only are shown in Section 4.3.1.
I05
TAI spray tube
3,13
4,14
5,15
24
6,16
7,17
26
1,11
2,12web
22
23
8,19
9,2010, 21
THERMOCOUPLE NUMBERS, VARIABLE
RUN A B TUNNEL FLOW TUBE
SERIES (SPRAY TUBE) (UPPER D-DUCT) (NOT SHOWN) (NOT SHOWN)
Three types of corrosion tests were performed: salt spray, filiform, and dynamic.Specimens were prepared with six different coating configurations-three werecontrol coatings, currently used on commercial transports, and three were testcoatings that had an elastomeric polyurethane basecoat and a polyurethane enameltopcoat. The enamel topcoat, added for protection of the basecoat against hydraulicfluid, was included in the tests to evaluate its reaction to the strains induced duringdynamic test cyclic loading. It was found (sec. 4.3.4.3) that although there was somefracturing of the enamel topcoa% the elastomeric basecoat remained an intactcorrosion barrier.
Specimen preparation, a description of test procedures, and potentiostat data fromthe dynamic tests are contained in this appendix. Corrosion test results arepresented in Section 4.3.4.
Specimen Preparation
All specimens were made of 7075-T6 aluminum alloy with B30NW-gK# Hi-Loktitanium fasteners installed. The salt-spray and filiform specimens and the top platesof the dynamic specimens were milled from plate stock_ as shown in Figure C-la, toexpose end grain and promote corrosion. Dimensions of assembled specimens areshown in Figures C-Ib and C-Ic.
The number of test specimens prepared and the various coating configurations usedare shown in Table C-I. The steps followed in specimen preparation were'
. Anodize each aluminum part. Seal in deionized water to I0% +296 hydration.Apply BMS 10-20 Type II to all surfaces.
o Drill and countersink holes to provide a clearance fit of 0.0254 to 0.127 mm(0.001 to 0.005in). Install Hi-Lok B30NW-gK4 titanium fasteners andBACC30M aluminum collars. (Note: Strip aluminum-pigmented coating fromfasteners to be used in salt-spray and filiform specimens prior to installation.)
3. Clean'specimens with BMS 1l-7 solvent or MEK.
4. Apply coatings as shown in Table C-I. Allow to cure at room temperature for7 days.
5. Loosen fastener collars on only salt=spray and filiform specimens, rotatefasteners to break topcoat, and retighten collars.
6. Apply fillet seals, using BMS 5-26 sealant, as shown in Figure C-lb.
Test Procedures
Salt Spray Tests-Specimens were placed in a salt-spray environment for 90 days, perASTM BI 17. The panels were inclined 15 deg from vertical, with coated surfaces up.At the end of the 90-day period_ loose corrosion and salt deposits were removed bylightly brushing in water. Specimens were allowed to dry, then were examined and
149
rated for corrosion density and distance of corrosion migration using the followingqualitative scale:
0 = no corrosion1 = trace2 = moderate3 = medium
= excessive
5 = extremely heavy
Filiform Tests-The test consisted of two parts. The specimens were exposed tohydrochloric acid (HCI) vapor for 1 hour, then were placed in a high-humidityenvironment for 90 days. The test setup for HCI exposure is shown in Figure C-2.Specimens were suspended vertically in a glass container above a solution of 12NHCI. Low-pressure air, at 23.89 +_2.goc (75 +5OF), was passed through the solutionfor I hour) exposing the specimens to HCI vapor. The specimens were then placedimmediately in an environment of 35 +2.8oc (95 +5OF) and 80oc +_5% relativehumidity) where they remained for 90 days.
At the end of the 90-day period, specimens were cleaned, examined) and rated forcorrosion penetration in the same manner as were the salt-spray specimens.
Dynamic Tests-The dynamic test specimens shown in Figure C-lc were subjected toa series of five tests performed in the following sequence:
. Condensing humidity-specimens were placed in an environment of $g.gg°c(120OF) and 100% relative humidity for 2 weeks.
2. Weather.meter--one-week exposure per FTMS 131, method 6152. (Testdescription in ref. 1.)
3. Cyclic loading-250 cycles in a tension loading machine at -53.89°C (-65OF).
4. Salt spray-l-week exposure per ASTM B117.
5. Potentiostat-determine degree of corrosion penetration by measuring currentflow between the cathode and specimen plate. The test apparatus and methodare described in the following paragraphs. Test data are included in Table C-2.
The above series of tests were repeated three times) with the cyclic-load stress levelincreasing progressively. Stress levels during the three cyclic load tests were:
Series I 155 138 kPa (22 500 Ibf/in 2)Series 2 193 060 kPa (28 000 Ibf/in 2)
Series 3 2t)l 325 kPa (35 000 Ibf/in 2)
Potentiostat Test Apparatus: Figure C-3 is a schematic diagram of the potentiostattest apparatus. The principal elements include an electrochemical cell installed overa fastener head in the specimen, a potentiostat and recorder, and an electrometer(not shown). The equipment had the following characteristics:
. Electrochemical cell-The cell consists of a 1.27 cm (0.5 in) inside diameter
glass or plastic tube, with a rubber gasket that seals the tube to the specimenand exposes a 3/g-inch-diameter circle of the specimen to the solution. The
150
cathode isa platinum wire, and the reference electrode isa saturated calomelelectrode.
. Potentiostat-The potentiostat must provide a constant potential within +I mYof a present value with a current output of up to IA.
. Recorder-The recorder must have an accuracy of 196 of the absolute value ofthe reading.
_o Electrometer-The electrometer must have a high input impedance (I011 to101_Q ). A Keithley model 6IOC electrometer meets this requirement.
Potentiostat Test Method= The test provides a controlled environment for themeasurement of corrosion current versus time on aluminum skin with titaniumfasteners installed.
Under a constant potential, a protective film remains effective as long as there is nodiscontinuity or break in the film and, therefore, no current flow. When a crack ordiscontinuity appears, a measurable current flow occurs and is recorded as a functionof time.
The test procedure is as follows"
. Provide a test electrolyte of 5 wt % NaCl solution, adjusted to a pH of 3.0 withHCf.
2. Test temperature is 23.9 +2.goc (75 +50OF)
. Adjust the applied potential between the test specimen (aluminum top plate)and the reference electrode to -0.500V. Periodically check the appliedpotential on the potentiostat using the electrometer. Remove the electrometerfrom the test circuit before conducting the actual test.
_Q Place specimen on jack table and apply pressure to seal the specimen with thegasket. Transfer 10 ml of the electrolyte into the test cell and place thereference electrode.
Connect the three electrodes to the potentiostat. The working electrode is thetest specimen. The platinum electrode is the auxiliary electrode, and thereference electrode is the saturated calomel electrode.
. Select an appropriate current sensitivity and connect the recorder to thepotentiostat. Measure the corrosion current as a function of time for10 minutes.
Further information on the theory and procedures for potentiostatic testing iscontained in References C-I and C-2.
References
C-/. Stone, 3.; Tuttle, H. A.; and Bogard, H. N. "The Ford Anodized Aluminum
Corrosion Test-FACT," Plating, 53:877, 1966.
151
C-2, ASTM GS, A standard reference method for taking potentiostatic and potentio-dynamic measurements.
152
0.635
(0.25
Long transverse
_._ direction
15.24 cm J
JJ(6in) j_.I
J grain direction
1.27 cm
(0.5 in) Machine mill to surface finish RH R 125
(a) Method of Milling 7075-T6 Plate To Expose Transverse Grain Ends
Figure C-1. Corrosion Test Specimen Fabrication
153
T5.08 cm
(2 in)
11.70 cm
1.70 em
(0.67 in)
_L_
2.54 crn""-(1 in)
2.54 cm-'=-(1 in) ""
15.24 cm
(6 in)
I
o
0.64 cm
(0.25 in)", I ," . [;ri ,= I I I
F Hi-Lok fasteners
BMS 5-26
sealant
!IIII
(b) Salt-Spray and Filiform Test Specimen
Figure C-I. Corrosion Test Specimen Fabrication (Continued)
154
T5.08 cm
(2.0 in)
±
I
7.62 cm
(3 in)
2.54 cm
(1.0 in)
__.I_
!
1.27 cm
(0.5 in)
2.54 cm
_1.27 cm (0.5 in)
++++
0.32 cm
(0.125 in)
25.718 cm
(10.125 in)0.32 cm
(0.125 in) _ j-=-- 0.32 cm (0.125 in)
, i i I _ I .I
10.48 cm I
I " (4.125 in) = I
(c) Dynamic Test Specimen
Figure C-I. Corrosion Test Specimen Fabrication (Conc/uded)
155
Table C- 1. Corrosion Test Specimens
NUMBER OF
SPECIMENS COATING CONFIGURATION
FILl SALT DYNA-PR IM E R BASECOAT TOPCOAT
FORM SPRAY MIC
1 1 1
.E
O
8
C,t
{u
8
{g
EpoxyBMS 10-79
0.7 to 1.0 mil
1 1 1 PolysulfideBMS 5-95 class F
0.7 to 1.0 mil
1 1 1 EpoxyBMS 10-79
0.7 to 1.0 mil
3 3 1
3 3 1
3 3 1
EpoxyBMS 10-790.7 to 1.0 mil
EpoxyBMS 10-79
0.7 to 1.0 mil
EpoxyBMS 10-79
0.7 to 1.0 mil
Elastomeric
polyurethaneCAAPCO B-274
4.0 to 5.0 mil
Elastomeric
polyurethane
Chemglaze M3134.0 to 5.0 rail
Elastomeric
polyurethane
Astrocoat Type I4.0 to 5.0 mil
Co rogard2 to 3 mil
Polyurethane enamelBMS 10-60
1.4 to 1.8 rail
Polyurethane enamelBMS 10-601.4 to 1.8 mil
Polyurethane enamelBMS 10-60
1.4 to 1.8 mil
Polyurethane enamelBMS 10-601,4 to 1.8 rail
Polyurethane enamelBMS 10-60
1.4 to 1.8 mil
156
]_f- Low-pressureair
wi re
HCI vapor
O0 O0 O0
O0 O0 O0
O0 O0 O0
O0 O0 O0
O0 O0 O0
301 stainless-
steel tubing
12N HCIGlass
container
Air
Figure C-2. HCI Vapor Exposure Test Setup
157
I _I _-" .......... I I I
Table C-2. Potentiostat Test Data (First Test)
COATING
Polyurethaneenamel (BMS 10-60)
over polysulfideprimer (PR 1432GP)
Polyurethane
enamel (BMS 10-60)
over epoxy primer
(BMS 10-79)
FASTENER
1
23
45
Average
Log i1
2
3
4
5
Average
Log i
CURRENT, mA, AT TIME, min
1.660
0.617
0.251
0.646
0.794
-3.100
0.398
0.427
0.955
0.363
0.4900.527
-3.280
1.700
0.617
0.550
0.646
0,878
-3.06O
0.437
0.468
0.955
0.4790.447
0.557
-3.250
1.740
0,759
0.708
0.759
0.992
-3.0000.468
0.479
0.933
0.575
0.427
0.576-3.240
1.740
0.759
0.759
0.794
1.010-2.990
0.525
0.479
0.933
0.676
0.417
0.606-3.220
10
1.740 --
0.759
0,759
1.O50
1.080
-2.970
0.479
0.501
0.955
0.776
0.457
0.634-3.200
Table C-2. Potentiostat Test Data (Third Test)
COATING
Polyurethane
enamel (8MS 10-60)
over polysulfideprimer (PR 1432GP)
Polyurethaneenamel (BMS 10-60)
over epoxy primer
Corogard (EC-843)
over epoxy primer(BMS 10-79)
CAAPCO B-274
elastomeric
polyurethane
over epoxyprimer (BMS 10-79)
FASTENER
1
23
4
5
Average
Log i
1
2
3
4
5Average
Log i
1
2
34
5
Average
Log i
1
2
34
5
Average
Log i
0
0.60
0.80
5.200,12
1.40
1.62
-2.79
2.20
3.00
8.204.50
-2.35
0.04
0.01
2.00
0.68
-3.17
CURRENT, mA, AT TIME, min
9.00
4.80
5.60
1.002.40
4.56
-2.34
2.40
6.30
10.206.00
14.40
7.86
-2.10
0.47
0.22
0.10
0.16
3.00
0.79-3.10
9.40
6.10
6.60
2.303.40
5.56
-2.25
2.40
8.00
12.006.50
14.50
8.68
-2.06
0.87
0.44
0.120.27
3.80
1.10-2.96
9.00
7.40
6.80
3.504.00
6.14
-2.21
3.00
9.60
13.20
7.50
16.60
9.98-ZOO
0.94
0.46
0. t60.40
4.50
1.29
-2.89
9.40
7,80
7.205.00
4.20
6.72-2.17
3.60
9.60
14.40
8.20
18.5010.86
- 1.96
1.22
0.620.20
0.51
5.50
1.61
-2.79
On fastener 2, a small current of 0.27/JA, otherwise, nevera positive current
10
9.00
8,30
7.606.40
4.90
7.24-2.14
3.80
10.00
16.40
8.70
19.8011.74
-1.93
1.56
0.6)'
0.25
0.56
5.60
1,73
-2.76
Chemglaze M313 1elastomeric 2
HCIvapor
_
0 0
0 0
0 0
0 0
0 0
O0 O0
O0 O0
O0 O0
O0 O0
O0 O0
wire
301 stainless-
steel tubing
12N HCIGlass
container
Air
Figure C-2. HCI Vapor Exposure Test Setup
157
Table C-2. Potentiostat Test Data (First Test)
o_
"6
Co
L)
COATING FASTENER
Polyurethane
enamel (BMS 10-60)
over polysulfide
primer (PR 1432GP)
Polyurethaneenamel (BMS 10-60)
over epoxy primer(BMS 10-79)
Corogard (EC-843}over epoxy primer(BMS 10-79)
CAAPCO B-274
elastomeric
polyurethane
over epoxy
primer (BMS 10-79)
Chemglaze M313elastomeric
polyurethaneoo over epoxy
primer (BMS 10-79)F-
Astrocoat Type Ielastomeric
polyurethane
over epoxyprimer (8MS 10-79)
1
2
3
45
Average
Lo9 i1
2
3
4
5
Average
Log i
1
2
3
4
5
Average
Log i
1
23
4
5
AverageLog i
1
2
34
5
Average
Log i
1
23
4
5
Average
Log i
CURRENT, mA, AT TIME, min
1.660
0.617
0.251
0.646
0.794-3.100
0.398
0.427
0.955
0.363
0.490
0.527
-3.280
0.014
0.006
0.050
0.006
0.074
0.030
-4.52
4
1.700
0.617
0.550
0.646
0.878-3.060
0.437
0.468
0.955
0.4790.447
0.557
-3.250
0.013
0.008
0.O55
0.004
0.087
0.033
-4.48
1.740
0.759
0.708
0.759
0.992
-3.000
0.468
0.479
0.933
0.575
0.427
0.576
-3.240
0.020
0.009
0.062
0.006
0.091
0.038
-4.43
No corrosion current
No corrosion current
No corrosion current
8 10
1.740 1.740
0.759 0.759
0.759 0.759
0.794 1.050
1.010 1.080
-2.990 -2.970
0.525 0.4790.479 0.501
0,933 0.955
0,676 0.776
0.417 0.457
0.606 0.634
-3.220 -3.200
0.021 0.016
0.009 0.008
0.065 0.068
0.006 0.008
0.093 0.093
0.039 0.038
-4.41 -4.42
158
Table C.2. Potentiostat Test Data (Second Test)
COATING
Polyurethaneenamel (BMS 10-60)
over polysulfideprimer (PR 1432GP)
Polyurethanee-,= enamel (BMS 10-60)¢tl
o over epoxy primer
(BMS 10-791t-O
o
Corogard (EC-843)over epoxy primer
(BMS 10-79)
CAAPCO B.274
elastomeric
polyurethane
over epoxyprimer (BMS 10-79)
Chemglaze M313
elastomeric
_ polyurethaneover epoxy
primer (BMS 10-79)I-
Astrocoat Type Ielastomeric
polyurethane
over epoxyprimer (BMS 10-79)
FASTENER
12
3
4
5
Average
Log i
1
23
45
Average,
Log i
1
2
3
45
Average
Log i
1
2
3
4
5
Average
Log i
1
2
34
5
Average
Log i
12
3
4
5
Average
Log i
0
CURRENT, mA, AT TIME, min
4.303.30
2.30
4.00
1.60
3.10
-2.51
2.008.20
3.10
2.10
2.20
3.52
-2.45
0.22
0.15
0.100.10
0.06
0.13
-3.89
4.204.40
3.50
4.40
1.50
3.60
-2.44
2.209.60
3.30
2.50
2.30
3.98
-2.40
0.37
0.27
0.180.15
0.08
0.21
-3.68
6
4.804.50
3.60
4.50
3.104.10
-2.34
2.80
9.40
4.003.30
2.60
4.42
-2.35
0.84
0.67
0.46
0.260.12
0.47
-3.33
6.805.10
5.00
4.90
3.70
5.10
-2.29
3.109.60
4.70
6.10
4.50
5.60
-2.25
1.18
0.78
0.62
0.540.18
0.66
-3.18
Fastener 2 had slight corrosion current _ 0.3/JA
Slight corrosion current on fastener 2 _ 1 _uA
Slight corrosion current on fastener 2 _ 1/JA
10
7.605.00
5.204.40
4.30
5.30
-2.28
4.25
10.50
7.00
7.50
7.807.41
-2.13
1.20
0.950.65
0.77
0.22
0.76-3.12
159
Table C-2, Potentiostat Test Data (Third Test)
o
0o
COATING
Polyurethaneenamel (BMS 10-60)
over polysulfide
primer (PR 1432GP)
Polyurethaneenamel (BMS 10-60)
over epoxy primer
Corogard (EC-843)
over epoxy primer
(BMS 10-79)
CAAPCO B-274
elastomeric
polyurethane
over epoxyprimer (BMS 10-79)
Chemglaze M313I_ elastomeric
polyurethane
o over epoxyprimer (BMS 10-79)
Astrocoat Type Ielastomeric
polyurethane
over epoxyprimer (BMS 10-79)
FASTENER
1
23
4
5
Average
Log i
12
3
4
5Average
Log i
1
2
3
4
5
AverageLog i
1
2
3
4
5
AverageLog i
1
2
3
4
5
Average
Log i
1
23
4
5
Average
Log i
0.60
0,80
5.200.12
1.40
1.62
-2.79
2.20
3.008.20
4.50
°2.35
0.04
0.01
2.00
0.68
-3.17
CURRENT, mA, AT TIME, rain
9.00
4.80
5.601.00
2.40
4.56
-2.34
2.40
6.30
10.20
6.0014.40
7.86
-2.10
0.47
0.22
0.10
0.16
3.00
0.79-3.10
9.40
6.10
6.60
2.303.40
5,56
-2.25
2.40
8.00
12.00
6.5014.50
8.68
-2.06
0.87
0.44
0.12
0.27
3.80
1.10-2.96
9.00
7.40
6.803.50
4.00
6.14
-2.21
3.00
9.60
13.20
7.5016.60
9.98
-2.00
0.94
0.46
0.16
0.40
4.50
1.29-2,89
9.40
7.80
7.205.00
4,20
6.72
-2.17
3.609.60
14.40
8.20
18.5010.86
- 1.96
1.22
0.62
0.20
0.51
5.50
1.61-2.79
On fastener 2, a small current of 0.27/_A, otherwise, never
a positive current
Never a positive current
10
9.00
8.30
7.606.40
4.90
7.24
-2.14
3.80
10.00
16,40
8.70
19.8011.74
-1.93
1.56
0.6-/
0.25
0.56
5.60
1,73
-2.76
On fastener 2, a small current of 0.27 _A; otherwise, never
a positive current
160
Potentiostat
Working
Reference
Auxiliary
Recorder
0.5-in ID glass or plastic tube
electrode (cathode)
:.:.|
'--_mtanium fastener
Rubber gasket
Coating
Specimen(anode)
Figure C-3. Schematic Oiagram of Potentiostat Test Apparatus
1, Report No. ] 2. Government Accession No.
lNASA CR 165928
4. Title and Subtitle
Aircraft Surface Coatings
7. Author(el
Boeing Commercial Airplane Company (BCAC)Preliminary Design Department
9. Performing Organization Name and Address
Boeing Commercial Airplane CompanyP.O. Box 3707
Seattle, Washington 98124
12. Sponsoring Agency Name and Address
National Aeronautics and Space AdministrationWashington, D.C. 20546
3. Recipient's Catalog No.
5. Report Date
June 1982
6. Performin 9 Organization Code
8. Performing Organization Report No.
D6-49355
10. Work Unit No.
' 11. Contract or Grant No.
NAS1-15325
13. Type of Report and Period Covered
Contractor Report-FinalJanuary 1980-February 1982
14. Sponsoring Agency Code
15. Supplementary Notes
Technical Monitor: D. B. Middleton
NASA Langley Research Center
16. Abstract
Liquid, spray-on elastomeric polyurethanes were selected from previous work (reported in NASA CR158954 and CR 159288) as best candidates for aircraft external protective coatings. Flight tests wereconducted to measure drag effects of these coatings compared to paints and a bare metal surface. Thedurability of two elastomeric polyurethanes, CAAPCO B-274 and Chemglaze M313, was assessed inairline fligl_t service evaluations. Laboratory tests were performed to determine corrosion protectionproperties, compatibility with aircraft thermal anti-icing systems, the effect of coating thickness o11erosion durability, and the erosion characteristics of composite leading edges- bare and coated.
A cost and benefits assessment was made to determine the economic value of various coating config-urations to the airlines.