AIRFIELD PAVEMENT EVALUATION OF BOLIVIAN AIRFIELDS PREPARED FOR TACTICAL AIR COMMAND (TAC) BY HQ AFESC PAVEMENT EVALUATION TEAM CAPTAIN JAY GABRIELSON TSGT RALPH CROMPTON SSGT TODD BAUDER SSGT STEVEN HUDSON D T IC ASSISTED BY S ELECTE SMSGT DOUG THOMPSON NOV30 19m USSOUTHCOM/SCEN S B U HQ AIR FORCE ENGINEERING AND SERVICES CENTER TYNDALL AIR FORCE BASE FLORIDA 32403-6001 PUBLISHED NOVEMBER 1989 ApmvW O VON am
Transcript
AIRFIELD PAVEMENT EVALUATION
OF
BOLIVIAN AIRFIELDS
PREPARED FOR
TACTICAL AIR COMMAND (TAC)
BY
HQ AFESC PAVEMENT EVALUATION TEAM
CAPTAIN JAY GABRIELSONTSGT RALPH CROMPTONSSGT TODD BAUDER
SSGT STEVEN HUDSON D T ICASSISTED BY S ELECTE
SMSGT DOUG THOMPSON NOV30 19mUSSOUTHCOM/SCEN S B U
HQ AIR FORCE ENGINEERING AND SERVICES CENTERTYNDALL AIR FORCE BASE
APPENDIX E - SUMMARY OF PHYSICAL PROPERTY DATA .......... E-1
APPENDIX F -ALLOWABLE GROSS LOADS ...................... F-1
APPENDIX G -RELATED INFORMATION ........................ G-1
6- n n I
AvHlai~dl lty god"lAU 11 ,m or
Dlo sp,,l-,ii
Si
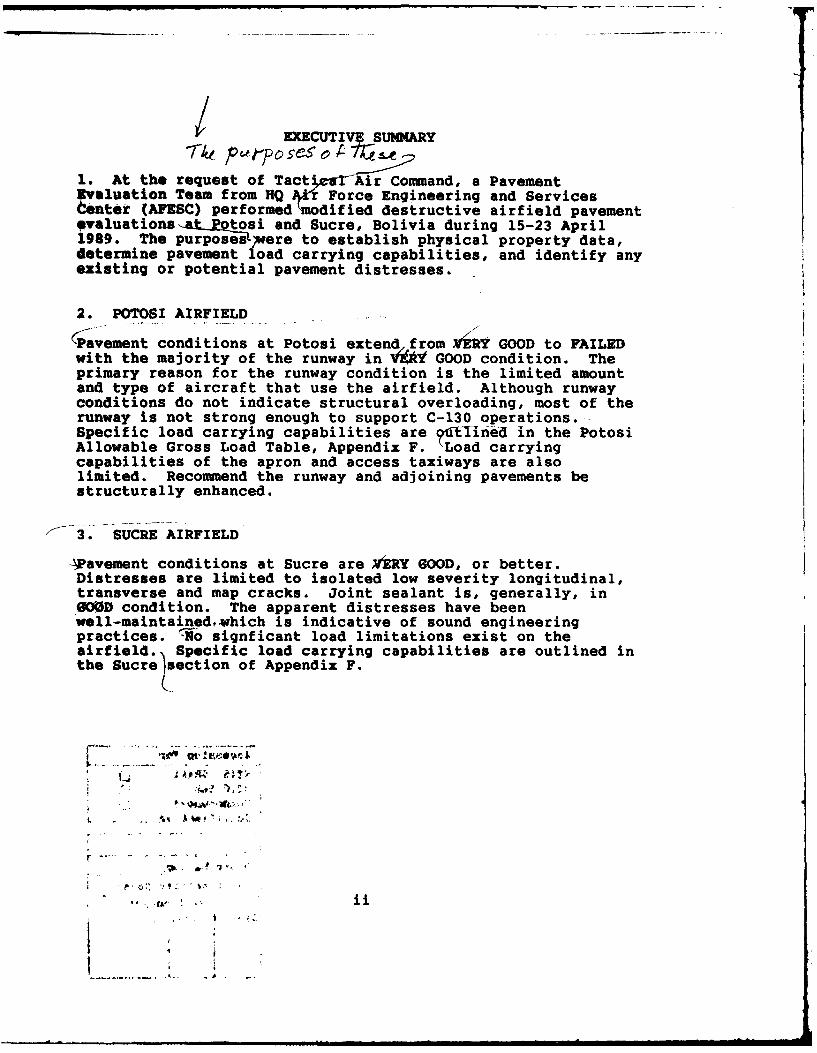
EXECUTIVE SUMMARY
1. At the request of Tactle TAir Command, a PavementEvaluation Team from HQ 4 Force Engineering and Servicestenter (AFESC) performed'modified destructive airfield pavementovaluations at-IQtosi and Sucre, Bolivia during 15-23 April1989. The purposesL were to establish physical property data,determine pavement load carrying capabilities, and identify anyexisting or potential pavement distresses.
2. POTOSI AIRFIELD
(Pavement conditions at Potosi extend from GOOD to FAILEDwith the majority of the runway in i GOOD condition. Theprimary reason for the runway condition is the limited amountand type of aircraft that use the airfield. Although runwayconditions do not indicate structural overloading, most of therunway is not strong enough to support C-130 operations.Specific load carrying capabilities are 5nThfined in the PotosiAllowable Gross Load Table, Appendix F. 'Load carryingcapabilities of the apron and access taxiways are alsolimited. Recommend the runway and adjoining pavements bestructurally enhanced.
'-3. SUCRE AIRFIELD
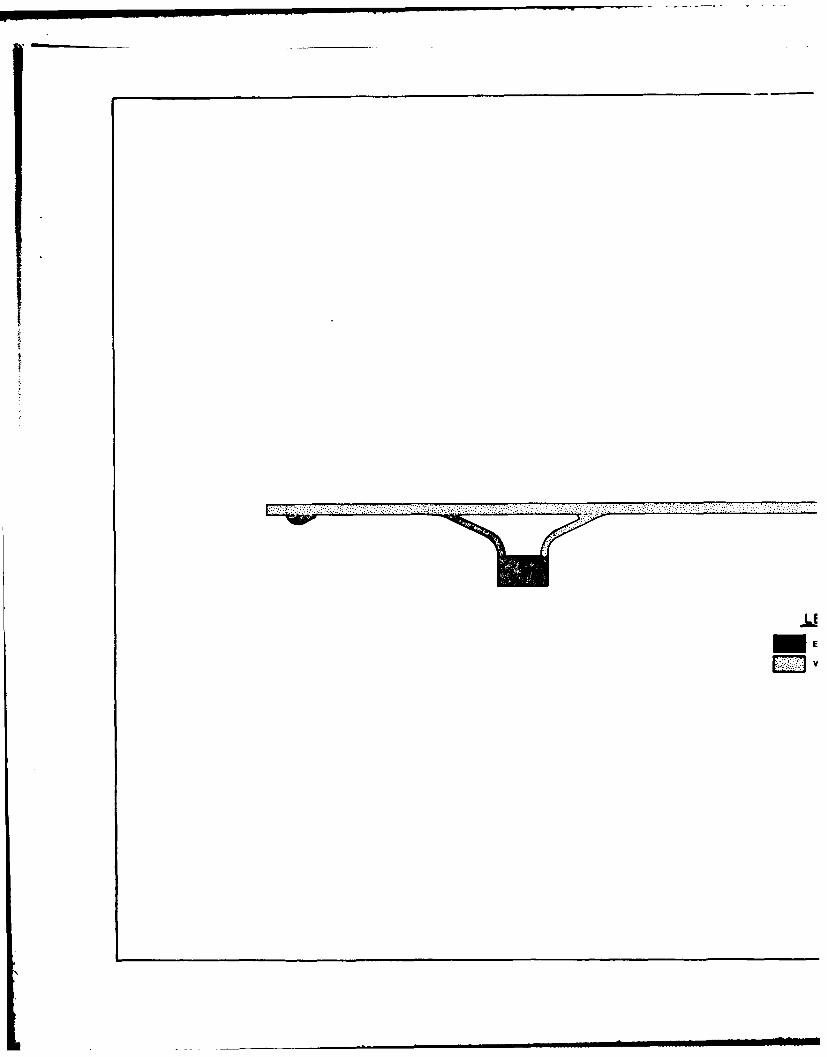
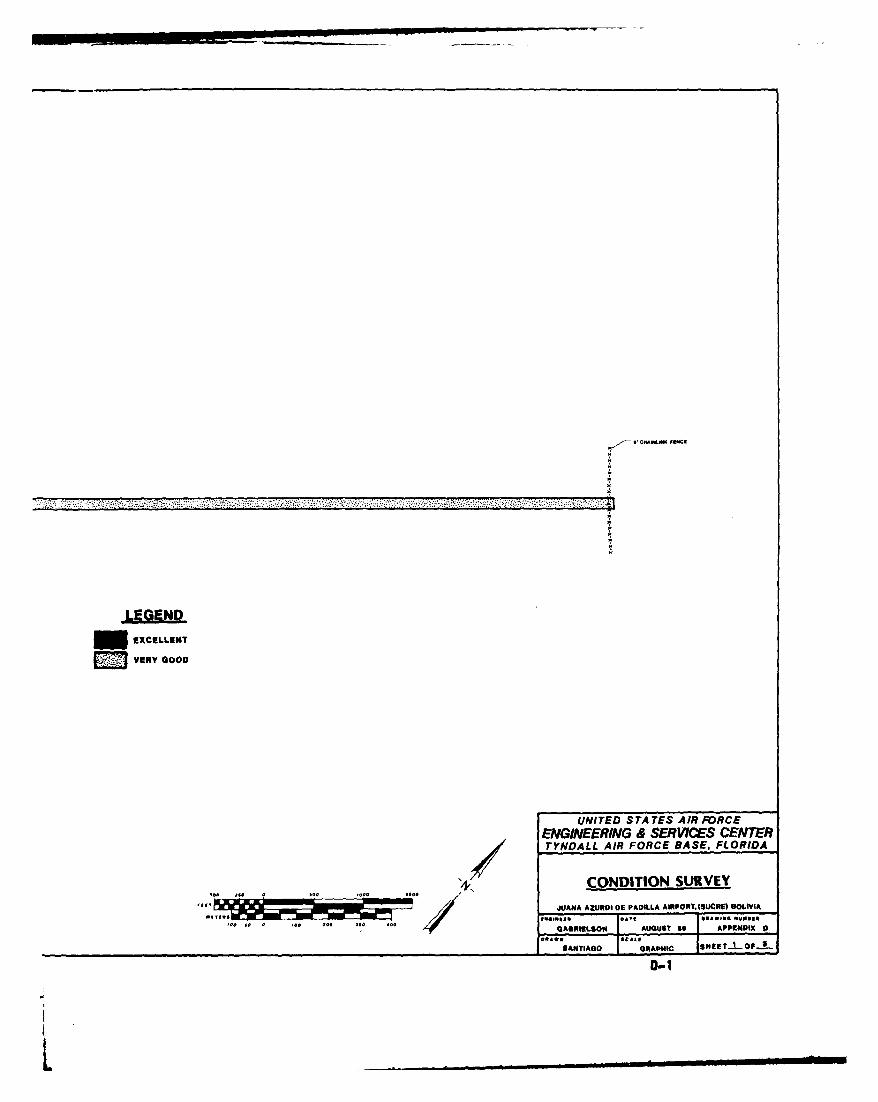
-Wavement conditions at Sucre are ERY GOOD, or better.Distresses are limited to isolated low severity longitudinal,transverse and map cracks. Joint sealant is, generally, in0GMD condition. The apparent distresses have beenwell-maintainedwhich is indicative of sound engineeringpractices. -10 signficant load limitations exist on theairfield. Specific load carrying capabilities are outlined inthe Sucre)section of Appendix F.
6., - .
L..."
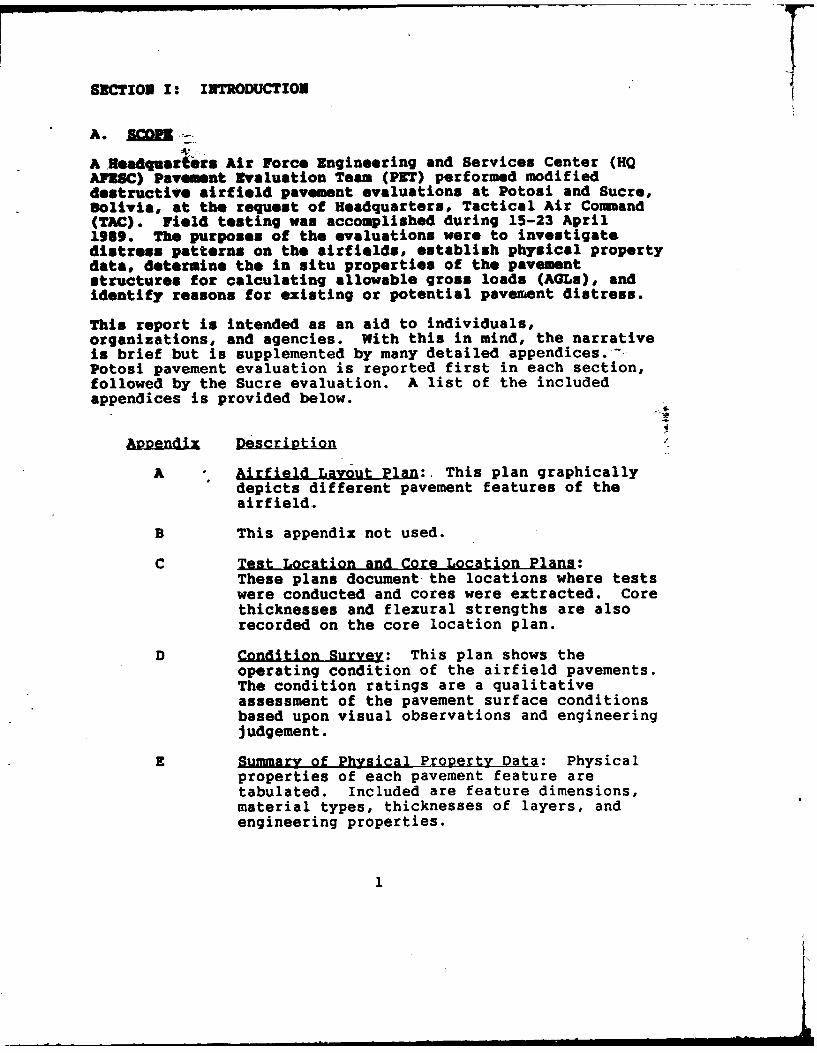
SECTION I: INTRODUCTION
A. ....
A.HeaquArter Air Force Engineering and Services Center (HQAFZSC) Pavement Evaluation Team (PET) performed modifieddestructive airfield pavement evaluations at Potosi and Sucre,Bolivia, at the request of Headquarters, Tactical Air Command(TAC). Field testing was accomplished during 15-23 April1989. The purposes of the evaluations were to investigatedistress patterns on the airfields, establish physical propertydata, determine the in situ properties of the pavementstructures for calculating allowable gross loads (AGLa), andidentify reasons for existing or potential pavement distress.
This report is intended as an aid to individuals,organizations, and agencies. With this in mind, the narrativeis brief but is supplemented by many detailed appendices. -
Potosi pavement evaluation is reported first in each section,followed by the Sucre evaluation. A list of the includedappendices is provided below.
Appendix Decitin
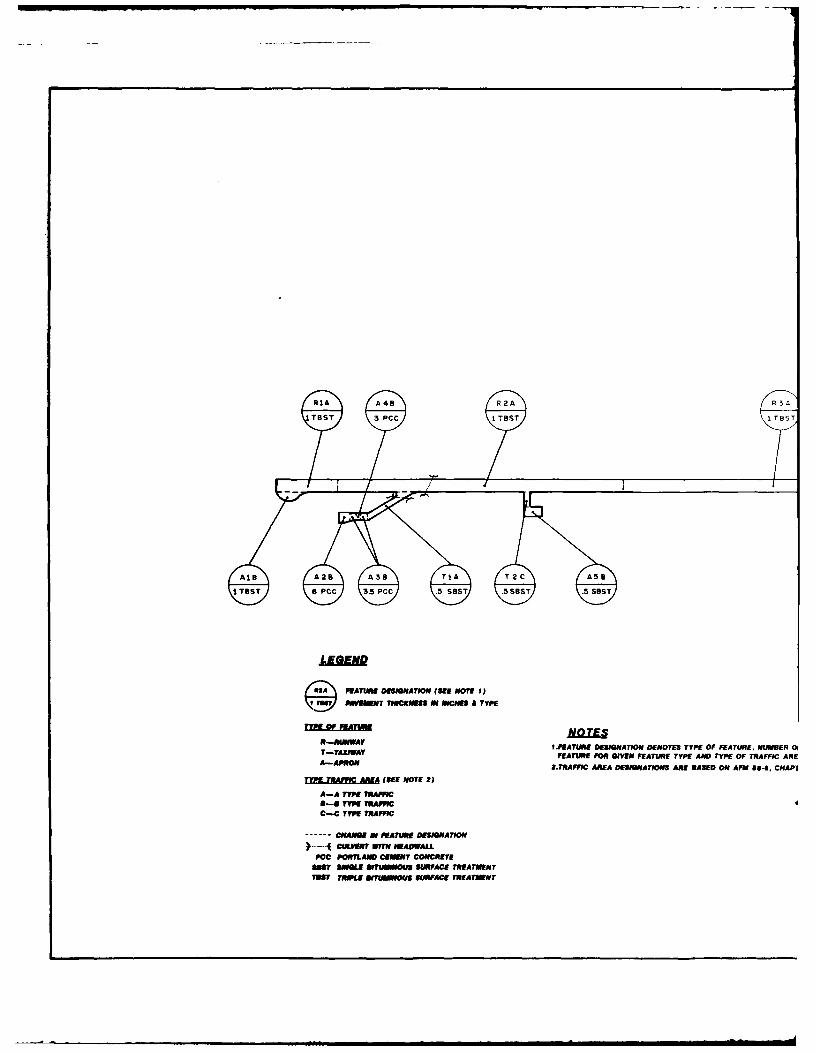
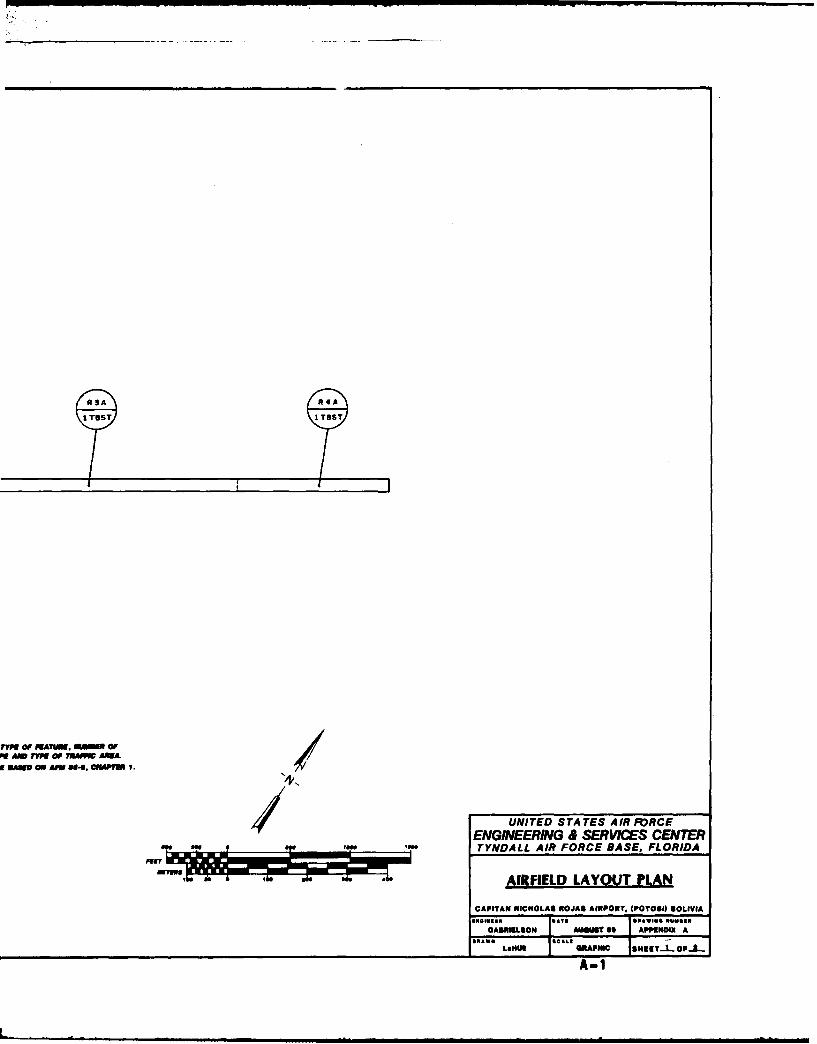
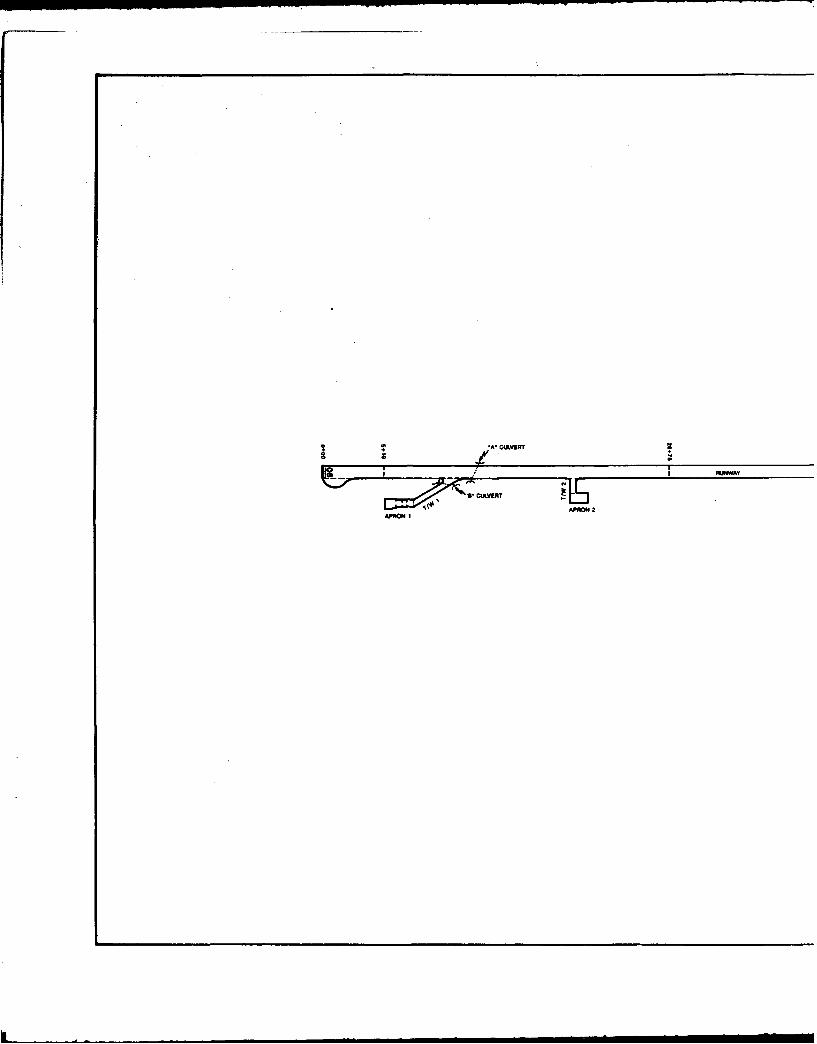
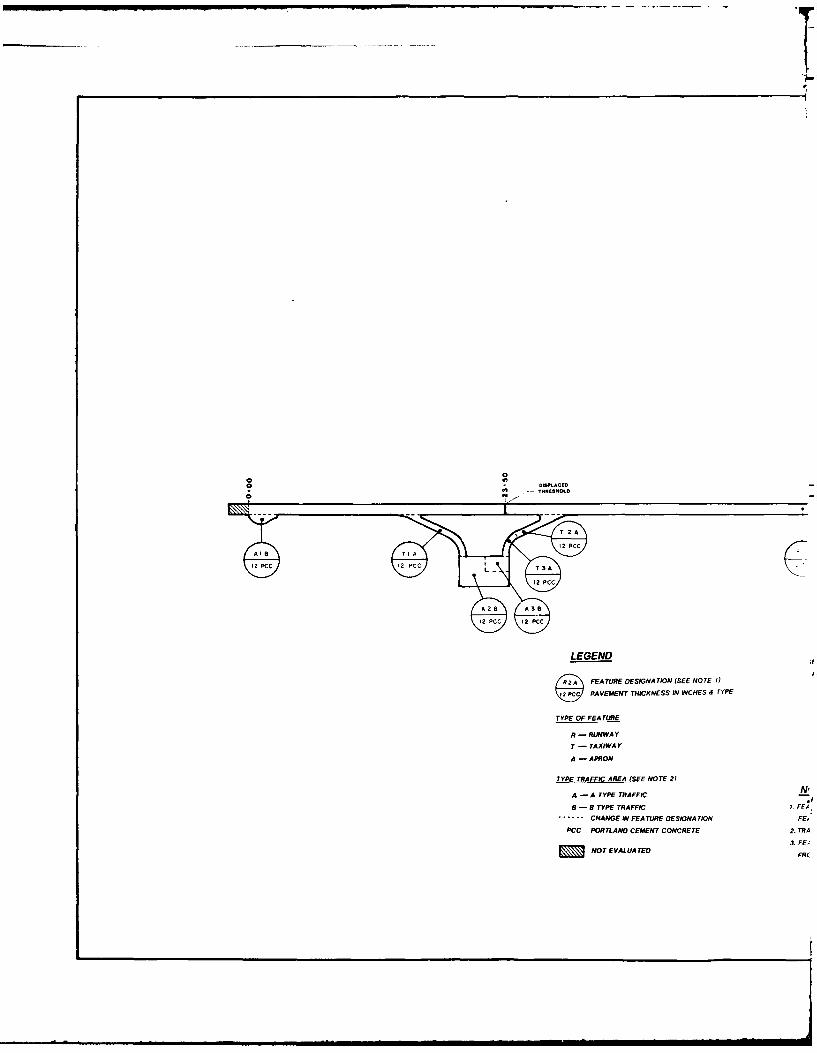
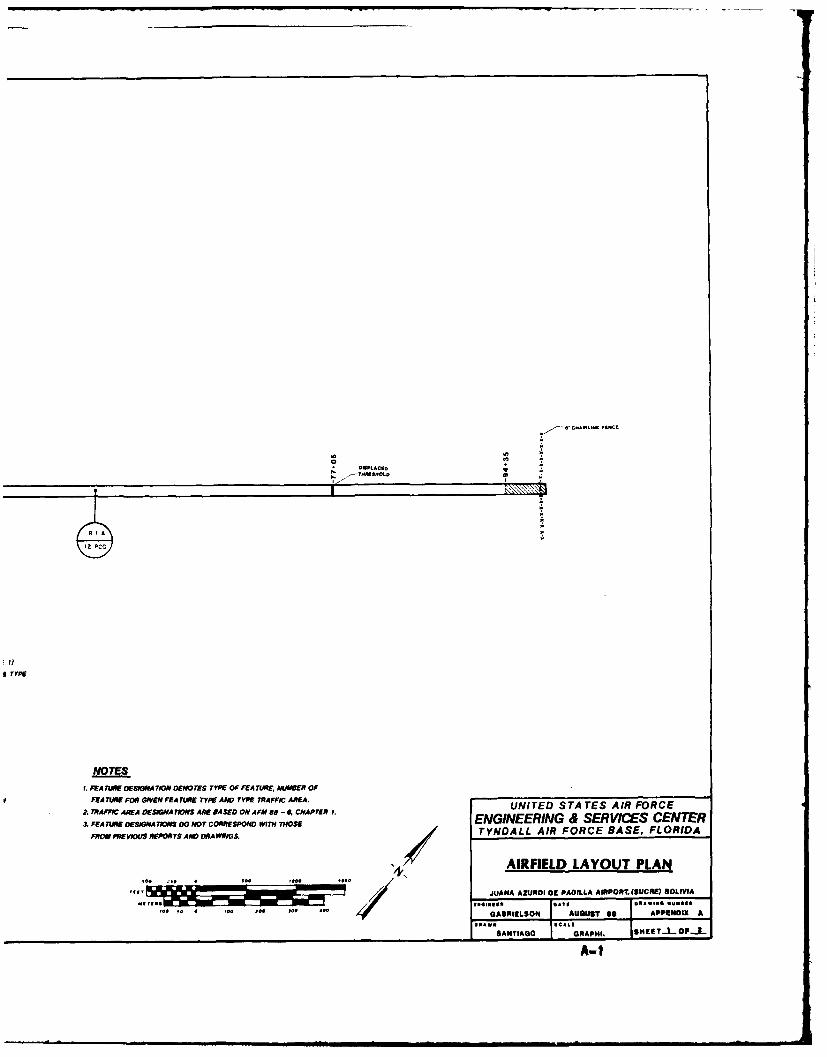
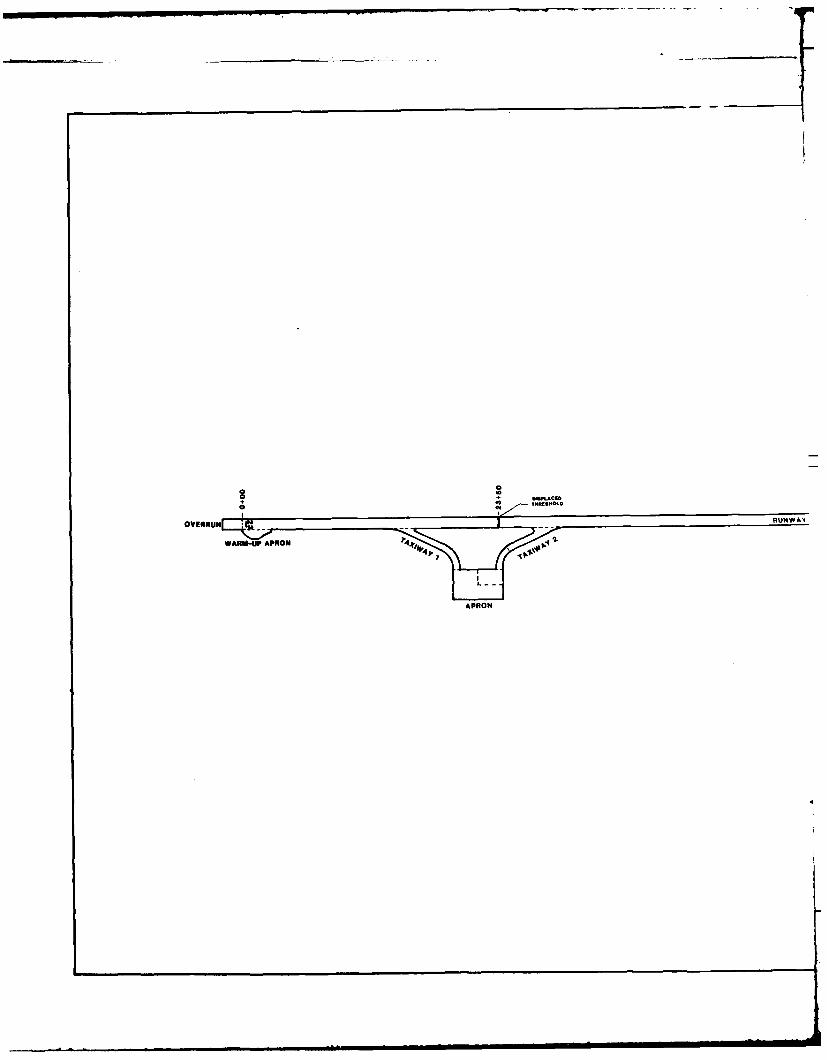
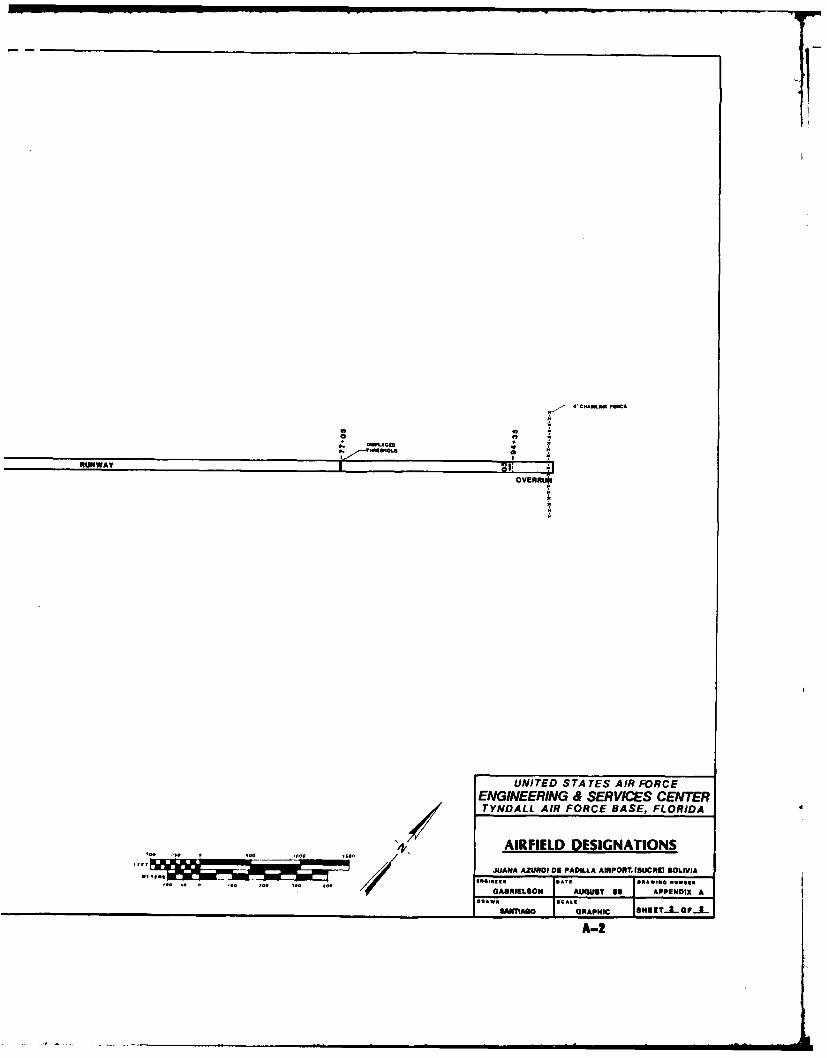
A Airfield Layout Plan:. This plan graphicallydepicts different pavement features of theairfield.
B This appendix not used.
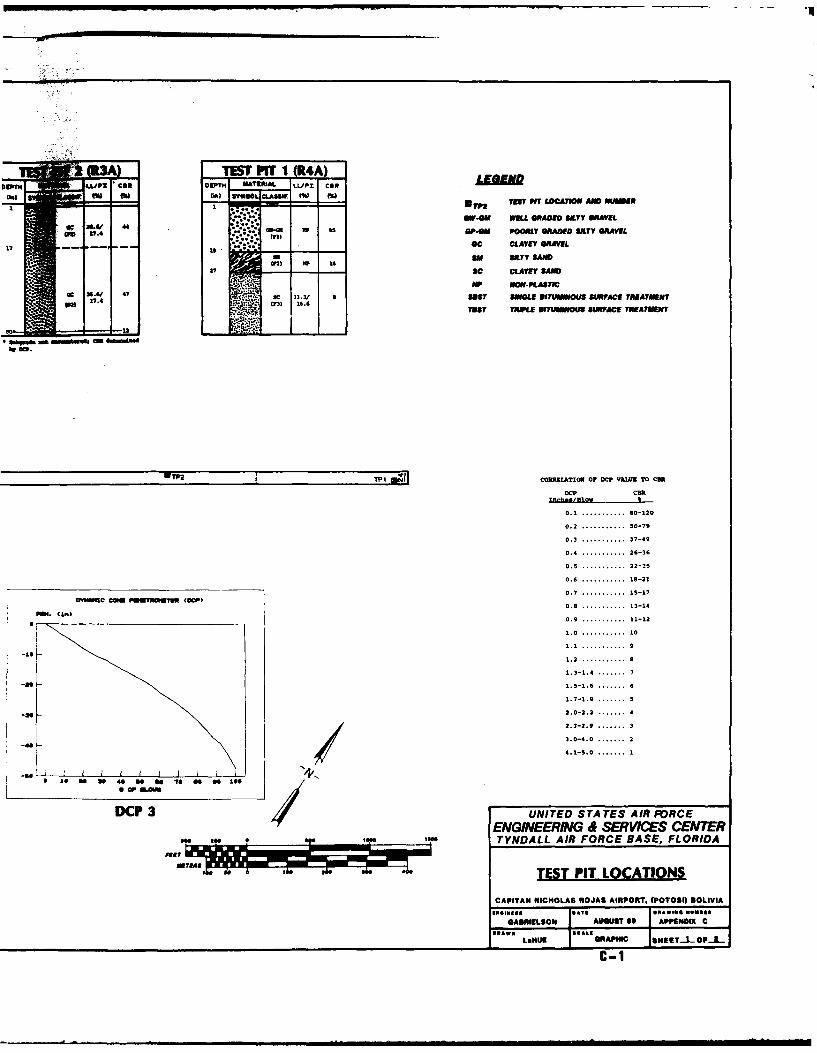
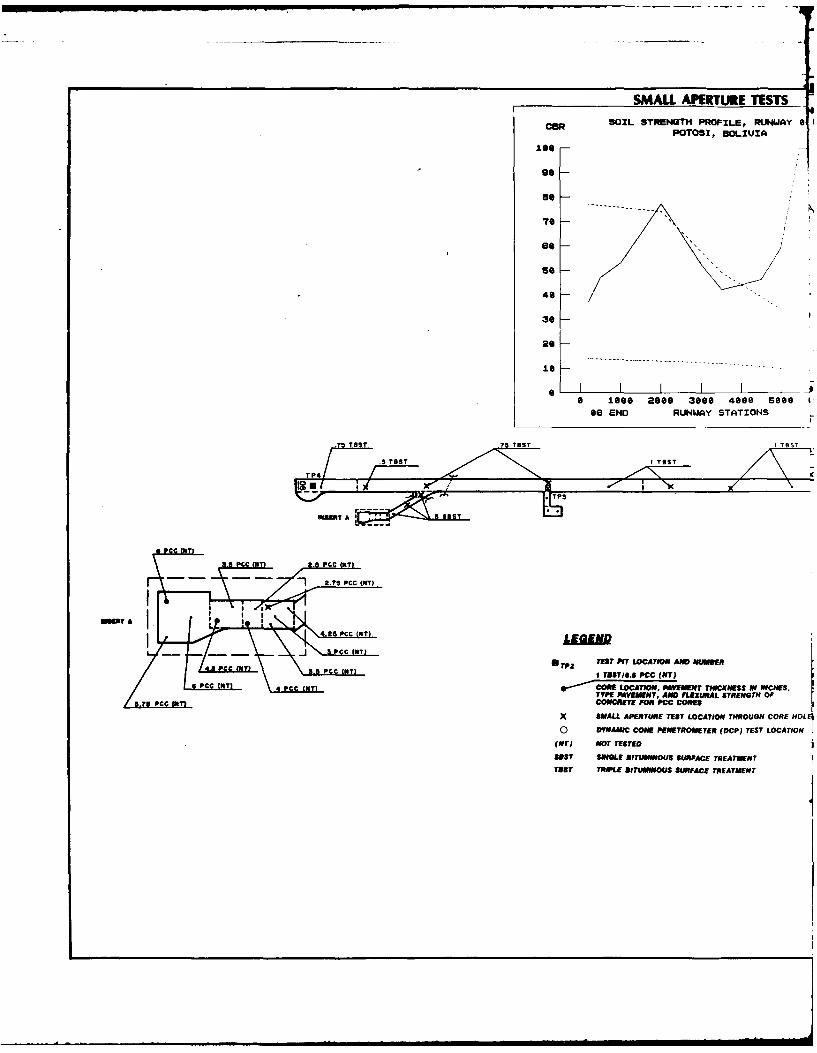
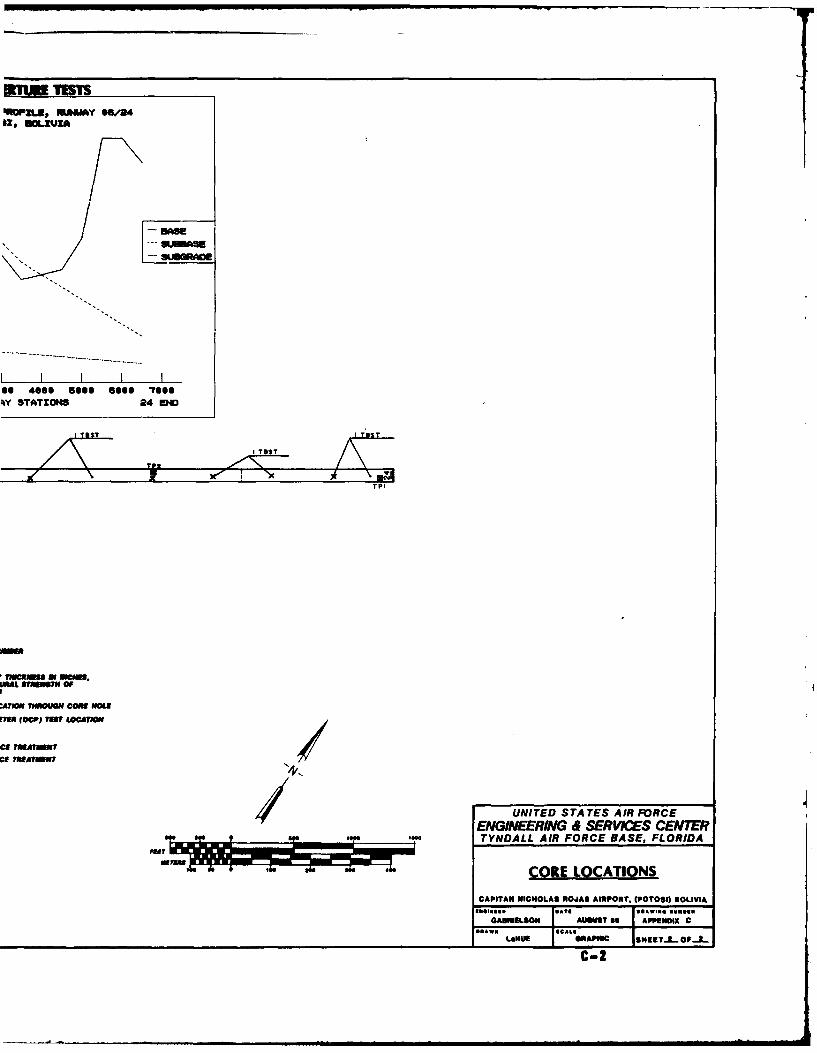
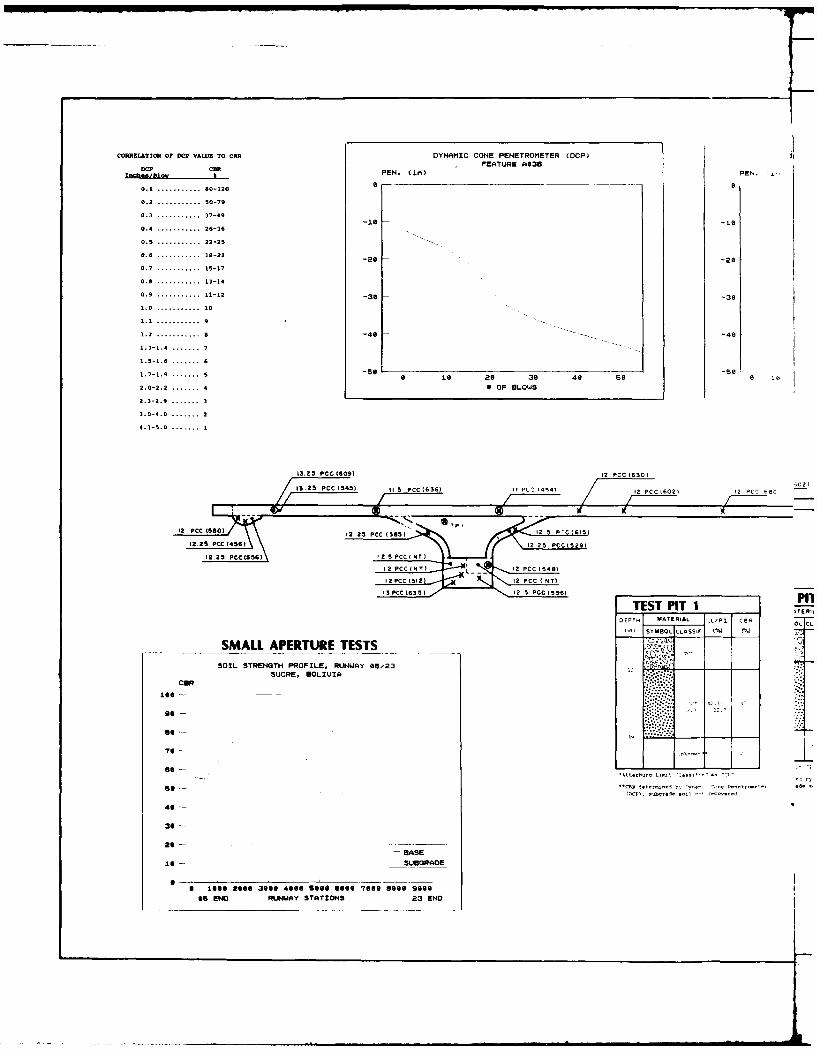
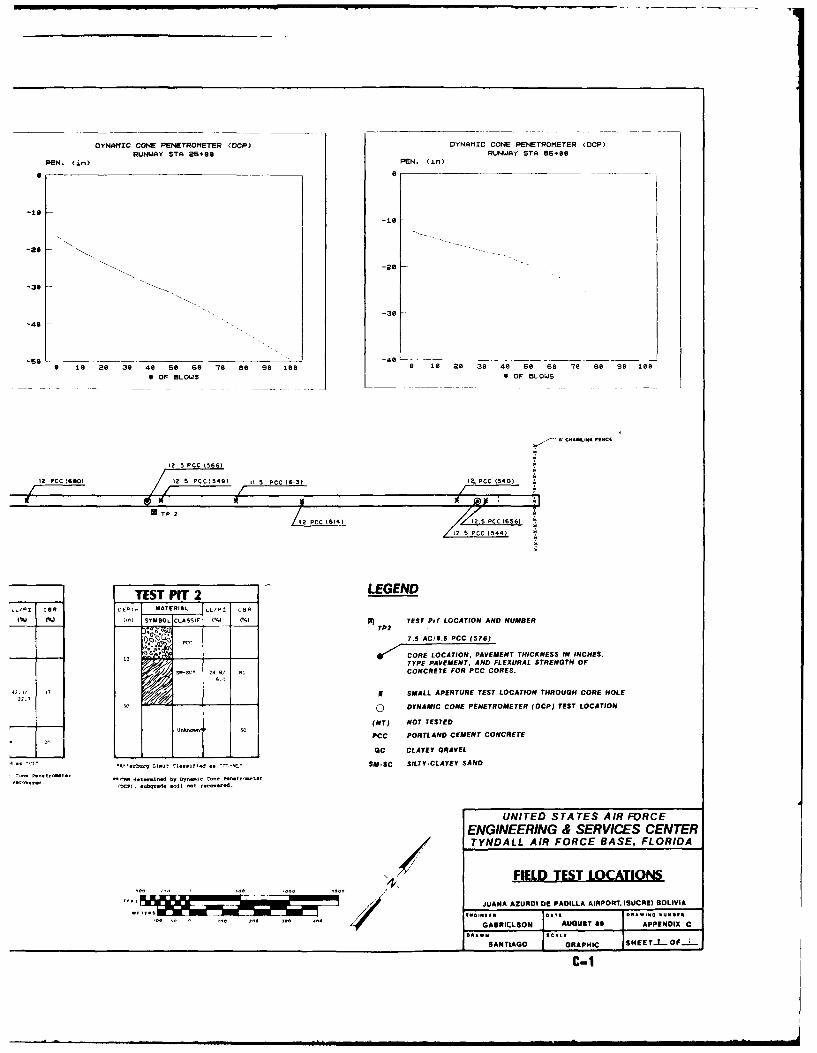
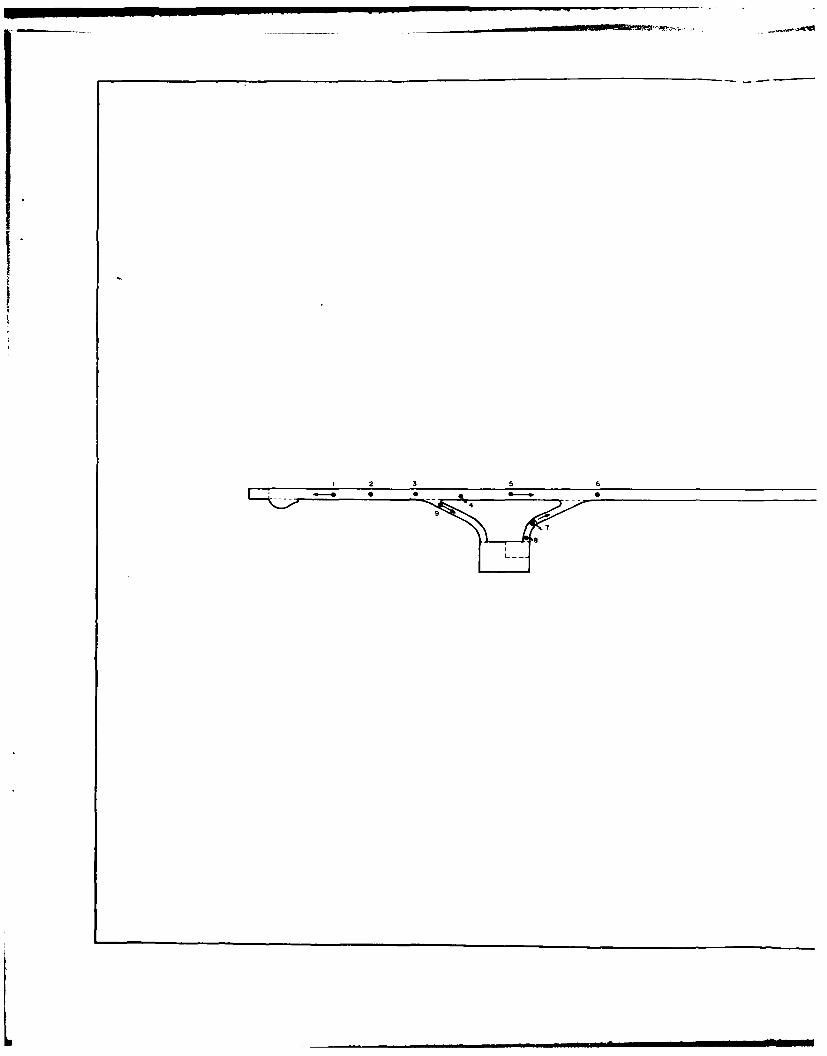
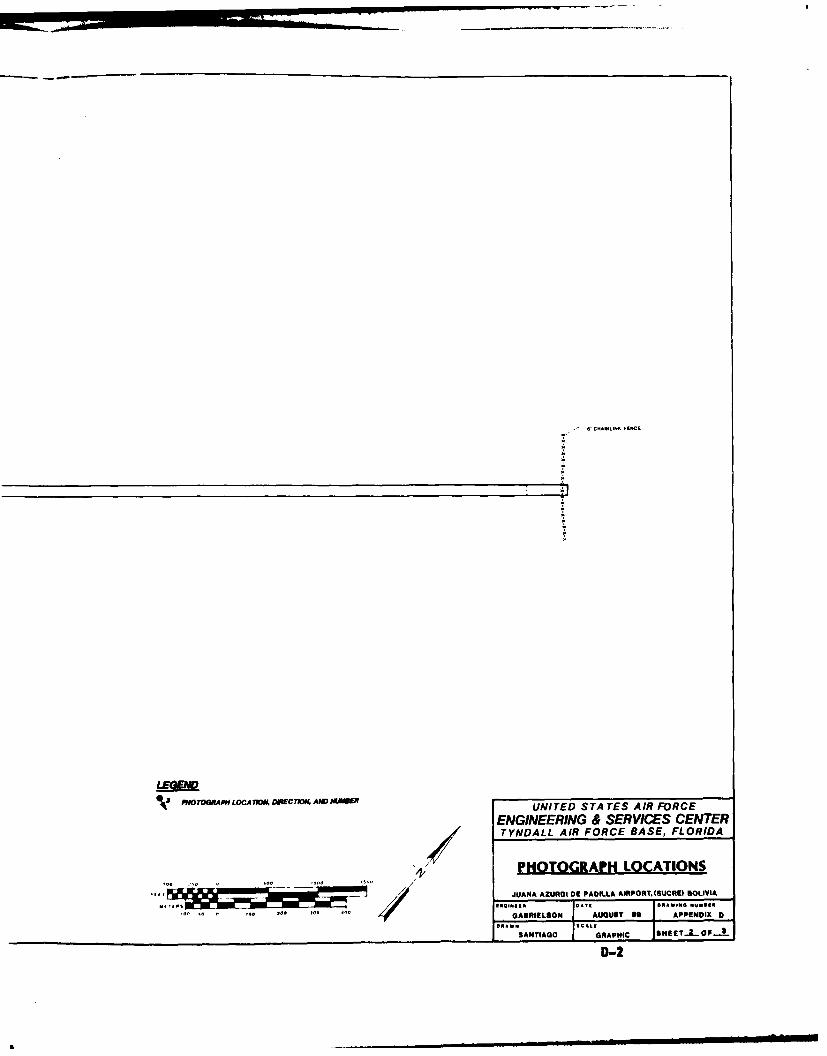
C Test Location and Core Location Plans:These plans document the locations where testswere conducted and cores were extracted. Corethicknesses and flexural strengths are alsorecorded on the core location plan.
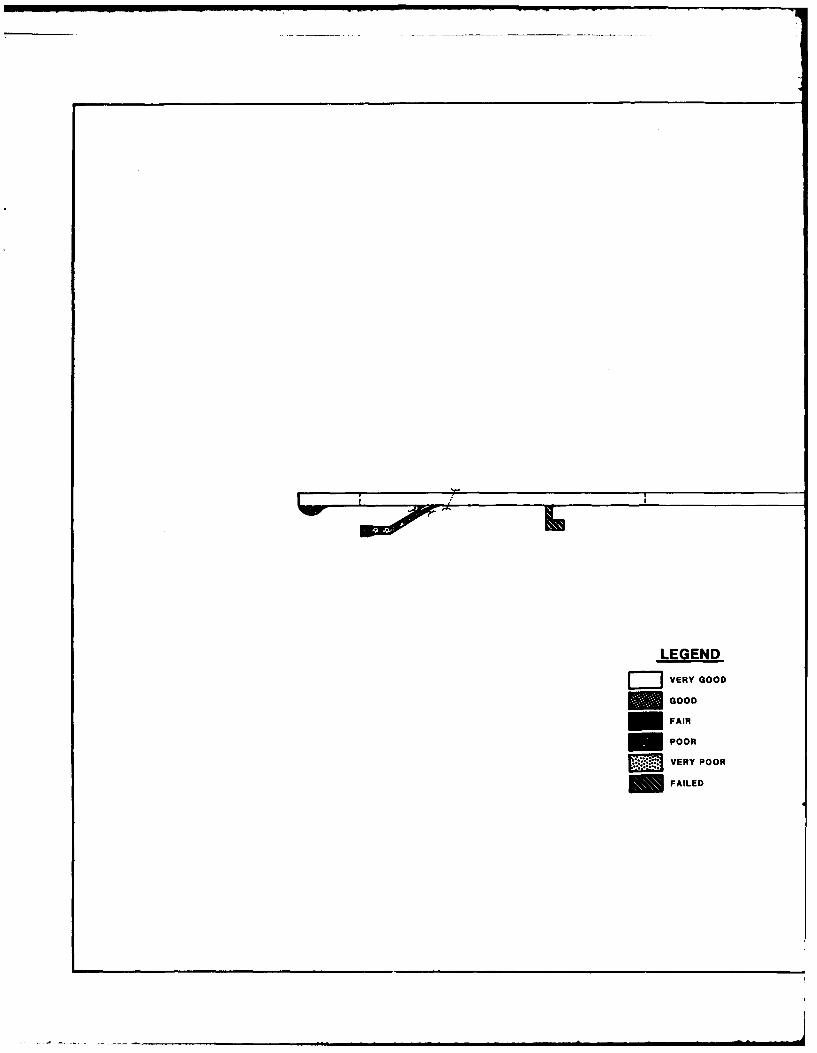
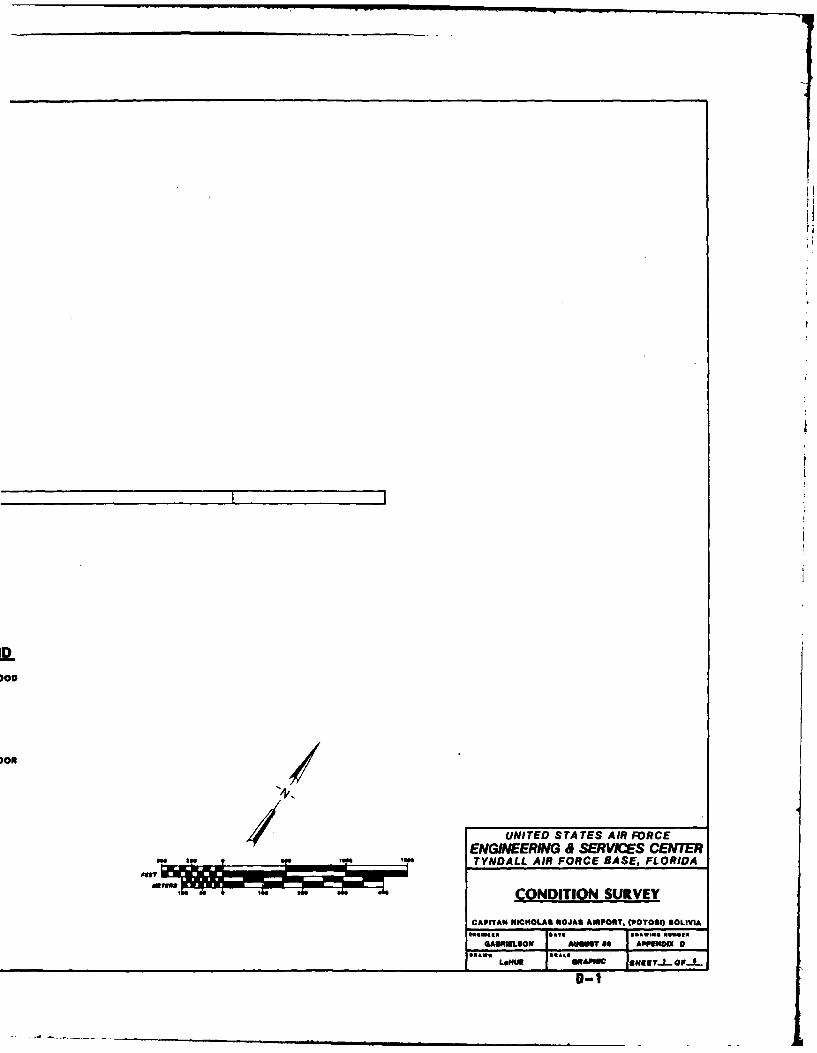
D Condition Survey: This plan shows theoperating condition of the airfield pavements.The condition ratings are a qualitativeassessment of the pavement surface conditionsbased upon visual observations and engineeringjudgement.
E Summary of Physical Property Data: Physicalproperties of each pavement feature aretabulated. Included are feature dimensions,material types, thicknesses of layers, andengineering properties.
11
F Allowable Gross Loads (AGLs): A listing of theallowable magnitude of loads at four passintensity levels for each aircraft group.
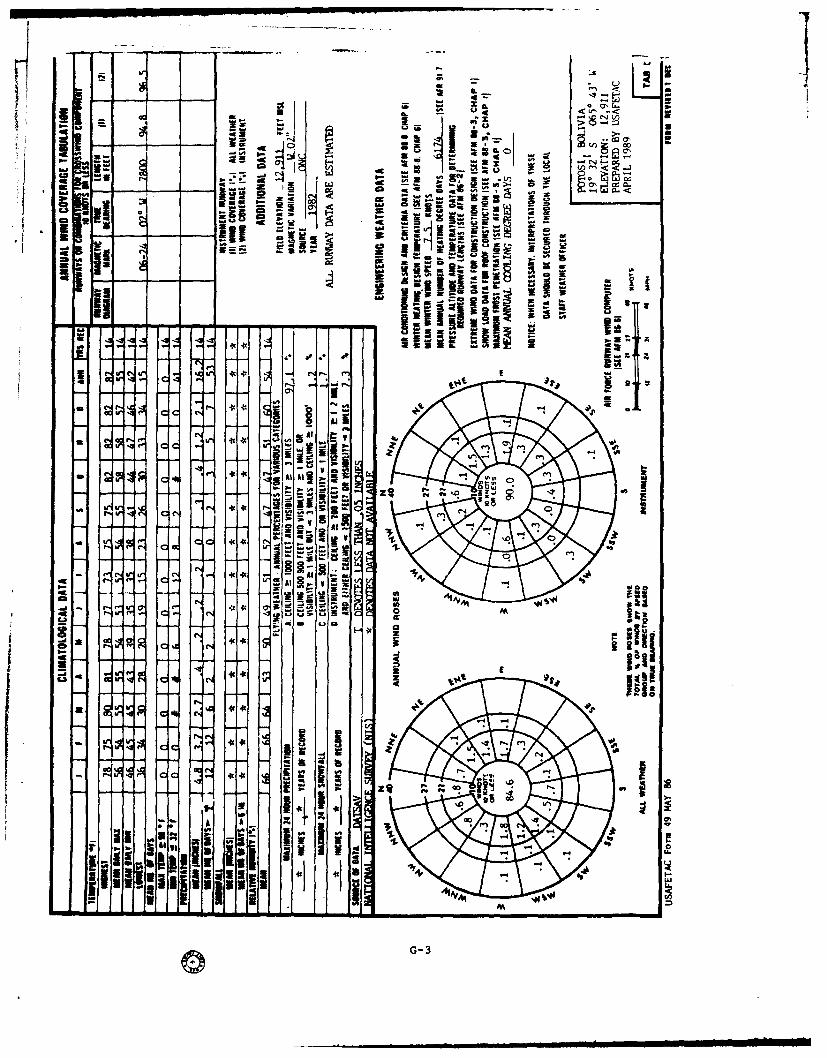
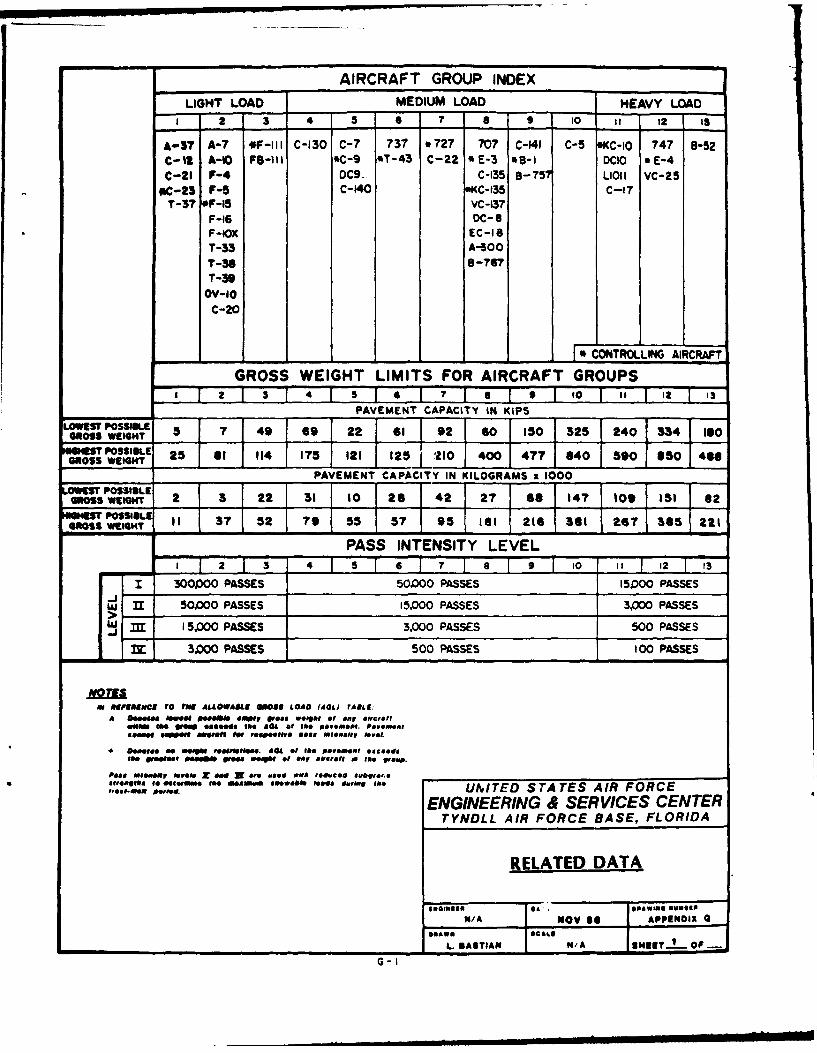
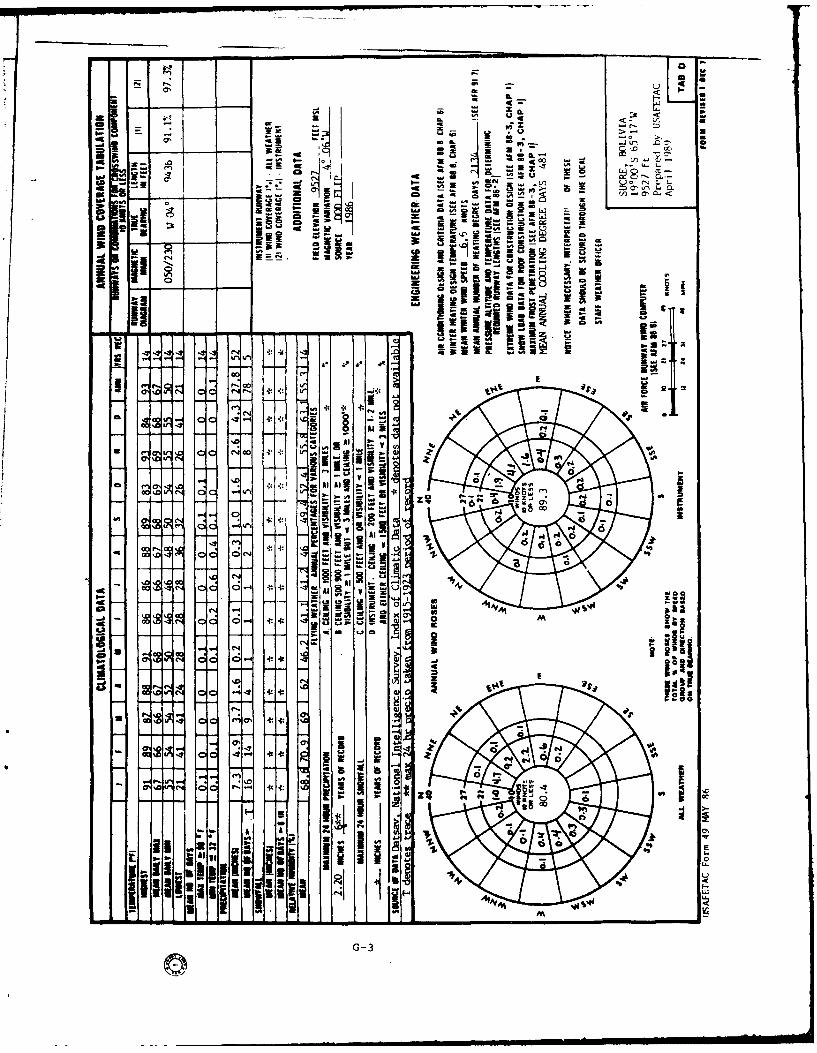
G Related Information: Included in this areAircraft Group Indices, Gross Weight Limits forAircraft Groups, Pass Intensity Levels,Climatological Chart, and ClimatologicalNarrative.
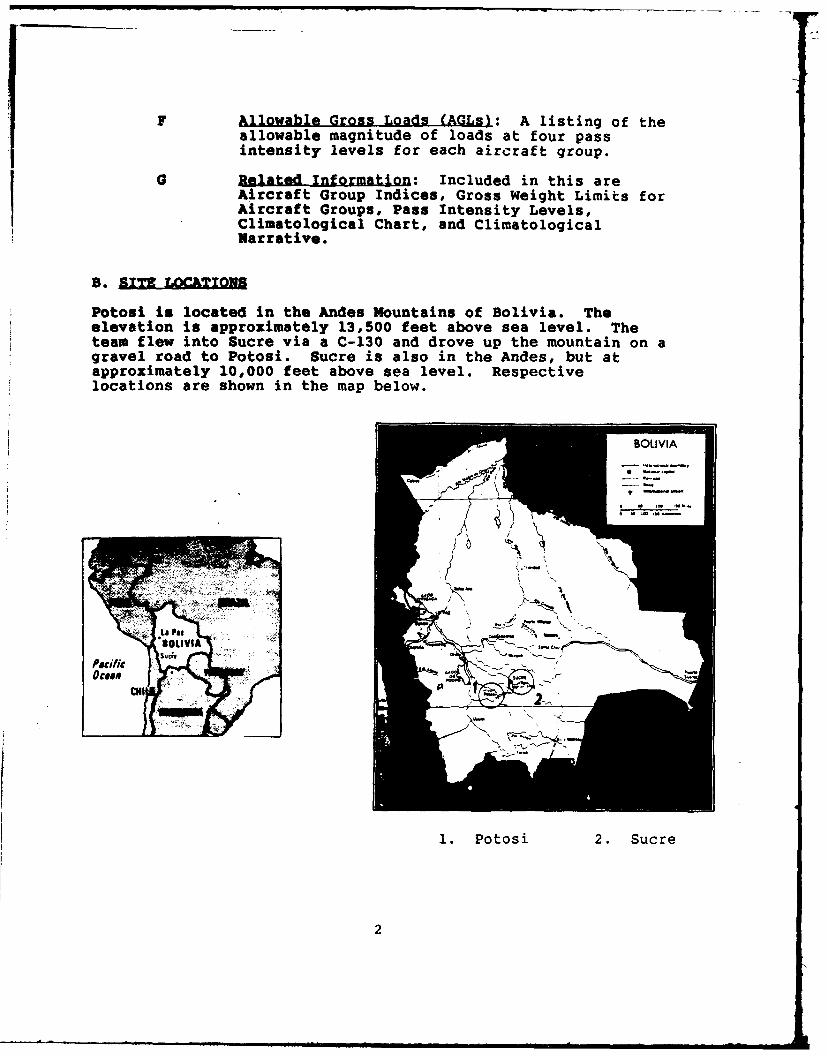
B. SITE LOCATIONS
Potosi is located in the Andes Mountains of Bolivia. Theelevation is approximately 13,500 feet above sea level. Theteam flew into Sucre via a C-130 and drove up the mountain on agravel road to Potosi. Sucre is also in the Andes, but atapproximately 10,000 feet above sea level. Respectivelocations are shown in the map below.
1. Poat .Sur
2
SECTION I I. EVALUATION PROCEDURES
A. FIELD TESTING
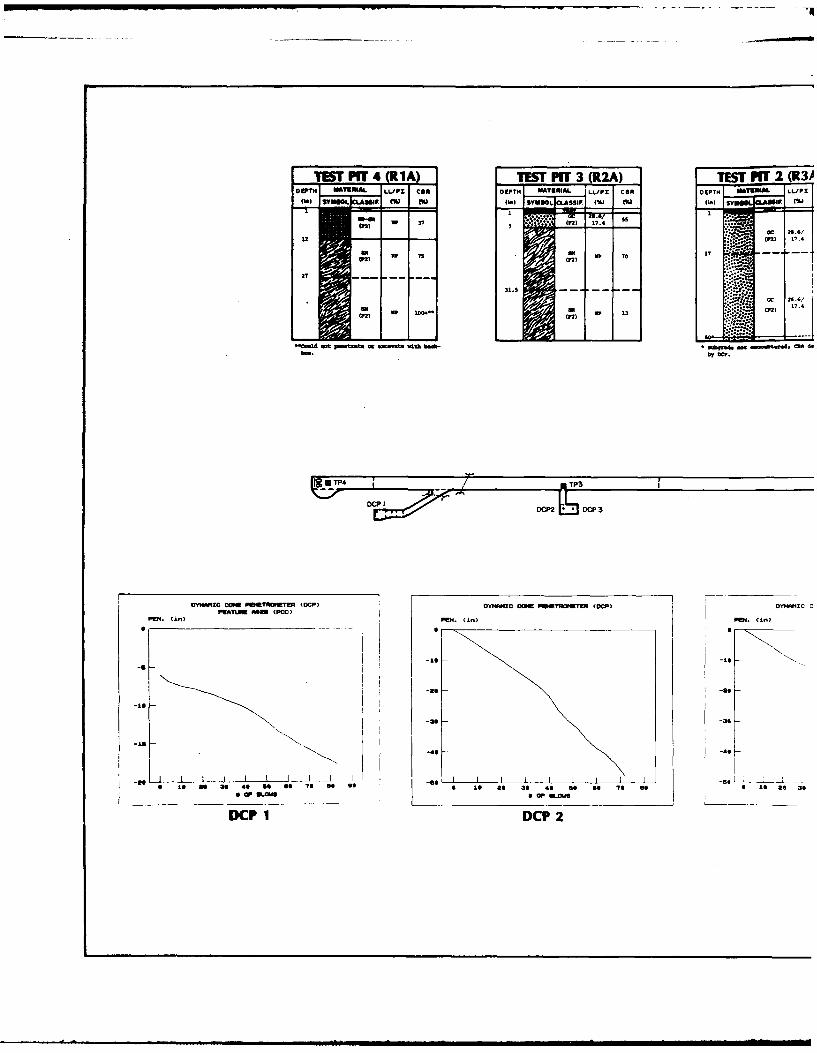
Potosi airfield pavement testing included California BearingRatio (CDR) tests, Small Aperture Tests (SAT) and Dynamic ConePenetrometer (DCP) tests. The DCP measures penetrationresistance of the subsurface soils. The resistance values werethen correlated to corresponding CBRs used for design andevaluation of flexible pavements. Original testing at Potosiwas to be limited to SAT and various penetration tests, but thematerial was such that four (4) test pits were excavated on therunway.
Pavement testing at Sucre Airfield was done by extractingpavement cores and conducting SAT and DCP tests in the pavementcore holes. Sucre airfield pavements are Portland cementconcrete (PCC), hence all CBRs were correlated to moduli ofsubgrade reaction (k-values) used in design and evaluation ofrigid pavements.
Field testing also included pavement core and soil sampling.The cores were used to verify pavement thicknesses andconstruction, as well as to help determine pavement strengthcharacteristics and life expectancy. Test and core locationsare shown in Appendix C.
B. CONDITION RATINGS
Pavement condition definitions range from EXCELLENT (like new)to FAILED (unsafe for aircraft traffic). Condition ratings area qualitative assessment of the pavement surface and should notbe confused with the structural capacity of a pavement. Forexample, a pavement surface may rate EXCELLENT, but haveunderlying pavement or soil conditions that could result inpavement failure under the applied load of a given aircraft.On the other hand, a pavement may be structurally sound but thesurface condition may be hazardous for aircraft traffic.
3
C. LABORATORY TESTING
Pavement core samples were returned to Tyndall AFB forlaboratory testing. PCC cores were tested for strength bytensile splitting in accordance with ASTN's "Standard TestMethods." The six-inch diameter core tensile splittingstrengths were then converted to flexural strengths by using anempirical relationship (Ref 4). Flexural strengths arereported on the "Core Location Plan" (Appendix C) and inAppendix Z. PCC cores taken at Potosi were below the minimumlength for testing. Flexural strengths for these features wereestimated from design and construction drawings.
D. MATERIAL PROPERTIES
The load-carrying capacities of the pavements reported hereinare based on material properties representative of the in-placeconditions at the time this field investigation was conducted.Exact agreement between behavior of the facilities as shown bythis evaluation and that which may actually occur under trafficcannot be expected, primarily because of the difficulties ofdetermining the exact traffic that produces the behavior, andalso because material properties change due to environmentalfactors such as precipitation, freeze-thaw cycles, and age.These changes must be considered in future planning, especiallywhere a change in mission will result in an increase inaircraft loads and/or aircraft traffic volume.
E. CLIMATIC DATA
Appendix G provides a summary of climatic data for bothairfields.
4
SECTION III: METHODOLOGY OF ANALYSIS
A. PHYSICAL PROPERTY DATA
The parameters used for this evaluation are summarized inAppendix E. The data presented were selected as the mostrepresentative strength values for each feature. Strength offlexible pavements (asphaltic concrete, AC) are based on thethe conventional CBR method of design and evaluation. Eachunique soil layer was tested to determine the CBR of thelayer. CBRs were also measured on the rigid pavement (Portlandcement concrete, PCC) supporting soils, and then correlated tomoduli of subgrade reaction, or k-value. Rigid pavements werethen evaluated based on the Westergaard theory of design andevaluation.
B. DETERMINATION OF ALLOWABLE GROSS LOADS
The AGLs were determined by a computer program based onprocedures in AFN 88-24 and AFR 93-5. The AGL for a featurewas reduced 25 percent if the condition rating for the featurewas POOR or worse. Appendix E outlines the engineeringproperties used to calculate the AGLs.
Failure criteria used in the allowable load analysis isdifferent for rigid and flexible pavements. Rigid (andcomposite) pavement failure criteria is partly based on alimiting tensile stress of the concrete. Conversely,compressive subgrade strain is one failure parameter used inthe AGL calculation of flexible pavement systems.
C. EXAMPLE PROBLEM
The following example (employing data from this report)illustrates how to use the allowable gross load information.
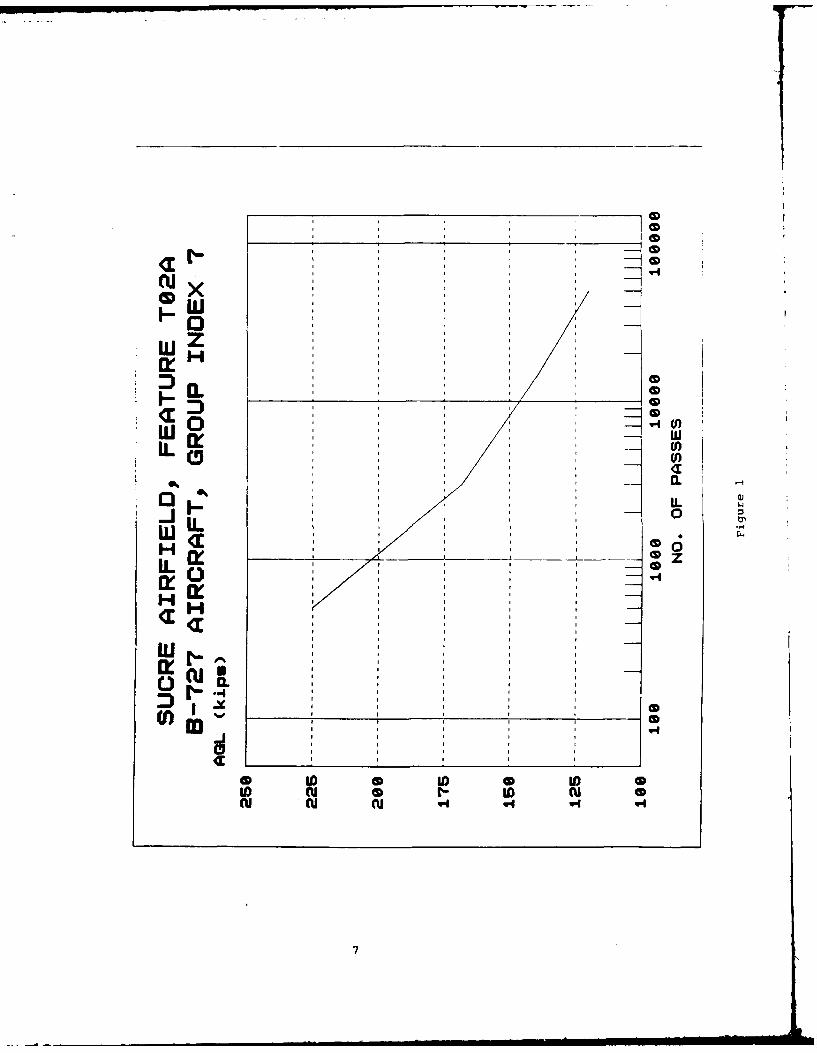
Problem: The Bolivian government wants to traffic a 150-kip(1 kip = 1000 pounds) 727 on Feature T02A of the Sucreairfield. How many passes can they expect to make before thepavement fails?
Solution: From Appendix F, the Allowable Gross Loads for a 727at Pass Intensity Levels I-IV (50,000, 15,000, 3,000, and 500)are 120, 139, 168, and + (pavement can support greater thanmaximum aircraft weight) kips, respectively. The weights andpasses are plotted on semi-log paper as shown in Figure 1. Thecompleted graph indicates a 150-kip 727 can make approximately8,800 passes on Feature T02A before the pavement fails.
5
QJ
-aI
i0
I F L... 0
ILD
Aj CL
mJ
I fu
HHcu f
D. PAVZMIT CLASSIFICATION NUMBER
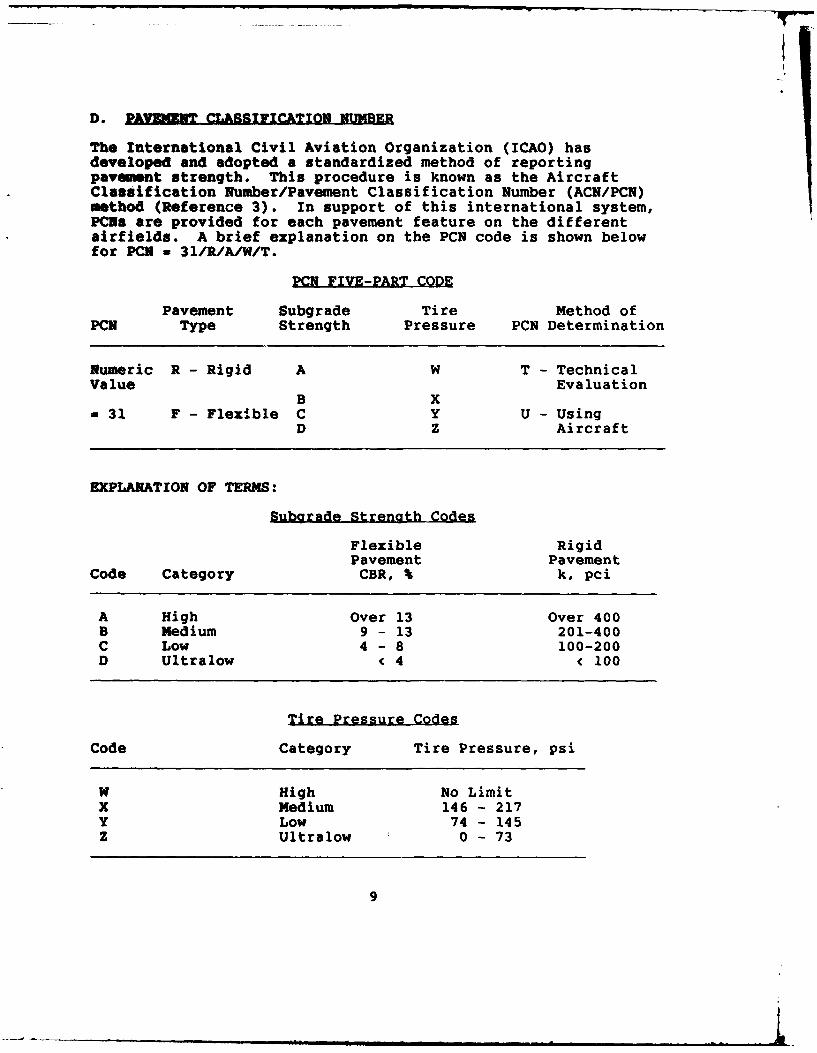
The International Civil Aviation Organization (ICAO) hasdeveloped and adopted a standardized method of reportingpaveimnt strength. This procedure is known as the AircraftClassification Number/Pavement Classification Number (ACN/PCN)method (Reference 3). In support of this international system,PCNs are provided for each pavement feature on the differentairfields. A brief explanation on the PCN code is shown belowfor PCN - 31/R/A/W/T.
PCH FIVE-PART CODE
Pavement Subgrade Tire Method ofPCN Type Strength Pressure PCN Determination
Numeric R - Rigid A W T - TechnicalValue Evaluation
B X-31 F - Flexible C Y U - Using
D Z Aircraft
EXPLANATION OF TERMS:
Subgrade Strength Codes
Flexible RigidPavement Pavement
Code Category CBR, % k, pci
A High Over 13 Over 400B Medium 9 - 13 201-400C Low 4 - 8 100-200D Ultralow < 4 < 100
Tire Pressure Codes
Code Category Tire Pressure, psi
W High No LimitX Medium 146 - 217Y Low 74 - 145Z Ultralow 0 - 73
9
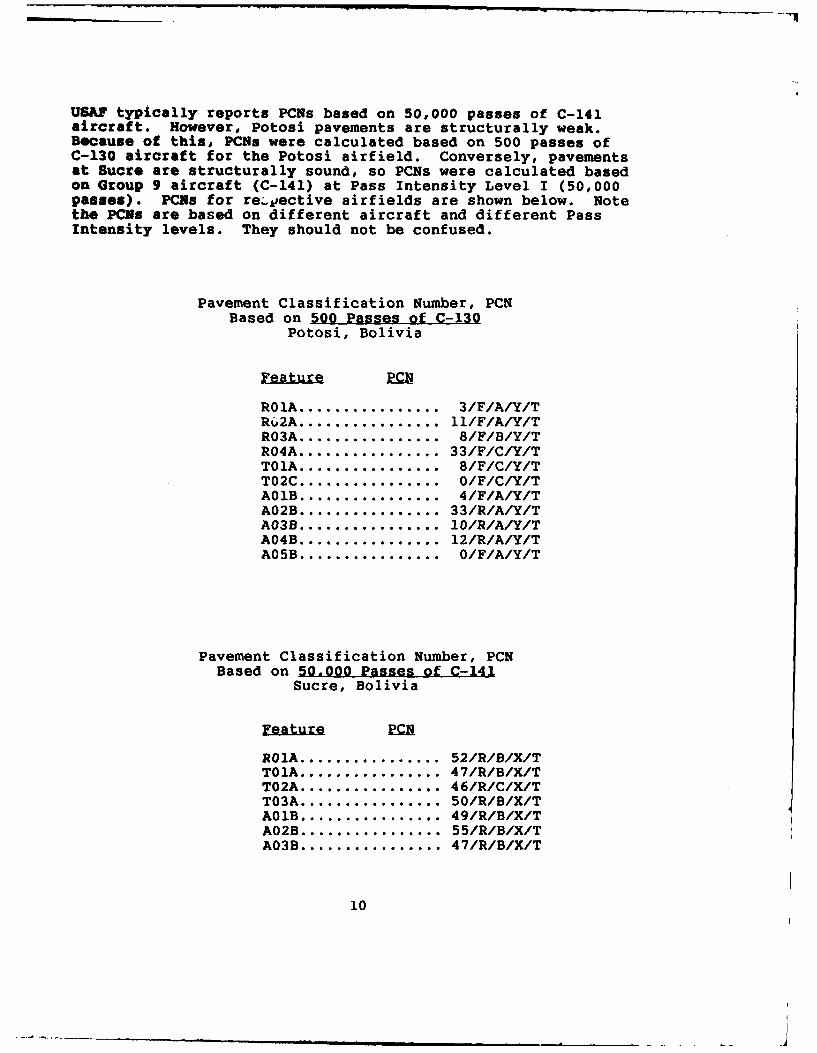
USAF typically reports PCNs based on 50,000 passes of C-141aircraft. However, Potosi pavements are structurally weak.Because of this, PCNs were calculated based on 500 passes ofC-130 aircraft for the Potosi airfield. Conversely, pavementsat Sucre are structurally sound, so PCNs were calculated basedon Group 9 aircraft (C-141) at Pass Intensity Level I (50,000passes). PCNs for reLective airfields are shown below. Notethe PCNs are based on different aircraft and different PassIntensity levels. They should not be confused.
Pavement Classification Number, PCNBased on 500 Passes of C-130
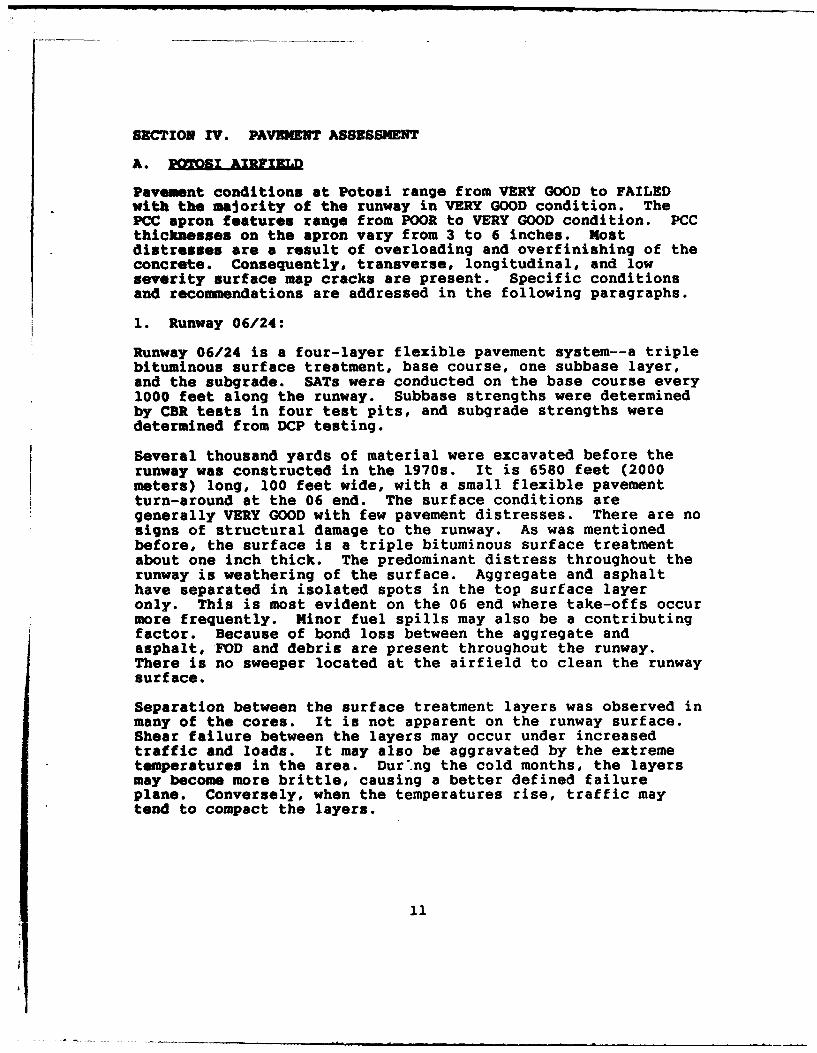
Pavement conditions at Potosi range from VERY GOOD to FAILEDwith the majority of the runway in VERY GOOD condition. ThePCC apron features range from POOR to VERY GOOD condition. PCCthicknesses on the apron vary from 3 to 6 inches. Mostdistresses are a result of overloading and overfinishing of theconcrete. Consequently, transverse, longitudinal, and lowseverity surface map cracks are present. Specific conditionsand recommendations are addressed in the following paragraphs.
1. Runway 06/24:
Runway 06/24 is a four-layer flexible pavement system--a triplebituminous surface treatment, base course, one subbase layer,and the subgrade. SATs were conducted on the base course every1000 feet along the runway. Subbase strengths were determinedby CBR tests in four test pits, and subgrade strengths weredetermined from DCP testing.
Several thousand yards of material were excavated before therunway was constructed in the 1970s. It is 6580 feet (2000meters) long, 100 feet wide, with a small flexible pavementturn-around at the 06 end. The surface conditions aregenerally VERY GOOD with few pavement distresses. There are nosigns of structural damage to the runway. As was mentionedbefore, the surface is a triple bituminous surface treatmentabout one inch thick. The predominant distress throughout therunway is weathering of the surface. Aggregate and asphalthave separated in isolated spots in the top surface layeronly. This is most evident on the 06 end where take-offs occurmore frequently. Minor fuel spills may also be a contributingfactor. Because of bond loss between the aggregate andasphalt, FOD and debris are present throughout the runway.There is no sweeper located at the airfield to clean the runwaysurface.
Separation between the surface treatment layers was observed inmany of the cores. It is not apparent on the runway surface.Shear failure between the layers may occur under increasedtraffic and loads. It may also be aggravated by the extremetemperatures in the area. Dur'ng the cold months, the layersmay become more brittle, causing a better defined failureplane. Conversely, when the temperatures rise, traffic maytend to compact the layers.
11
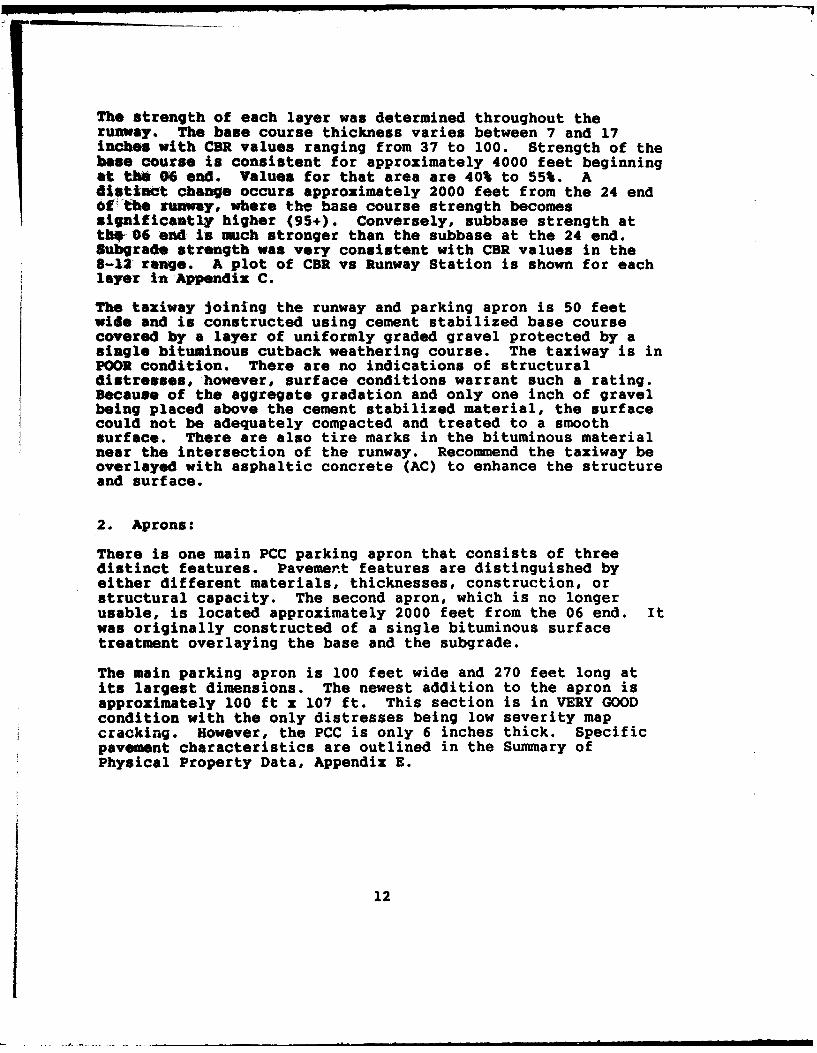
The strength of each layer was determined throughout therunway. The base course thickness varies between 7 and 17inches with CBR values ranging from 37 to 100. Strength of thebase course is consistent for approximately 4000 feet beginningat thi 6 end. Values for that area are 40% to 55%. Adistinct change occurs approximately 2000 feet from the 24 endOfCthe runway, where the base course strength becomessignificantly higher (95+). Conversely, subbase strength att1h 06 end is much stronger than the subbase at the 24 end.subgrade strength was very consistent with CBR values in the8-12 range. A plot of CBR vs Runway Station is shown for eachlayer in Appendix C.
The taxiway joining the runway and parking apron is 50 feetwide and is constructed using cement stabilized base coursecovered by a layer of uniformly graded gravel protected by asingle bituminous cutback weathering course. The taxiway is inPOOR condition. There are no indications of structuraldistresses, however, surface conditions warrant such a rating.Because of the aggregate gradation and only one inch of gravelbeing placed above the cement stabilized material, the surfacecould not be adequately compacted and treated to a smoothsurface. There are also tire marks in the bituminous materialnear the intersection of the runway. Recommend the taxiway beoverlayed with asphaltic concrete (AC) to enhance the structureand surface.
2. Aprons:
There is one main PCC parking apron that consists of threedistinct features. Pavement features are distinguished byeither different materials, thicknesses, construction, orstructural capacity. The second apron, which is no longerusable, is located approximately 2000 feet from the 06 end. Itwas originally constructed of a single bituminous surfacetreatment overlaying the base and the subgrade.
The main parking apron is 100 feet wide and 270 feet long atits largest dimensions. The newest addition to the apron isapproximately 100 ft x 107 ft. This section is in VERY GOODcondition with the only distresses being low severity mapcracking. However, the PCC is only 6 inches thick. Specificpavement characteristics are outlined in the Summary ofPhysical Property Data, Appendix E.
12
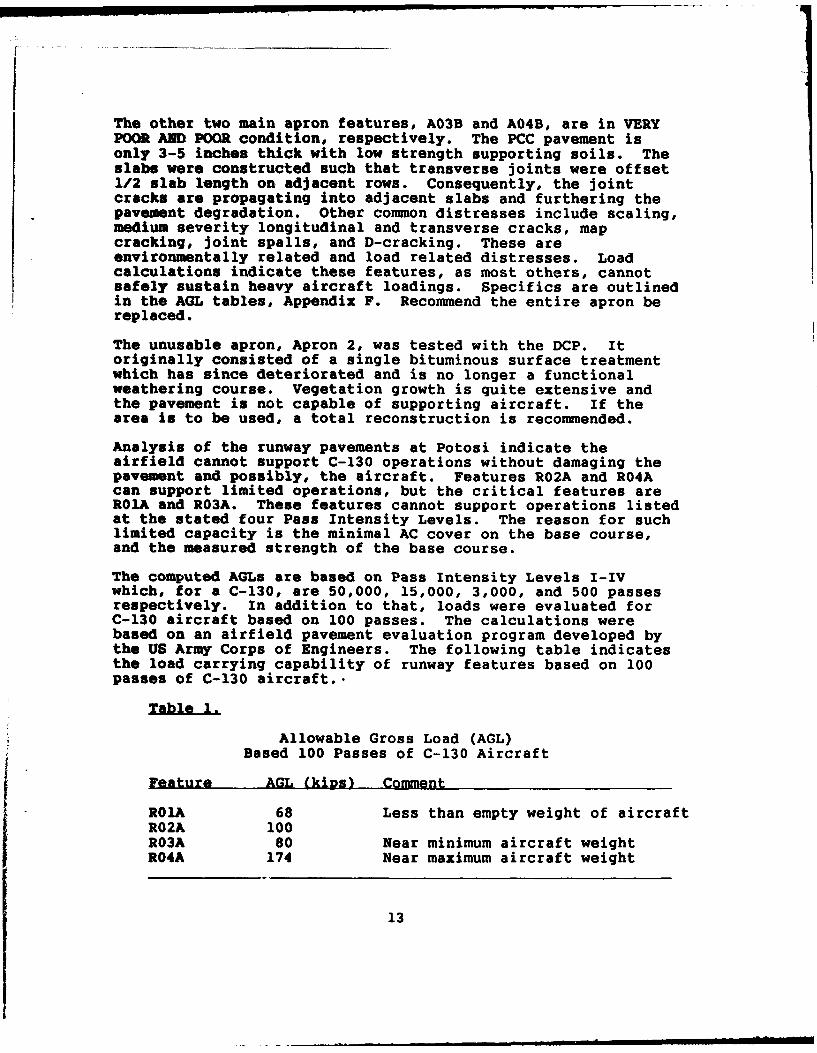
The other two main apron features, A03B and A04B, are in VERYPOOR AND POOR condition, respectively. The PCC pavement isonly 3-5 inches thick with low strength supporting soils. Theslabs were constructed such that transverse joints were offset1/2 slab length on adjacent rows. Consequently, the jointcracks are propagating into adjacent slabs and furthering thepavement degradation. Other common distresses include scaling,medium severity longitudinal and transverse cracks, mapcracking, joint spalls, and D-cracking. These areenvironmentally related and load related distresses. Loadcalculations indicate these features, as most others, cannotsafely sustain heavy aircraft loadings. Specifics are outlinedin the AGL tables, Appendix F. Recommend the entire apron bereplaced.
The unusable apron, Apron 2, was tested with the DCP. Itoriginally consisted of a single bituminous surface treatmentwhich has since deteriorated and is no longer a functionalweathering course. Vegetation growth is quite extensive andthe pavement is not capable of supporting aircraft. If thearea is to be used, a total reconstruction is recommended.
Analysis of the runway pavements at Potosi indicate theairfield cannot support C-130 operations without damaging thepavement and possibly, the aircraft. Features R02A and R04Acan support limited operations, but the critical features areROA and R03A. These features cannot support operations listedat the stated four Pass Intensity Levels. The reason for suchlimited capacity is the minimal AC cover on the base course,and the measured strength of the base course.
The computed AGLs are based on Pass Intensity Levels I-IVwhich, for a C-130, are 50,000, 15,000, 3,000, and 500 passesrespectively. In addition to that, loads were evaluated forC-130 aircraft based on 100 passes. The calculations werebased on an airfield pavement evaluation program developed bythe US Army Corps of Engineers. The following table indicatesthe load carrying capability of runway features based on 100passes of C-130 aircraft..
Allowable Gross Load (AGL)Based 100 Passes of C-130 Aircraft
Feature AGL kiRs) Comment
R01A 68 Less than empty weight of aircraft
R02A 100R03A 80 Near minimum aircraft weightR04A 174 Near maximum aircraft weight
13
As Tabl* I indicates, the controlling runway feature, ROA, isnot capable of supporting 100 passes of a C-130 aircraftwithoutdamaging the pavement, or possibly, the aircraft. Ifthe airfield is to be used for medium and heavy aircraft,recato the runway and adjoining pavements be structurallyrehoilt.
V. SUCME AIRFIELD
The Sucre airfield is entirely constructed of PCC with a basecourse covering the in situ subgrade. SATs were conductedevery 1000 feet on the runway to obtain a subsurface soilstrength profile. Additional tests were then conducted tobetter define the soil strength profile. SATs were alsoconducted in the apron and two taxiways. Soil strengthprofiles are graphically shown in the Sucre Appendix C.
Pavement conditions at Sucre are VERY GOOD, or better.Distresses are limited to isolated low severity longitudinal,transverse and map cracks. Joint sealant is generally, in GOODcondition. The distresses that are evident have beenwell-maintained which is indicative of sound engineeringpractices. Specific conditions and recommendations areaddressed in the following paragraphs.
1. Runway 05/23:
Runway 05/23 is a three-layer rigid pavement system. Theairfield was constructed in 1975 under one contract withconsistent material throughout. The PCC thickness is 11 to 13inches thick which is supported by approximately 16 inches ofgranular base on top of the subgrade. The concrete coresappear very sound with a well-graded aggregate composition.The runway is 9475 feet long and 100 feet wide with a concreteturn-around apron on the 05 end. Significant elevation changesoccur along the length of the runway. The elevation is highestat the midpoint and slopes down towards each end. A hill atthe 05 end prevents a gradual glide slope for approachingaircraft. Approximately 800 feet from the 23 end is a wirefence separating the runway from a steep valley. Because ofthe deep valley at RW 23 and the hill at the 05 end, thethresholds have been displaced 1720 and 2350 feet respectively.Subsequently, traffic landings are concentrated approximately2500 feet from the 05 end.
Runway pavement conditions are generally VERY GOOD with fewpavement distresses. There are only isolated signs ofstructural distresses. For example, in the concentratedtouchdown areas are low severity longitudinal and transversecracks that have been well-maintained. The predominant
14
distress throughout the runway is low severity map cracking.Even these areas are isolated and most have been chipped tosound material and sealed. Additionally, there is evidence ofalkali-aggregate reaction in isolated spots on the runwaysurface. The maintenance throughout is excellent.
The strength of each layer was determined throughout therunway. The base course thickness was constant at 12-18 inchescovering the subgrade. CBR strengths for the granular base aregenerally in the 50-80% range. Strength of the subgrade wasinvestigated using the dynamic cone penetrometer. Generally,only limited load restrictions apply to the Sucre airfield.There are no load restrictions at the current traffic levels.Specific load carrying capabilities are outlined in Appendix F.
2. Taxiways:
There are two taxiways adjoining the main apron at Sucre. Oneis in VERY GOOD condition and the other is EXCELLENT. The onlydistresses are longitudinal and transverse cracks that havebeen well-maintained. These cracks are limited to 250 squarefeet at the intersection of the apron and Taxiway 2. Thesecracks may be a result of combination of loading and strengthof the subsurface soils. In this area, as in most of theapron, subsurface water was found flowing between the concreteand base course, causing a small void at the interface.
3. Apron:
There is one main PCC parking apron (300 ft x 500 ft) that isin EXCELLENT condition. There are no significant distresses.However, as was previously mentioned, subsurface water wasfound flowing at the interface of concrete and base coursematerial. The water appears to have washed out some of thefines that act as a binder in the base course. This has alsoleft a small void between the slabs and supporting soil. Thereare presently no distresses, but structural cracks may occur asloads and frequency increase. Structural cracks have occurredin the taxiway (mentioned above) because the loads areconcentrated in a small area, whereas the concentration doesnot occur on the apron. These cracks, if they occur, willsurface over a period of time. Recommend the surface condition
* be monitored for any PCC cracking.
There are no taxi lines painted on the apron. B-727s are thepredominant commercial aircraft that use the airportfacilities. Taxiing aircraft follow the same general pathwhich occasionally results in the main gears falling on theconcrete Joints. Recommend a taxi line be painted so maingears fall near the center of the PCC slabs.
15
SECTION V: CONCLUSIONSRECOMilENDATIONS
1. Pavements at Potosi airfield should be structurallyenhanced to support increased aircraft loads and traffic.Strength tests and pavement conditions warrant such arecommendation.
2. Pavements at Sucre are well-maintained with fewdistresses. The conditions can be attributed to attention todetail, sound engineering, and limited traffic. Recommend thecondition of the Main Apron and Taxiway 2 be monitored forincreased deterioration.
17
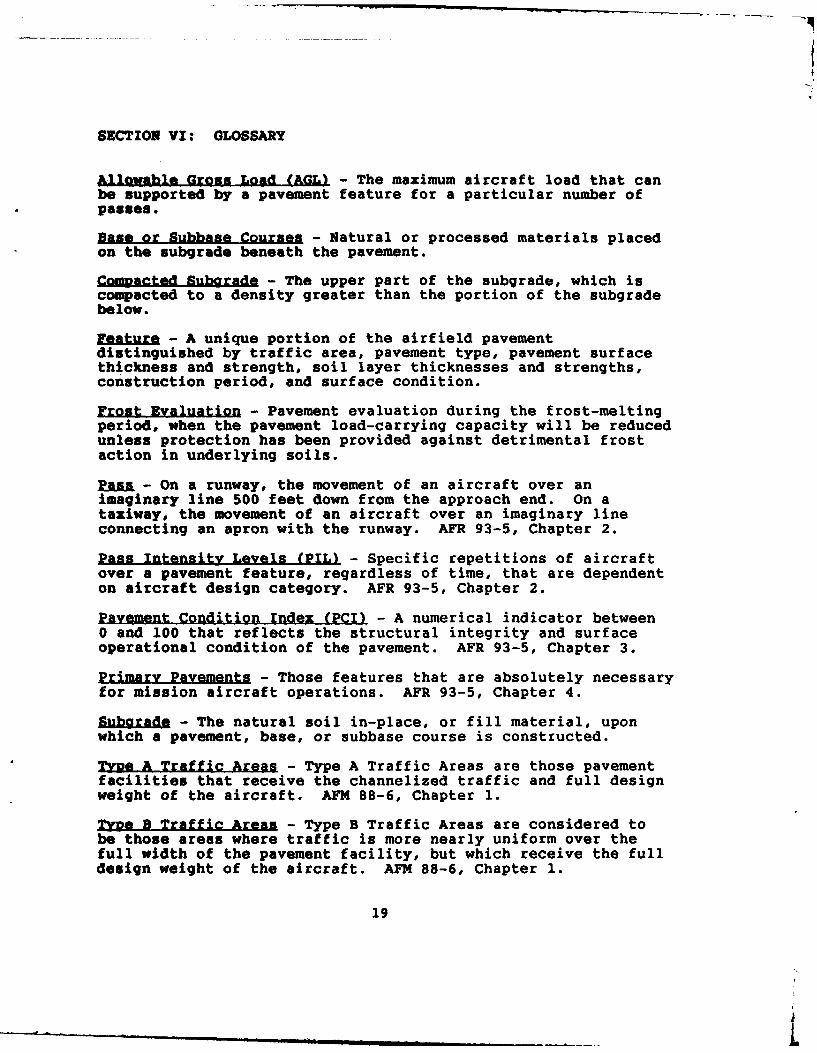
SECTION VI: GLOSSARY
Allowable Gross Load (AGL) - The maximum aircraft load that canbe supported by a pavement feature for a particular number ofpasses.
Base or Subbase Courses - Natural or processed materials placedon the subgrade beneath the pavement.
Comnacted Subarade - The upper part of the subgrade, which iscompacted to a density greater than the portion of the subgradebelow.
eantur - A unique portion of the airfield pavementdistinguished by traffic area, pavement type, pavement surfacethickness and strength, soil layer thicknesses and strengths,construction period, and surface condition.
Frost Evaluation - Pavement evaluation during the frost-meltingperiod, when the pavement load-carrying capacity will be reducedunless protection has been provided against detrimental frostaction in underlying soils.
Pas - On a runway, the movement of an aircraft over animaginary line 500 feet down from the approach end. On ataxiway, the movement of an aircraft over an imaginary lineconnecting an apron with the runway. AFR 93-5, Chapter 2.
Pass Intensity Levels (PIL) - Specific repetitions of aircraftover a pavement feature, regardless of time, that are dependenton aircraft design category. AFR 93-5, Chapter 2.
Pavement Condition Index (PCI) - A numerical indicator between0 and 100 that reflects the structural integrity and surfaceoperational condition of the pavement. AFR 93-5, Chapter 3.
Primary Pavements - Those features that are absolutely necessaryfor mission aircraft operations. AFR 93-5, Chapter 4.Subgrade - The natural soil in-place, or fill material, upon
which a pavement, base, or subbase course is constructed.
TM e A Traffic Areas - Type A Traffic Areas are those pavement
facilities that receive the channelized traffic and full designweight of the aircraft. AFM 88-6, Chapter 1.
Tye B Traffic Areas - Type B Traffic Areas are considered tobe those areas where traffic is more nearly uniform over thefull width of the pavement facility, but which receive the fulldesign weight of the aircraft. AFM 88-6, Chapter 1.
19
__ Am
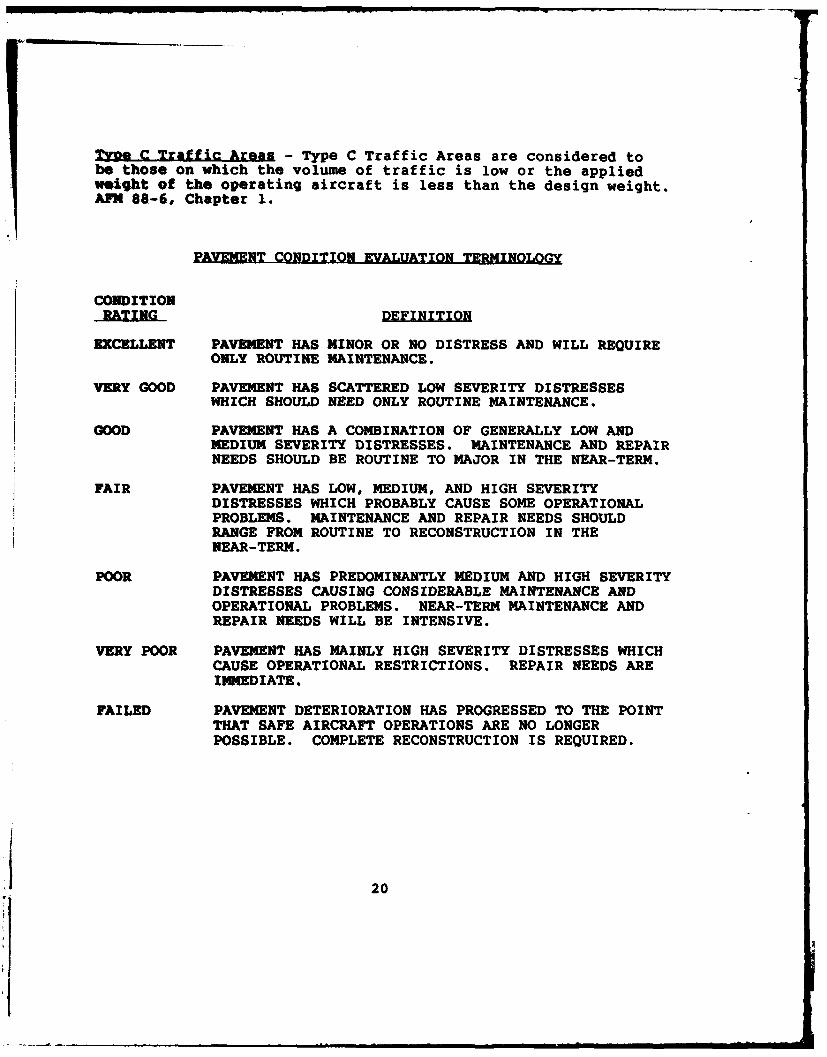
Tye C Traffic Areas - Type C Traffic Areas are considered tobe those on which the volume of traffic is low or the appliedweight of the operating aircraft is less than the design weight.AFN 88-6, Chapter 1.
PAVEMENT CONDITION EVALUATION TERMINOLOGY
CONDITIONRAIGDEFINITION
EXCELLENT PAVEMENT HAS MINOR OR NO DISTRESS AND WILL REQUIREONLY ROUTINE MAINTENANCE.
VERY GOOD PAVEMENT HAS SCATTERED LOW SEVERITY DISTRESSESWHICH SHOULD NEED ONLY ROUTINE MAINTENANCE.
GOOD PAVEMENT HAS A COMBINATION OF GENERALLY LOW ANDMEDIUM SEVERITY DISTRESSES. MAINTENANCE AND REPAIRNEEDS SHOULD BE ROUTINE TO MAJOR IN THE NEAR-TERM.
FAIR PAVEMENT HAS LOW, MEDIUM, AND HIGH SEVERITYDISTRESSES WHICH PROBABLY CAUSE SOME OPERATIONALPROBLEMS. MAINTENANCE AND REPAIR NEEDS SHOULDRANGE FROM ROUTINE TO RECONSTRUCTION IN THENEAR-TERM.
POOR PAVEMENT HAS PREDOMINANTLY MEDIUM AND HIGH SEVERITYDISTRESSES CAUSING CONSIDERABLE MAINTENANCE ANDOPERATIONAL PROBLEMS. NEAR-TERM MAINTENANCE ANDREPAIR NEEDS WILL BE INTENSIVE.
VERY POOR PAVEMENT HAS MAINLY HIGH SEVERITY DISTRESSES WHICHCAUSE OPERATIONAL RESTRICTIONS. REPAIR NEEDS AREIMMEDIATE.
FAILED PAVEMENT DETERIORATION HAS PROGRESSED TO THE POINTTHAT SAFE AIRCRAFT OPERATIONS ARE NO LONGERPOSSIBLE. COMPLETE RECONSTRUCTION IS REQUIRED.
20
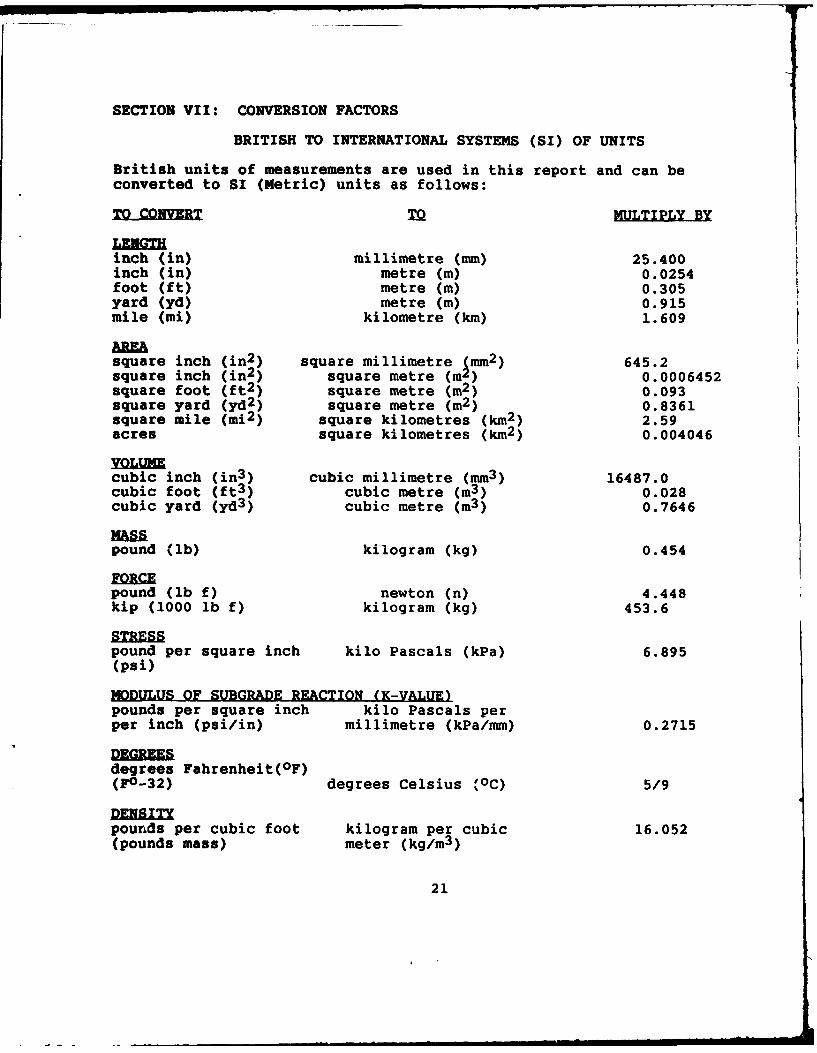
SECTION VII: CONVERSION FACTORS
BRITISH TO INTERNATIONAL SYSTEMS (SI) OF UNITS
British units of measurements are used in this report and can beconverted to SI (Metric) units as follows:
TO C11VET I MULTIPLY BYLENGTHinch (in) millimetre (mm) 25.400inch (in) metre (m) 0.0254foot (ft) metre (m) 0.305yard (yd) metre (m) 0.915mile (mi) kilometre (km) 1.609
square inch (in2) square millimetre mm2) 645.2square inch (in2) square metre (m) 0.0006452square foot (ft2 ) square metre (m2) 0.093square yard (yd2) square metre (m2) 0.8361square mile (mi2) square kilometres (km2 ) 2.59
acres square kilometres (km2) 0.004046
VOLUMEcubic inch (in3) cubic millimetre (mm3) 16487.0cubic foot (ft3 ) cubic metre (m3 ) 0.028cubic yard (yd3 ) cubic metre (m3 ) 0.7646
4. Hammitt, G. M. III, Concrete Strength Relationshios.Research Paver, Texas A&M University, College Station, Texas,December 1971.
23
DISTRIBUTION
Copies
Commander, US MILGPLA Paz, BoliviaAPO Miami 34032-0008
HQ SAC/DE 2Offutt AFB NE 68113-5000
HQ USAF/LEEDM 2Washington DC 20330
HQ TAC/DE 4Langley AFB VA 23665-5000
HQ MAC/DE 2Scott AFB IL 62225-5001
HQ AFLC/DE 2Wright-Patterson AFB OH 45433-5000
HQ AFSPACECOM/DE 1Peterson AFB CO 80914-5000
AFIT/DEE 1Wright-Patterson AFB OH 45433-5000
DMA Aerospace Center 1Attn: DMAAC/ADP3200 South Second StreetSt Louis AFS NO 63118
AUL 1Maxwell AFB AL 36112-5000
NAVFAC Division 1Attn: 04B1200 Stovall StreetAlexandria VA 22332
HQ DA (CEEC-EG) 4Pulaski Building20 Massachusetts Ave., NWWashington DC 20314-1000
WESGP 23909 Halls Ferry RoadVicksburg MS 39180-6199
25
HQ USSOUTHCON/SCEN 10APO Miami 34003-0015
HQ 12 AF/DE 4Bergstrom AFB, TX 78743-5002
CRREL-EG 272 Lyme RoadHanover NH 03755-1290
CERL-FON 2P.O. Box 4005Champaign IL 61820-1305
HQ AFESC/TIC 1Tyndall AFB, FL 32403-6001
HQ USAF/LEEI 1Washington DC 20330-5130
HQ USAF/LEEP 1Washington, D.C. 20330
HQ AFESC/DEMP 15Tyndall AFB FL 32403-6001
26
RIA A4B I2A R 3 A
TBST 3 Pcc I TBST I T85T
I1 £2 A38 TIA T 2CAS
I TBS CC 3 C .5 SOST .5SS. SS
(~) FEATURE DESIGNATION (WE NOTE 1)
PAEMNT TWCKNESS I INCS & TYPE
TYPE OF ATR
R-MMVAY I-FEATURE DESIGIATION DENOTES TYPE OF FEATURE, NURSERT-TAZ WAY FEATURE FOR GIVEN FEATURE TYPE AND TYPE OF TRAFFIC ARfA-APION 2.TRAFFIC AREA DESIGNATIONS ARE BASED ON AFM 8.6, CHAP!
TYPE TRA, if MA (SEE NOTE 2)
A-A TYPE ?RAFM8-8 TYPE TRAFFIC
c-C Tm TRAFFIC
------ EATURE MEGRATION
)-~-4CULVERT WITH DfAD WALLCC PORTLAND CEMENT CONCRETE
ES SMEUE BITIOUS SURFACE TREATWENT
TESo LE E(TImUl S SURFACE TREATYNNT
P54 R4A
I TEST I TEST
Tmf OP OVAI. WMMS OFP ANDM OP IUAWWI AMA 1EI MD ON AM 88-4. CAMP1.
/1 UNITED STATES AIR FORCEENGINEERING If SERVICS CENTER
-s .. '. "~"TYNDALL AIR FORCE BASE, FLORIDA
-1 6 ds1 16 " od 6 AIRFIELD LAYOUT PLANCAPITANI NICHOLAS ROJAS AIRPORT, (POTWOI WOLgVIA
OASPHILSOM 61 AiUST SI APP N DIXN A
DA"LOMUR 164"amPHIC USHhET-L wi...
A-I
'A' CLVERFT
APfiON
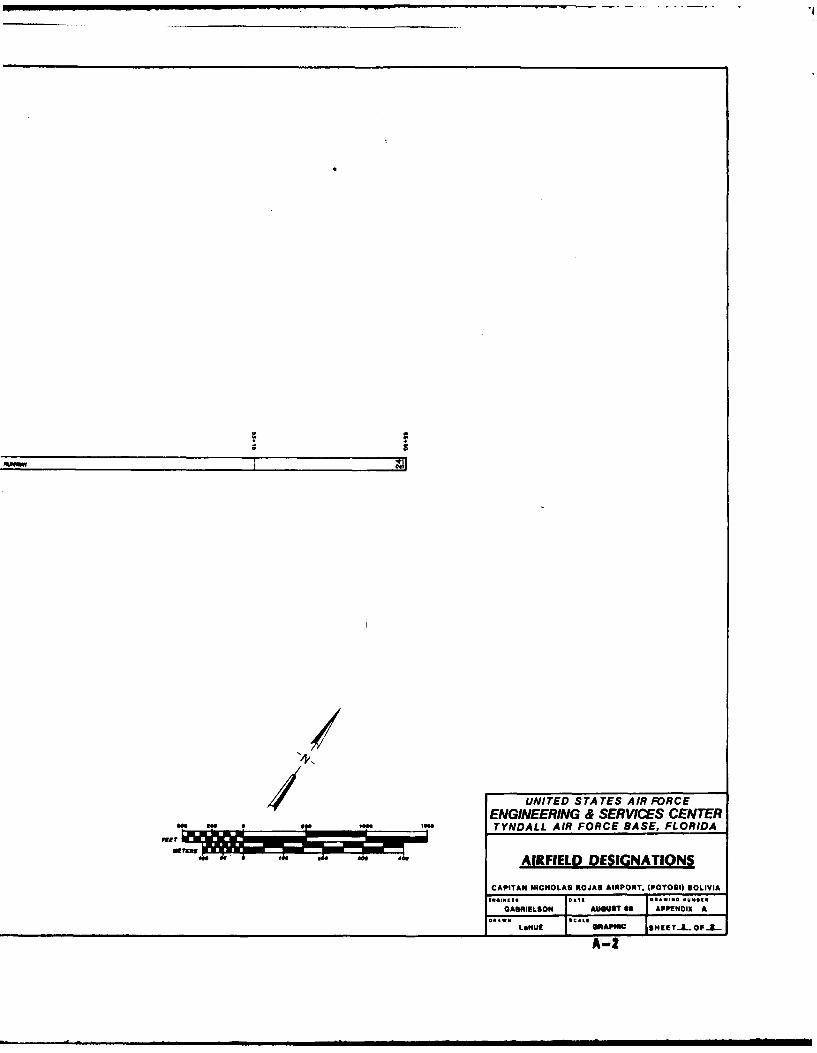
//UNITED STA TES AIR FORCE
ENGINEERING & SERVICES CENTERms 0" law TYNDALL AIR FORCE BASE, FLORIDA
EET
-iaR.L ' AIRFIELD DESIGNATIONS
CAPITAN NICHOLAS ROJAS AIRPORT, (POTOSI) BOLIVIA" a" ".. r ..I.a.... ... ago.GAMRIELSON AUGUST 69 APPENDIX A
LI4HUE IAAPHIC 1S.E.TrI OPFL.
A-Z
TETPT4 (RA) TETPT3 (R2A) TETPT2 MW~DAPmh NAT~M*L LuLpz con OEPl.4 ATRIAL LIJPl COn 0(174MA~O L~LlP
ENGINEERING & SERVICES CENTER,m up • .TYNDALL AIR FORCE BASE, FLORIDA
~" f" PHOTOGRAPH LOCATIONS
CAPITAN NICHOLAS ROJAS AIRPORT, (POTOI) BOLIVIA
GAWRISON AUGUST435 APPENOIX D
aIHUE GRAPHIC SNEITLOF a
0-2
7-sy
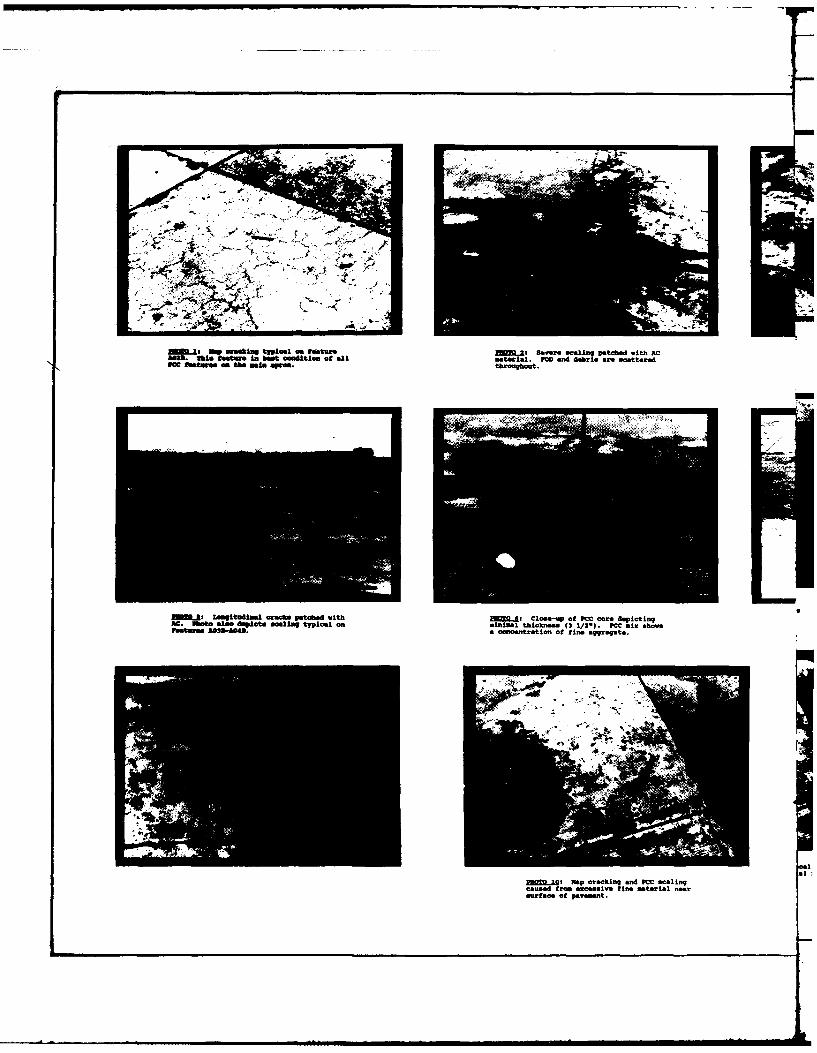
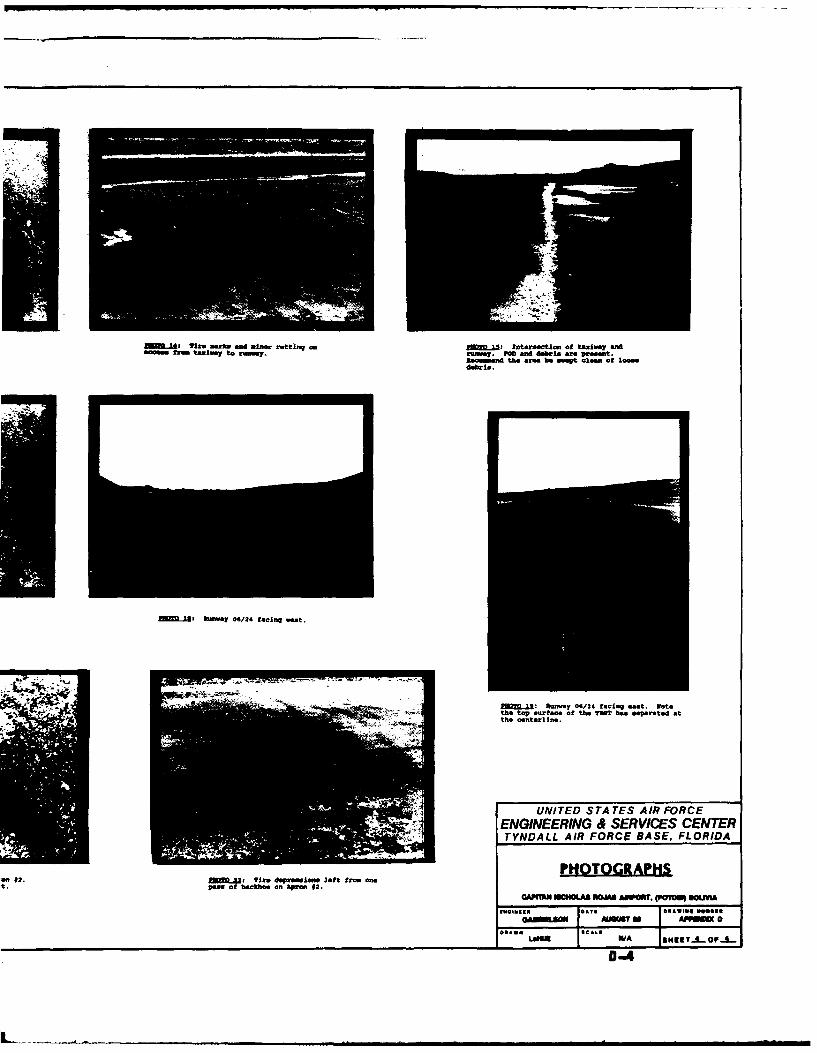
* £irn~e ~ uia surn.throuqhcut.
j~iagiuirn ca~ pt~ ith .J: l o..-sp of PCC Mars aepicinqAC. rto Alas depi. gsi ticloarnsi icknaSa (3 1/2'). tOC six shov~ss~s M38-63.& oonoatrstimon f f ine aggragat..
212" Map Oraohing and tOO Soalingcaused from excessive fins material nearswrfos of pavement.
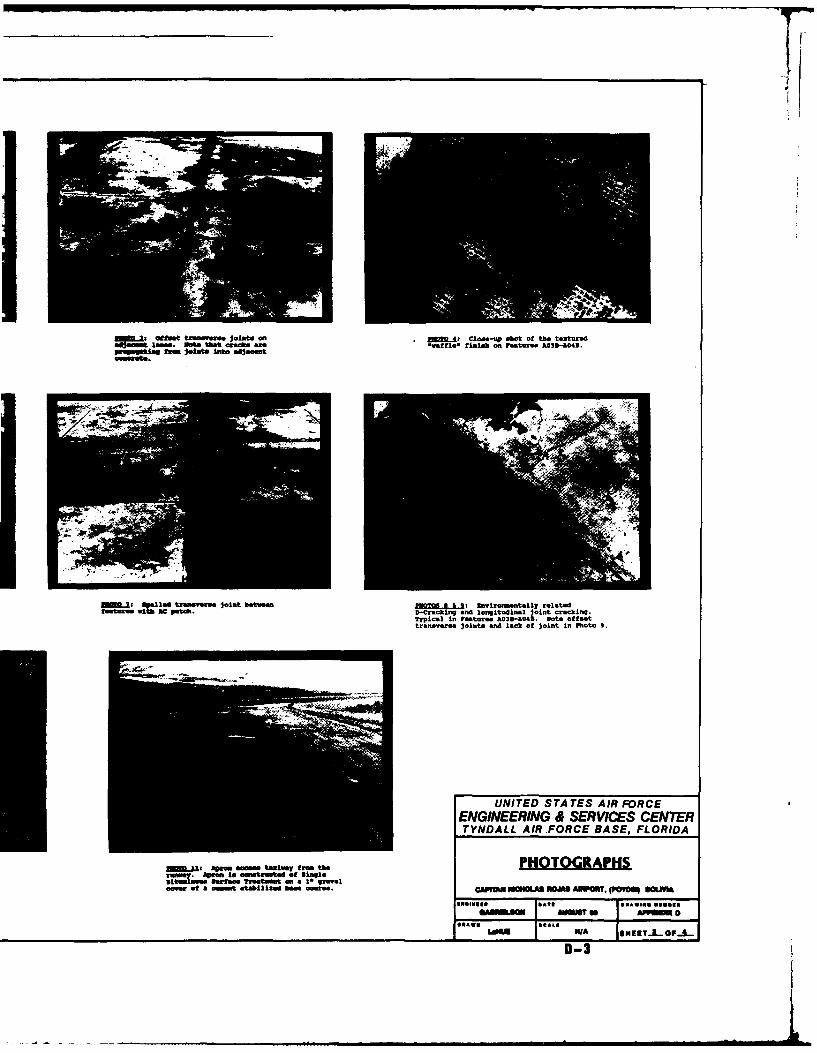
= !atet tramoere Jolint&aen 20.4: Cl a-UP shot of tha taxturedla. oft* that cracks are -waffle. fiLab on Features A039-2,043
MMUSU 'gaxi0 tresae joint between 2LLi twro.vantally relatedfatures elhc t D-rcin, and longitudinal Joint cracking.
Typical in features A039-A049. Note offafttrans~eree Joints and lack of Joint in Photo 0.
UNITED STATES AIR FORCEENGINEERING & SERVICES CENTERTYNDALL AIR FORCE BASE, FLORIDA
ME.U Apo case oay trethe PHOTOG~RAHSover of a moment saeilteed bae" ouree. cAPm.r~f UMMLAS MWAS AMffl pmoS BOOM
AICU AUT a Ain D
*AnLow AL WA ISHENT..LoF..L
0-3
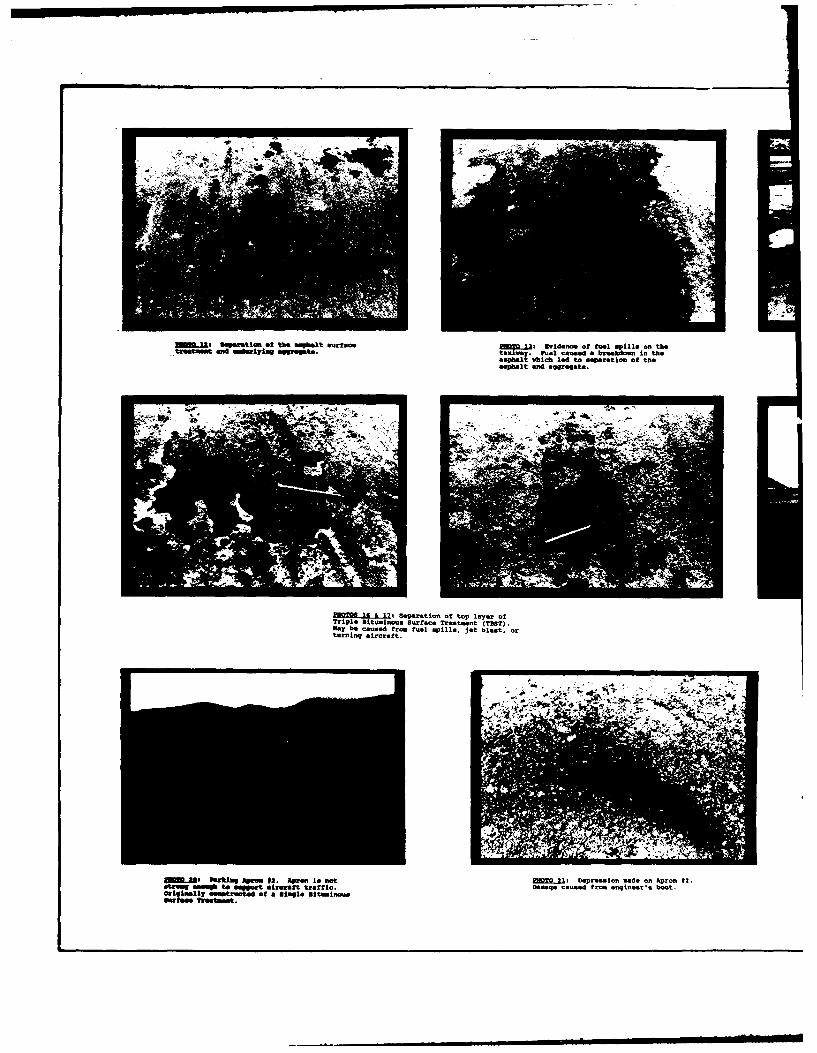
.. ~tIS~rtiS fthe ~smoat surfac SSf Rvidenoe of tuel spill& ont thetZ.Stmmt Sod et va gts. txway. YU.locused a breakdown lo the
asphalt which led to separation of theasphalt end aggregate.
.JL.~ separation of top layer OfTrile itelnusSurfae TreetXent (TMT).
Mep be caused fro. fuel spills, jet blast, orturning aircraft.
.Jg:M Parkime mcu #3. A o sat ~ i Depression "ado on Apron *2.stie, ea to s~e irereft traffic. Damage ceused f row engineer. 6boot.
Ily Iwatedof a @inole* Sitaiinou
JAZ" fi. uste" and wimo at tIng on In~ intersection of taxlway andmass= fom tetivay to EMBASY. rwewy.POandersMSrG0ti ndthe area be Isp ale" of 1ogee
debris.
212SAI I lummay 06/24 facing veet.
Z2: Rwntey 06/24 facing eaat. Notethe top Surfac, of te TIME? has separted atL: the centerline.
UNITED S TA TES AIR FORCEENGIEEIN & SERVICES CENTERTYNDALL AIR FORCE BASE, FLORIDA
WI #. in~ fi. detesetne eft freen oneI.Pass of backhoe o=-MM" *.
GAlhM iNWOLA M - MPN MO. NO Mou
anai AUNIST a APPNE 0
LeNSWA SHEEmT 4 OF 4
LL. LL.
C4 (%J U#A. I
.55.
C4C
1- M in 9-"l
I.4 I.-J
C
L '0 .- - '0
L . ZW 1.- 0
ftIM.sLJ .(J W-.4D
I II IIl I-
4A X C CL IL
I. - L - at "s c I.- I. CieL& (0 an S i a tt;S CC
5 -40 4D 40 CD) C5
of Z: CCD Q CD C C Q
ft5- - 4
E-
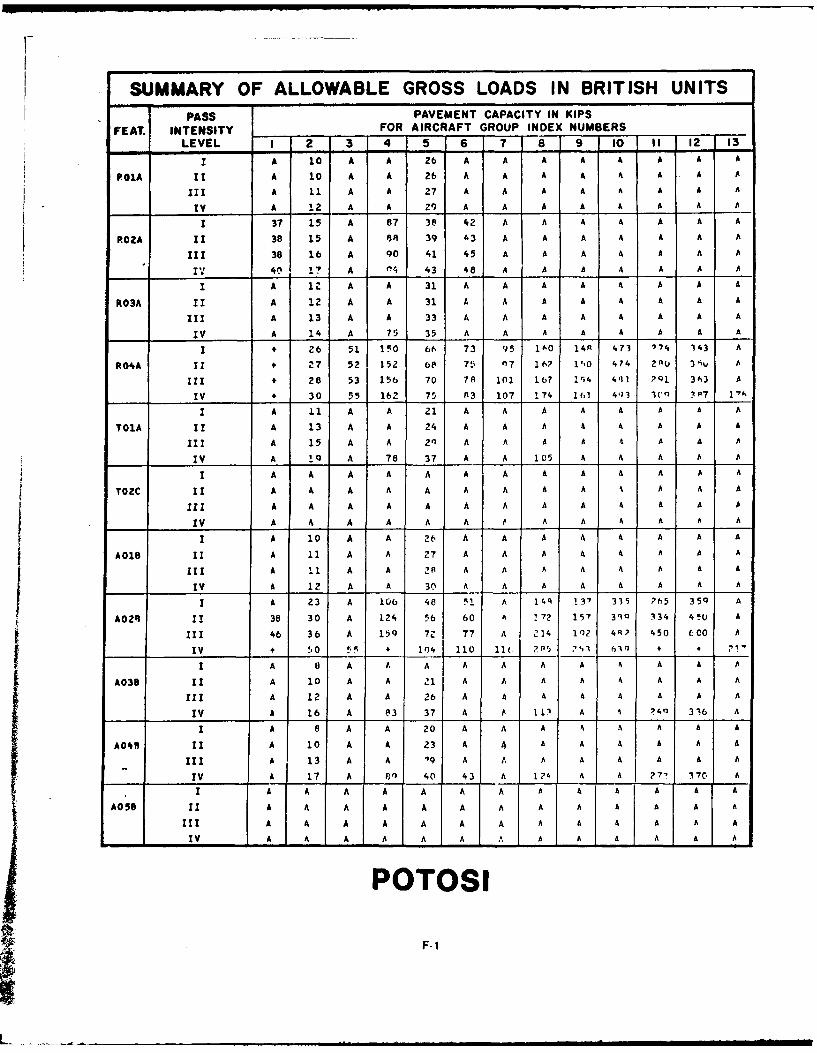
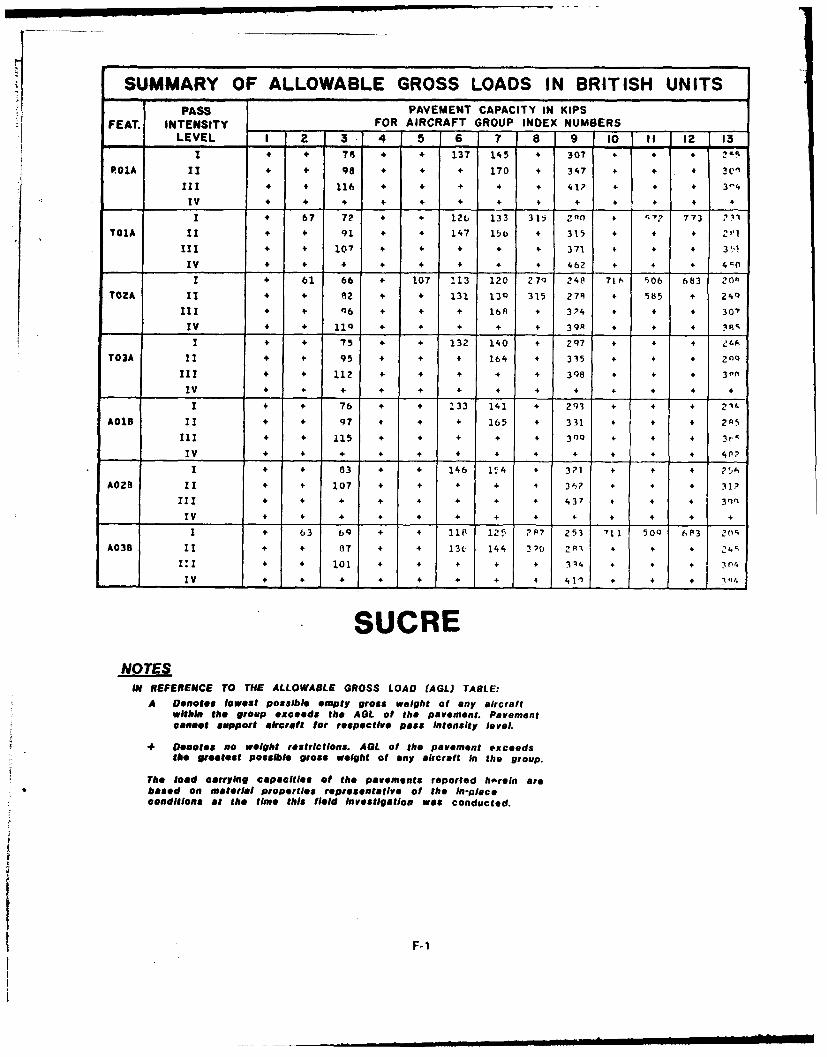
SUMMARY OF ALLOWABLE GROSS LOADS IN BRITISH UNITSPASS PAVEMENT CAPACITY IN KIPS
FEAT. INTENSITY FOR AIRCRAFT GROUP INDEX NUMBERSLEVEL I 2 3 4 5 6 7 8 9 10 II 12 13
I A 10 A A 26 A A A A A A A A
POlA 11 A 10 A A 26 A A A A i A A A
IT A 11 A A 27 A A A A A A A A
IV A 12 A A 29 A A A A A A A A
1 37 15 A 87 38 42 A A A A A A A
ROZA II 38 15 A f8 39 .3 A A A A A A A
11I 38 16 A 90 41 45 A A A A A A A
IV 40 1? A 04 43 48 A A A A A A A
I A 12 A A 31 A A A A A A A A
RO3A II A 12 A A 31 A A A A A A A A
III A 13 A A 33 A A A A A A A A
IV A 14 A 75 35 A A A A A A A A
I + 26 51 150 66 73 95 1&0 14R 473 974 143 A
RO4A II * 27 52 152 b8 75 07 167 itO 474 2nAu 3i v A
III + 28 53 156 70 78 101 167 194 431 7Q1 343 A
IV + 30 55 162 75 A3 107 174 163 4)3 3(c" !P7 1-,
I A 11 A A 21 A A A A A A A A
TOlA II A 13 A A 24 A A A A A A A A
III A 15 A A 2" A A A A A A A A
IV A Iq A 78 37 A A 105 A A A A A
I A A A A A A A A A A A A A
TOZC I I A A A A A A A A A A A A A
III A A A A A A A A A A a A A
IV A A A A A A p A A A A A A
I A 10 A A 26 A A A A A A A A
AOIB II A 11 A A 27 A A A A A A A A
III A 1I A A 2S A A A A A A A A
IV A 12 A A 30 A A A A a A A A
I A 23 A 106 40 5i A 14q 137 335 ? 5 35q A
A02R II 38 30 A 124 56 60 A !72 157 34Q 134 4 (J A
111 46 36 A 159 7;' 77 A 214 1)2 4R 7 450 tO0 A
IV + 50 55 + 104 110 i1(. 2n85 ',1 6) + * '1'
I A 8 A A A A A A A A A A A
A038 II A 10 A A 21 A A A A A A A A
III A 12 A A 26 A A A A A A A A
IV A 16 A 83 37 A A 111 A A 74Q 316 A
I A 8 A A 20 A A A A A A A A
A048 II A 10 A A 23 A 4 A A A a A A
III A 13 A A "09 A A A A A A A A
TV A 17 A 8") 40 43 A 12' A A 77 1 370 A
I A A A A A a A A A A A A A
A05 II A A A A A A A A A A A A A
III A A A A A A A A a A A A A
IV A A A A A A A A A a A A A
POTOSI
F-1
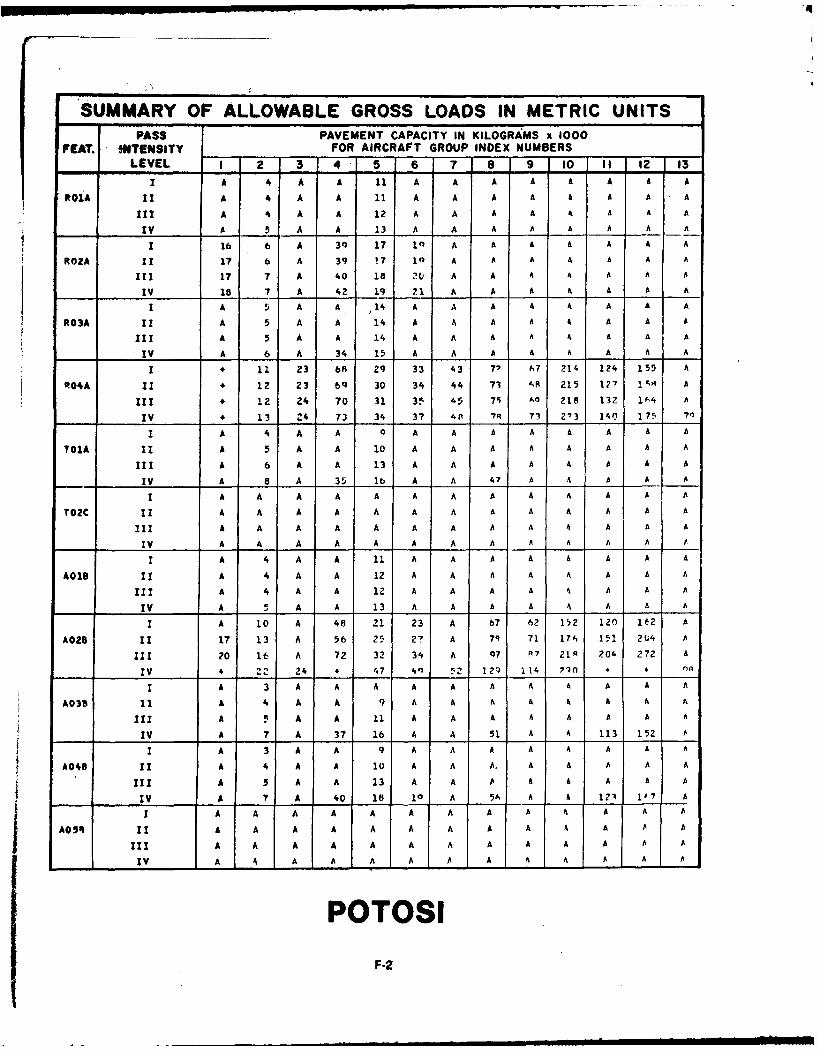
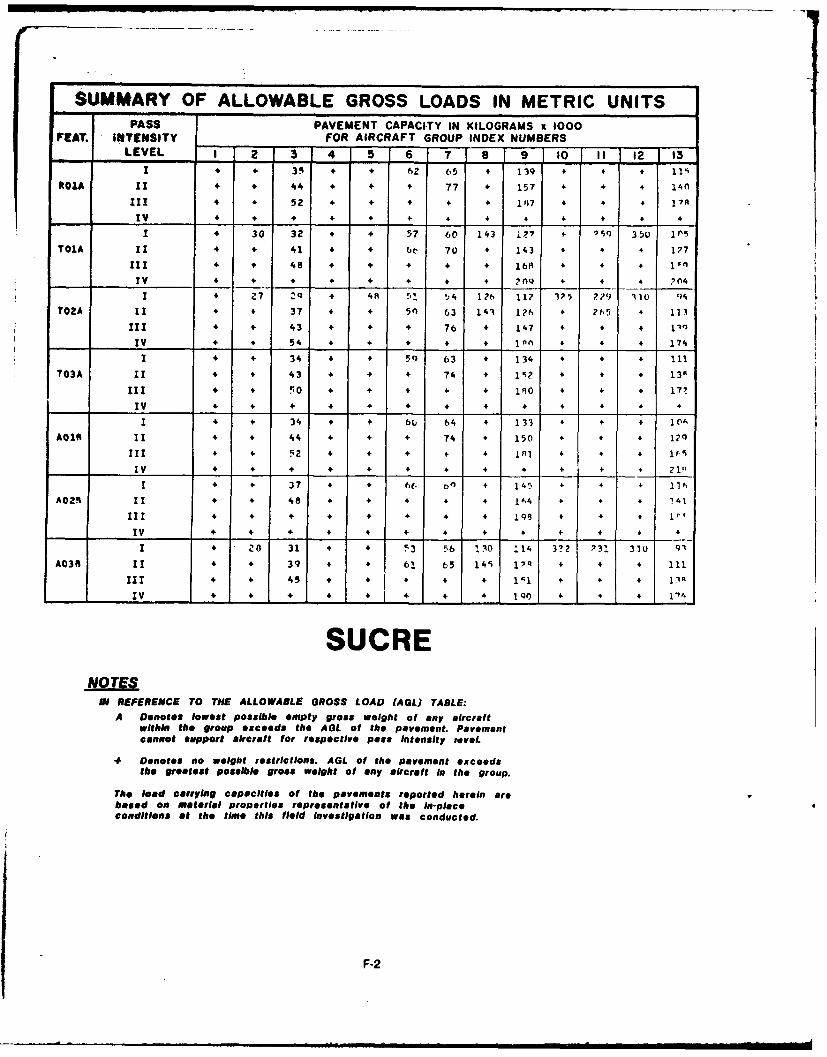
SUMMARY OF ALLOWABLE GROSS LOADS IN METRIC UNITSPASS PAVEMENT CAPACITY IN KILOGRAMS x 1000
PEAT. WTENSITY FOR AIRCRAFT GROUP INDEX NUMBERSLEVEL I 2 3 4 5 6 7 8 9 10 II 12 13
n A 4 A A 11 A A A A A A a A
ROiA II A 4 A A 11 A A A A A A A A
III A 4 A A 12 A A A A A A A A
IV A 5 A A 13 A A A A A A A A
1 16 6 A 39 17 10 A A A A A A A
RO2A 1T 17 6 A 39 17 10 A A A A A A A
II 17 7 A 40 1 20 A A A A A A A
IV 10 7 A 42 19 21 A A A A A A A
I A 5 A A 14 A A A A A A A A
RO3A II A 5 A A 14 A A A A A A A A
II! A 5 A A 14 A A A A A A A A
- V A 6 A 34 15 A A A A A A A A
+ * 11 23 68 29 33 43 77 67 214 124 155 A
R04A II + 12 23 69q 30 34 44 73 ' 8 215 127 1 $; A
I+! * 12 24 70 31 3. 45 79, AO 218 132 1f,4 A
IV + 13 Z4 73 34 37 4S 7R 73 V'3 140 175 71
I A 4 A A 0 A A A A A A A A
TOIA II A 5 A A 10 A A A A A A A A
III A 6 A A 13 A A A A A a A A
IV A 8 A 35 lb A A 47 A & A A A
I A A A A A A A A A A A A A
TO2C II A A A A A A A A A A A A A
III A A A A A A A A A A A A A
IV A A A A A A A A A A A A
I A 4 A A 11 A A A A A A A A
AOIB II A 4 A A 12 A A A A A A A A
111 A 4 A A 1Z A A A A A A A A
IV A 5 A A 13 A A A A A A A A
I A 10 A 48 21 23 A 67 62 152 120 10.f2 A
A028 II 17 13 A 56 25 27 A 7R 7L 17- 151 2U4 A
III ?0 16 A 72 32 34 A 07 R7 21A 20'" 272 A
IV * 22 24 + 47 40 g 129 114 P70 4 + n
I A 3 A A A A A A A A A A A
A03D IT A 4 A A 9 A A A A A A
I][ A 5 A A 11 A A A A A A A A
IV A 7 A 37 16 A A 51 A A 113 152
I A 3 A A 9 A A A A A A A A
A04 11 A 4 A A 10 A A A. A A A A A
1I1 A 5 A A 13 A A A A A A a A
IV A 7 A 40 10 10 A 5A A a 1213 17 A
I A A A A A A A A A A A A A
AOq 1T A A A A A A A A A A A A A
III A A A A A A A A A A A A A
IV A - -A A -A A A A A- A----
POTOSI
F-2
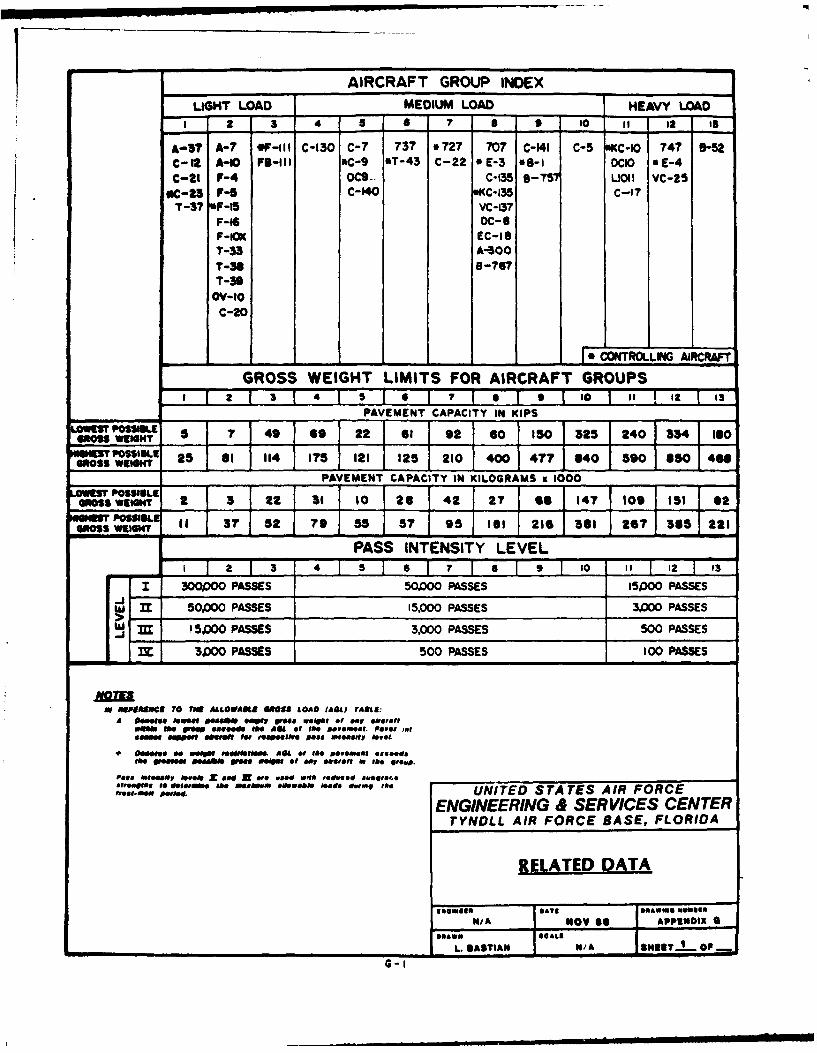
AIRCRAFT GROUP INDEXLIGHT LOAD MEDIUM LOAD HEAVY LOAD
ENGINEERING & SERVICES CENTER/ TYNDALL AIR FORCE BASE, FLORIDA
,,,. PHOTOGRAPH LOCATIONS- JUANA AZUROI DE PADILLA AIRPORT, (SUCRE) BOLIVIA
GAIINLSON IAUGUST 69 APPENDIX
ownSANTIAGO G~.DRAPHIC ISHEET .OF~
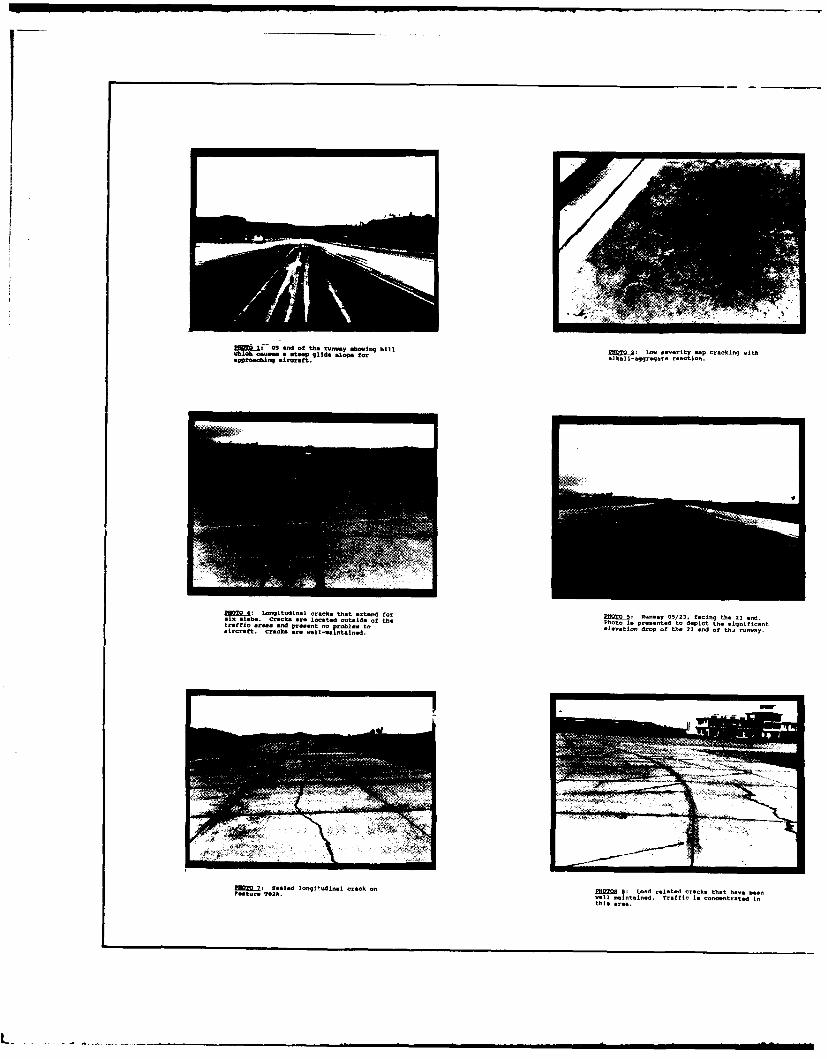
05 "Ad of the 0O y ahosilng hill to.O2:1 sevari ty ao cracking vithapsro. .ira ar laiat. .P - r alkali-aggrqoata reaction.
MMOA Locitudinal crack, that etsnd for P 5: cosy 05/23, facing the 23 and.six slabs. Cracks are located omtside or the Phot I. wa 05p.fcn h ]adtraffi al reas a c peet o t prob t photo I. presented to depict the significantircraft. Cracks are lla sno t.ind. elvation drop of the 23 and of th, romcy.
007Za lead lonqtudlcnl crack on PHMIDShB Load related track, that hos boenPatora ToIA. 0.11 maintalned. Trafcin I. concentrated in
this area.
L I
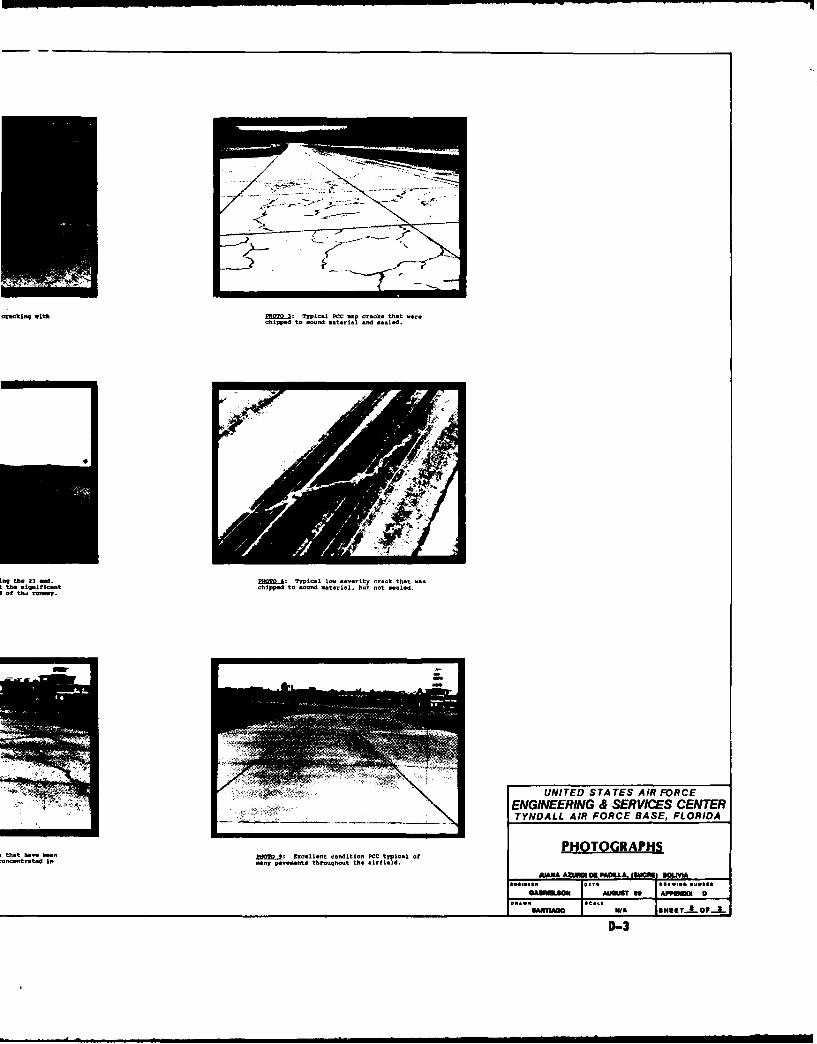
cracking with PH ?yptc i~ai PCC mp crack. that "arechipped to ma aterial and seoad.
nq~~~~~~~~ ~ ~ ~ ~ tM2,o.EQI~ yiallw:oiycokt
the~~~ ~ ~ ~ . jfcKchpe ondm i1bt o ald
that hiaeiobathpdt V-oord atcni.tio Potypasld.I ft..d inmnyp son.trogoty. ~f~d
PHOTGRAPHS M
f LAol.. Joe.. WA,. 8EC -or....
D-3
_ _8 ki IC if I Im
(.D CDC
P- C C C64
LAJ i L
E-1~
SUMMARY OF ALLOWABLE GROSS LOADS IN BRITISH UNITSPASS PAVEMENT CAPACITY IN KIPS
FEAT. INTENSITY FOR AIRCRAFT GROUP INDEX NUMBERSLEVEL I 2 3 4 5 6 7 8 9 1 0 i 12 13
IN REFERENCE TO THE ALLOWABLE GROSS LOAD (AGLJ TABLE:
A Denotes lowest possible empty gross weight of any aircraftwithin the group exceeds the AGL of the pavement. Pavementcannot support aircraft for respective pass Intensity level.
+ Denotes no weight restrictions. AGL of the pavement exceedsthe greatest possible gross weight of any aircraft In the group.
The load carrying capacities of the pavements reported hareln arebased on material properties representative of the In-placeconditions at the time this field Investigation was conducted.
F-i
SUMMARY OF ALLOWABLE GROSS LOADS IN METRIC UNITSPASS PAVEMENT CAPACITY IN KILOGRAMS x 1000
FEAT. INTENSITY FOR AIRCRAFT GROUP INDEX NUMBERSLEVEL I 2 3 4 5 6 7 8 9 IO 1 12 1 3
IN REFERENCE TO THE ALLOWABLE GROSS LOAD (AGL) TABLE:A Denotes lowest possible empty gross weight of any aircraft
within the group exceeds the AGL of the pavement. Pavementcannot support aircraft for respective pass intensity evOl.
+ Denotes no weight restrictions. AGL of the pavement exceedsthe greatest possible gross weight of any aircraft in the group.
The load carrying capacities of the pavements reported herein arebesed on material prooerties represents tive of the in-placeconditions at the time this field investigation was conducted.
F-2
AIRCRAFT GROUP INDEX -_"__
LIGHT LOAD MEDIUM LOAD HEAVY LOADI 2 3 4 5 6 7 a 9 IO II it is
GROSS WEIGHT Ii 37 52 79 55 57 95 1I l i 16 361 267 365 Il
PASS INTENSITY LEVEL2 3 4 5 16 7 8 9 10 1 13
1 300,000 PASSES 50,000 PASSES 150 PASSES
w fl 50,000 PASSES 15,000 PASSES 3,000 PASSES
, 15,00 PASSES 3,000 PASSES 500 PASSES
I X 3000 PASSES 500 PASSES 100 PASSES
My CFlEURECE TO TNS ALLOWAAS GOOS LOAD fAGLJ TASLE.
A Oeaeie$i0 M OSS" 0ea 1111 c W eO freight *o f any atetetal
40111,1 1"l~il OIW 41129011 i OLa I** 4I al. Paviement
SO11 MXMl I ~Of Of top W MOSS Il ifflemal y llol.¢,# * 14 A d, a.Welgt fooltteaa. ADL of the Movement oeppI"e 0.eoo ae goee wet of say averaft is too greow.
pass feaaedv level. K sod N ev we *es Voish redued subgra~. _________________________________
proIettn aegme i me. eiU&TED STATES AIR FORCE
ENGINEERING & SERVICES CENTERTYNDLL AIR FORCE BASE, FLORIDA
RELATED DATA
6116#11l4' OA -,iIN matlUlC
N/A NOV is APPINOIX Q
L. BASTIAN N/A INETIT.. OF
G-i
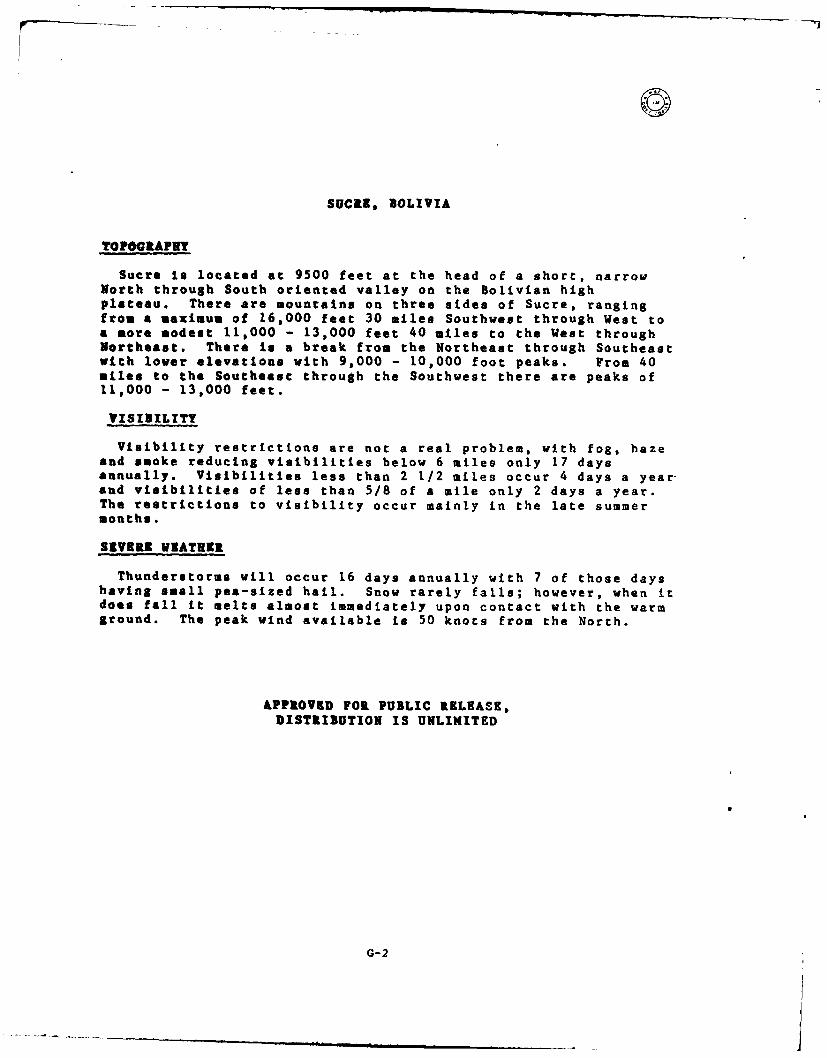
SUCRE, BOLIVIA
TOPOGRAPEY
Sucre is located at 9500 feet at the head of a short, narrowNorth through South oriented valley on the Bolivian highplateau. There are mountains on three sides of Sucre, rangingfrom a maximum of 16,000 feet 30 miles Southwest through West toa more modest 11,000 - 13,000 feet 40 miles to the West throughNortheast. There is a break from the Northeast through Southeastwith lover elevations with 9,000 - 10,000 foot peaks. From 40miles to the Southeast through the Southwest there are peaks of11,000 - 13,000 feet.
VISIBILITY
Visibility restrictions are not a real problem, with fog, hazeand smoke reducing visibilities below 6 miles only 17 daysannually. Visibilities less than 2 1/2 miles occur 4 days a year-and visibilities of less than 5/8 of a mile only 2 days a year.The restrictions to visibility occur mainly in the late summermonths.
SEVERE VEATEER
Thunderstorms will occur 16 days annually with 7 of those dayshaving small pea-sized hail. Snow rarely falls; however, when itdoes fall it melts almost immediately upon contact with the warmground. The peak wind available is 50 knots from the North.
APPROVED FOR PUBLIC RELEASK,DISTRIBUTION IS UNLIMITED