Michael B. Bragg and Andy P. Broeren University of Illinois at Urbana-Champaign, Urbana, Illinois Harold E. Addy, Jr. and Mark G. Potapczuk Glenn Research Center, Cleveland, Ohio Didier Guffond and E. Montreuil ONERA, Chatillon, France Airfoil Ice-Accretion Aerodynamics Simulation NASA/TM—2008-214830 January 2008 AIAA–2007–0085 https://ntrs.nasa.gov/search.jsp?R=20080013293 2018-07-11T21:49:08+00:00Z
Transcript
Michael B. Bragg and Andy P. BroerenUniversity of Illinois at Urbana-Champaign, Urbana, Illinois
Harold E. Addy, Jr. and Mark G. PotapczukGlenn Research Center, Cleveland, Ohio
Didier Guffond and E. MontreuilONERA, Chatillon, France
Since its founding, NASA has been dedicated to theadvancement of aeronautics and space science. TheNASA Scientific and Technical Information (STI)program plays a key part in helping NASA maintainthis important role.
The NASA STI Program operates under the auspicesof the Agency Chief Information Officer. It collects,organizes, provides for archiving, and disseminatesNASA’s STI. The NASA STI program provides accessto the NASA Aeronautics and Space Database and itspublic interface, the NASA Technical Reports Server,thus providing one of the largest collections ofaeronautical and space science STI in the world.Results are published in both non-NASA channels andby NASA in the NASA STI Report Series, whichincludes the following report types:
• TECHNICAL PUBLICATION. Reports ofcompleted research or a major significant phaseof research that present the results of NASAprograms and include extensive data or theoreticalanalysis. Includes compilations of significantscientific and technical data and informationdeemed to be of continuing reference value.NASA counterpart of peer-reviewed formalprofessional papers but has less stringentlimitations on manuscript length and extent ofgraphic presentations.
• TECHNICAL MEMORANDUM. Scientificand technical findings that are preliminary orof specialized interest, e.g., quick releasereports, working papers, and bibliographies thatcontain minimal annotation. Does not containextensive analysis.
• CONTRACTOR REPORT. Scientific andtechnical findings by NASA-sponsoredcontractors and grantees.
• CONFERENCE PUBLICATION. Collectedpapers from scientific and technicalconferences, symposia, seminars, or othermeetings sponsored or cosponsored by NASA.
• SPECIAL PUBLICATION. Scientific,technical, or historical information fromNASA programs, projects, and missions, oftenconcerned with subjects having substantialpublic interest.
• TECHNICAL TRANSLATION. English-language translations of foreign scientific andtechnical material pertinent to NASA’s mission.
Specialized services also include creating customthesauri, building customized databases, organizingand publishing research results.
For more information about the NASA STIprogram, see the following:
• Access the NASA STI program home page athttp://www.sti.nasa.gov
• Fax your question to the NASA STI Help Deskat 301–621–0134
• Telephone the NASA STI Help Desk at301–621–0390
• Write to: NASA Center for AeroSpace Information (CASI) 7115 Standard Drive Hanover, MD 21076–1320
Michael B. Bragg and Andy P. BroerenUniversity of Illinois at Urbana-Champaign, Urbana, Illinois
Harold E. Addy, Jr. and Mark G. PotapczukGlenn Research Center, Cleveland, Ohio
Didier Guffond and E. MontreuilONERA, Chatillon, France
Airfoil Ice-Accretion Aerodynamics Simulation
NASA/TM—2008-214830
January 2008
National Aeronautics andSpace Administration
Glenn Research CenterCleveland, Ohio 44135
Prepared for the45th Aerospace Sciences Meeting and Exhibitsponsored by the American Institute of Aeronautics and AstronauticsReno, Nevada, January 1–8, 2007
AIAA–2007–0085
Acknowledgments
The authors wish to thank the NASA Glenn Icing Research Tunnel for their assistance in the two IRT ice accretion testprograms completed as part of this program. The staff of the ONERA F1 tunnel have provided excellent support in planningthe upcoming tunnel tests. Thanks to the machinists in the Aerospace Engineering Shop at the University of Illinois who aremanufacturing the full-scale cast ice shapes. Greg Busch at the University of Illinois was responsible for the aerodynamictesting in the Illinois tunnel and deserves our thanks as well as Leia Blumenthal who contributed early on in the ice shape
classification research. Dr. Sam Lee supported the testing at the IRT. In addition the University of Illinois authors acknowledgeNASA Glenn Research Center (grant NCC3–1039) for their support of this program.
Available from
NASA Center for Aerospace Information7115 Standard DriveHanover, MD 21076–1320
National Technical Information Service5285 Port Royal RoadSpringfield, VA 22161
Available electronically at http://gltrs.grc.nasa.gov
Level of Review: This material has been technically reviewed by technical management.
NASA Glenn Research Center, ONERA and the University of Illinois are conducting a
major research program whose goal is to improve our understanding of the aerodynamic scaling of ice accretions on airfoils. The program when it is completed will result in validated scaled simulation methods that produce the essential aerodynamic features of the full-scale iced-airfoil. This research will provide some of the first, high-fidelity, full-scale, iced-airfoil aerodynamic data. An initial study classified ice accretions based on their aerodynamics into four types: roughness, streamwise ice, horn ice, and spanwise-ridge ice. Subscale testing using a NACA 23012 airfoil was performed in the NASA IRT and University of Illinois wind tunnel to better understand the aerodynamics of these ice types and to test various levels of ice simulation fidelity. These studies are briefly reviewed here and have been presented in more detail in other papers. Based on these results, full-scale testing at the ONERA F1 tunnel using cast ice shapes obtained from molds taken in the IRT will provide full-scale iced airfoil data from full-scale ice accretions. Using these data as a baseline, the final step is to validate the simulation methods in scale in the Illinois wind tunnel. Computational ice accretion methods including LEWICE and ONICE have been used to guide the experiments and are briefly described and results shown. When full-scale and simulation aerodynamic results are available, these data will be used to further develop computational tools. Thus the purpose of the paper is to present an overview of the program and key results to date.
I. Introduction In many applications, simulation of an ice accretion geometry on a wing or other surface is required for
aerodynamic evaluation. The measurement of aerodynamic performance from an aircraft or wing with actual ice accretions is very difficult and expensive and seldom a practical solution. Aircraft performance with ice accreted in flight are available,1-3 but limited, due to the cost and difficulty in acquiring these data. In flight it is difficult to document the ice accretion conditions and geometry accurately. For accretions formed in an icing wind tunnel the inability to provide adequate instrumentation, nonuniformity of the cloud over the model, poor aerodynamic flow quality, and cost also make aerodynamic measurements difficult and rare. The most common way to acquire iced-airfoil and wing data is to use simulated accretions in a dry-air wind tunnel.
Abstract
NASA/TM—2008-214830 1
Airfoil Ice-Accretion Aerodynamics Simulation
Michael B. Bragg and Andy P. Broeren University of Illinois at Urbana-Champaign
Urbana, Illinois 61801
Harold E. Addy, Jr. and Mark G. Potapczuk National Aeronautics and Space Administration
Glenn Research Center Cleveland, Ohio 44135
Didier Guffond and E. Montreuil
ONERA Chatillon, France F-92322
The best current technology for accurate ice accretion simulation is the mold and casting method developed at NASA Glenn.4 In this method molds are made from an ice accretion generated in an icing wind tunnel, such as the NASA Icing Research Tunnel (IRT). From these molds ice accretion castings are made that maintain the major features of the ice including the detailed surface roughness and the spanwise and chordwise variations. These castings are then typically attached to wings and airfoils, and instrumented to obtain high-fidelity aerodynamic data.5-7 This is an expensive process and not practical for many situations, but does generate benchmark data for iced-airfoil and wing research.
While much of our understanding of ice accretion aerodynamics is anchored by cast ice simulation data, there have been very few studies employing full-scale ice accretion cast shapes aerodynamically tested at full-scale Reynolds number and Mach number. The second FAA/NASA Tailplane Icing Program provides full-scale, cast-ice performance data at full-scale Reynolds and Mach number, but the ice shapes were applied to a fully three-dimensional tailplane model.8 The NASA Modern Airfoils Program9 currently provides the best airfoil performance data set at flight Reynolds and Mach numbers, but due to size limitations in the NASA Low-Turbulence Pressure Tunnel (LTPT) used for the aerodynamic testing, the ice accretions were obtained on a 3-foot (0.91-m) chord airfoil. Ice accretion scaling methods can provide scaling of the gross ice shape for moderate scales,10 but not of the roughness and ice shape details known to be aerodynamically important in some cases.
The simulation of ice accretions on airfoils and wings is needed or desirable for many applications. For flight tests or wind-tunnel tests of iced airfoils for certification or research, cast ice shapes are seldom available and simulations are required. Often wind tunnel testing requires scale models for which no castings are available and small-scale simulations are needed. Computational methods need to model ice on airfoils and wings and it is either impossible or impractical to model a full, rough 3-D accretion. Simpler geometries that accurately represent the key aerodynamic features are needed. Currently we have only a limited understanding of how to accurately simulate the aerodynamic effect of ice accretion on lifting surfaces. Accurate simulations need to be based on an understanding of the fundamental flow physics for the simulations to be robust under a wide range of geometries and flow conditions. Here we describe a computational and experimental program using scale and full-scale aerodynamic data to develop the physical understanding and scaling methods for ice-shape classifications based on known flow physics.
Thus the research program described in this paper addresses the iced-airfoil aerodynamic simulation and scaling issue. The program is a joint effort between NASA Glenn, the French research organization ONERA, and the University of Illinois. The goal is to provide for the first time, high-fidelity, full-scale, iced-airfoil aerodynamic data and validated scaled simulation methods that produce the essential full-scale aerodynamic features. Preliminary results of this program have been presented in previous papers.11-14 The purpose of the current paper is to present an overview of the program and key results to date.
To optimize our use of the expensive full-scale aerodynamic facility, ice accretion and aerodynamic testing were done in scale initially. The NACA 23012 airfoil was chosen for this research program as representative of a family of airfoils commonly used in industry and has shown in many cases to be aerodynamically sensitive to ice accretion. Thus aerodynamic penalties are amplified and a more severe testing of the simulation methods results.
II. Initial Research Results and Plans A research program was designed to provide a validated ice accretion simulation method for iced-airfoil
aerodynamics. The plan includes both full-scale and subscale ice accretion and aerodynamic wind-tunnel testing in several phases. By using subscale testing whenever possible to minimize the expense of full-scale testing, and as a way to validate the scaled ice accretion simulations, an efficient and cost effective program was designed. Phase I: Ice-Shape Classification
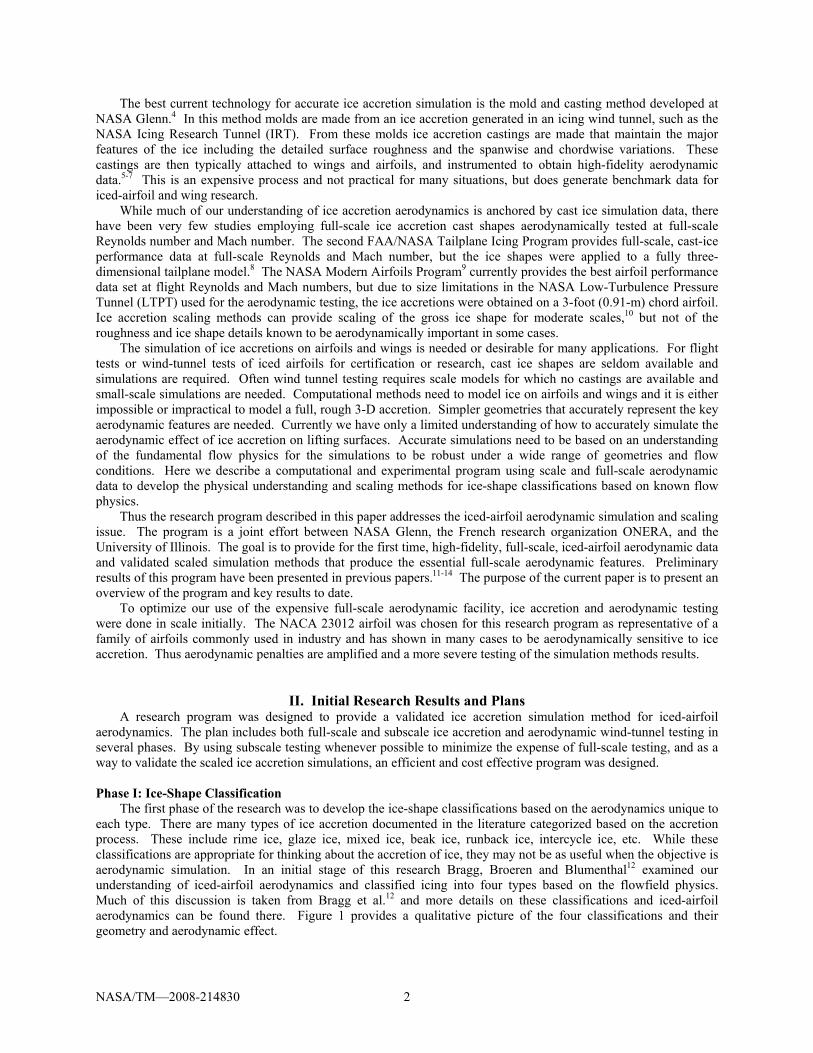
The first phase of the research was to develop the ice-shape classifications based on the aerodynamics unique to each type. There are many types of ice accretion documented in the literature categorized based on the accretion process. These include rime ice, glaze ice, mixed ice, beak ice, runback ice, intercycle ice, etc. While these classifications are appropriate for thinking about the accretion of ice, they may not be as useful when the objective is aerodynamic simulation. In an initial stage of this research Bragg, Broeren and Blumenthal12 examined our understanding of iced-airfoil aerodynamics and classified icing into four types based on the flowfield physics. Much of this discussion is taken from Bragg et al.12 and more details on these classifications and iced-airfoil aerodynamics can be found there. Figure 1 provides a qualitative picture of the four classifications and their geometry and aerodynamic effect.
NASA/TM—2008-214830 2
The first classification to be discussed, ice roughness, occurs during the initial stages of the accretion process before a significant ice shape, such as a horn, is accreted. The other three ice types are also “rough,” but here the initial surface roughness does not significantly alter the airfoil contour and thus the inviscid flowfield. Ice roughness may be associated with glaze, rime or mixed conditions and also from ice-protection system operation. A key aerodynamic feature of ice roughness is that it is usually much larger than the local boundary-layer thickness, at typical flight Reynolds number, even at the very early stages of development. These roughness elements then each act as bluff bodies with their own 3-D separated flowfield. In fact, the distinguishing characteristic of ice roughness and the other types of ice can be described in terms of the extent of boundary-layer separation. Ice shapes of the streamwise, horn or spanwise ridge categories are characterized by separated flow regions that are primarily 2-D with characteristic lengths that are large compared to the height of the ice accretion. In contrast, the separated flow regions generated by the ice roughness are fundamentally 3-D, are very local to the roughness elements, and are of similar scale as the roughness itself.
Roughness is characterized by its height, density (or concentration) and surface location. The effect on airfoil performance is dependent upon all of these parameters. Roughness shape can also be significant, but of the irregular shapes seen in ice roughness it is not thought to be as important, and is certainly less well understood than the other three parameters. Roughness affects airfoil performance by first directly increasing the skin friction. Roughness can also cause early boundary-layer transition and promote thickening of the boundary layer leading to early trailing-edge separation. These effects then manifest themselves through modified skin friction and pressure distributions into performance degradation—increased drag and decreased maximum lift.
Longer icing exposures can cause roughness to build into horn ice, usually associated with glaze, or clear, icing conditions. The horn-ice shape can be characterized by its height (k), angle it makes with the chord line (θ) and its location indicated by s/c, the non-dimensional surface length. The most pervasive feature of the horn-ice flowfield is the large separation bubble that forms downstream of the horn. The stagnation point is usually located on the ice shape and the boundary layer cannot negotiate the large adverse pressure gradient encountered at the tip of the horn. Thus the separation location remains relatively fixed at the horn tip over a large angle of attack range. The separated shear layer undergoes transition to turbulent flow and then usually reattaches to the airfoil surface downstream. The presence of this separation bubble causes a large redistribution of pressure that results in pitching moment changes and decreased lift. The presence of the bubble greatly increases the airfoil drag. This flowfield is also known to be unsteady and three-dimensional. These aspects make computational simulation extremely challenging. Therefore, understanding the behavior of the separation bubble is key to understanding horn-ice aerodynamics.
For this shape it is somewhat paradoxical that the separation bubble features that makes the flow complicated for analysis and computational simulations at the same time simplifies the effects on lift, drag and pitching moment. For example, several studies15-17 have shown that very simple geometries, such as a leading-edge spoiler can reproduce the performance characteristics of a horn ice shape. In fact, this is addressed later in this paper and by Busch et al.18 in much more detail. The point is that a simple geometry representing the height, angle and location of the ice horn, essentially generates an equivalent separation bubble on the airfoil, and hence, very similar performance results. Also, the addition of surface roughness is shown in some studies6,15,18,19 to have only minor effects on the integrated performance.
Streamwise ice has the smallest effect of the non-roughness ice accretions as depicted in Fig. 1 and has received the least attention in the literature. Therefore, an understanding of the aerodynamics of these accretions is not as developed as for the horn and spanwise-ridge ice. Streamwise ice is often formed as a result of rime icing conditions that occur at cold temperatures when the incoming droplets freeze on the surface upon impingement. As a result of this phenomena, the initial ice accretion forms following the contour of the airfoil surface. At large accretion times, or when the icing conditions are otherwise appropriate, streamwise-ice shapes can occur that are not as conformal to the original airfoil surface and may grow a horn-like feature into the flow. In some cases flow separation may result as with horn ice. However, these separation bubbles tend to be much smaller and therefore
Fig. 1 Qualitative description of aerodynamic effects for various iced-airfoil flowfields.12
NASA/TM—2008-214830 3
have less of an effect on overall flowfield and aerodynamic performance. This means that other flowfield features, such as trailing-edge separation play at least an equal role in the aerodynamics. For streamwise ice, the specific ice geometry and surface roughness can be important factors in the aerodynamics.
For the streamwise ice geometries that are conformal to the airfoil leading edge, the stagnation point at moderate lift coefficients occurs on the ice shape and the boundary layer remains attached as it flows around the leading edge of the ice and downstream on the upper surface. Since the streamwise ice/airfoil intersection is not smooth, an adverse pressure gradient may exist in this area and flow separation may occur in the junction region. The flow separation location is not fixed to a specific point on the ice shape as it is to the tip for a horn shape, but can move upstream or downstream depending upon the angle of attack and incoming boundary-layer state which depends on the surface roughness, Reynolds number, etc. For a streamwise ice shape having a horn-like feature oriented into the flow direction, a larger separated flow region may exist especially at higher angle of attack. These separation bubbles are typically much smaller than for horn ice and thus do not have as large of an effect on the stall mechanisms. Spanwise-ridge ice accretions are perhaps most often associated with SLD-type icing conditions. Usually these accretions form downstream of leading-edge ice-protection systems and, despite their association with SLD, can occur for all drop size ranges. Runback icing can form ridge accretions and occurs when there is a heated leading-edge ice-protection system not operating at 100% evaporation. Water flows back on the surface from the heated section to freeze downstream on the cooler, unheated surface. Due to the formation mechanisms just described, ridges often exhibit extensive spanwise variation in their geometry. These properties, and the associated flowfield, make the spanwise ridge-type accretion very different from the horn shapes discussed previously. As indicated in Fig. 1, the spanwise-ridge ice can have more severe aerodynamic effects and the shapes themselves are typically more 3-D than horn shapes. Spanwise ridges are generally located farther downstream than horns or streamwise shapes. This distance allows the boundary layer to develop and perhaps transition or to become transitional due to small ice roughness upstream of the spanwise ridge. Thus the spanwise ridge has the characteristic of a flow obstacle.
The unique characteristics of the ridge, large spanwise variation and downstream location, make the resulting aerodynamics and performance different from the horn-ice case. The only similarity is the large separation bubble downstream of the spanwise ridge that can be complex, 3-D and highly unsteady. Spanwise ridges also have a separation bubble upstream of the ridge because the ridge is located well downstream of the stagnation point. This upstream separation can be a further challenge for computational simulation. The fact that the ridge is located well downstream of the stagnation point also amplifies the effect of airfoil geometry, characterized by a clean airfoil pressure distribution, much more so than in the horn case.
The aerodynamics of spanwise ridges are dependent upon the ridge geometry, size, location and airfoil section. In the case of geometry, Lee and Bragg20 tested four different shapes of simulated spanwise ridges: forward facing quarter round, backward facing quarter round, half round and forward facing ramp all having the same maximum height on the NACA 23012m airfoil. The result was a large variation in iced Cl,max from 0.25 for the airfoil with the forward facing quarter round and ramp to up to 0.55 for the airfoil with the half round simulation. Perhaps a much more important result is the effect of location and airfoil geometry. Lee and Bragg20 showed the variation in maximum lift penalty with the spanwise-ridge chordwise location and related the most critical location to the pressure distribution on the clean airfoil.
This brief summary of the salient characteristics of each ice-shape type presents a convenient classification of iced-airfoil aerodynamics. Real ice shapes may not fit neatly into only one classification and of course, it is not realistic to think of these classifications as rigid, or unchanging. Undoubtedly more research will yield greater insight into the aerodynamics and may lead to further development of these concepts. Perhaps an additional classification will be added in the future. Future considerations notwithstanding, the present analysis formed the foundation for the research described in this paper. Phase II: Subscale Model Ice Accretion Testing
The objective of this phase was to obtain high-fidelity ice shapes having characteristics of the four types described in Phase I. To obtain these ice shapes, a subscale model was subjected to simulated, in-flight icing conditions in an icing wind tunnel. The icing conditions were based upon the in-flight icing environment a commuter aircraft might encounter. Molds were made of the ice accreted on the model under these conditions. Castings were then made from these molds and used as the high-fidelity ice shapes for the tests in Phase III. Note that the purpose here was not to produce scaled ice accretion geometry, but to generate ice molds that were representative of the four ice classifications to use for aerodynamic simulation development in Phase III.
NASA/TM—2008-214830 4
The subscale ice accretions were acquired in the NASA Glenn Research Center’s Icing Research Tunnel (IRT). The NACA 23012 airfoil model used in this phase of the testing had a 1.5-foot (0.46-m) chord and spanned the height of the IRT test section (6-feet, 1.83-m). The model was equipped with pressure taps that facilitated model alignment and a removable leading edge section that facilitated the molding of selected ice accretions. For the spanwise-ridge ice accretion, an electric foil heater was attached to the removable leading edge. Icing conditions and heater settings were adjusted to create a situation where water would runback over the heater and then freeze as a spanwise ridge downstream of the heater on both the upper and lower surfaces of the model. A photograph of the model in the IRT is shown in Fig. 2.
Selecting the icing conditions for this phase of the program began by considering a full-scale commuter aircraft operating in various natural icing environments. A representative commuter aircraft with a wing section similar to the NACA 23012 airfoil was reviewed and analyzed in terms of aircraft weight, airspeeds, lift requirements, etc. The analysis provided information on the desired airspeeds and model angles of attack to use in the testing. Icing cloud conditions were initially selected from the FAA’s Appendix C icing envelopes. Icing scaling methods were then applied to help attain reasonable similarity in impingement limits, collection efficiency, freezing fraction, accumulation parameter, etc. Further adjustments to the icing conditions were made so that the testing conditions fell within the IRT’s operating envelope.
Analysis of the testing conditions was conducted using the LEWICE ice accretion software program and is discussed in more detail later in Section VII. LEWICE cases were run for the various icing conditions for both the full-scale and subscale models. This analysis helped to ensure the resulting ice accretions were both a) representative of actual inflight icing conditions and b) exhibited the geometric features that would produce the four classifications of ice shapes determined in Phase I of this study. Table 1. Subscale Ice Accretions Selected for Aerodynamic Testing
The ice accretions produced in the IRT were recorded using photographs, ice tracings, and ice depth measurements. When a particular ice accretion was selected for Phase III testing, the accretion was repeated and a mold was made for that run. Molds were made of a total of sixteen ice accretions. Six of these were horn accretions, four were streamwise accretions, and there were three each of both the roughness and spanwise ridge accretions. Castings were subsequently made from each of these molds. The best representatives of the four classifications of ice shapes determined in Phase I then formed the reference ice shapes for aerodynamic testing in Phase III. Table 1 provides the test conditions for these four ice accretions.
Fig. 2 Subscale NACA 23012 ice accretion model installation in NASA IRT.
NASA/TM—2008-214830 5
Phase III: Subscale Model Aerodynamic Testing Phase III of the program focused on exploring simulation
methods for selected ice accretions in each of the four classifications. Since each of the four classifications has different fundamental aerodynamics, if techniques can be developed to simulate these four shapes, most ice accretions found in practice can be simulated. A variety of simulation methods can be found in the literature and in practice and were categorized for the subscale testing. The simulation categories or methods considered were: 3-D castings, 2-D smooth, simple geometry and simple geometry with spanwise variation. To account for the roughness associated with ice accretion, distributed roughness may be added to each of the non-casting simulation methods. The highest fidelity simulation method is considered to be the 3-D casting, since this is manufactured directly from a mold of the ice accretion. It is considered the benchmark for aerodynamic data that the other simulation methods are evaluated against. The purpose of this subscale testing was to explore many variations of the simulation methods in order to evaluate their ability to reproduce the proper iced-airfoil aerodynamics. In this way, the accuracy of the various simulation methods was systematically quantified. Quantifying this accuracy at small scale and understanding the aerodynamic differences of the simulation methods is key to successfully executing Phase VI of this program.
The ice accretions selected in each of the four categories are shown in Figs. 3–6. Figure 3 shows the ice accretion typical of initial roughness (cf Phase II). There is a very smooth zone on the leading edge in the stagnation-point region, followed by distributed roughness downstream. Tracings for this type of ice shape were not obtained due to the inability of the ice tracing method to adequately capture such geometric features. The horn shape shown in Fig. 4 is a classic glaze ice shape with an upper and lower horn structure typical for this icing condition. The streamwise shape shown in Fig. 5 is typical of a rime ice condition, having a smooth zone in the stagnation region with rime feathers and roughness downstream. Finally, the spanwise-ridge shape is shown in Fig. 6. There is both an upper and lower-surface ridge that formed due to freezing of water running downstream off of the heated surface. Casting simulations were manufactured for aerodynamic testing from molds of each of these accretions.
The various lower-fidelity simulation methods are described in detail by Busch et al.18 and are summarized here using the horn-ice shape as an example. The 2-D smooth simulation has been used in previous work.6-9 A digitized pencil tracing of the ice shape was processed using SmaggIce.21 This NASA software assists in removing point anomalies that often occur in digitized pencil tracings. It can also be used for smoothing, however, for this example no smoothing was performed with SmaggIce. This tracing was then “extruded” across the model. The resulting shape is shown in Fig. 7. The simple-geometry simulation method entails replacing the major ice features with basic geometric shapes. An example of this for the horn example is shown in Fig. 7. The upper and lower surface horn structures have been replaced with rectangular shapes that mimic the height, angle and surface location. This simulation method is also based on previous work by Papadakis,15-17 who used “spoiler-ice” simulations and Kim and Bragg.22 Other variations of the simple geometry were also considered including a simulation where the horns had a periodic spanwise variation in height based on measurements of the casting simulations. Both the 2-D smooth and the simple-geometry simulations were also tested with various sizes of roughness applied.
Fig. 3 Photograph of roughness shape ED0762.
x/c
y/c
-0.05 0.00 0.05 0.10 0.15-0.10
-0.05
0.00
0.05
0.10
Fig. 4 Tracing and photograph of horn shape ED0735.
NASA/TM—2008-214830 6
The subscale model aerodynamic testing was carried out at the University of Illinois using the low-speed, low-turbulence wind tunnel. This facility has a 3-ft by 4-ft test section capable of speeds up to 160 mph. An 18-inch chord NACA 23012 model was designed and built specifically for this program. For this model, the Reynolds number was 1.8×10⁶, corresponding to a Mach number of 0.18. The lift and pitching moment were acquired from a floor mounted force balance. Surface static pressures were measured and also used to determine the lift and pitching moment. The drag was measured via wake survey using momentum-deficit methods.
Figure 8 shows a picture of the NACA 23012 model installed in the University of Illinois wind tunnel. The model was designed with interchangeable leading edges that facilitated the various ice simulations. There was a baseline leading edge having the NACA 23012 profile that was used to document the uniced, or clean, airfoil performance. There were two ice leading edges having truncated nose geometry that allowed for the attachment of the ice simulations. The simulations bolted on to this leading edge and thus had a rigid, repeatable mounting system. The model had a main chordwise row of pressure taps, a secondary chordwise row and a set of spanwise taps on the upper surface. The ice-shape simulations also had pressure taps installed. In preparation for this work, a detailed study was made regarding pressure tap installation in ice simulations and those results were applied to this work.13,14 More details of the simulations, experimental methods and model can be found in Busch et al.18,23
x/cy/
c-0.05 0.00 0.05 0.10 0.15
-0.10
-0.05
0.00
0.05
0.10
Fig. 5 Tracing and photograph of streamwise shape ED0730
x/c
y/c
-0.05 0.00 0.05 0.10 0.15 0.20-0.10
-0.05
0.00
0.05
0.10
0.15
Fig. 6 Tracing and photograph of spanwise ridge shape ED0760.
x/c
y/c
-0.05 0.00 0.05 0.10 0.15-0.10
-0.05
0.00
0.05
0.10 Airfoil2-D smoothSimple Geometry
Fig. 7 Comparison of 2-D smooth and simple-geometry simulation for horn shape ED0735.
NASA/TM—2008-214830 7
A summary of the aerodynamic results for the four ice shapes listed in Table 1 is presented in Fig. 9. The ice simulations in this case were all castings of the ice accretion, considered the highest fidelity. The data show the striking similarities in the integrated performance for the airfoil with roughness shape ED0762 and the streamwise shape ED0730 (cf. Figs. 3 and 5), despite the differences in size, shape and icing conditions. This was likely due to the location of both ice shapes being on the airfoil leading edge. At this location, the size of any ice roughness (or small accretion) is large compared to the local boundary-layer thickness. Kim and Bragg22 observed similar results for geometric ice-shape simulations located on the leading edge of an NLF-0414 airfoil. The horn shape had the largest effect on Cl and Cm, particularly evident in the Cm was the deviation from the clean values resulting from the large redistribution of surface pressure by the separation bubble(s) aft of the horn(s). It is interesting that while the horn shape had the largest effect on Cl and Cm, the drag penalty was less than for the spanwise-ridge shape over the interval -4 < α < 4 deg. Outside of this interval, the spanwise-ridge shape had a lower overall drag penalty than for the airfoil with the horn shape. The Cm characteristics for the spanwise-ridge shape illustrate the effect of the larger size ridge located on the lower surface that resulted in much greater deviation in Cm at negative angle of attack. The stall characteristics for the airfoil with this shape are also more ambiguous than for the other shapes and are reminiscent of the thin-airfoil stall type.24 Judging by the break in the Cm curve, the stall angle appears to be near 8 deg., which was accompanied by an attendant slope change in the Cl curve, while Cl continued to increase with angle of attack up to 14.4 deg.
The aerodynamic effect of various fidelity simulations is shown for the streamwise-ice shape in Fig. 10. In terms of lift variation with angle of attack, similar results were observed for the castings and simple-geometry simulations. The airfoil with the 2-D smooth simulation had a slightly higher Cl,max. The simple-geometry simulation yielded pitching moment behavior that was closer to the uniced airfoil than for the airfoil with the casting simulation, while the 2-D smooth simulation more closely matched the casting. This same trend was also reflected in the drag data over the interval -5 < α < 9 deg. These data indicate that the ice roughness associated with the casting simulation, but not present on the other two simulations plays an important role in the aerodynamics. This is consistent with the notion that large-scale boundary-layer separation is not a significant flowfield feature for this ice-shape classification. Instead, characteristics like trailing-edge separation are likely more significant. In this case, the amount of roughness present can affect the boundary layer downstream of the ice simulation leading to different trailing-edge separation behavior. This effect is shown in Fig. 11 where there is a deviation of upper-surface pressure for the airfoil with the casting simulation from the clean airfoil aft of x/c = 0.60. This deviation in pressure likely indicates boundary-layer separation. The effect of the addition of roughness to the 2-D smooth simulation on the integrated performance is illustrated in Fig. 12. Glass microbeads with k/c = 0.0009 (35-40 grit size) applied to the 2-D simulation resulted in very similar iced-airfoil performance to the airfoil with the casting simulation over a large angle of attack range. Increasing this roughness size to k/c = 0.0033 and 0.0026 (14 and 20 grit carborundum grains, respectively), resulted in more severe performance penalties. What is not clear, and is a part of this ongoing research, is what scale sets the size of the roughness. That is, looking at the roughness on the casting, it appears to be of a physical size and shape more akin to the k/c = 0.0033 and 0.0026 carborundum grains. The k/c = 0.0009 microbeads seem much smoother than the ice roughness on a qualitative level, yet produce the best match in terms of integrated performance.
Fig. 8 Subscale NACA 23012 aerodynamic model installation in University of Illinois wind tunnel.
Fig. 9 Aerodynamic performance comparison for the NACA 23012 model with the casting simulations.
α (deg)-8 -6 -4 -2 0 2 4 6 8 10 12 14 16 18 20
-0.8
-0.6
-0.4
-0.2
0.0
0.2
0.4
0.6
0.8
1.0
1.2
1.4
1.6
-0.08
-0.06
-0.04
-0.02
0.00
0.02
0.04
0.06
0.08
0.10
0.12
0.14
0.16
Cl Cm
α (deg)-8 -6 -4 -2 0 2 4 6 8 10 12 14 16
0.00
0.01
0.02
0.03
0.04
0.05
CleanCasting2-D SmoothSimple Geometry
Cd
Fig. 10 Aerodynamic performance comparison of simulation fidelity for streamwise ice shape ED0730 on the NACA 23012 model.
NASA/TM—2008-214830 9
It is possible that there are also roughness concentration effects that may be significant, as well as more complicated coupling between the roughness and gross ice shape effects. Performance comparisons for initial ice accretion roughness simulation are summarized in Fig. 13. In this case there is no 2-D smooth simulation because the ice accretion was simply classified as roughness. So the various simulations were k/c = 0.0009 glass microbeads, and k/c = 0.0033 and 0.0026 carborundum grains. In the simulations, the smooth zone near the stagnation point (cf. Fig. 3) was preserved and the roughness was applied to the upper and lower surface. The lift and pitching moment data indicate some sensitivity to the roughness size, with the k/c = 0.0026 case having the best overall match. The real challenge for roughness simulation, however, lies in the drag. As the data indicate, it was difficult to match the drag increase resulting from the casting simulation on the airfoil. The drag data indicate that the k/c = 0.0009 roughness simulation offers the closest match to the casting for lower angle of attack while the k/c = 0.0026 roughness simulation offers the closest match at higher angle of attack. These data suggest that further experiments be conducted where different grit sizes are used on the upper and lower surface. In this case, using k/c = 0.0026 roughness on the upper surface and k/c = 0.0009 on the lower surface seems like the first logical combination. Furthermore, estimates of the actual roughness size on the casting indicate that this offers the best geometric size match as well.
Fig. 12 Aerodymanic performance comparison of roughness applied to the 2-D smooth streamwise ice shape ED0730 simulations on the NACA 23012 model.
x/c0.0 0.1 0.2 0.3 0.4 0.5 0.6 0.7 0.8 0.9 1.0
-6.0
-5.0
-4.0
-3.0
-2.0
-1.0
0.0
1.0
CleanCasting2-D Smooth
Cp
Fig. 11 Pressure distribution comparison for the casting and 2-D smooth streamwise ice shape ED0730 simulations on the NACA 23012 model at α = 11.4 deg.
Fig. 13 Aerodynamic performance comparison for various roughness shape ED0762 simulations on the NACA 23012 model.
α (deg)-8 -6 -4 -2 0 2 4 6 8 10 12 14 16 18 20
-0.8
-0.6
-0.4
-0.2
0.0
0.2
0.4
0.6
0.8
1.0
1.2
1.4
1.6
-0.08
-0.06
-0.04
-0.02
0.00
0.02
0.04
0.06
0.08
0.10
0.12
0.14
0.16
Cl Cm
α (deg)-8 -6 -4 -2 0 2 4 6 8 10 12 14 16
0.00
0.01
0.02
0.03
0.04
0.05
0.06
0.07
0.08
CleanCasting2-D SmoothSimple Geometry
Cd
Fig. 14 Aerodynamic performance comparison of simulation fidelity for spanwise-ridge ice shape ED0760 on the NACA 23012 model.
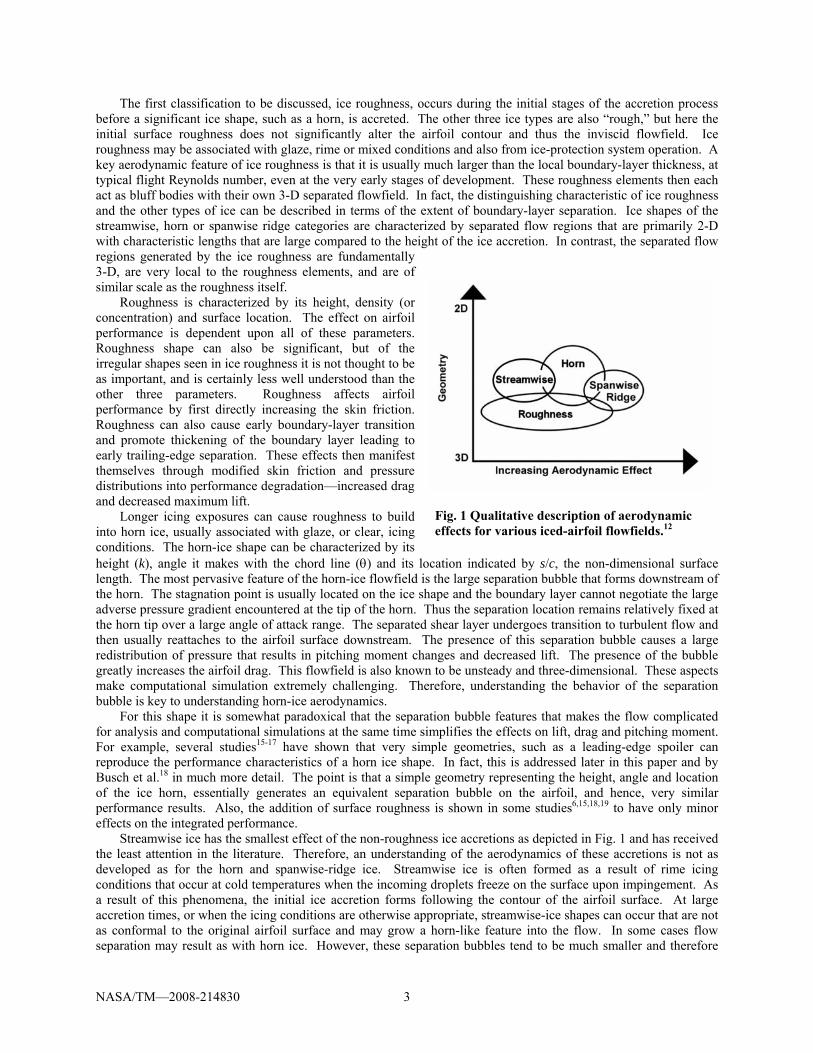
The simulation results for the spanwise-ridge category of ice shape are summarized in Fig. 14. The lift and pitching moment data indicate that the 2-D smooth simulation applied to the airfoil resulted in a much better match than the simple-geometry simulation to the results from the casting simulation applied to the airfoil. This supports the notion of Bragg et al.11,12 that the specific cross-sectional geometry of a ridge simulation is important as regards its affect on the airfoil aerodynamics. As with many of these cases, drag coefficient simulation was much more challenging. The 2-D smooth simulation tested on the airfoil resulted in lower drag on the interval -2 < α < 9 deg. than for the airfoil with the casting simulation. Outside of this interval the opposite was true. Attempts to improve
NASA/TM—2008-214830 11
the simulation accuracy with the addition of roughness are illustrated in Fig. 15. It is interesting to note that it was the largest roughness size applied to the 2-D smooth simulation that resulted in the best matching of Cd, while the smaller roughness sizes resulted in higher drag penalties. At the same time, the addition of this roughness reduced the agreement in lift and pitching moment. Further, similar counter-intuitive results were observed in the variation of maximum lift with roughness size applied to the 2-D smooth simulation. Namely, smaller roughness sizes resulted in larger Cl,max penalties. Clearly, these data illustrate the simulation challenges associated with the spanwise-ridge category of ice shape and how common expectations can be inaccurate.
Fig. 15 Aerodymanic performance comparison of roughness applied to the 2-D smooth spanwise-ridge ice shape ED0760 simulation on the NACA 23012 model.
The aerodynamic data for the various levels of ice-shape simulation fidelity gathered in Phase III aided in
confirming and further refining the ice-shape classifications described in Phase I. The data illustrate the range in performance data for typical simulation methods as applied to a subscale model. Establishing the relationship between simulation fidelity and the resulting aerodynamic performance is a key goal of this program. Accomplishing this goal for the subscale model led to increased understanding of the effects and were directly applied to the full-scale model research phases. This is described in Phases IV and V. Phase IV: Full-scale Model Ice Accretion Testing
The objective of this phase of the program was to obtain molds of ice accretions of each of the four ice classifications on a full-scale airfoil. In a scaling methods development effort such as this, it is important to have a set of benchmark data and firm knowledge of the full-scale phenomena. This information provides validation data for both the subscale testing and scaling methods developed. In order to gain full-scale aerodynamic effects information for the four classifications of ice, accurate representations of the ice needed to be obtained. Therefore, a full-scale ice accretion model was built and tested in the IRT. This effort provided the full-scale, reference ice shapes for the program.
The model built for this phase was again a two-dimensional, NACA 23012 that spanned from floor to ceiling of the test section of the IRT. It was machined from solid aluminum and had a removable leading edge section for making molds of the ice accretions. However, it had a chord length of 6.0-feet (1.83-m); four times that of the subscale model. A photograph of the model mounted vertically in the IRT is shown in Fig. 16. It was instrumented with pressure taps for alignment purposes and with thermocouples to monitor model temperature. Similar to the subscale model, an electric foil heater was attached to the removable leading edge. Icing conditions and heater setting were adjusted to create a situation where water would runback over the heater and then freeze as a spanwise ridge downstream of the heater on both the upper and lower surfaces of the model.
NASA/TM—2008-214830 12
Test conditions for the full-scale icing tests were selected as indicated in the Phase II discussion; i.e., icing conditions that a commuter aircraft might encounter in flight as defined by the FAA’s Appendix C icing conditions and that would yield ice accretions falling within the four ice classifications described in Phase I. Some adjustments in the test conditions were made such that they fell within the IRT’s operating envelope. The full-scale icing conditions are given in Table 2.
The full-scale ice accretions produced in the IRT were, as in the subscale testing, recorded using photographs, ice tracings, and ice depth measurements. When a particular ice accretion was selected for the Phase V testing, the accretion run was repeated and the removable leading edge and resulting ice accretion were detached from the model. The leading edge and ice were installed in a mold box and the mold was poured. Molds were made of a total of ten ice accretions. There were three each of the horn and streamwise accretions and two each of the roughness and spanwise ridge accretions. Castings were again subsequently made from each of these molds. The castings were then prioritized based upon which were the best representatives of the four ice classifications and then upon which were of most interest for the purposes of forming a full scale, high-fidelity, ice contaminated aerodynamic validation database. These ice shapes and test plans are described in the following section. Table 2. Icing Conditions for Full-Scale Icing Tests
In Phase V of the program, aerodynamic testing will provide the icing community performance data for an airfoil with full-scale, high-fidelity, ice accretion simulations. As was the case for the subscale testing, ice shapes were selected according to the four classifications developed in Phase I. In contrast to the subscale testing, only the high-fidelity ice casting simulations will be tested on the full-scale model. The reasoning here is that this approach increases the number of different ice shapes that may be tested with the given amount of tunnel time. A total of six ice accretions were selected for aerodynamic testing and are shown in Figs. 17-22. The first four of these shapes (Figs. 17-20) are from each of the four ice-shape classifications and were accreted using the icing conditions given in Table II. The two additional shapes (Figs. 21 and 22) were selected in part because they can be challenging from the standpoint of simulation on a subscale model.
The aerodynamic testing will be carried out in the ONERA F1 wind tunnel shown in Fig. 23. This is a large pressure tunnel having a test-section 3.5 m high by 4.5 m wide. The 6-foot (1.83 m) chord NACA 23012 airfoil will be oriented vertically and supported by a force balance located beneath the floor. Like the subscale model, it has two interchangeable leading edges. The baseline leading edge has the clean NACA 23012 profile and the ice leading edge is truncated such that the ice-shape simulations can be bolted in place on the nose of the model. Lift and pitching moment data will be acquired from the force balance as well as from the integration of the surface static pressures. Drag will be obtained via wake survey. The pressure tunnel will be fully utilized to explore any Reynolds number variations (from 4.0×10⁶ to 12×106 and from 8.0×10⁶ to 16.0×10⁶) at fixed Mach numbers (0.10 and 0.20, respectively), as well as Mach number variation (0.10 to 0.28) at fixed Reynolds number (12.0×10⁶).
Fig. 16 Full-scale NACA 23012 ice accretion model installation in NASA IRT.
NASA/TM—2008-214830 13
The full-scale model testing will be comprised of two campaigns. The first campaign is currently scheduled for spring of 2007 and the second for summer 2007. The objective in the first campaign is to measure the aerodynamic performance (lift, drag, pitching moment, surface pressures, etc.) for each of the six ice shapes over a large angle of attack range including stall. Flow visualization will also be performed. Fluorescent mini-tufts will be attached to the model upper surface over a segment of the span away from the pressure measurement and wake survey stations. The mini-tuft response will be recorded on video during the angle of attack sweeps. Surface oil flow visualization will be performed for selected cases as time allows. The objective of the second campaign is to acquire detailed flowfield data for computational methods development and validation. In this case, the time-dependent velocity field in the vicinity of an ice shape simulation will be acquired using an optical method such as particle-image velocimetry (PIV). Because of the time consuming nature of these measurements, only one ice shape will be selected for investigation. Phase VI: Simulation Validation Testing
The full-scale model aerodynamic testing conducted in Phase V will provide a substantial validation data set for the final phases of this program. In Phase VI, the ice shapes used in the full-scale test will be scaled and simulated for testing on the subscale model using the Illinois low-speed facility. This will effectively “close the loop” by quantifying the accuracy of 2-D and simple geometry simulations for subscale iced-airfoil aerodynamic testing at low-Reynolds number.
The current testing plan is to fabricate and test lower fidelity simulations on the subscale NACA 23012 model of the ice shapes shown in Figs. 17 to 22. The aerodynamic data, including flow visualization will be used to quantify the uncertainty with which full-scale iced-airfoil effects can be performed on a subscale model. This will provide full-scale to subscale comparison of iced-airfoil aerodynamics under tightly controlled conditions.
x/cy/
c-0.05 0.00 0.05 0.10 0.15
-0.10
-0.05
0.00
0.05
0.10
Fig. 17 Tracing and photograph of horn shape EG1164.
x/c
y/c
-0.05 0.00 0.05 0.10 0.15-0.10
-0.05
0.00
0.05
0.10
Fig. 18 Tracing and photograph of streamwise shape EG1162.
Fig. 19 Picture of roughness shape EG1126.
NASA/TM—2008-214830 14
Phase VII: CFD Research In addition to the
experimental effort currently underway, computational studies are also being performed. The objectives of this effort are to use current CFD capabilities to assist the experimental effort and to use data from the project to aid in validation of 3D CFD methods as applied to ice-shape geometries. Additionally, it is desired to use the experimental data from the project to evaluate the requirements for geometric simulation by ice-accretion codes. The latter objective is based upon identifying the geometric characteristics that influence the aerodynamics and using that information to determine what elements of an ice-accretion simulation must be accurately recreated by such a computational method.
In order to accomplish these objectives, a series of computational tasks has been identified. These consist of two-dimensional simulation of the ice shapes generated in the NASA Icing Research Tunnel (IRT), and two- and three-dimensional CFD calculations of the aerodynamics of the measured ice shapes. The ice-accretion simulation task is designed to compare the results of the computation with the ice shapes produced in the NASA IRT. Additionally, the ice-accretion simulation tool was used to aid in selection of the icing conditions for the test program. Two-dimensional CFD calculations of the ice shapes generated from the previous task as well as for the respective ice-shape tracings from the experiment will be performed. These calculations will be compared to understand the differences between ice-shape tracings and computer generated ice shapes with respect to the resulting aerodynamic forces. These results will also be used to evaluate the aerodynamic differences between sub-scale and full-scale ice shape geometries. Three-dimensional CFD calculations of selected ice-shape/airfoil geometries that have been tested in the experiments will be performed. The results of these calculations will be compared to the data provided from the experiment. Analysis of the computational results will be performed to determine what elements of the calculation have reproduced the experiment and what deficiencies, if any, have been identified.
x/c
y/c
-0.05 0.00 0.05 0.10 0.15-0.10
-0.05
0.00
0.05
0.10
Fig. 20 Tracing and photograph of spanwise-ridge shape EG1159.
x/c
y/c
-0.05 0.00 0.05 0.10 0.15-0.10
-0.05
0.00
0.05
0.10
Fig. 21 Tracing and photograph of streamwise shape EG1125.
Fig. 22 Picture of roughness shape EG1134.
NASA/TM—2008-214830 15
Ice accretion simulation results Both the NASA LEWICE code25 and the ONERA
ONICE code26 have been used to calculate ice accretions in support of this program The LEWICE code was used to simulate the ice shapes produced for the program during testing in the IRT. This code produces two-dimensional ice shape profiles using input airfoil geometry, flight conditions, and icing cloud conditions. The code calculates ice shapes by performing a flowfield analysis, calculations of water droplet trajectories, a mass and energy balance at the icing surface, and an ice growth calculation based upon the mass of ice accumulated and its distribution on the airfoil surface. The ONERA code uses a finite element method with a C grid to solve the velocity potential equation to determine the flowfield and with Lagrangian droplet tracking to determine trajectories and impingement locations. The Messinger model is used for ice-accretion thermodynamics and correlations are used for convective and evaporative heat transfer. The Makkonen correlations enable a representation of roughness effects. The ice shape is first estimated for a given icing time in one step. Then the flowfield, the trajectories and the heat transfer coefficient are calculated for this ‘estimated shape’. Assuming that the values of the local collection efficiency and heat transfer coefficients vary linearly from their values on the clean airfoil to their values on the profile covered by the estimated shape, the thermodynamic balance is made and the final ice shape is calculated.
The initial use of the LEWICE code was to aid in selection of the icing conditions that were used in the experimental testing in the IRT. As mentioned previously, the code was used to help determine the icing conditions that would produce ice shapes that exhibited the geometric features of two of the four classifications of ice shapes determined in Phase I of this study. LEWICE was not used to produce surface roughness or the ice ridge shapes which were produced experimentally in the IRT with the use of an electrical heater blanket on the leading edge to produce runback.
In conjunction with the actual IRT testing, LEWICE calculations were performed to compare the code results with the corresponding measured ice shapes. Typical results are shown in Figs. 24 and 25 which show comparisons for the 18- inch chord model and 72-inch chord model, respectively. Since Table 2 presents accretions where molds
-4
-2
0
2
4
6
-2 0 2 4 6 8 10 12X (in.)
Y (in
.)
AirfoilLEWICEONERASpan = 36"
a) horn case (EG1163)
-4
-2
0
2
4
6
-2 0 2 4 6 8 10 12X (in.)
Y (in
.)
AirfoilLEWICEONERASpan = 36"
b) streamwise case (EG1161)
Fig. 24 LEWICE and ONERA simulations of IRT test using 72-inch chord airfoil model.
Fig. 23 ONERA F1 wind-tunnel test section.
NASA/TM—2008-214830 16
-1.0
-0.5
0.0
0.5
1.0
1.5
-1.0 -0.5 0.0 0.5 1.0 1.5 2.0X (in.)
Y (in
.)
AirfoilLEWICEONERASpan = 24"Span = 36"Span = 48"
a) horn case (ED0735)
-1.0
-0.5
0.0
0.5
1.0
1.5
-1.0 -0.5 0.0 0.5 1.0 1.5 2.0
X (in.)
Y (in
.)
AirfoilLEWICEONERASpan = 24"
b) streamwise case (ED00730) Fig. 25 LEWICE and ONERA simulations of IRT test using 18 inch chord airfoil model.
were taken and therefore no tracings, calculations were performed for similar runs where tracings of the shapes were available. Thus in Fig. 24 case a) the horn case (run EG1163 which is similar to 1164 except MVD=20, LWC=.85 and spray time=11.2) and b) the Streamwise case (run EG1161 which is a repeat of 1162). In Fig. 25 the conditions are those of Table 1 with a) the Horn case (run ED0735) and b) the Streamwise case (run ED0730). The Span notation in the legend refers to the spanwise location where the experimental ice shape measurement was taken with 36-inch being the tunnel centerline.
The results for streamwise shapes show excellent agreement and the results for horn shaped geometries show agreement typical for ONICE and LEWICE. In the latter case, this type of agreement has been shown27 to be within the experimental repeatability of the ice shape generation process. Comparisons for roughness shapes were not performed because experimental tracings were not taken and the codes do not produce ice shapes with small scale roughness features.
Aerodynamic analysis of ice shape profiles with CFD
The data from this test program will ultimately be used, aside from the aerodynamic scaling analysis, for comparison with CFD results in order to assess the current computational capabilities as well as to aid in improvement of those methods. The CFD effort incorporates the use of both two-dimensional and three-dimensional computational methods. The two-dimensional computations will be undertaken first in order to provide initial evaluations of the IRT ice accretions. The performance of these two-dimensional models can then be evaluated with the data from the tests at Illinois and at the ONERA F1 tunnel. Once a reasonable understanding of the two-dimensional results has been developed, an extension to three-dimensional computations can be undertaken building upon the two-dimensional analysis.
Some initial calculations for the two-dimensional data have been performed using a commercially available grid generation tool,28 GRIDGEN, and a publicly available CFD code,29 ARC2D. Modifications to the ARC2D code make it attractive in the evaluation of flowfields about ice shape profiles.30 The modifications were to the turbulence model to account for the well documented issues surrounding the Baldwin-Lomax model near regions of flow separation. In addition, the Elsa code31,32 was used by ONERA to perform iced-airfoil calculations with a k-omega turbulence model. This code provides the numerical simulation of the compressible viscous mono-species, for steady and unsteady flows, on three-dimensional or two-dimensional multi-block structured meshes. It is based on a finite volume approach.
Some initial results are shown in Figs. 26 - 29 which show the grid and Mach number contours for clean and iced geometries. The selected geometries are those obtained by the LEWICE and ONICE codes. Note that run EG1109 is a glaze condition similar to EG1164 except LWC=0.5, T0=-6.7C, and spray time= 22.5.
Future work in this project will include more two-dimensional aerodynamic calculations for the LEWICE and ONICE code generated shapes as well as the experimental ice shape geometries described previously. Additionally, more two- and three-dimensional calculations will be performed to identify the differences between two- and three-dimensional results.
NASA/TM—2008-214830 17
X
Y
-0.05 0 0.05-0.06
-0.04
-0.02
0
0.02
0.04
0.06
0.08
X
Y
-0.1 -0.05 0 0.05 0.1
-0.05
0
0.05
0.1
(a) (b)
Fig. 27 ARC2D Mach number contours for (a) clean NACA 23012 airfoil geometry and (b) with a LEWICE generated ice shape.(EG1109); α = 0°, Re = 3.29x10⁶, M = 0.4.
X
Y
-0.1 -0.05 0 0.05 0.1-0.1
-0.05
0
0.05
0.1
X
Y
-0.1 -0.05 0 0.05 0.1
-0.05
0
0.05
0.1
(a) (b)
Fig. 26 GRIDGEN Grid structures for (a) clean NACA 23012 airfoil geometry and (b) with a LEWICE generated ice shape. (EG1109)
NASA/TM—2008-214830 18
a) b) Fig. 28 Grid structures (generated with ICEM) for (a) clean NACA 23012 airfoil geometry and (b) with an
ONICE generated ice shape (Fig.24a).
a) b) Fig. 29 Mach number contours (using the Elsa code) for (a) clean NACA 23012 airfoil geometry and (b)
with an ONICE generated ice shape (Fig. 24 a); α = 0°, Re = 8.1x10⁶, M = 0.3.
III. Conclusions This paper provides an overview of the NASA/ONERA/Illinois research program to better understand ice
accretion simulation for airfoil aerodynamics. Ice accretions have been classified into four groups by examining their aerodynamic effect: roughness, horn, streamwise, and spanwise-ridge ice. This program uses subscale and full-scale testing to provide full-scale data and a development and validation of simulation methods of varying fidelity for these four classifications. Ice accretions were acquired in the NASA IRT on an 18-inch NACA 23012 airfoil. Guided by computational results, ice-accretion conditions were set to be representative of a commuter aircraft in Appendix C conditions. Molds were made for all four ice-shape types. Aerodynamic measurements in the Illinois
NASA/TM—2008-214830 19
subsonic tunnel compared the performance and flowfield on the cast ice shapes to simulations of varying degree of fidelity. The height and location of the horn or ridge were dominate features on the horn and spanwise-ridge accretions. Here roughness played a secondary effect. Roughness was critical on the streamwise shape to reproduce the lift and the drag. The spanwise ridge was the most challenging to accurately simulate. Research is continuing in the Illinois tunnel to continue to improve our understanding of these effects.
These small-scale simulation experiments are guiding the full-scale experiments. Ice accretions have been acquired on a full-scale NACA 23012 model in the IRT and aerodynamic measurements on cast ice shapes will occur later this year in the ONERA F1 tunnel – a large pressure tunnel. Based on these results we will close the loop by using the knowledge gained to simulate these aerodynamic results in the Illinois tunnel using simulated small-scale shapes. This test will determine our ability to duplicate full-scale ice accretion in both geometric and aerodynamic scale (Reynolds number). In addition to providing the baseline for scaling development, the full-scale results will be used for CFD development and validation and contribute to a goal of identifying key ice shape characteristics and simulation methods for aerodynamic testing.
References 1 Ratvasky, T.P., Van Zante, J.F., and Riley, J.T., “NASA/FAA Tailplane Icing Program Overview,” AIAA Paper
99-0370, Jan. 1999. 2 Ratvasky, T.P., and Van Zante, J.F., “In-Flight Aerodynamic Measurements of an Iced Horizontal Tailplane,”
AIAA Paper 99-0638, Jan. 1999. 3 Ranaudo, R.J., Mikkelsen, K.L., McKnight, R.C., Ide, R.F., and Reehorst, A.L., “The Measurement of Aircraft
Performance and Stability and Control After Flight Through Natural Icing Conditions,” AIAA Paper 86-9758, Apr. 1986.
4 Reehorst, A.L., and Richter, G.P., “New Methods and Materials for Molding and Casting Ice Formations,” NASA
TM-100126, Sept. 1987. 5 Broeren, A.P., Bragg, M.B., and Addy, H.E., Jr., “Effect of Intercycle Ice Accretions on Aerodynamic
Performance,” Journal of Aircraft, Vol. 41, No. 1, Jan.-Feb. 2004, pp 165-174. 6 Addy, H.E., Jr., Broeren, A.P., Zoeckler, J.G., and Lee, S., “A Wind Tunnel Study of Icing Effects on a Business
Jet Airfoil,” AIAA Paper 2003-0727, Jan. 2003. 7 Addy, H.E., Jr., and Chung, J.J., “A Wind Tunnel Study of Icing Effects on a Natural Laminar Flow Airfoil,”
AIAA Paper 2000-0095, Jan. 2000. 8 Papdakis, M., Yeong, H.W., Chandrasekharan, R., Hinson, M., Ratvasky, T., and Giriunas, J., “Experimental
Investigations of Simulated Ice Accretions on a Full-Scale T-tail,” AIAA Paper 2001-0090, Jan. 2001. 9 Addy, H.E., Jr., “Ice Accretions and Icing Effects for Modern Airfoils,” NASA/TP-2000-210031, April 2000. 10 Anderson, D.N., “Manual of Scaling Methods,” NASA/CR-2004-212875, Mar. 2004. 11 Bragg, M.B., Broeren, A.P., and Blumenthal, L.A., “Iced-Airfoil and Wing Aerodynamics,” SAE Paper 2003-01-
2098, Jun. 2003. 12 Bragg, M.B., Broeren, A.P., and Blumenthal, L.A., “Iced-Airfoil Aerodynamics,” Progress in Aerospace
Sciences, Vol. 41, No. 5, Jul. 2005, pp. 323-418. 13 Blumenthal, L.A., “Surface Pressure Measurements on a Three-Dimensional Ice Shape,” M.S. Thesis, Dept. of
Aerospace Eng., Univ. of Illinois, Urbana, IL, 2005.
NASA/TM—2008-214830 20
14 Blumenthal, L.A., Busch, G.T., Broeren, A.P., and Bragg, M.B., “Issues in Ice Accretion Aerodynamic Simulation on a Subscale Model,” AIAA Paper 2006-0262, Jan. 2006.
15 Papadakis, M, Gile-Laflin, B.E., Yousef, G.M., and Ratvasky, T.P., “Aerodynamic Scaling Experiments with
Simulated Ice Accretions,” AIAA Paper 2001-0833, Jan. 2001. 16 Papadakis, M., Yeong, H.W., Chandrasekharan, R., Hinson, M., Ratvasky, T.P., and Giriunas, J., “Experimental
Investigation of Simulated Ice Accretions on a Full-Scale T-tail,” AIAA Paper 2001-0090, Jan. 2001. 17 Papadakis, M., Alansatan, S., and Yeong, H.W., “Aerodynamic Performance of a T-tail with Simulated Ice
Accretions,” AIAA Paper 2000-0363, Jan. 2000. 18 Busch, G.T., Broeren, A.P., and Bragg, M.B., “Aerodynamic Simulation of a Horn-Ice Accretion on a Subscale
Model,” AIAA Paper 2007-0087, Jan. 2007. 19 Bragg, M.B., and Khodadoust, A., “Experimental Measurements in a Large Separation Bubble Due to a Simulated
Glaze Ice Shape,” AIAA Paper 88-0116, 1988. 20 Lee, S and Bragg, M.B., “Investigation of Factors Affecting Iced-Airfoil Aerodynamics,” Journal of Aircraft, Vol.
40, No. 3, 2003, pp. 499 – 508. 21 Vickerman, M.B., Choo, Y.K., Schilling, H.W., Baez, M., Braun, D.C., and Cotton, B.J., “Toward an Efficient
Icing CFD Process Using an Interactive Software Toolkit—SmaggIce 2D,” AIAA Paper 2002-0095, Jan. 2000. 22 Kim, H.S., and Bragg, M.B, “Effects of Leading-Edge Ice Accretion Geometry on Airfoil Aerodynamics,” AIAA
Paper 99-3150, June 1999. 23 Busch, G.T., “Ice Accretion Aerodynamic Simulation on a Subscale Model, M.S. Thesis, Dept. of Aerospace
Engineering, Univ. of Illinois, Urbana, IL, 2006. 24 McCullough, G.B., and Gault, D.E., “Example of Three Representative Types of Airfoil-Section Stall at Low
Speed,” NACA TN-2502, Sept. 1951. 25 Wright, W.B., “Users Manual for the NASA Glenn Ice Accretion Code LEWICE Version 3.0,” available on the
NASA LEWICE 3.0 release CD, Apr. 2003.
26 Wright, W.B., Gent, R.W., and Guffond, D., “DRA/NASA/ONERA Collaboration on Icing Research, Part II –
Prediction of Airfoil Ice Accretion,” NASA Contractor Report 202249, May 1997
27 Wright, W.B., “Validation Results for LEWICE 3.0,” NASA CR-2005-213561, AIAA Paper 2005-1243, Jan.
2005. 28 Steinbrenner, J., Wyman, N., and Chawner, J., “Development and Implementation of Gridgen’s Hyperbolic PDE
and Extrusion Methods,” AIAA 2000-0679, Jan. 2000. 29 Pulliam, T.H., “Euler and Thin Layer Navier-Stokes Codes: ARC2D, ARC3D” in Computational Fluid
Dynamics, UTSI Publication No. E02-4005-023-84, Tullahoma, TN, March, 1984, pp. 15.1-15.85. 30 Potapczuk, M.G., “Navier-Stokes Analysis of Airfoils with Leading Edge Ice Accretions,” Thesis (Ph. D.),
University of Akron, Dept. of Mechanical Engineering, 1989. 31 Cambier, L., “The elsA project,” 1st ONERA-DLR Aerospace Symposium, Paris, 1999 32 Cambier, L. and. Gazaix, M, “elsA: an efficient object-oriented solution to CFD complexity,” AIAA Paper 2002-
0108, Jan. 2002
NASA/TM—2008-214830 21
REPORT DOCUMENTATION PAGE Form Approved OMB No. 0704-0188
The public reporting burden for this collection of information is estimated to average 1 hour per response, including the time for reviewing instructions, searching existing data sources, gathering and maintaining the data needed, and completing and reviewing the collection of information. Send comments regarding this burden estimate or any other aspect of this collection of information, including suggestions for reducing this burden, to Department of Defense, Washington Headquarters Services, Directorate for Information Operations and Reports (0704-0188), 1215 Jefferson Davis Highway, Suite 1204, Arlington, VA 22202-4302. Respondents should be aware that notwithstanding any other provision of law, no person shall be subject to any penalty for failing to comply with a collection of information if it does not display a currently valid OMB control number. PLEASE DO NOT RETURN YOUR FORM TO THE ABOVE ADDRESS. 1. REPORT DATE (DD-MM-YYYY) 01-01-2008
2. REPORT TYPE Technical Memorandum
3. DATES COVERED (From - To)
4. TITLE AND SUBTITLE Airfoil Ice-Accretion Aerodynamics Simulation
5a. CONTRACT NUMBER
5b. GRANT NUMBER NCC3-1039
5c. PROGRAM ELEMENT NUMBER
6. AUTHOR(S) Bragg, Michael, B.; Broeren, Andy, P.; Addy, Harold, E., Jr.; Potapczuk, Mark, G.; Guffond, Didier; Montreuil, E.
5d. PROJECT NUMBER
5e. TASK NUMBER
5f. WORK UNIT NUMBER WBS 457280.02.07.03.02
7. PERFORMING ORGANIZATION NAME(S) AND ADDRESS(ES) National Aeronautics and Space Administration John H. Glenn Research Center at Lewis Field Cleveland, Ohio 44135-3191
8. PERFORMING ORGANIZATION REPORT NUMBER E-16025
9. SPONSORING/MONITORING AGENCY NAME(S) AND ADDRESS(ES) National Aeronautics and Space Administration Washington, DC 20546-0001
10. SPONSORING/MONITORS ACRONYM(S) NASA
11. SPONSORING/MONITORING REPORT NUMBER NASA/TM-2008-214830; AIAA-2007-0085
12. DISTRIBUTION/AVAILABILITY STATEMENT Unclassified-Unlimited Subject Category: 02 Available electronically at http://gltrs.grc.nasa.gov This publication is available from the NASA Center for AeroSpace Information, 301-621-0390
13. SUPPLEMENTARY NOTES
14. ABSTRACT NASA Glenn Research Center, ONERA, and the University of Illinois are conducting a major research program whose goal is to improve our understanding of the aerodynamic scaling of ice accretions on airfoils. The program when it is completed will result in validated scaled simulation methods that produce the essential aerodynamic features of the full-scale iced-airfoil. This research will provide some of the first, high-fidelity, full-scale, iced-airfoil aerodynamic data. An initial study classified ice accretions based on their aerodynamics into four types: roughness, streamwise ice, horn ice, and spanwise-ridge ice. Subscale testing using a NACA 23012 airfoil was performed in the NASA IRT and University of Illinois wind tunnel to better understand the aerodynamics of these ice types and to test various levels of ice simulation fidelity. These studies are briefly reviewed here and have been presented in more detail in other papers. Based on these results, full-scale testing at the ONERA F1 tunnel using cast ice shapes obtained from molds taken in the IRT will provide full-scale iced airfoil data from full-scale ice accretions. Using these data as a baseline, the final step is to validate the simulation methods in scale in the Illinois wind tunnel. Computational ice accretion methods including LEWICE and ONICE have been used to guide the experiments and are briefly described and results shown. When full-scale and simulation aerodynamic results are available, these data will be used to further develop computational tools. Thus the purpose of the paper is to present an overview of the program and key results to date. 15. SUBJECT TERMS Ice accretions; Ice contaminated airfoil
16. SECURITY CLASSIFICATION OF: 17. LIMITATION OF ABSTRACT UU
18. NUMBER OF PAGES
27
19a. NAME OF RESPONSIBLE PERSON STI Help Desk (email:[email protected])
a. REPORT U
b. ABSTRACT U
c. THIS PAGE U
19b. TELEPHONE NUMBER (include area code) 301-621-0390
Standard Form 298 (Rev. 8-98)Prescribed by ANSI Std. Z39-18


![Ice accretion simulations on airfoils · Potapczuk and Bidwell [6] present a method for three-dimensional (3D) ice accretion modeling. Three-dimensional §ow ¦eld methods and droplet](https://static.documents.pub/doc/80x56/5eaefb666868cd204f435d9b/ice-accretion-simulations-on-airfoils-potapczuk-and-bidwell-6-present-a-method.jpg)


