+ All Categories
Home > Documents > AIRFREIGHT SURFACE KSU $0.95 $0.99 (4%) CSX $0.36 … · Light Forwarder Index includes FWRD, HUBG,...

AIRFREIGHT SURFACE KSU $0.95 $0.99 (4%) CSX $0.36 … · Light Forwarder Index includes FWRD, HUBG,...

Date post: 29-Apr-2019
Category:
Upload: lyminh
View: 216 times
Download: 0 times
Share this document with a friend
12
DO NOT FORWARD DO NOT DISTRIBUTE DOCUMENT CAN ONLY BE PRINTED TWICE This report is limited solely for the use of clients of Wolfe Research. Please refer to the DISCLOSURE SECTION located at the end of this report for Analyst Certifications and Other Disclosures. For Important Disclosures, please go to www.WolfeResearch.com/Disclosures or write to us at Wolfe Research, LLC, 420 Lexington Avenue, Suite 648, New York, NY 10170. WolfeResearch.com Page 1 of 12 April 1, 2016 INSIDE FREIGHT Transport 1Q Earnings Preview: Cautious Positioning Transports Ahead of 1Q Earnings. Our WR Transport index has surged more than 25% the past ~2 months and has outperformed the S&P 500 by more than 1,500bp over this period. While recession fears have faded, we don’t expect 1Q earnings season will be a catalyst for many upward EPS revisions. So valuations have expanded, and we think commentary on March/April freight demand could be disappointing… so we’re mostly cautious on the transports heading into earnings season. Some Puts and Takes in 1Q. Transport EPS should benefit in 1Q from mild weather, an extra operating day and an early Easter. However, asset- based transports face tough fuel comps, continued muted demand, and likely slower pricing for the TLs. Declines in TL spot rates and ocean spot rates have moderated slightly, so gross yield expansion for the brokers/forwarders could also slow a bit. See the list on the right for our expectations of beats and misses in 1Q we’re now most above 1Q Cons. for AAWW, CVTI and WERN and most below for ARCB and YRCW. Is Freight Improving? We saw solid improvement in y/y Rail, Truck, Ocean and Air vols in Jan. and Feb. into a combination of easy comps (West Coast port issues last year) and mild weather. However, rail vols deteriorated meaningfully in March, and our channel checks with private truckers and ports suggest a similar softening into much tougher comps. How About Pricing? We continue to expect Rail pricing to hold up best this year, followed by LTL pricing, and see the most risk to TL pricing ahead. We also expect the Rails and LTLs to benefit more from any potential improvement in industrial and export end-markets ahead following recent commodity strength and dollar weakness. Lowering Ratings on CHRW and SWFT; Raising Target Price on JBHT. In separate notes today, we have lowered our ratings on CHRW and SWFT, both from Outperform to Peer Perform as both closed at or above our prior target prices. Meanwhile, we’ve raised our target price and reiterate our Outperform rating on JBHT which is seeing uniquely strong volume growth among the transports which we think deserves a higher valuation. Small List of Transport Stocks to Own. We recommend staying disciplined in transports, and now have a pretty small list of Outperform- rated stocks. Rails remain our favorite transport sub-sector, and our favorite stocks are NSC, CP, GWR, R and JBHT. On the other side, our best Underperform ideas are HTLD, CMI and PCAR. AIRFREIGHT & SURFACE TRANSPORTATION Airfreight & Logistics Market Weight Railroads Market Overweight Trucking Market Weight Truck Machinery Market Underweight ` Source: FactSet; Wolfe Research Scott H. Group (646) 845-0721 [email protected] Ivan Yi (646) 845-0724 [email protected] Vanck Zhu (646) 845-0725 [email protected] Christian Theodoropoulos (646) 845-0726 [email protected] 1Q EPS Wolfe Cons. Var. BEATS AAWW $0.30 $0.26 15% CVTI $0.24 $0.21 14% WERN $0.35 $0.32 9% SAIA $0.42 $0.40 5% JBHT $0.88 $0.84 5% CNI $0.96 $0.92 4% UPS $1.26 $1.22 3% NSC $0.99 $0.96 3% CHRW $0.83 $0.81 2% IN LINE CP $2.41 $2.40 0% KNX $0.29 $0.29 0% ODFL $0.76 $0.76 0% HUBG $0.41 $0.41 0% EXPD $0.55 $0.55 0% LSTR $0.69 $0.69 0% WAB $0.99 $1.00 (1%) GWR $0.71 $0.72 (1%) R $1.04 $1.05 (1%) MISSES FWRD $0.42 $0.43 (2%) CSX $0.36 $0.37 (3%) KSU $0.95 $0.99 (4%) HTLD $0.15 $0.16 (6%) UNP $1.05 $1.14 (8%) SWFT $0.20 $0.22 (9%) CGI $0.19 $0.21 (10%) RRTS $0.18 $0.23 (22%) YRCW ($0.87) ($0.49) (78%) ARCB ($0.17) ($0.09) (89%)
Transcript

DO NOT FORWARD – DO NOT DISTRIBUTE – DOCUMENT CAN ONLY BE PRINTED TWICE This report is limited solely for the use of clients of Wolfe Research. Please refer to the DISCLOSURE SECTION located at the end of this report for Analyst Certifications and Other Disclosures. For Important Disclosures, please go to www.WolfeResearch.com/Disclosures or write to us at Wolfe Research, LLC, 420 Lexington Avenue, Suite 648, New York, NY 10170.

WolfeResearch.com Page 1 of 12

April 1, 2016

INSIDE FREIGHT

Transport 1Q Earnings Preview: Cautious

Positioning Transports Ahead of 1Q Earnings. Our WR Transport index has surged more than 25% the past ~2 months and has outperformed the S&P 500 by more than 1,500bp over this period. While recession fears have faded, we don’t expect 1Q earnings season will be a catalyst for many upward EPS revisions. So valuations have expanded, and we think commentary on March/April freight demand could be disappointing… so we’re mostly cautious on the transports heading into earnings season.

Some Puts and Takes in 1Q. Transport EPS should benefit in 1Q from mild weather, an extra operating day and an early Easter. However, asset-based transports face tough fuel comps, continued muted demand, and likely slower pricing for the TLs. Declines in TL spot rates and ocean spot rates have moderated slightly, so gross yield expansion for the brokers/forwarders could also slow a bit. See the list on the right for our expectations of beats and misses in 1Q – we’re now most above 1Q Cons. for AAWW, CVTI and WERN and most below for ARCB and YRCW.

Is Freight Improving? We saw solid improvement in y/y Rail, Truck, Ocean and Air vols in Jan. and Feb. into a combination of easy comps (West Coast port issues last year) and mild weather. However, rail vols deteriorated meaningfully in March, and our channel checks with private truckers and ports suggest a similar softening into much tougher comps.

How About Pricing? We continue to expect Rail pricing to hold up best this year, followed by LTL pricing, and see the most risk to TL pricing ahead. We also expect the Rails and LTLs to benefit more from any potential improvement in industrial and export end-markets ahead following recent commodity strength and dollar weakness.

Lowering Ratings on CHRW and SWFT; Raising Target Price on JBHT. In separate notes today, we have lowered our ratings on CHRW and SWFT, both from Outperform to Peer Perform as both closed at or above our prior target prices. Meanwhile, we’ve raised our target price and reiterate our Outperform rating on JBHT which is seeing uniquely strong volume growth among the transports which we think deserves a higher valuation.

Small List of Transport Stocks to Own. We recommend staying disciplined in transports, and now have a pretty small list of Outperform-rated stocks. Rails remain our favorite transport sub-sector, and our favorite stocks are NSC, CP, GWR, R and JBHT. On the other side, our best Underperform ideas are HTLD, CMI and PCAR.

Click here to enter text.

AIRFREIGHT & SURFACE TRANSPORTATION

Airfreight & Logistics – Market Weight

Railroads – Market Overweight

Trucking – Market Weight

Truck Machinery – Market Underweight

` Source: FactSet; Wolfe Research

Scott H. Group (646) 845-0721 [email protected] Ivan Yi (646) 845-0724 [email protected] Vanck Zhu (646) 845-0725 [email protected]

Christian Theodoropoulos (646) 845-0726 [email protected]

1Q EPS Wolfe Cons. Var.

BEATS

AAWW $0.30 $0.26 15%

CVTI $0.24 $0.21 14%

WERN $0.35 $0.32 9%

SAIA $0.42 $0.40 5%

JBHT $0.88 $0.84 5%

CNI $0.96 $0.92 4%

UPS $1.26 $1.22 3%

NSC $0.99 $0.96 3%

CHRW $0.83 $0.81 2%

IN LINE

CP $2.41 $2.40 0%

KNX $0.29 $0.29 0%

ODFL $0.76 $0.76 0%

HUBG $0.41 $0.41 0%

EXPD $0.55 $0.55 0%

LSTR $0.69 $0.69 0%

WAB $0.99 $1.00 (1%)

GWR $0.71 $0.72 (1%)

R $1.04 $1.05 (1%)

MISSES

FWRD $0.42 $0.43 (2%)

CSX $0.36 $0.37 (3%)

KSU $0.95 $0.99 (4%)

HTLD $0.15 $0.16 (6%)

UNP $1.05 $1.14 (8%)

SWFT $0.20 $0.22 (9%)

CGI $0.19 $0.21 (10%)

RRTS $0.18 $0.23 (22%)

YRCW ($0.87) ($0.49) (78%)

ARCB ($0.17) ($0.09) (89%)

Inside Freight

April 1, 2016

WolfeResearch.com Page 2 of 12

Investment Conclusion

Our average Transport stock is up 11% YTD, materially outperforming the S&P 500 which is up 1%. This is a

complete reversal from 2015 when transport stocks materially underperformed the market. Since transport

stocks bottomed on January 20, our average stock is up 26% the past ~2 months, far outpacing the 11% gain

for the S&P 500. Over this time, the TL’s (+34%) and LTL’s (+33%) have outperformed the most, while the

more defensive non-asset Forwarders (+15%) have relatively lagged.

Exhibit 1. Freight Transports Recent Stock Performance

Note: Stock Performance as of 3/31/2016.

Source: FactSet Information Systems; Wolfe Research.

Following the recent move up in transport stocks, we’ve seen valuation levels rebound back toward historical

averages. The next two exhibits show company and sub-sector valuations versus historical 10-year averages.

First, Exhibit 2 shows just a handful of stocks now trading more than 1 multiple turn below historical 10-year

YTD Since YTD Since

2015 2016 1/20/2016 2015 2016 1/20/2016

NAV (73.6% ) 41.6% 86.9% Transports (27.9% ) 10.8% 26.2%

RRTS (59.6% ) 32.1% 86.8% WBC (2.4% ) 4.6% 26.0%

CVTI (30.3% ) 28.1% 62.2% WERN (24.9% ) 16.1% 25.2%

CGI (56.4% ) 6.0% 53.2% ARCB (53.9% ) 0.9% 21.8%

SWFT (51.7% ) 34.8% 49.9% PCAR (30.3% ) 15.4% 20.6%

SAIA (59.8% ) 26.5% 45.4% KNX (28.0% ) 7.9% 19.9%

HUBG (13.5% ) 23.8% 40.7% UPS (13.4% ) 9.6% 18.9%

GWR (40.3% ) 16.8% 40.2% LSTR (19.1% ) 10.2% 17.5%

ODFL (23.9% ) 17.9% 37.6% NSC (22.8% ) (1.6% ) 17.0%

UACL (50.8% ) 17.3% 35.7% AAWW (16.1% ) 2.2% 16.7%

R (38.8% ) 14.0% 34.1% CHRW (17.2% ) 19.7% 16.5%

KSU (38.8% ) 14.4% 32.8% HTLD (37.0% ) 9.0% 16.2%

FDX (14.2% ) 9.2% 32.1% CSX (28.4% ) (0.8% ) 15.5%

CNI (18.9% ) 11.8% 31.2% EXPD 1.1% 8.2% 12.8%

CMI (39.0% ) 24.9% 30.5% Russell 2000 (5.7% ) (1.9% ) 11.5%

OEM Avg (29.7% ) 15.2% 28.5% FWRD (14.6% ) 5.4% 10.9%

JBHT (12.9% ) 14.8% 28.2% S&P 500 (0.7% ) 0.8% 10.8%

CP (33.8% ) 4.0% 27.4% UNP (34.4% ) 1.7% 8.1%

WAB (18.1% ) 11.5% 27.2% YRCW (36.9% ) (34.3% ) 3.2%

YTD Since

Sector 2015 2016 1/20/2016

TL (37.0%) 16.7% 33.6%

LTL (42.1%) 10.1% 33.1%

OEM (29.7%) 15.2% 28.5%

Express (13.9%) 9.4% 26.6%

Total Transports (27.9%) 10.8% 26.2%

Asset-Light Forwarders (22.1%) 14.0% 26.0%

Large-Cap Rails (29.3%) 3.1% 20.3%

Non-Asset Forwarders (10.4%) 14.9% 15.0%

S&P 500 (0.7%) 0.8% 10.8%

Inside Freight

April 1, 2016

WolfeResearch.com Page 3 of 12

averages. And given our view that we are “late-cycle”, it’s tough for us to strongly recommend transport stocks

right now after such a big move up in the stocks and thus valuations. On a sub-sector basis, valuations have

also increased materially since the beginning of the year.

Exhibit 2. Company Valuations vs. Historical Valuations

Note: Data as of 3/31/2016. We have boxed valuations more than 1 multiple turn below historical 10-year averages.

Source: FactSet Information Systems; Wolfe Research.

Airfreight & 10-Year Trucking 10-Year

Logistics P/E Trough Avg Current P/E Trough Avg Current

FDX 11x 15x 14x ARCB 7x 16x 13x

UPS 17x 17x 18x ODFL 8x 17x 18x

AAWW 8x 10x 10x SAIA 8x 15x 14x

CHRW 20x 23x 20x R 8x 13x 11x

EXPD 19x 25x 20x CGI 8x 16x 10x

FWRD 13x 20x 19x CVTI 9x 17x 13x

HUBG 11x 19x 18x HTLD 13x 20x 24x

JBHT 12x 19x 20x KNX 15x 20x 20x

LSTR 13x 19x 19x SWFT 10x 17x 13x

RRTS 13x 14x 10x WERN 13x 17x 16x

Express/Parcel Avg 14x 16x 16x TL Avg 11x 18x 16x

Non-Asset Avg 20x 24x 20x LTL Avg 8x 16x 15x

Asset-Light Avg 12x 18x 17x Trucking Avg 10x 17x 15x

Railroads 10-Year

P/E Trough Avg Current

CNI 10x 15x 17x

CP 11x 16x 16x

CSX 10x 14x 15x

NSC 11x 13x 15x

UNP 11x 15x 15x

KSU 16x 20x 18x

GWR 12x 18x 16x

WAB 11x 17x 18x

Large Cap Rail Avg 10x 14x 15x

Rail Avg (Ex-WAB) 11x 16x 16x

Inside Freight

April 1, 2016

WolfeResearch.com Page 4 of 12

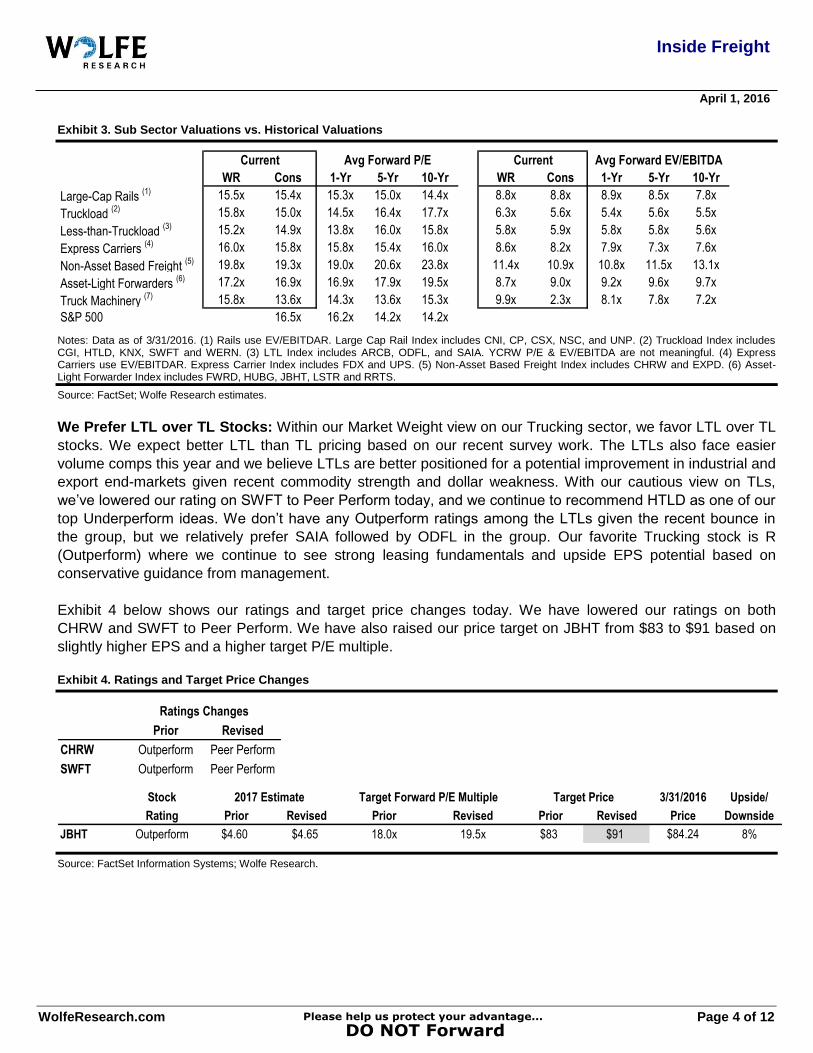
Exhibit 3. Sub Sector Valuations vs. Historical Valuations

Notes: Data as of 3/31/2016. (1) Rails use EV/EBITDAR. Large Cap Rail Index includes CNI, CP, CSX, NSC, and UNP. (2) Truckload Index includes CGI, HTLD, KNX, SWFT and WERN. (3) LTL Index includes ARCB, ODFL, and SAIA. YCRW P/E & EV/EBITDA are not meaningful. (4) Express Carriers use EV/EBITDAR. Express Carrier Index includes FDX and UPS. (5) Non-Asset Based Freight Index includes CHRW and EXPD. (6) Asset-Light Forwarder Index includes FWRD, HUBG, JBHT, LSTR and RRTS.

Source: FactSet; Wolfe Research estimates.

We Prefer LTL over TL Stocks: Within our Market Weight view on our Trucking sector, we favor LTL over TL

stocks. We expect better LTL than TL pricing based on our recent survey work. The LTLs also face easier

volume comps this year and we believe LTLs are better positioned for a potential improvement in industrial and

export end-markets given recent commodity strength and dollar weakness. With our cautious view on TLs,

we’ve lowered our rating on SWFT to Peer Perform today, and we continue to recommend HTLD as one of our

top Underperform ideas. We don’t have any Outperform ratings among the LTLs given the recent bounce in

the group, but we relatively prefer SAIA followed by ODFL in the group. Our favorite Trucking stock is R

(Outperform) where we continue to see strong leasing fundamentals and upside EPS potential based on

conservative guidance from management.

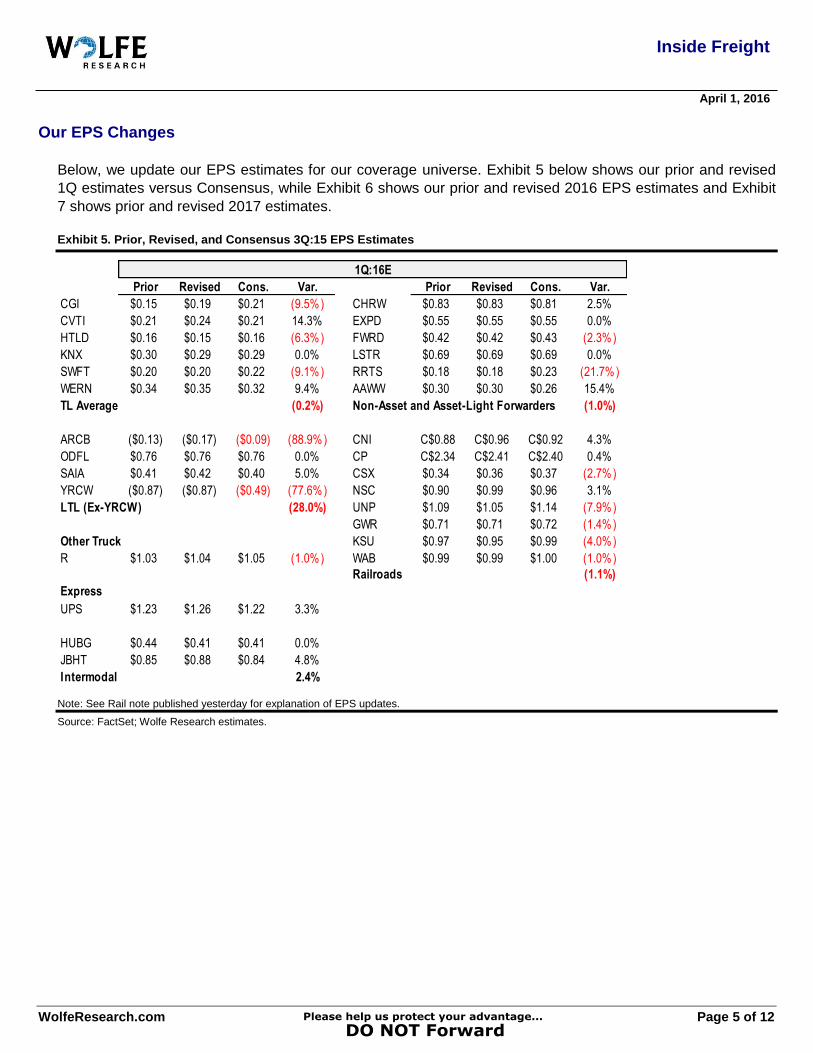
Exhibit 4 below shows our ratings and target price changes today. We have lowered our ratings on both

CHRW and SWFT to Peer Perform. We have also raised our price target on JBHT from $83 to $91 based on

slightly higher EPS and a higher target P/E multiple.

Exhibit 4. Ratings and Target Price Changes

Source: FactSet Information Systems; Wolfe Research.

Current Avg Forward P/E Current Avg Forward EV/EBITDA

WR Cons 1-Yr 5-Yr 10-Yr WR Cons 1-Yr 5-Yr 10-Yr

Large-Cap Rails (1) 15.5x 15.4x 15.3x 15.0x 14.4x 8.8x 8.8x 8.9x 8.5x 7.8x

Truckload (2) 15.8x 15.0x 14.5x 16.4x 17.7x 6.3x 5.6x 5.4x 5.6x 5.5x

Less-than-Truckload (3) 15.2x 14.9x 13.8x 16.0x 15.8x 5.8x 5.9x 5.8x 5.8x 5.6x

Express Carriers (4) 16.0x 15.8x 15.8x 15.4x 16.0x 8.6x 8.2x 7.9x 7.3x 7.6x

Non-Asset Based Freight (5) 19.8x 19.3x 19.0x 20.6x 23.8x 11.4x 10.9x 10.8x 11.5x 13.1x

Asset-Light Forwarders (6) 17.2x 16.9x 16.9x 17.9x 19.5x 8.7x 9.0x 9.2x 9.6x 9.7x

Truck Machinery (7) 15.8x 13.6x 14.3x 13.6x 15.3x 9.9x 2.3x 8.1x 7.8x 7.2x

S&P 500 16.5x 16.2x 14.2x 14.2x

Ratings Changes

Prior Revised

CHRW Outperform Peer Perform

SWFT Outperform Peer Perform

Stock 2017 Estimate Target Forward P/E Multiple Target Price 3/31/2016 Upside/

Rating Prior Revised Prior Revised Prior Revised Price Downside

JBHT Outperform $4.60 $4.65 18.0x 19.5x $83 $91 $84.24 8%

Inside Freight

April 1, 2016

WolfeResearch.com Page 5 of 12

Our EPS Changes

Below, we update our EPS estimates for our coverage universe. Exhibit 5 below shows our prior and revised

1Q estimates versus Consensus, while Exhibit 6 shows our prior and revised 2016 EPS estimates and Exhibit

7 shows prior and revised 2017 estimates.

Exhibit 5. Prior, Revised, and Consensus 3Q:15 EPS Estimates

Note: See Rail note published yesterday for explanation of EPS updates.

Source: FactSet; Wolfe Research estimates.

1Q:16E 2016E

Prior Revised Cons. Var. Prior Revised Cons. Var.

CGI $0.15 $0.19 $0.21 (9.5% ) CHRW $0.83 $0.83 $0.81 2.5%

CVTI $0.21 $0.24 $0.21 14.3% EXPD $0.55 $0.55 $0.55 0.0%

HTLD $0.16 $0.15 $0.16 (6.3% ) FWRD $0.42 $0.42 $0.43 (2.3% )

KNX $0.30 $0.29 $0.29 0.0% LSTR $0.69 $0.69 $0.69 0.0%

SWFT $0.20 $0.20 $0.22 (9.1% ) RRTS $0.18 $0.18 $0.23 (21.7% )

WERN $0.34 $0.35 $0.32 9.4% AAWW $0.30 $0.30 $0.26 15.4%

TL Average (0.2%) Non-Asset and Asset-Light Forwarders (1.0%)

ARCB ($0.13) ($0.17) ($0.09) (88.9% ) CNI C$0.88 C$0.96 C$0.92 4.3%

ODFL $0.76 $0.76 $0.76 0.0% CP C$2.34 C$2.41 C$2.40 0.4%

SAIA $0.41 $0.42 $0.40 5.0% CSX $0.34 $0.36 $0.37 (2.7% )

YRCW ($0.87) ($0.87) ($0.49) (77.6% ) NSC $0.90 $0.99 $0.96 3.1%

LTL (Ex-YRCW) (28.0%) UNP $1.09 $1.05 $1.14 (7.9% )

GWR $0.71 $0.71 $0.72 (1.4% )

Other Truck KSU $0.97 $0.95 $0.99 (4.0% )

R $1.03 $1.04 $1.05 (1.0% ) WAB $0.99 $0.99 $1.00 (1.0% )

Railroads (1.1%)

Express

UPS $1.23 $1.26 $1.22 3.3%

HUBG $0.44 $0.41 $0.41 0.0%

JBHT $0.85 $0.88 $0.84 4.8%

Intermodal 2.4%

Inside Freight

April 1, 2016

WolfeResearch.com Page 6 of 12

Exhibit 6. Prior, Revised, and Consensus 2016 EPS Estimates

Note: See Rail note published yesterday for explanation of EPS updates.

Source: FactSet; Wolfe Research estimates.

2016E 2017E

Prior Revised Cons. Var. Prior Revised Cons. Var.

CGI $1.10 $1.11 $1.17 (5.1%) CHRW $3.75 $3.75 $3.79 (1.1%)

CVTI $1.66 $1.75 $1.77 (1.1%) EXPD $2.41 $2.40 $2.44 (1.6%)

HTLD $0.75 $0.75 $0.80 (6.3%) FWRD $2.35 $2.35 $2.42 (2.9%)

KNX $1.35 $1.30 $1.35 (3.7%) LSTR $3.25 $3.25 $3.30 (1.5%)

SWFT $1.44 $1.42 $1.52 (6.6%) RRTS $1.20 $1.20 $1.31 (8.4%)

WERN $1.70 $1.72 $1.71 0.6% AAWW $4.60 $4.60 $5.11 (10.0%)

TL Average (3.7%) Non-Asset and Asset-Light Forwarders (4.2%)

ARCB $1.65 $1.55 $1.62 (4.3%) CNI C$4.80 C$4.75 C$4.66 1.9%

ODFL $3.74 $3.75 $3.82 (1.8%) CP C$10.80 C$10.90 C$11.03 (1.2%)

SAIA $1.90 $1.95 $1.98 (1.5%) CSX $1.75 $1.72 $1.84 (6.5%)

YRCW $0.15 $0.20 $1.11 (82.0%) NSC $5.25 $5.30 $5.34 (0.7%)

LTL (Ex-YRCW) (2.6%) UNP $5.25 $5.15 $5.33 (3.4%)

GWR $3.70 $3.75 $3.71 1.1%

Other Truck KSU $4.50 $4.50 $4.55 (1.1%)

R $6.15 $6.15 $6.15 0.0% WAB $4.40 $4.40 $4.35 1.1%

Railroads (1.1%)

FDX $10.90 $10.90 $10.77 1.2%

UPS $5.80 $5.75 $5.77 (0.3%)

Express 0.4%

HUBG $2.25 $2.25 $2.21 1.8%

JBHT $4.10 $4.15 $4.01 3.5%

Intermodal 2.7%

Inside Freight

April 1, 2016

WolfeResearch.com Page 7 of 12

Exhibit 7. Prior, Revised, and Consensus 2017 EPS Estimates

Note: See Rail note published yesterday for explanation of EPS updates.

Source: FactSet; Wolfe Research estimates.

Key Points Expanded

Are Freight Volumes Improving? Exhibit 8 below shows y/y freight volumes by mode and Exhibit 9 shows

the same freight volumes on a 2-year stacked basis. As shown below, we saw solid improvement in y/y

Rail, Truck, Ocean and Air volumes in January and February into a combination of easy comps (West Coast

port issues last year) and mild weather. However, rail volumes deteriorated meaningfully in March, and our

channel checks with private truckers and ports suggest a similar softening into much tougher comps. Also,

Cass shipments and Rail volumes both weakened further on a 2-year stack basis. So our view is that freight

trends generally remain muted and the strength in January and February mostly reflects easier comps that

get tougher the next couple of months.

2017E

Prior Revised Cons. Var. Prior Revised Cons. Var.

CGI $1.15 $1.15 $1.28 (10.2%) CHRW $3.90 $3.95 $4.07 (2.9%)

CVTI $1.80 $2.00 $2.01 (0.5%) EXPD $2.55 $2.50 $2.63 (4.9%)

HTLD $0.85 $0.85 $0.92 (7.6%) FWRD $2.60 $2.60 $2.73 (4.8%)

KNX $1.50 $1.45 $1.55 (6.5%) LSTR $3.50 $3.50 $3.64 (3.8%)

SWFT $1.60 $1.60 $1.73 (7.5%) RRTS $1.20 $1.20 $1.46 (17.8%)

WERN $1.75 $1.80 $1.90 (5.3%) AAWW $4.00 $4.00 $5.11 (21.7%)

TL Average (6.2%) Non-Asset and Asset-Light Forwarders (9.3%)

ARCB $1.90 $1.85 $2.03 (8.9%) CNI C$5.10 C$5.05 C$5.09 (0.8%)

ODFL $4.15 $4.15 $4.29 (3.3%) CP C$12.00 C$12.10 C$12.45 (2.8%)

SAIA $2.00 $2.10 $2.21 (5.0%) CSX $1.90 $1.85 $2.01 (8.0%)

YRCW $1.00 $1.00 $1.71 (41.5%) NSC $6.05 $6.10 $5.94 2.7%

LTL (5.7%) UNP $5.75 $5.60 $5.90 (5.1%)

GWR $4.00 $4.05 $3.98 1.8%

Other Truck KSU $5.00 $5.00 $5.11 (2.2%)

R $6.05 $6.05 $6.51 (7.1%) WAB $4.85 $4.85 $4.58 5.9%

Railroads (1.1%)

FDX $11.65 $11.65 $12.13 (4.0%)

UPS $6.00 $6.00 $6.24 (3.8%)

Express (3.9%)

HUBG $2.30 $2.30 $2.43 (5.3%)

JBHT $4.60 $4.65 $4.53 2.6%

Intermodal (1.4%)

Inside Freight

April 1, 2016

WolfeResearch.com Page 8 of 12

Exhibit 8. Y/Y Transport Volume Growth by Mode

Source: Cass Information Systems, Inc.; American Trucking Associations; Association of American Railroads; Airlines for America; International Air Transport Association; Port of Los Angeles, Port of Long Beach; Port of Oakland; Bureau of Economic Analysis; Wolfe Research.

Exhibit 9. 2-Year Stacked Transport Volume Growth by Mode

Source: Cass Information Systems, Inc.; American Trucking Associations; Association of American Railroads; Airlines for America; International Air Transport Association; Port of Los Angeles, Port of Long Beach; Port of Oakland; Bureau of Economic Analysis; Wolfe Research.

Cass ATA Class I Domestic Int'l Air Combined IANA

Shipment Truck Rail Air Cargo Cargo Tonne WC Port Domestic Freight

Index Tonnage Volumes Ton Miles Kilometers Volumes Containers Average

Jan-15 2.7% 3.7% 5.2% 0.0% 3.9% (25.8%) 12.5% 0.3%

Feb-15 0.9% 4.0% (2.4%) 7.2% 12.7% (19.9%) 8.7% 1.6%

Mar-15 (5.1%) 6.4% 1.3% 1.9% 1.7% 13.3% 7.7% 3.9%

Apr-15 (2.5%) 2.0% (0.9%) 2.3% 3.6% (5.2%) 3.1% 0.3%

May-15 (1.3%) 1.7% (3.6%) (1.8%) 2.6% (0.5%) (0.3%) (0.5%)

Jun-15 (3.4%) 3.5% (3.0%) 4.3% 1.4% (5.7%) 5.3% 0.3%

Jul-15 (1.1%) 2.9% (2.7%) 1.7% (0.7%) 3.2% 3.0% 0.9%

Aug-15 (4.6%) 3.0% (2.1%) (1.7%) 0.5% 7.1% 3.3% 0.8%

Sep-15 (1.5%) 0.8% (2.9%) 5.1% 1.2% (6.2%) 6.0% 0.3%

Oct-15 (5.3%) (0.5%) (5.5%) 0.9% 0.5% (4.0%) 4.3% (1.4%)

Nov-15 (5.1%) 3.2% (5.7%) (0.8%) (1.3%) 2.7% 5.6% (0.2%)

Dec-15 (3.7%) 0.8% (9.1%) 1.4% 0.7% (3.1%) 5.9% (1.0%)

Jan-16 (5.2%) 1.1% (7.2%) 2.1% 28.4% 2.4% 3.6%

Feb-16 (2.6%) 8.6% 0.2% 37.2% 13.8% 11.5%

3Q:15 (2.4%) 2.2% (2.5%) 1.7% 0.3% 1.2% 4.1% 0.7%

4Q:15 (4.7%) 1.2% (6.6%) 0.6% (0.1%) (1.5%) 5.2% (0.8%)

1Q QTD (3.8%) 4.8% (5.7%) 2.1% 32.7% 7.9% 6.3%

Cass ATA Class I Domestic Int'l Air Combined IANA

Shipment Truck Rail Air Cargo Cargo Tonne WC Port Domestic Freight

Index Tonnage Volumes Ton Miles Kilometers Volumes Containers Average

Jan-15 0.7% 4.5% 8.4% 0.4% 9.3% (23.9%) 14.4% 2.0%

Feb-15 0.6% 7.6% (3.5%) 6.5% 15.9% (24.4%) 12.8% 2.2%

Mar-15 (4.7%) 10.0% 6.5% 1.4% 8.5% 29.7% 12.1% 9.1%

Apr-15 2.9% 5.4% 7.1% 8.1% 6.8% 3.7% 12.5% 6.6%

May-15 2.3% 3.7% 3.8% (2.4%) 7.8% 3.1% 5.5% 3.4%

Jun-15 2.4% 8.6% 2.9% 1.8% 4.3% 3.6% 13.5% 5.3%

Jul-15 3.1% 5.3% 4.0% 7.6% 5.7% 1.9% 12.8% 5.8%

Aug-15 0.1% 6.0% 2.5% (4.6%) 5.3% 4.8% 6.2% 2.9%

Sep-15 (0.9%) 6.3% 0.9% 9.7% 6.4% (1.6%) 15.6% 5.2%

Oct-15 (2.2%) 4.0% (0.4%) 0.6% 6.1% (2.6%) 8.5% 2.0%

Nov-15 (1.2%) 4.3% (4.0%) (2.3%) 3.2% (3.8%) 5.7% 0.3%

Dec-15 0.1% 6.9% (4.3%) 6.1% 5.8% (6.0%) 18.3% 3.8%

Jan-16 (2.6%) 4.8% 0.8% 6.1% (4.7%) 15.2% 3.3%

Feb-16 (1.7%) 12.9% (2.4%) 9.8% 23.7% 8.5%

3Q:15 0.7% 5.9% 2.4% 4.0% 5.8% 1.7% 11.4% 4.6%

4Q:15 (1.1%) 5.1% (2.8%) 1.6% 5.0% (4.1%) 10.5% 2.0%

1Q QTD (2.1%) 8.9% (3.5%) 6.1% 2.2% 19.4% 5.2%

Inside Freight

April 1, 2016

WolfeResearch.com Page 9 of 12

TL and LTL Comps. The two exhibits below highlight our expectations for margins, yield growth and

volume growth for TLs and LTLs in 1Q. We expect to see a deceleration in TL pricing gains, but see

potential for utilization declines to moderate. On the LTL side, we expect strong pricing gains with mix

benefits from falling weight/shipment, and moderating tonnage declines.

Exhibit 10. TL Y/Y OR Improvement (Deterioration), Yields Net of Fuel, and Utilization (Loaded Miles/Truck)

Note: (1) Figures for CGI represent Wolfe calendar estimates as CGI ‘s fiscal year ends in June. (2) CNW TL’s segment is included until.3Q:15 (3) HTLD does provide data for yield or utilization. (4) Utilization and yield figures for JBHT represent Truckload only; OR improvement represents Truckload and Dedicated combined.

Source: FactSet; Wolfe Research estimates.

1Q:14 2Q:14 3Q:14 4Q:14 1Q:15 2Q:15 3Q:15 4Q:15 1Q:16E

Operating Ratio Improvement

CGI (1)

(190bp) (100bp) 40bp 240bp 310bp 160bp 100bp (190bp) (200bp)

CVTI 60bp 150bp 400bp 690bp 580bp 350bp 100bp (20bp) (20bp)

HTLD (3)

(1330bp) (400bp) (320bp) 180bp 590bp 70bp (310bp) (100bp) (310bp)

JBHT (4)

(160bp) 50bp 130bp 300bp 580bp 270bp 360bp 140bp 120bp

KNX 160bp 170bp 460bp 370bp 350bp 150bp 80bp (160bp) (250bp)

SWFT (250bp) (100bp) 100bp 210bp 280bp 60bp (220bp) (40bp) (270bp)

WERN (100bp) (60bp) 120bp 270bp 290bp 230bp 300bp 130bp 60bp

Average (260bp) (16bp) 131bp 299bp 391bp 136bp 59bp (34bp) (124bp)

Yields (Revenue / Loaded Mile, net of fuel)

CGI 2.5% 2.0% 2.3% 10.2% 12.6% 11.1% 14.6% 6.6% 6.5%

CVTI 3.3% 3.7% 6.3% 11.6% 6.0% 5.1% 3.2% 11.5% 1.5%

JBHT 9.0% 10.0% 10.0% 10.0% 9.0% (2.0%) 0.0% 0.4% 1.0%

KNX 4.9% 5.6% 6.5% 12.2% 8.5% 6.7% 4.6% (1.5%) (1.5%)

SWFT 3.0% 3.7% 5.1% 6.4% 6.0% 4.9% 3.6% 1.9% 0.8%

WERN 1.9% 1.2% 1.7% 4.6% 3.7% 3.9% 3.4% 1.1% 1.8%

Average 3.6% 3.9% 4.9% 8.2% 6.9% 4.6% 4.9% 3.3% 1.7%

Utilization (Loaded Miles / Tractor)

CGI (7.0%) 0.3% (0.1%) (0.6%) (2.0%) (8.3%) (15.4%) (17.3%) (15.0%)

CVTI (1.6%) 3.0% 6.3% 7.9% 5.8% 1.0% (2.7%) (7.7%) (2.0%)

JBHT (6.6%) (0.5%) 0.3% 1.0% 1.6% (3.2%) (4.1%) (2.4%) (2.5%)

KNX 0.3% 0.4% 0.9% (0.1%) (3.6%) (3.8%) (2.7%) (2.1%) (0.5%)

SWFT (1.5%) 1.8% 2.2% 2.5% 1.1% (1.4%) (2.2%) (2.1%) (0.5%)

WERN (0.3%) 3.7% 5.6% 3.9% 1.8% (0.3%) (1.3%) (3.4%) (2.0%)

Average (3.0%) 0.8% 1.5% 1.5% 0.1% (3.3%) (4.7%) (5.9%) (3.8%)

Inside Freight

April 1, 2016

WolfeResearch.com Page 10 of 12

Exhibit 11. LTL Y/Y OR Improvement (Deterioration), Yields Net of Fuel, and Volumes (Tonnage/day, y/y)

Note: CNW is included until 3Q:15. FDX reported F3Q16 results (which we equate with C1Q). All other companies have yet to report. LTL Avg. for Daily Tonnage is calculated on a volume-weighted basis.

Source: FactSet; Wolfe Research estimates.

1Q:14 2Q:14 3Q:14 4Q:14 1Q:15 2Q:15 3Q:15 4Q:15 1Q:16E

OR Improvement (y/y)

ARCB 337bp 358bp 110bp 146bp 236bp 87bp 44bp (146bp) (195bp)

FDX Freight 190bp 210bp 340bp 120bp 200bp 30bp (220bp) (60bp) (80bp)

ODFL 60bp 100bp 110bp 260bp 200bp 100bp 90bp (10bp) (20bp)

SAIA Freight (23bp) (107bp) 68bp 139bp 216bp 279bp (191bp) (52bp) (110bp)

UPS Freight 0bp 100bp 0bp 100bp (30bp) (50bp) 50bp 0bp (50bp)

YRCW Consolidated (353bp) (14bp) 156bp 269bp 299bp 300bp 181bp (139bp) (63bp)

Average (ex. YRCW) 95bp 131bp 125bp 153bp 161bp 62bp (45bp) (54bp) (91bp)

% Chg in Yields (Rev/cwt, net of fuel surcharge (y/y)

ARCB 0.9% 3.1% 3.5% 5.5% 8.7% 5.4% 6.3% 4.8% 2.0%

FDX Freight (3.3%) (1.3%) 1.5% 4.9% 7.1% 6.0% 4.1% 1.8% (1.1%)

ODFL 2.2% 3.6% 2.2% 3.0% 6.2% 5.3% 5.2% 6.1% 3.8%

SAIA Freight 2.5% 4.4% 4.0% 6.4% 10.1% 10.8% 10.7% 11.5% 9.0%

UPS Freight 5.5% 6.0% 2.3% 5.9% 6.0% 5.5% 6.0% 6.5% 5.4%

YRCW Consolidated (22.0%) (19.2%) (18.3%) 12.0% 16.7% 7.4% 12.4% 7.9% 5.9%

Average (ex. YRCW) 1.5% 3.3% 3.1% 5.5% 7.8% 6.4% 6.5% 6.1% 3.8%

% Chg in Volumes (Tonnage/day, y/y)

ARCB 4.6% 6.0% 6.4% 9.4% (0.5%) 1.9% (2.5%) (4.9%) (0.5%)

FDX Freight 9.0% 13.6% 12.4% 9.2% 4.2% 0.2% (0.6%) 0.1% 5.5%

ODFL 13.9% 14.9% 18.7% 19.8% 11.4% 9.1% 6.6% 3.0% 1.8%

SAIA 5.7% 6.9% 8.2% 4.3% (6.7%) (6.0%) (6.7%) (8.9%) (3.5%)

UPS Freight (1.9%) 1.3% 5.4% 4.8% (0.1%) (4.8%) (10.2%) (12.4%) (7.5%)

YRCW Consolidated 2.2% 6.3% 6.2% (0.7%) (0.9%) (4.8%) (4.8%) (4.6%) (4.8%)

Average (ex. YRCW) 5.3% 7.3% 8.4% 8.1% 1.2% (0.4%) (2.7%) (4.6%) (0.8%)

Inside Freight

April 1, 2016

WolfeResearch.com Page 11 of 12

DISCLOSURE SECTION

Analyst Certification:

The analyst of Wolfe Research, LLC primarily responsible for this research report whose name appears first on the front page of this research report hereby certifies that (i) the recommendations and opinions expressed in this research report accurately reflect the research analysts’ personal views about the subject securities or issuers and (ii) no part of the research analysts’ compensation was, is or will be directly or indirectly related to the specific recommendations or views contained in this report.

Other Disclosures:

Wolfe Research, LLC Fundamental Stock Ratings Key:

Outperform (OP): The security is projected to outperform analyst's industry coverage universe over the next 12 months.

Peer Perform (PP): The security is projected to perform approximately in line with analyst's industry coverage universe over the next 12 months.

Underperform (UP): The security is projected to underperform analyst's industry coverage universe over the next 12 months.

Wolfe Research, LLC uses a relative rating system using terms such as Outperform, Peer Perform and Underperform (see definitions above). Please carefully read the definitions of all ratings used in Wolfe Research, LLC research. In addition, since Wolfe Research, LLC research contains more complete information concerning the analyst’s views, please carefully read Wolfe Research, LLC research in its entirety and not infer the contents from the ratings alone. In all cases, ratings (or research) should not be used or relied upon as investment advice and any investment decisions should be based upon individual circumstances and other considerations.

Wolfe Research, LLC Sector Weighting System:

Market Overweight (MO): Expect the industry to outperform the primary market index for the region (S&P 500 in the U.S.) by at least 10% over the next 12 months.

Market Weight (MW): Expect the industry to perform approximately in line with the primary market index for the region (S&P 500 in the U.S.) over the next 12 months.

Market Underweight (MU): Expect the industry to underperform the primary market index for the region (S&P 500 in the U.S.) by at least 10% over the next 12 months.

Wolfe Research, LLC Distribution of Fundamental Stock Ratings (As of December 31, 2015):

Outperform: 40% 1% Investment Banking Clients Peer Perform: 49% 2% Investment Banking Clients Underperform: 11% 0% Investment Banking Clients

Wolfe Research, LLC does not assign ratings of Buy, Hold or Sell to the stocks it covers. Outperform, Peer Perform and Underperform are not the respective equivalents of Buy, Hold and Sell but represent relative weightings as defined above. To satisfy regulatory requirements, Outperform has been designated to correspond with Buy, Peer Perform has been designated to correspond with Hold and Underperform has been designated to correspond with Sell.

Wolfe Research Securities and Wolfe Research, LLC have adopted the use of Wolfe Research as brand names. Wolfe Research Securities, a member of FINRA (www.finra.org) is the broker-dealer affiliate of Wolfe Research, LLC and is responsible for the contents of this material. Any analysts publishing these reports are dually employed by Wolfe Research, LLC and Wolfe Research Securities.

The content of this report is to be used solely for informational purposes and should not be regarded as an offer, or a solicitation of an offer, to buy or sell a security, financial instrument or service discussed herein. Opinions in this communication constitute the current judgment of the author as of the date and time of this report and are subject to change without notice. Information herein is believed to be reliable but Wolfe Research and its affiliates, including but not limited to Wolfe Research Securities, makes no representation that it is complete or accurate. The information provided in this communication is not designed to replace a recipient's own decision-making processes for assessing a proposed transaction or investment involving a financial instrument discussed herein. Recipients are encouraged to seek financial advice from their financial advisor regarding the appropriateness of investing in a security or financial instrument referred to in this report and should understand that statements regarding the future performance of the financial instruments or the securities referenced herein may not be realized. Past performance is not indicative of future results. This report is not intended for distribution to, or use by, any person or entity in any location where such distribution or use would be contrary to applicable law, or which would subject Wolfe Research, LLC or any affiliate to any registration requirement within such location. For additional important disclosures, please see www.WolfeResearch.com/Disclosures.

Inside Freight

April 1, 2016

WolfeResearch.com Page 12 of 12

The views expressed in Wolfe Research, LLC research reports with regards to sectors and/or specific companies may from time to time be inconsistent with the views implied by inclusion of those sectors and companies in other Wolfe Research, LLC analysts’ research reports and modeling screens. Wolfe Research communicates with clients across a variety of mediums of the clients’ choosing including emails, voice blasts and electronic publication to our proprietary website.

Copyright © Wolfe Research, LLC 2016. All rights reserved. All material presented in this document, unless specifically indicated otherwise, is under copyright to Wolfe Research, LLC. None of the material, nor its content, nor any copy of it, may be altered in any way, or transmitted to or distributed to any other party, without the prior express written permission of Wolfe Research, LLC.

This report is limited for the sole use of clients of Wolfe Research. Authorized users have received an encryption decoder which legislates and monitors the access to Wolfe Research, LLC content. Any distribution of the content produced by Wolfe Research, LLC will violate the understanding of the terms of our relationship.


Recommended