14
| Date post: | 06-Apr-2018 |
| Category: |
Documents |
| Upload: | sanket1675 |
| View: | 216 times |
| Download: | 0 times |

8/3/2019 Airline Balance Scorecard
http://slidepdf.com/reader/full/airline-balance-scorecard 1/14
8/3/2019 Airline Balance Scorecard
http://slidepdf.com/reader/full/airline-balance-scorecard 2/14
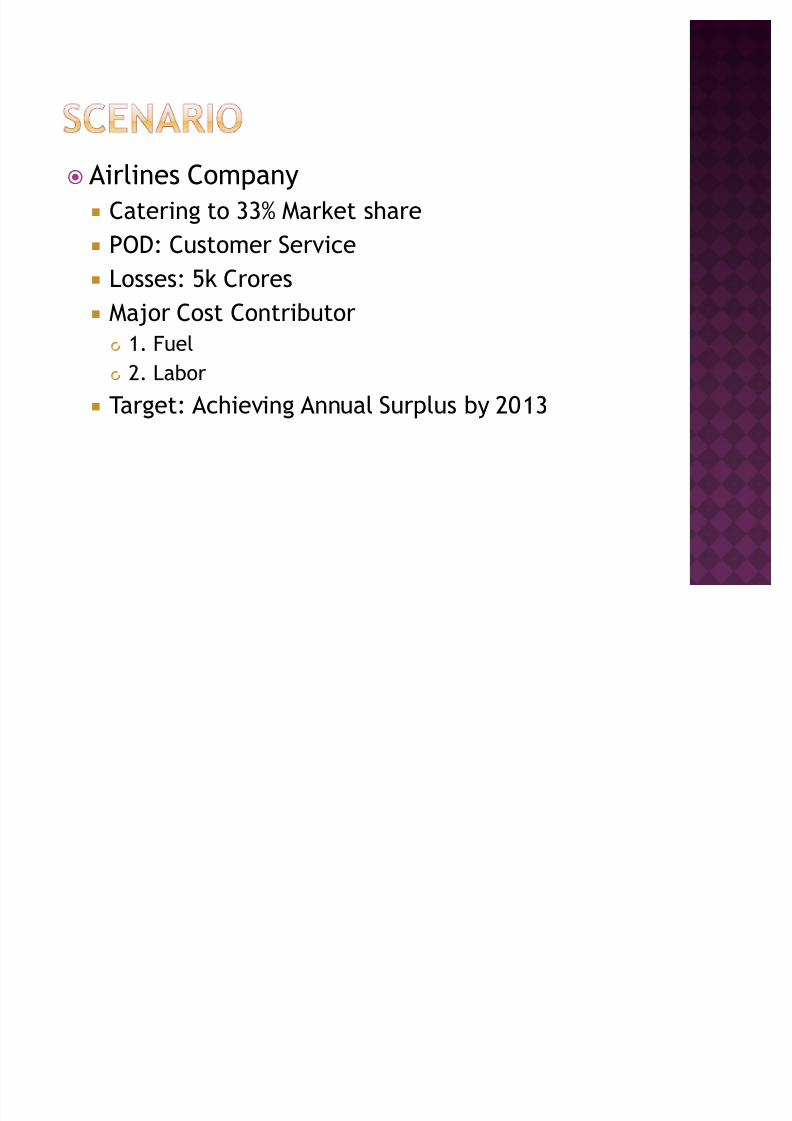
Airlines Company
Catering to 33% Market share
POD: Customer Service
Losses: 5k Crores Major Cost Contributor
1. Fuel
2. Labor
Target: Achieving Annual Surplus by 20
13
8/3/2019 Airline Balance Scorecard
http://slidepdf.com/reader/full/airline-balance-scorecard 3/14
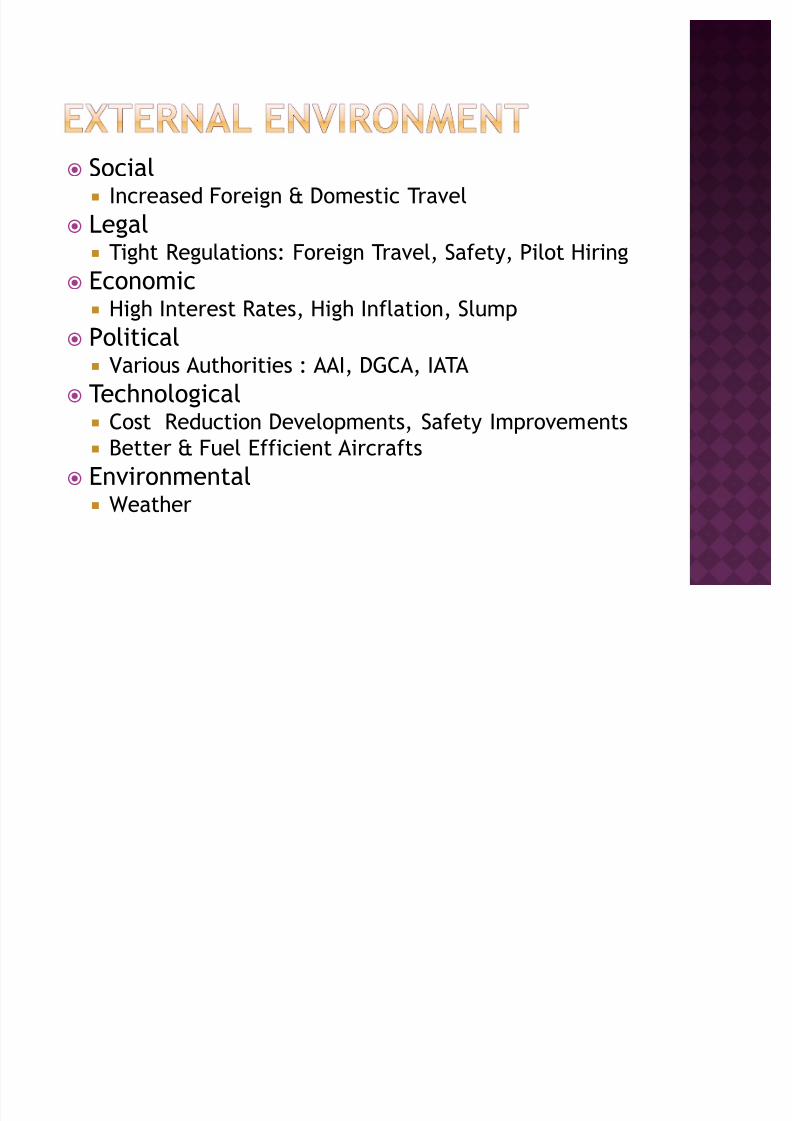
Social Increased Foreign & Domestic Travel
Legal Tight Regulations: Foreign Travel, Safety, Pilot Hiring
Economic High Interest Rates, High Inflation, Slump
Political Various Authorities : AAI, DGCA, IATA
Technological Cost Reduction Developments, Safety Improvements Better & Fuel Efficient Aircrafts
Environmental Weather
8/3/2019 Airline Balance Scorecard
http://slidepdf.com/reader/full/airline-balance-scorecard 4/14
Culture
Lively Culture
Company Values
Customer First
Policy / Commitments
Developed over 8 years
Stable and follows the environment
8/3/2019 Airline Balance Scorecard
http://slidepdf.com/reader/full/airline-balance-scorecard 5/14
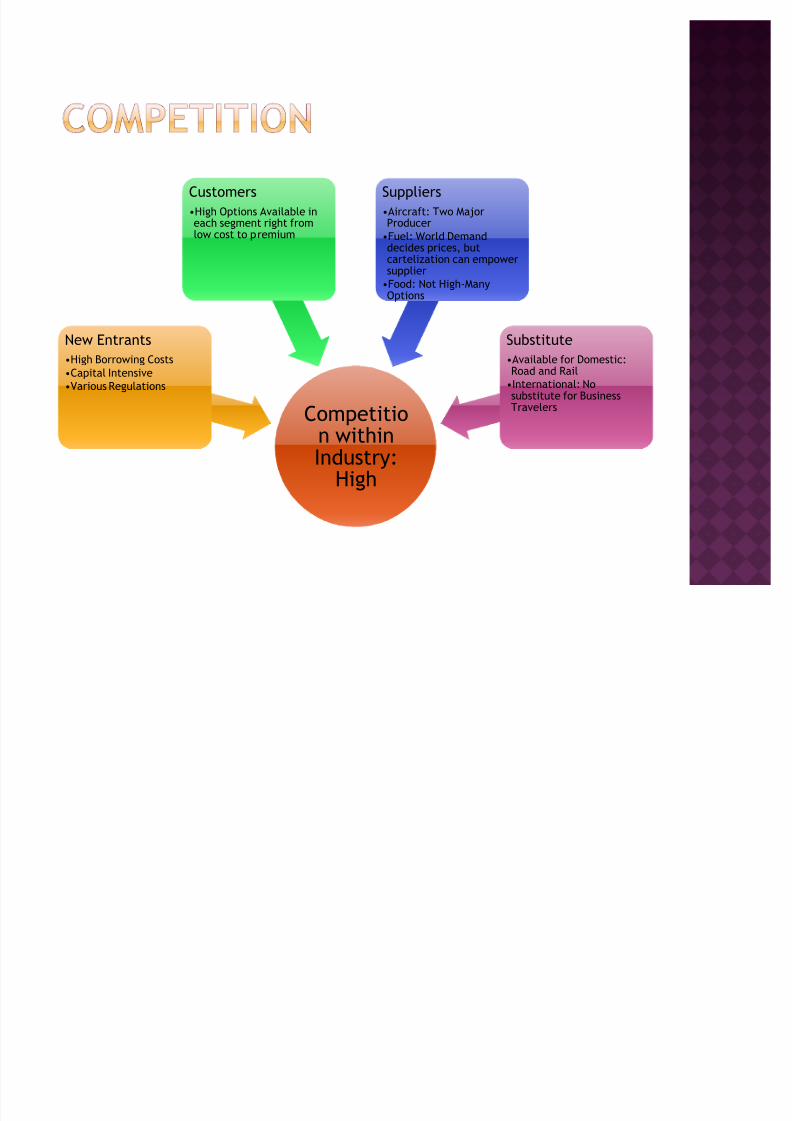
Competition withinIndustry:
High
Competition withinIndustry:
High
New Entrants
High Borrowing Costs
Capital Intensive
Various Regulations
New Entrants
High Borrowing Costs
Capital Intensive
Various Regulations
Customers
High Options Available ineach segment right fromlow cost to premium
Customers
High Options Available ineach segment right fromlow cost to premium
Suppliers
Aircraft: Two MajorProducer
Fuel: World Demanddecides prices, butcartelization can empower
supplierFood: Not High-ManyOptions
Suppliers
Aircraft: Two MajorProducer
Fuel: World Demanddecides prices, butcartelization can empower
supplierFood: Not High-ManyOptions
Substitute
Available for Domestic:Road and Rail
International: Nosubstitute for BusinessTravelers
Substitute
Available for Domestic:Road and Rail
International: Nosubstitute for BusinessTravelers
8/3/2019 Airline Balance Scorecard
http://slidepdf.com/reader/full/airline-balance-scorecard 6/14
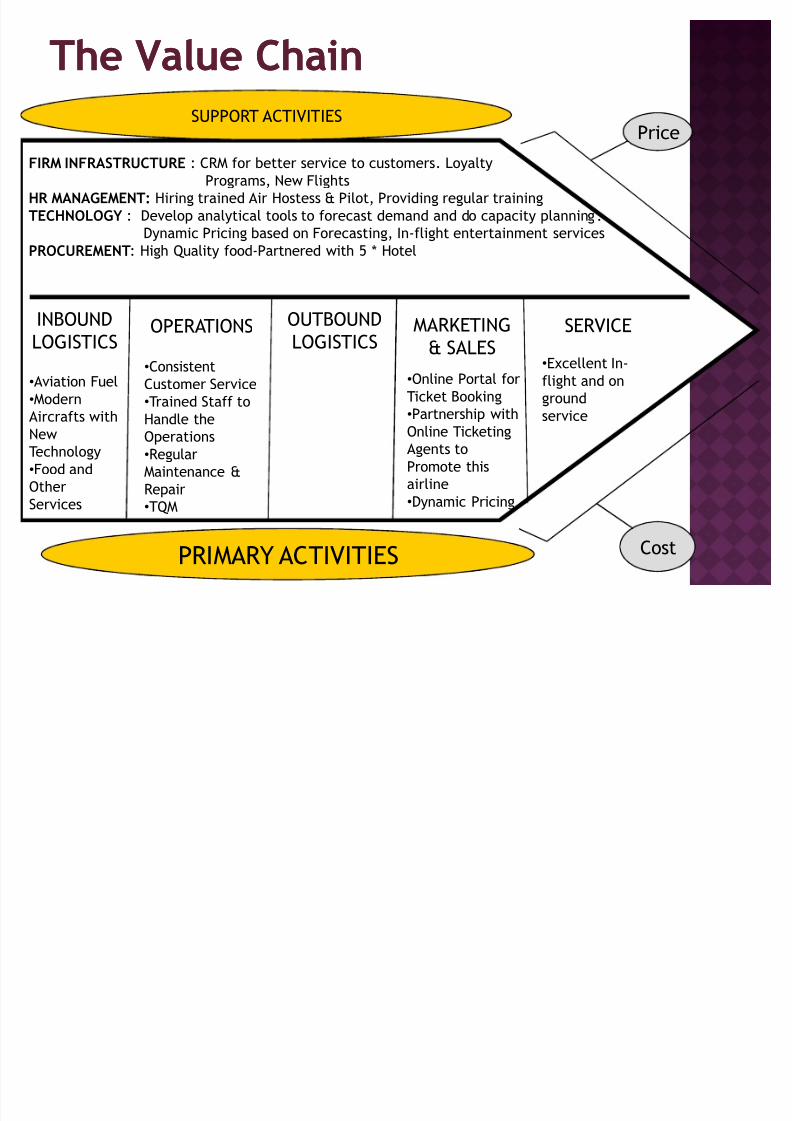
FIRM INFRASTRUCTURE : CRM for better service to customers. Loyalty
Programs, New Flights
HR MANAGEMENT: Hiring trained Air Hostess & Pilot, Providing regular training
TECHNOLOGY : Develop analytical tools to forecast demand and do capacity planning.
Dynamic Pricing based on Forecasting, In-flight entertainment services
PROCUREMENT: High Quality food-Partnered with 5 * Hotel
PRIMARY ACTIVITIES
SUPPORT ACTIVITIES
Price
Cost
Consistent
Customer Service
Trained Staff to
Handle theOperations
Regular
Maintenance &
Repair
TQM
The Value ChainThe Value Chain
INBOUND
LOGISTICSOPERATIONS SERVICEOUTBOUND
LOGISTICSMARKETING
& SALES
Aviation Fuel
Modern
Aircrafts withNew
Technology
Food and
Other
Services
Online Portal for
Ticket Booking
Partnership withOnline Ticketing
Agents to
Promote this
airline
Dynamic Pricing
Excellent In-
flight and on
ground
service
8/3/2019 Airline Balance Scorecard
http://slidepdf.com/reader/full/airline-balance-scorecard 7/14
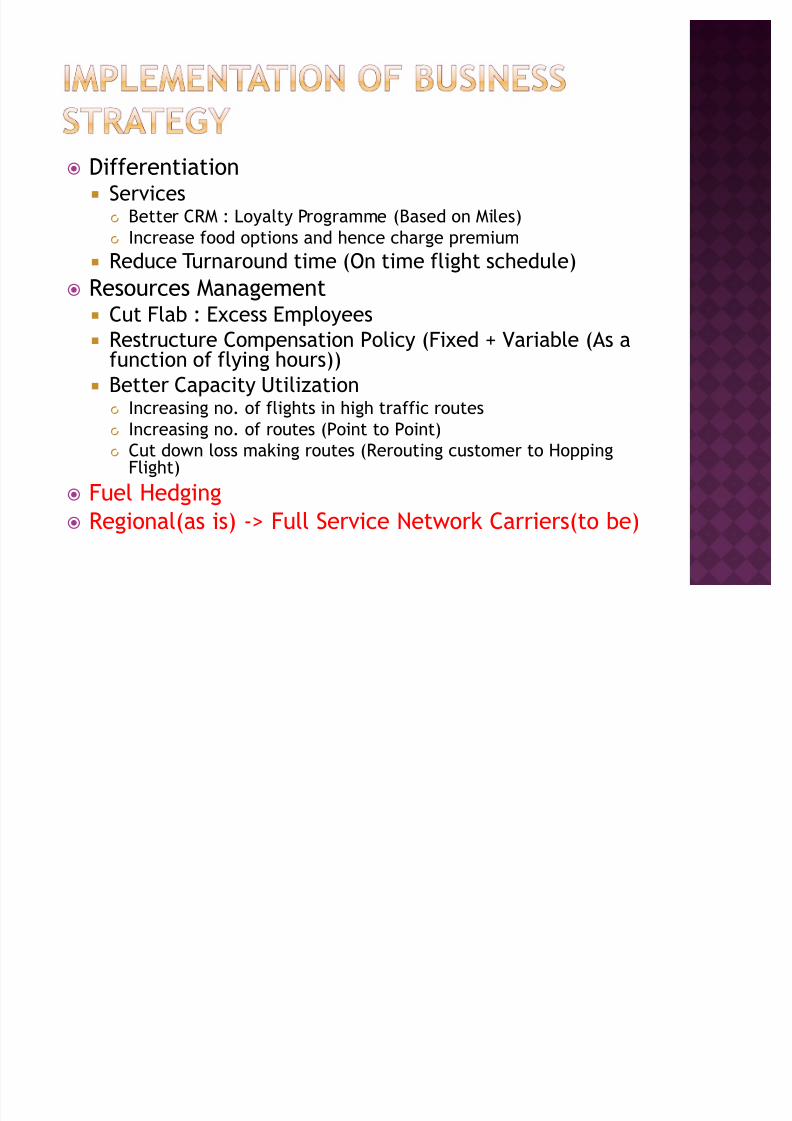
Differentiation Services
Better CRM : Loyalty Programme (Based on Miles)
Increase food options and hence charge premium
Reduce Turnaround time (On time flight schedule)
Resources Management Cut Flab : Excess Employees
Restructure Compensation Policy (Fixed + Variable (As afunction of flying hours))
Better Capacity Utilization
Increasing no.
of flights in high traffic routes Increasing no. of routes (Point to Point)
Cut down loss making routes (Rerouting customer to HoppingFlight)
Fuel Hedging
Regional(as is) -> Full Service Network Carriers(to be)

8/3/2019 Airline Balance Scorecard
http://slidepdf.com/reader/full/airline-balance-scorecard 8/14
Internal Factors
High Fixed CostHigh Variable Costs
Well Trained Crew
External FactorsIncreasing Fuel costsIncreasing Air Traffic
Oligopolistic Market in
Regional ² Full Service
Carriers
Business Strategy ²
Differentiation Increase Revenues with
Increased Prices & Traffic
Reduce Operational Costs
8/3/2019 Airline Balance Scorecard
http://slidepdf.com/reader/full/airline-balance-scorecard 9/14
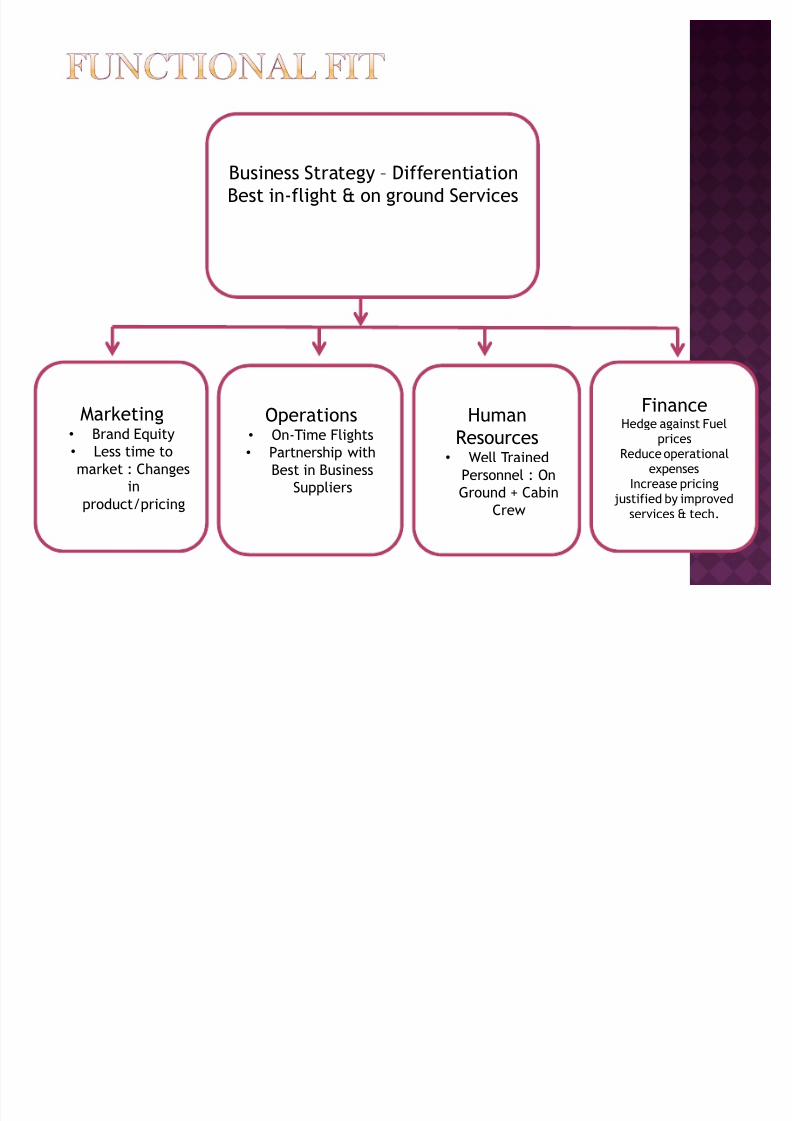
Business Strategy ² Differentiation
Best in-flight & on ground Services
Marketing Brand Equity
Less time to
market : Changes
in
product/pricing
Operations On-Time Flights
Partnership with
Best in Business
Suppliers
HumanResources
Well Trained
Personnel : On
Ground + Cabin
Crew
FinanceHedge against Fuelprices
Reduce operationalexpenses
Increase pricingjustified by improved
services & tech.
8/3/2019 Airline Balance Scorecard
http://slidepdf.com/reader/full/airline-balance-scorecard 10/14
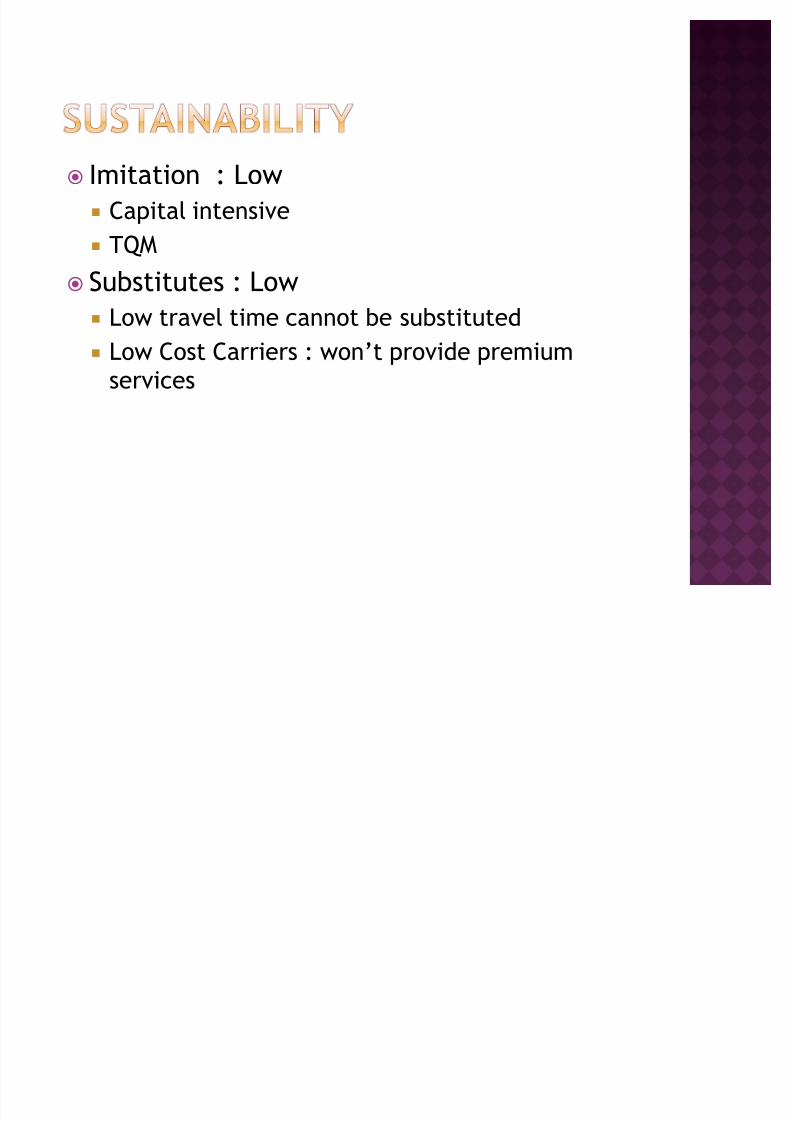
Imitation : Low
Capital intensive
TQM
Substitutes : Low Low travel time cannot be substituted
Low Cost Carriers : won·t provide premium
services
8/3/2019 Airline Balance Scorecard
http://slidepdf.com/reader/full/airline-balance-scorecard 11/14
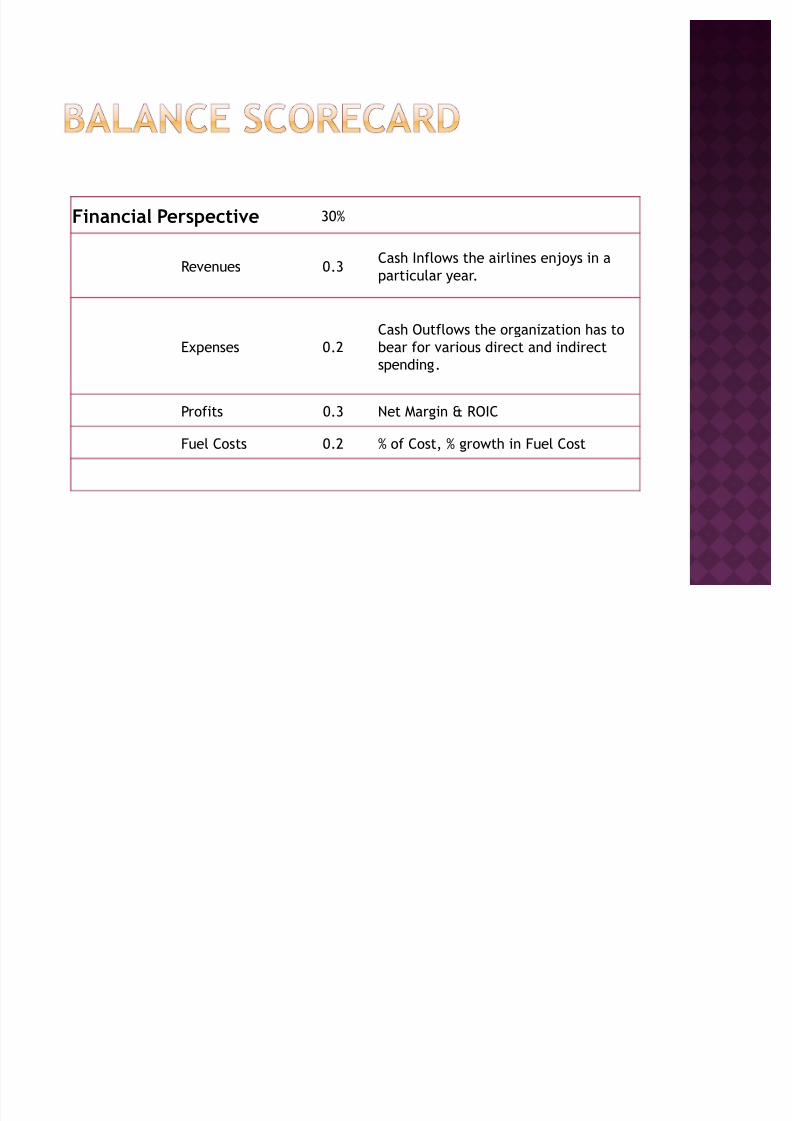
Financial Perspective 30%
Revenues 0.3Cash Inflows the airlines enjoys in a
particular year.
Expenses 0.2
Cash Outflows the organization has to
bear for various direct and indirect
spending.
Profits 0.3 Net Margin & ROIC
Fuel Costs 0.2 % of Cost, % growth in Fuel Cost
8/3/2019 Airline Balance Scorecard
http://slidepdf.com/reader/full/airline-balance-scorecard 12/14
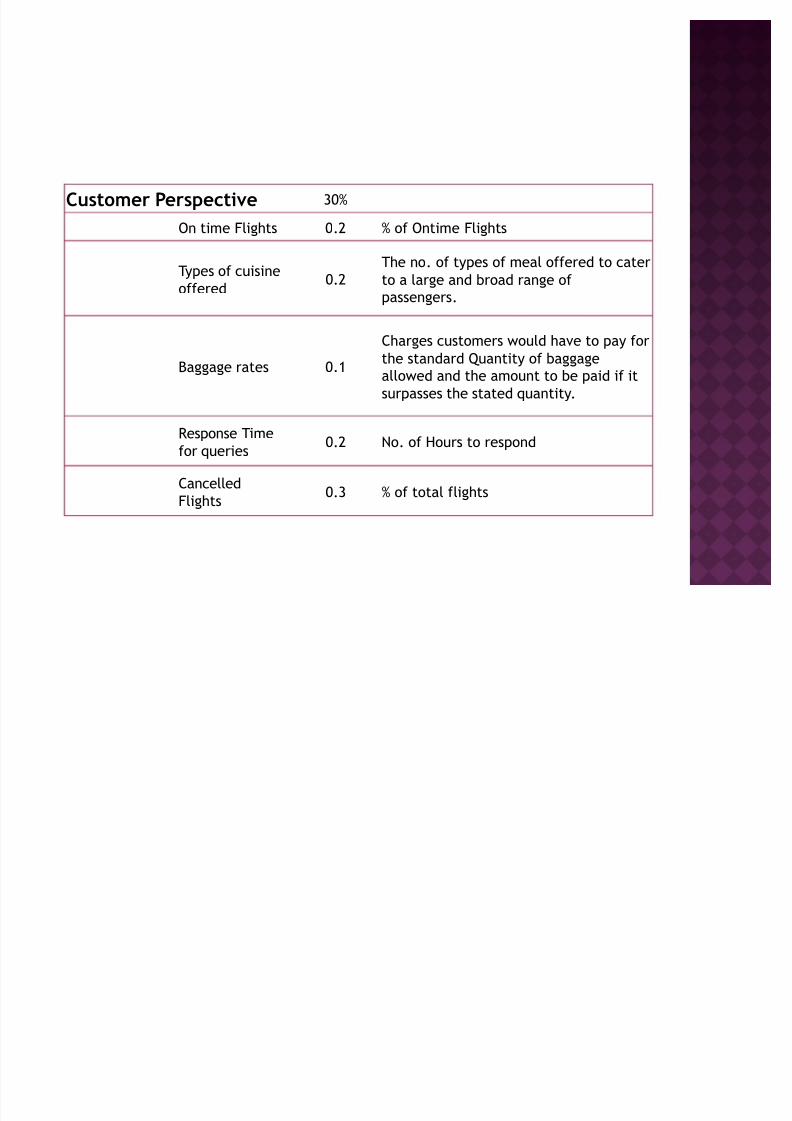
Customer Perspective 30%
On time Flights 0.2 % of Ontime Flights
Types of cuisineoffered 0.2
The no. of types of meal offered to cater
to a large and broad range ofpassengers.
Baggage rates 0.1
Charges customers would have to pay for
the standard Quantity of baggage
allowed and the amount to be paid if it
surpasses the stated quantity.
Response Time
for queries0.2 No. of Hours to respond
Cancelled
Flights0.3 % of total flights
8/3/2019 Airline Balance Scorecard
http://slidepdf.com/reader/full/airline-balance-scorecard 13/14
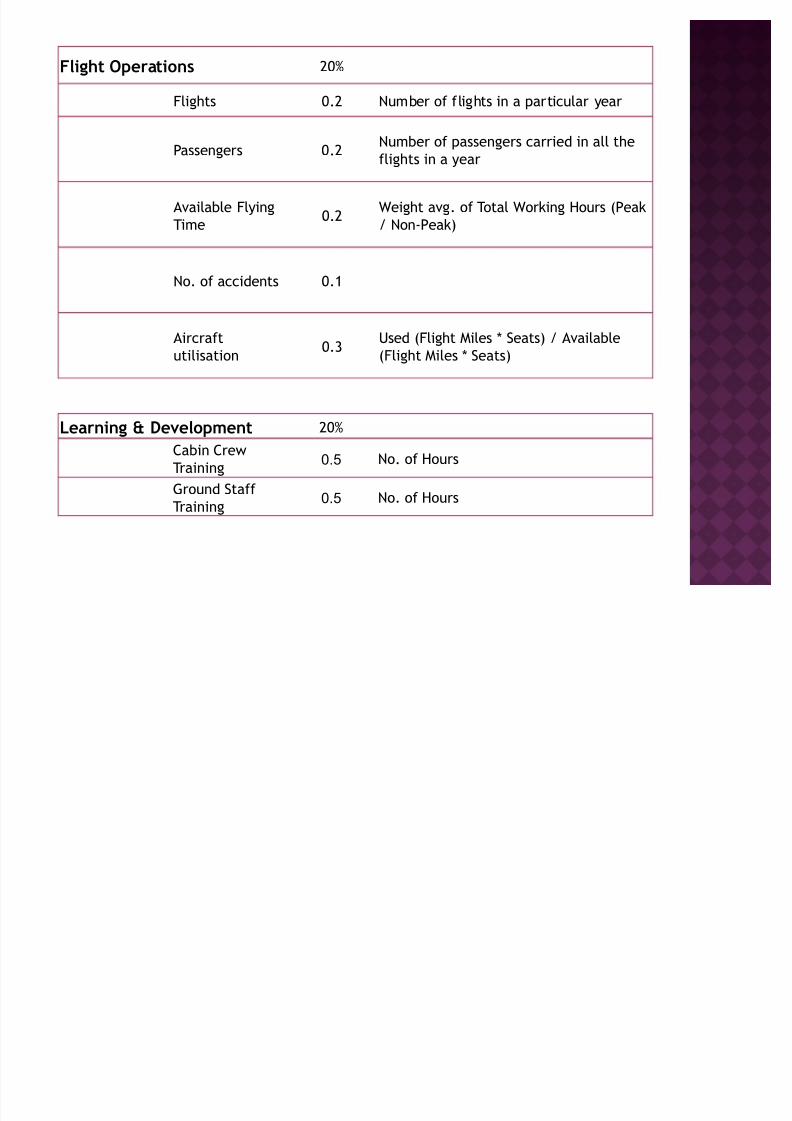
Flight Operations 20%
Flights 0.2 Number of flights in a particular year
Passengers 0.2 Number of passengers carried in all theflights in a year
Available Flying
Time0.2
Weight avg. of Total Working Hours (Peak
/ Non-Peak)
No. of accidents 0.1
Aircraft
utilisation0.3
Used (Flight Miles * Seats) / Available
(Flight Miles * Seats)
Learning & Development 20%
Cabin Crew
Training0.5 No. of Hours
Ground Staff
Training0.5 No. of Hours

8/3/2019 Airline Balance Scorecard
http://slidepdf.com/reader/full/airline-balance-scorecard 14/14


