Airline Industry Recent Trend Update (October 2009) Prof. R. John Prof. R. John Hansman Hansman With the help of the Faculty and Students of the MIT Global With the help of the Faculty and Students of the MIT Global Industry Study Industry Study [email protected][email protected]Traffic Source: Sage Analysis courtesy Prof Ian Waitz * Presentation for Educational Use Only
Transcript
Airline Industry Recent Trend Update (October 2009)
Prof. R. John Prof. R. John HansmanHansman
With the help of the Faculty and Students of the MIT Global With the help of the Faculty and Students of the MIT Global Industry StudyIndustry Study
[email protected]@mit.eduTraffic Source: Sage Analysis courtesy Prof Ian Waitz * Presentation for Educational Use Only
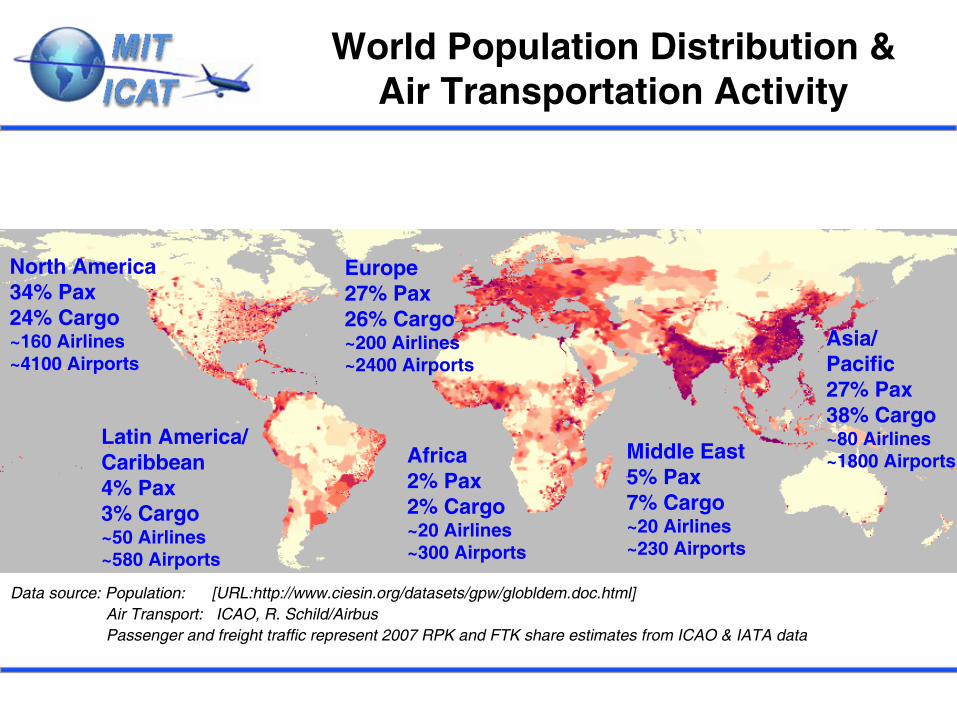
World Population Distribution & Air Transportation Activity
Data source: Population: [URL:http://www.ciesin.org/datasets/gpw/globldem.doc.html]Air Transport: ICAO, R. Schild/AirbusPassenger and freight traffic represent 2007 RPK and FTK share estimates from ICAO & IATA data
North America34% Pax24% Cargo~160 Airlines~4100 Airports
Latin America/Caribbean4% Pax3% Cargo~50 Airlines~580 Airports
Europe27% Pax26% Cargo~200 Airlines~2400 Airports
Africa2% Pax2% Cargo ~20 Airlines~300 Airports
Asia/Pacific27% Pax38% Cargo~80 Airlines~1800 AirportsMiddle East
5% Pax7% Cargo~20 Airlines~230 Airports
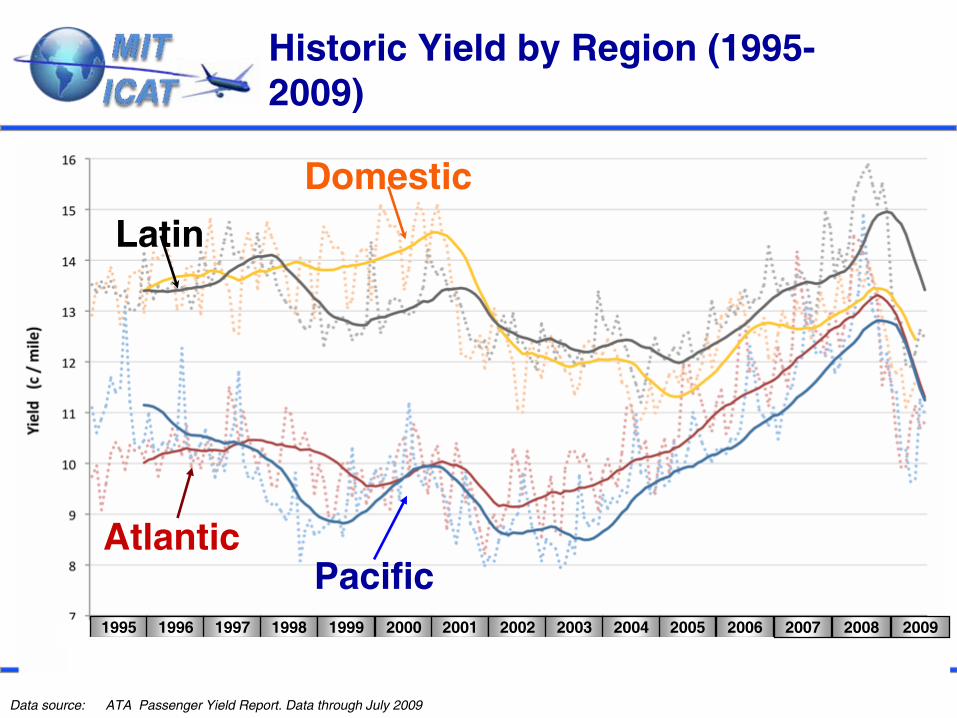
Revenue Passenger Kilometers (RPK) by Region
Data source: ICAO for 1970 to 2008 – IATA for 2009 estimate based on May2009-May2008 year over year data
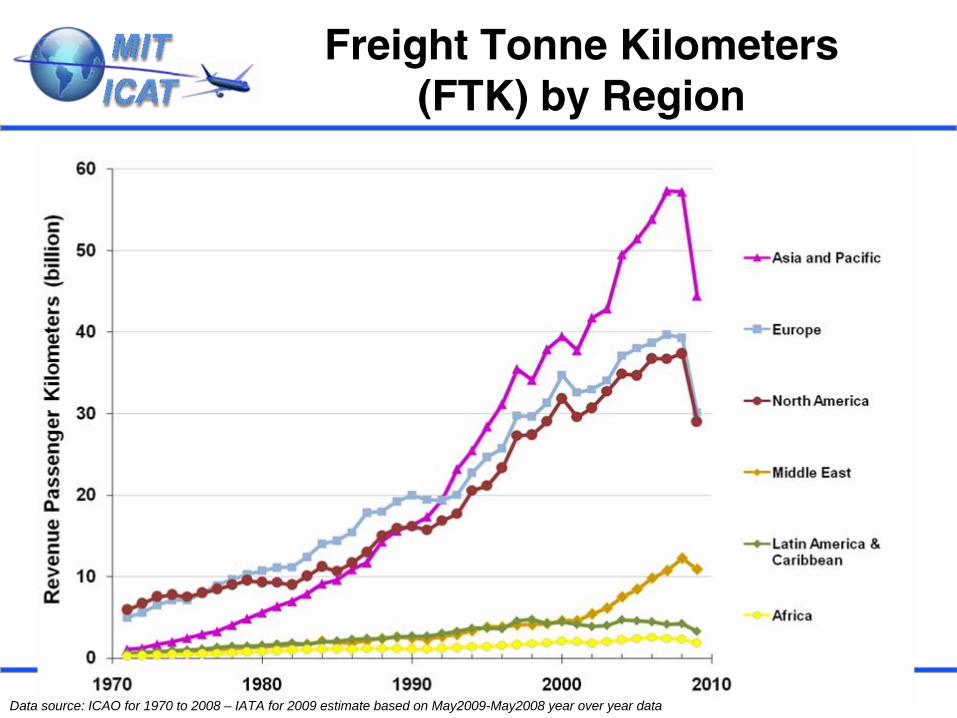
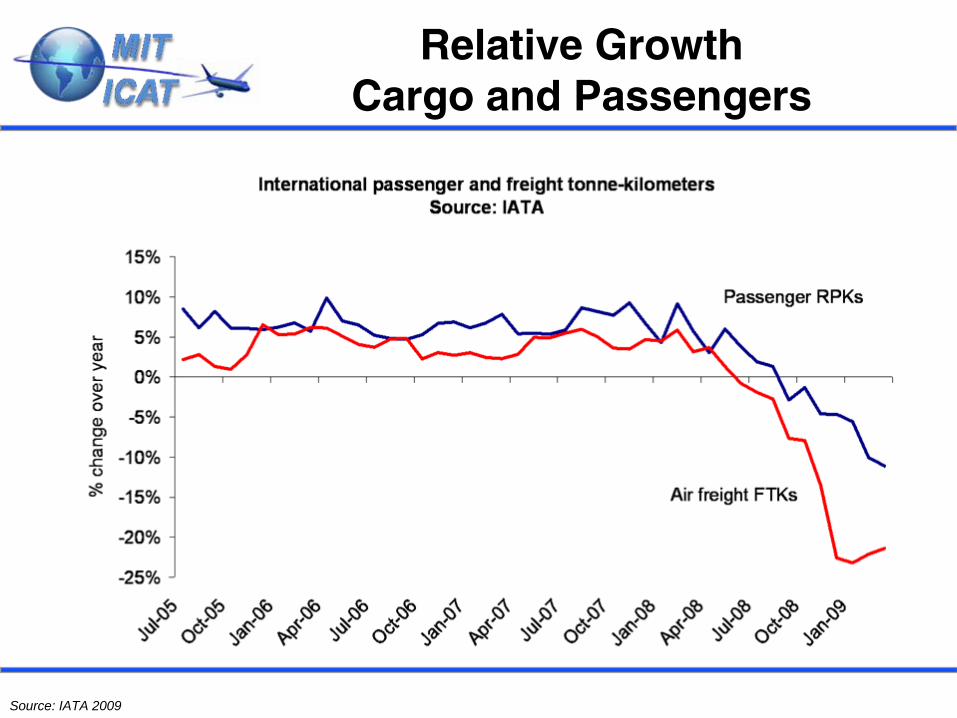
Freight Tonne
Kilometers (FTK) by Region
Data source: ICAO for 1970 to 2008 – IATA for 2009 estimate based on May2009-May2008 year over year data
Economic Shocks Demand Uncertainty
Source: Capital Link Shipping
Market Indices 8/4/08-10/31/08
Dow Jones Index
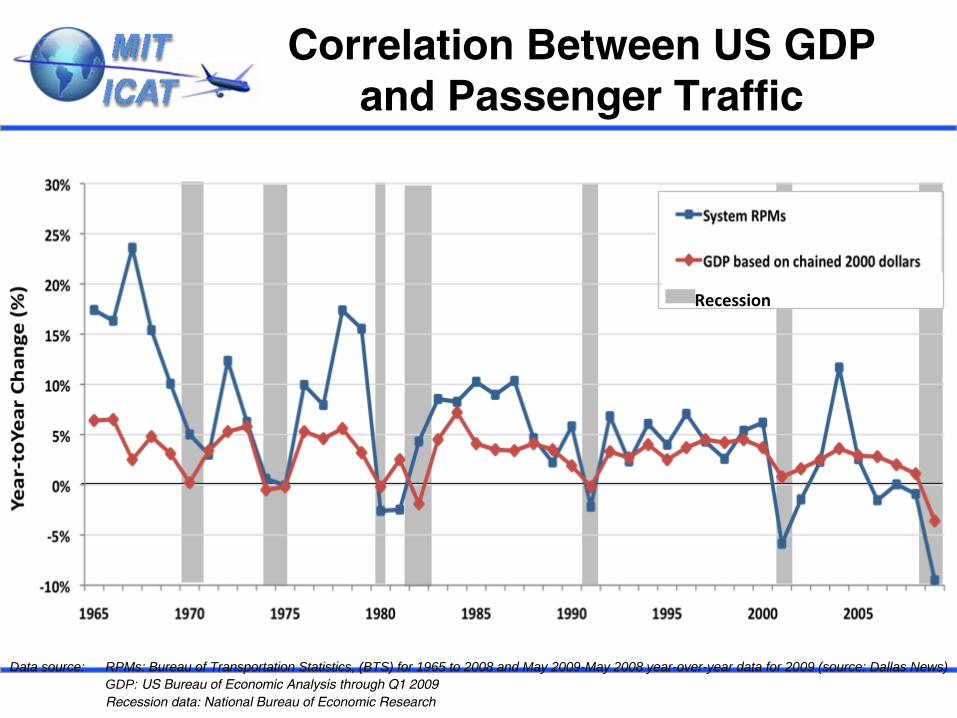
Relationship Between Economy and Air Transportation
Data source: RPMs: Bureau of Transportation Statistics, (BTS) for 1965 to 2008 and May 2009-May 2008 year-over-year data for 2009 (source: Dallas News)GDP: US Bureau of Economic Analysis through Q1 2009Recession data: National Bureau of Economic Research
Recession
Air Transportation Markets 2004 Data
Macro Scale Drivers US Airline Net Profit
Cyclic Industry with Exponential Growth In Volatility Since DereCyclic Industry with Exponential Growth In Volatility Since Deregulationgulation
DeregulationDeregulation
Data source: ATA Annual Revenue and Earnings - Net Profit and Loss
U.S. Airlines Net Profit Best Fit of Undamped
Oscillation –Cycle Period = 11.3 yr
ATA data
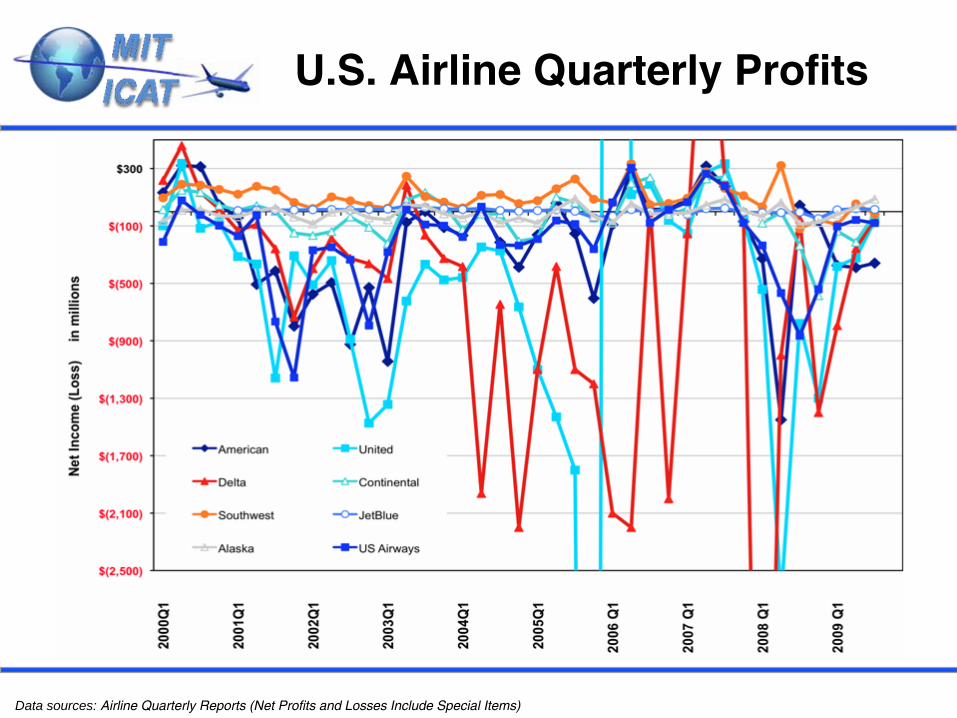
Airline Quarterly Financial Reports
* American Airlines, United Air Lines, Delta Air Lines, Northwest Airlines, Continental Airlines, US Airways, Southwest Airlines, JetBlue
Airways, Alaska Airlines,
Data source: ATA -
available at: www.airlines.org
& Airline Quarterly Reports (Net Profits and Losses Exclude Special Items)
Data source: ICAO data (1978 to 2007) and IATA (2007-2009) Forecast from June 9th
2009
Historical data
IATA (Forecast)
Note: IATA represents 250 airlines comprising 94% of the international scheduled air traffic
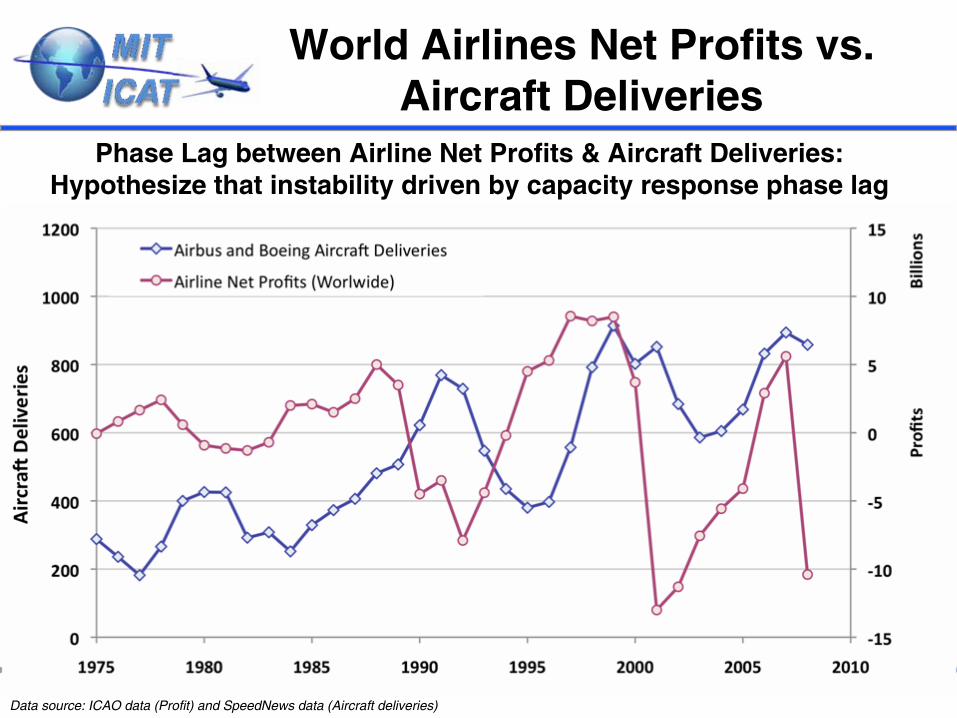
World Airlines Net Profits vs. Aircraft Deliveries
Data source: ICAO data (Profit) and SpeedNews
data (Aircraft deliveries)
Phase Lag between Airline Net Profits & Aircraft Deliveries: Hypothesize that instability driven by capacity response phase lag
World Airlines Net Profits vs. Aircraft Orders
Data source: ICAO data (Profit) and SpeedNews
data (Aircraft orders)
U.S. Domestic ASMs
and RPMs
ASMs
RPMs
Data source: ATA for 1970-2008, "U.S. Airlines“ defined as U.S. Department of Transportation (DOT) in Form 41 Financial and Traffic Reports (total of 89 airlines).
Note: Data for 2009 - Jan to May - from DOT Form 41 available from BTS – Projected to full year 2009 based on Jan-May data
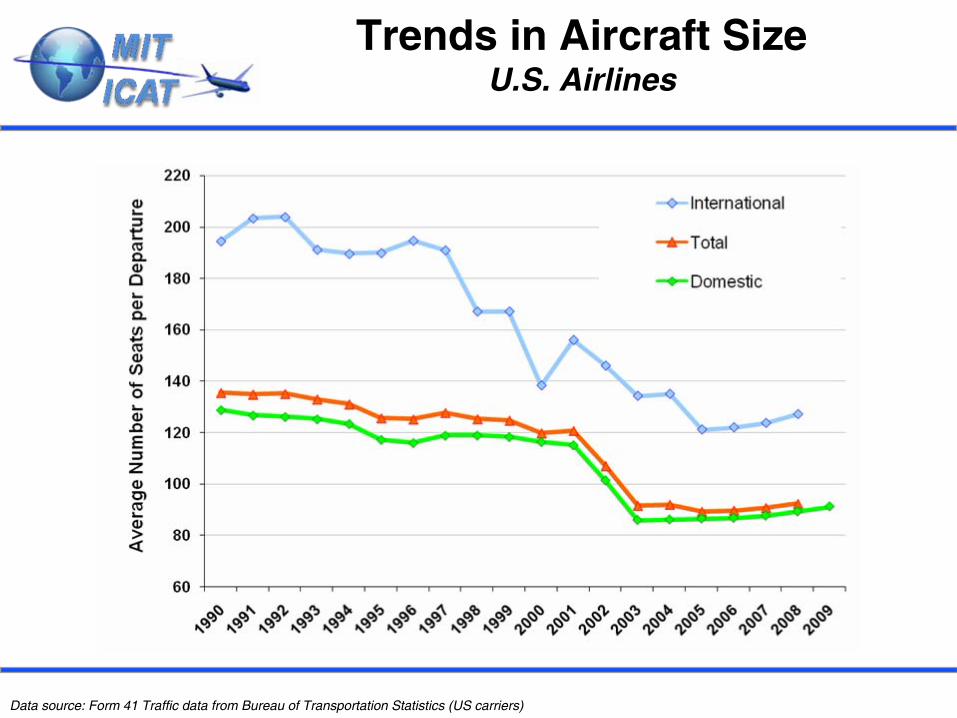
Trends in Aircraft Size U.S. Airlines
Data source: Form 41 Traffic data from Bureau of Transportation Statistics (US carriers)
Data source: ATA for 1970-2008, "U.S. Airlines“ defined as U.S. Department of Transportation (DOT) in Form 41 Financial and Traffic Reports (total of 89 airlines).
U.S. Domestic Average Load Factor
Note: Data for 2009 - Jan to May - from DOT Form 41 available from BTS
Source: Google Finance for Market Cap data and Bureau of Transportation Statistics for RPM data
Pinnacle1.0%
Mesa Air0.9%
United Air Lines0.6%
American West Airlines0.9%
US Airways0.2%
Midwest Airlines0.2%
Midway0.0%
Republic Airways2.0%
Delta Air Lines2.6%
Frontier Airlines2.1%
Northwest Airlines2.2%
Alaska Airlines3.7%
Continental Airlines4.2%
AirTran Airways4.1%
American Airlines9.9%
JetBlue Airways10.9%
Southwest Airlines54.3%
Atlantic Coast Airlines0.2%
Market Cap: US Majors 26-May-2005
Total Market Cap: $21.2 billionTotal Market Cap: $21.2 billion
Data source: Yahoo Finance.
Consolidations
Recent US Consolidation
Delta and Northwest (Oct 09)
USAir and America West
Potential for Additional Reactionary Moves
Recent International Consolidation
Lufthansa and Austrian
Air France and KLM
Air France and Alitalia ??
Lufthansa and Swiss
China Southern and China Northern and Xingiang
Cathy Pacific and Dragon
BMI and Lufthansa (Virgin?)
International Strategic Investment in US Carriers
Lufthansa and JetBlue
Virgin and Virgin America
EU-US Open Skies Agreement
On April 30, 2007 E.U. and U.S. signed a preliminary Open Skies accord
Allows EU airlines to operate direct flights between U.S. and any EU country (and some others)
Allows U.S. airlines reciprocal right, and ability to fly between EU city-pairs
Agreement will replace 22 bilateral air service agreements currently in place between the U.S. and the Member States
Implications for Alliance Anti-Trust Immunity
In effect March 30, 2008
E.U. has made liberalized foreign control a prerequisite for a permanent agreement
o
U.S. domestic market lucrative as standalone and hub-feeder
Cabotage
rights only granted to U.S. Incorporated airlines
U.S. incorporation requires meeting ownership caps
Without control, network composition cannot be shapedo
Match EU’s
49% foreign control restriction
Airline Alliances US DOT Antitrust Immunity
Star Alliance Adria Airways (JP) Air Canada (AC) Air New Zealand (NZ) ANA (NH) Asiana Airlines (OZ) Austrian Airlines (OS) Blue1 (KF) bmi (BD) Continental (CO) NEW Croatia Airlines (OU) LOT Polish Airlines (LO) Lufthansa (LH) SAS (SK) Singapore Airlines (SQ) South African (SA) Spanair (JK) Swiss Intl Air Lines (LX) TAP Portugal (TP) Thai Airways Intl (TG) Turkish Airlines (TK) United (UA) US Airways (US)
Oneworld American Airlines (AA) British Airways (BA) Cathay Pacific (CX) Finnair (AY) Iberia (IB) Japan Airlines (JL) LAN (LA) Malév (MA) Qantas (QF) Royal Jordanian (RJ)
SkyTeam Aeroflot (SU) Aeroméxico (AM) Air France (AF) Alitalia (AZ) Czech Airlines (OK) Delta (DL) KLM (KL) Korean Air (KE) Northwest (NW)
Prior Immunity
Immunity Application In Progress or Recently Approved
Source: Wikipedia, BTN Online
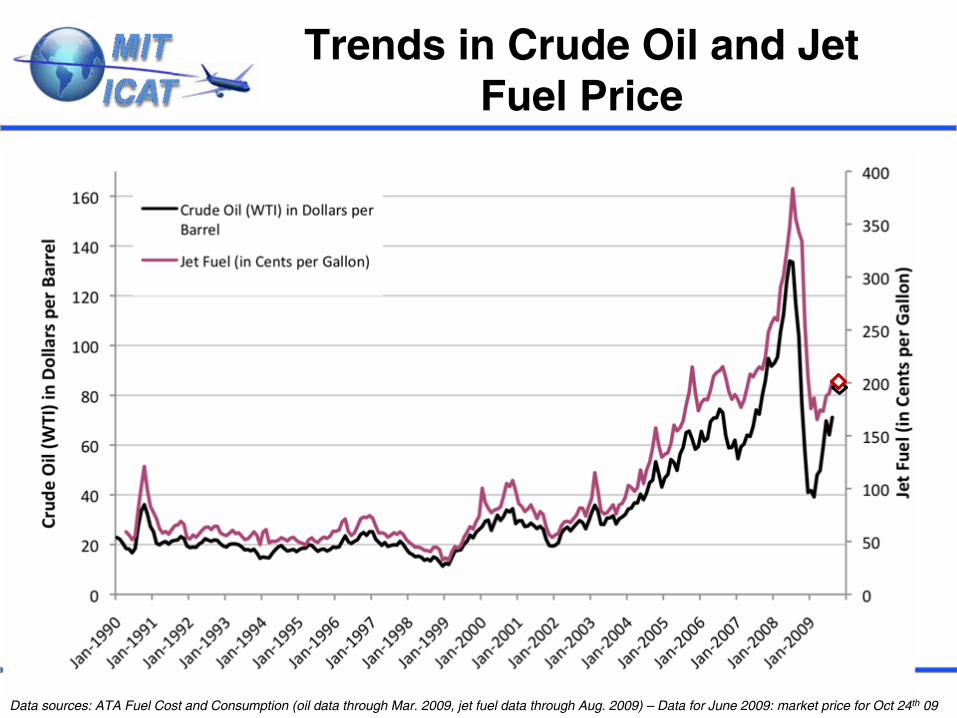
Trends in Crude Oil and Jet Fuel Price
Data sources: ATA Fuel Cost and Consumption (oil data through Mar. 2009, jet fuel data through Aug. 2009) –
Data for June 2009: market price for Oct 24th
09
Unit Costs of Labor and Fuel
Data source: ATA U.S. Airline Cost Index,
Labor
Fuel
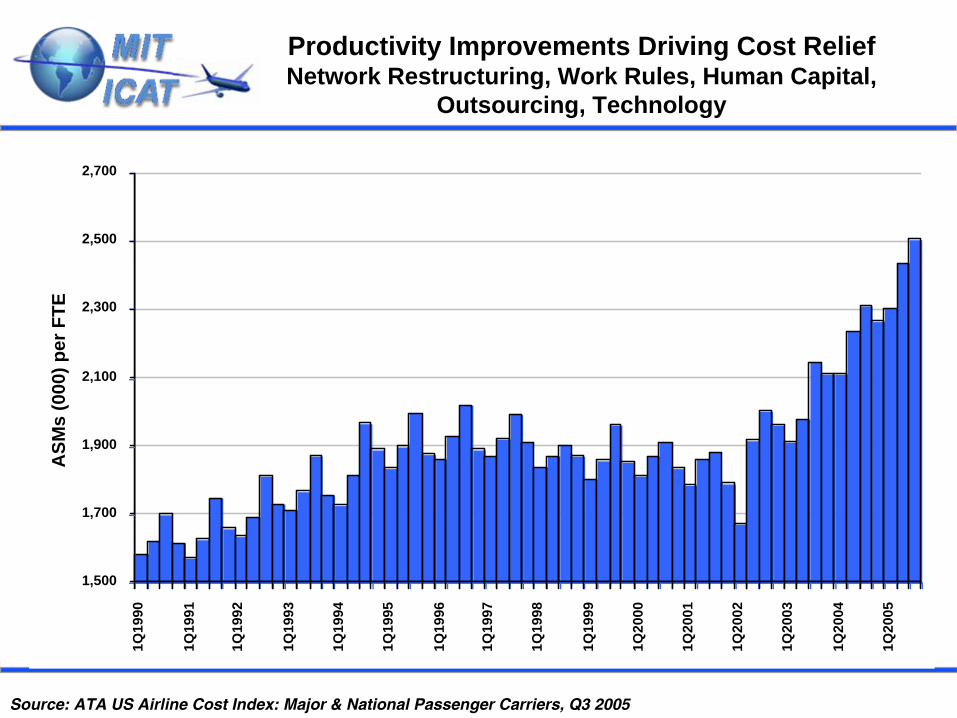
Productivity Improvements Driving Cost Relief Network Restructuring, Work Rules, Human Capital,
Outsourcing, Technology
Source: ATA US Airline Cost Index: Major & National Passenger Carriers, Q3 2005
1,500
1,700
1,900
2,100
2,300
2,500
2,700
1Q19
90
1Q19
91
1Q19
92
1Q19
93
1Q19
94
1Q19
95
1Q19
96
1Q19
97
1Q19
98
1Q19
99
1Q20
00
1Q20
01
1Q20
02
1Q20
03
1Q20
04
1Q20
05
ASM
s (0
00) p
er F
TE
Positive Views of Employee Morale Don’t have current survey data trend may have reversed
0%
10%
20%
30%
40%
50%
60%
70%
12/00 12/01 12/02 12/03 12/04 09/05
Source: The Wilson Center for Public Research, Inc. –
based on 150,674 interviews conducted with pilots or flight attendants from 1/1/2001 to 9/20/2005
USAir 1549 15 -
Jan -
2009
Air France 447 27 -
Aug -
2006
Source: BBC
Colgan
Air 12 –
Feb -
2009
Crew IssuesTrainingCommuting and FatigueCompensation ($16K -
$20K)Professionalism
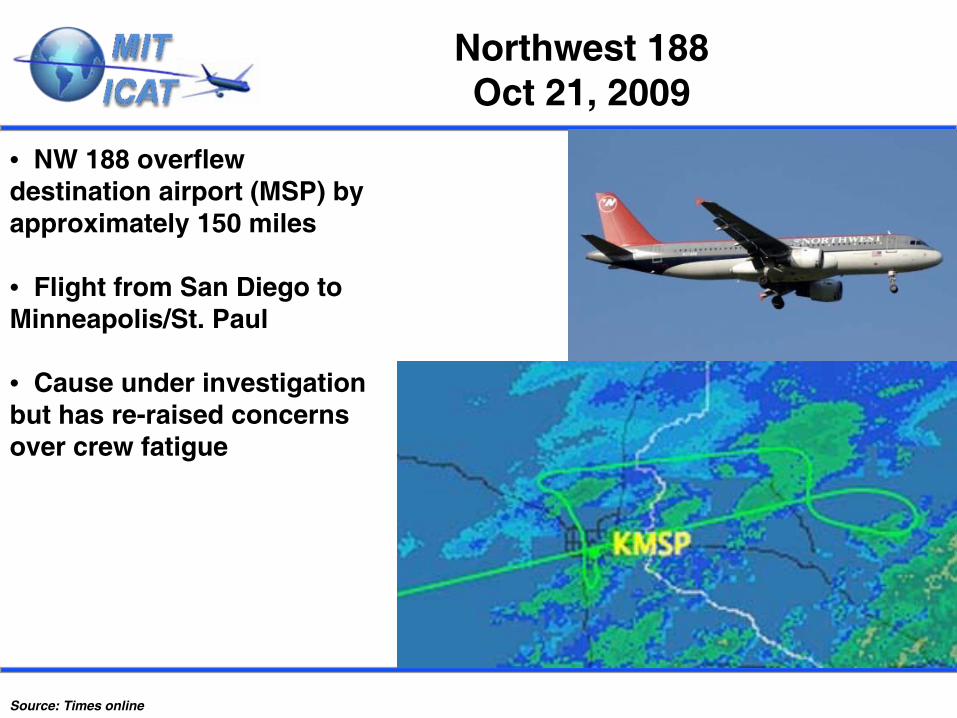
Northwest 188 Oct 21, 2009
Source: Times online
• NW 188 overflew destination airport (MSP) by approximately 150 miles
• Flight from San Diego to Minneapolis/St. Paul
• Cause under investigation but has re-raised concerns over crew fatigue
Pilot Fatigue Rulemaking
Congressional Hearings on Fatigue
FAA formed Flight and Duty Time Limitations and Rest Requirements ARC
Were scheduled to submit draft NRPM language by Sept 1, 2009
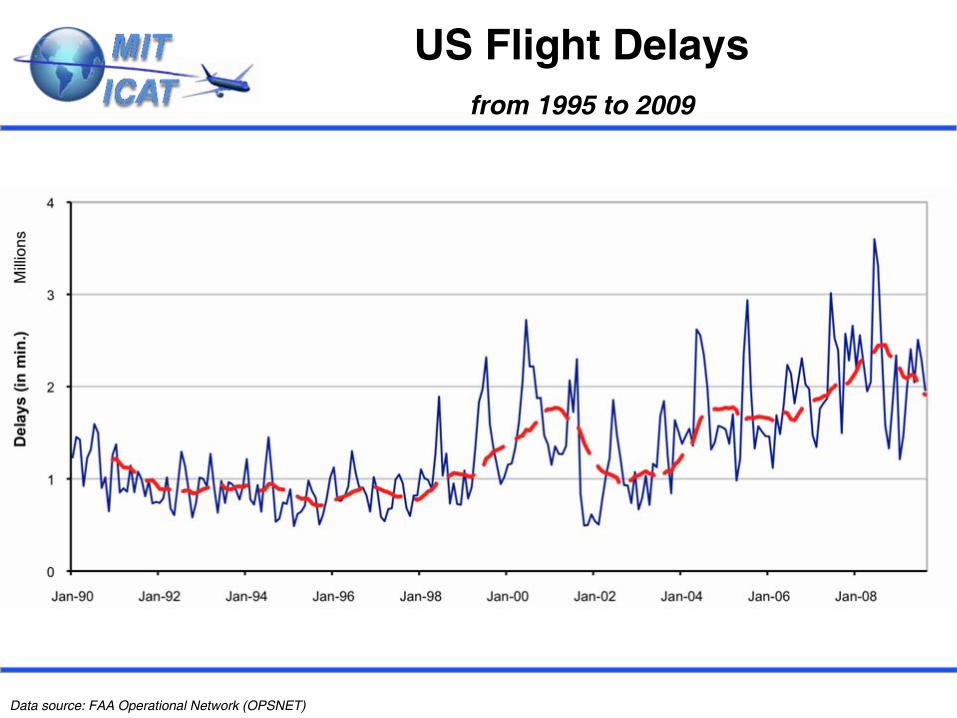
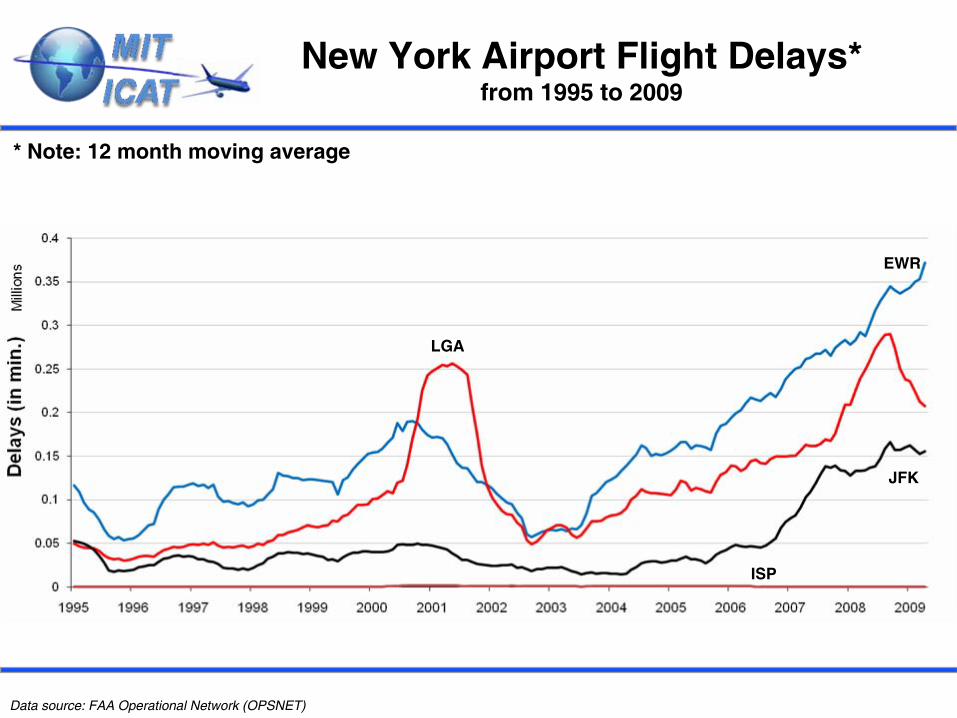
US Flight Delays from 1995 to 2009
Data source: FAA Operational Network (OPSNET)
2000200120022003200420052006200720082009
Flight Cancellations from 2000 to 2009 (by month)
Source: DOT, Air Travel Consumer Report, http://airconsumer.ost.dot.gov/
& BTS On Time Performance data
(top 11 airlines from 2000 to 2002, top 20 airlines from 2003 to
Increase capacity and throughput to converging and intersecting runways (9)
Improve parallel runway operations in a phased manner, where near-term commitment and implementation successes dictate the need for mid-term investments (37a, 12, 13, 14)
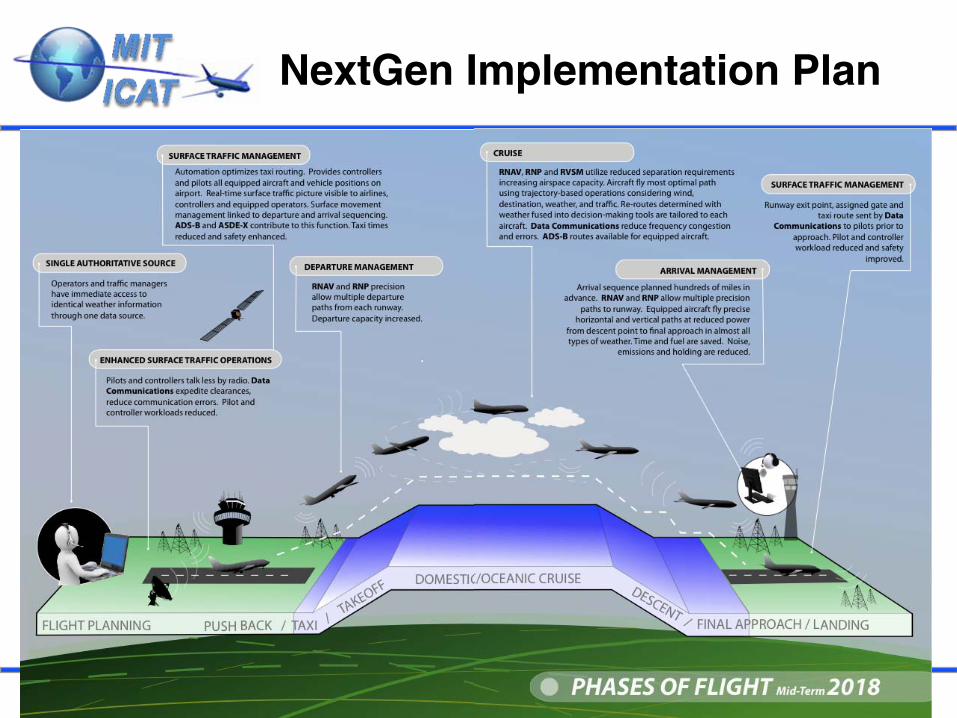
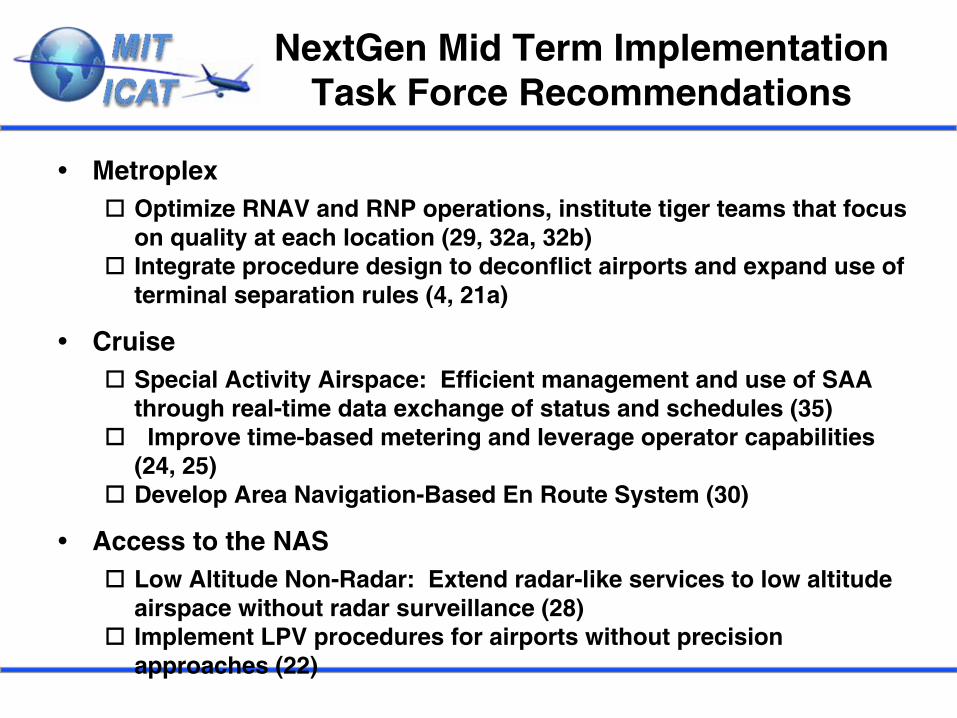
NextGen
Mid Term Implementation Task Force Recommendations
Metroplex
Optimize RNAV and RNP operations, institute tiger teams that focus on quality at each location (29, 32a, 32b)
Integrate procedure design to deconflict
airports and expand use of terminal separation rules (4, 21a)
Cruise
Special Activity Airspace: Efficient management and use of SAA through real-time data exchange of status and schedules (35)
Improve time-based metering and leverage operator capabilities (24, 25)
Develop Area Navigation-Based En Route System (30)
Access to the NAS
Low Altitude Non-Radar: Extend radar-like services to low altitude airspace without radar surveillance (28)
Implement LPV procedures for airports without precision approaches (22)
NextGen
Mid Term Implementation Task Force Recommendations
Data Communications
Digital ATC-Aircraft Communications for Revised Departure Clearances, Weather Reroutes, and Routine Communications (16, 17, 39, 42a, 44)
Integrated Air Traffic Management (I-ATM)
Integrated CDM/TFM/ATC Solution to traffic flow problems (47)
Improved Collaborative ATM (C-ATM) Automation: C-ATM automation to negotiate user-
preferred routes and alternative trajectories (7b, 8, 46)
Overarching Recommendations
Achieving Existing 3 and 5 Mile Separation Standards
Incentivizing
Equipage
Streamlining Operational Approval and Certification
Trends in Aircraft Size U.S. Airlines
Data source: Form 41 Traffic data from Bureau of Transportation Statistics (US carriers)
RJ-NB Boundary Blurred
Source: based on manufactures’
a/c specifications. Full pax
range of standard version
1000
1200
1400
1600
1800
2000
2200
2400
20 40 60 80 100 120 140 160
A/C Seats
Ran
ge
(nm
)
ERJ170
CRJ200
ERJ145
CRJ700
ERJ190
CRJ900
B735/6 B737
DC-9
Regional JetsRegional Jets New AircraftNew Aircraft
A318
B717 MD-80
MD-90
NarrowNarrow--bodybody
A319
A-380
B 787 Delayed First Flight
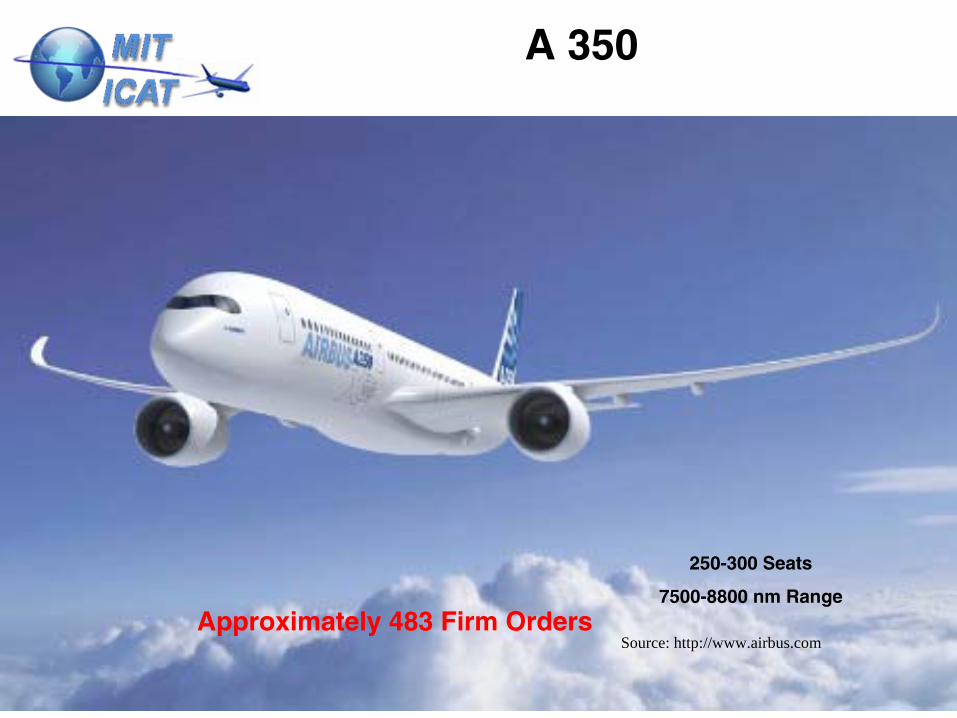
A 350
Source: http://www.airbus.com
250-300 Seats
7500-8800 nm RangeApproximately 483 Firm Orders
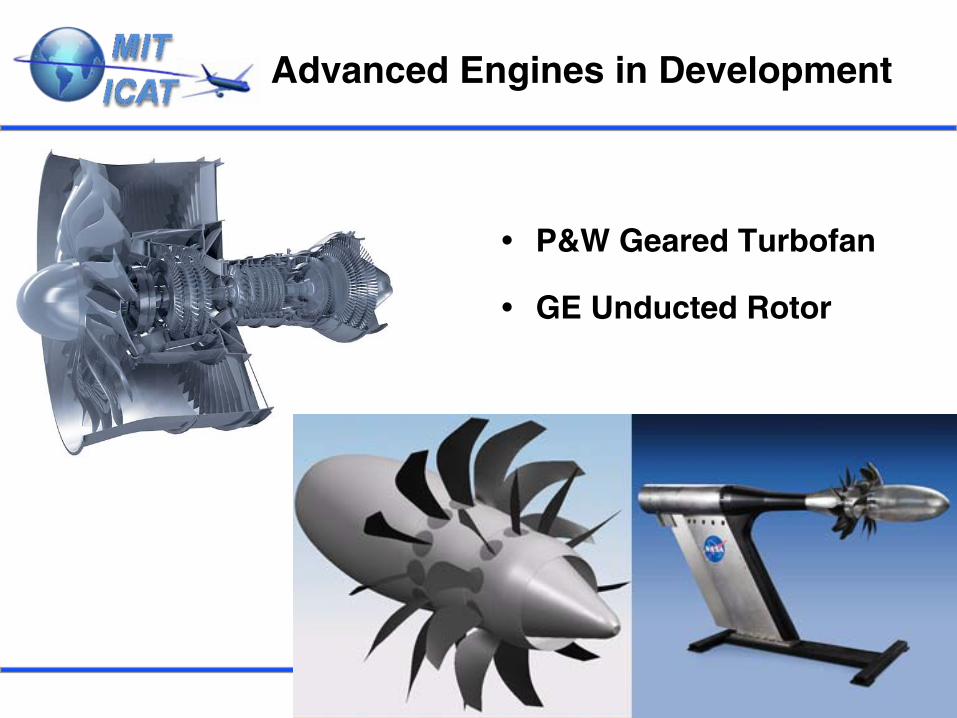
Advanced Engines in Development
P&W Geared Turbofan
GE Unducted
Rotor
Environmental Issues
Intergovernmental Panel on Climate Change
Noise Emissions
Stage 4 (Equipment)Airports (Capacity)
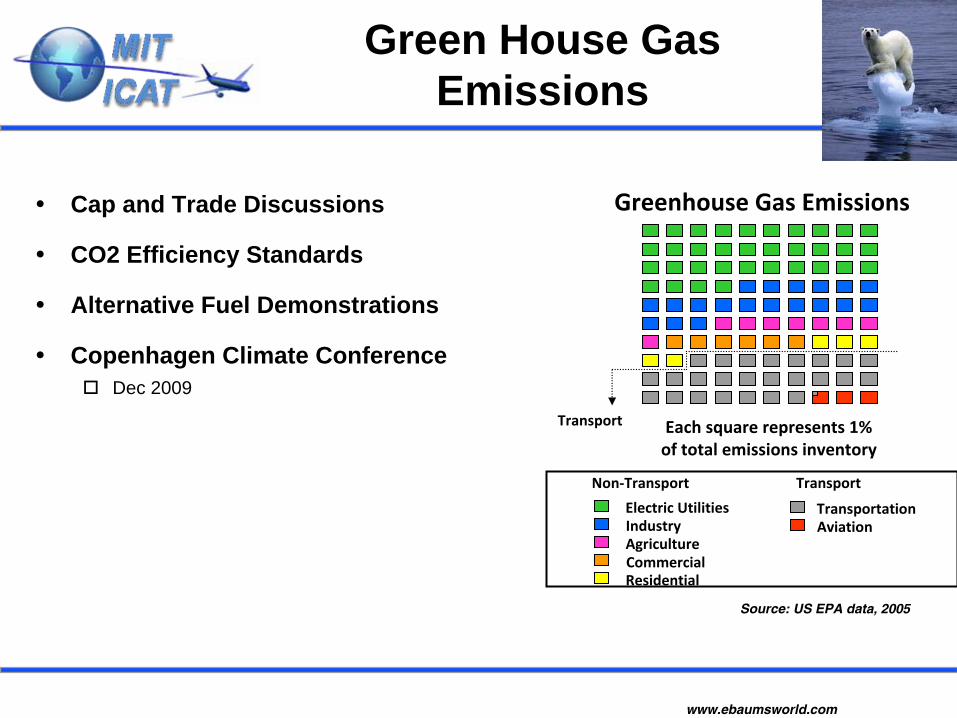
Green House Gas Emissions
Cap and Trade Discussions
CO2 Efficiency Standards
Alternative Fuel Demonstrations
Copenhagen Climate Conference
Dec 2009
www.ebaumsworld.com
Source: US EPA data, 2005
Greenhouse Gas Emissions
Transport Each square represents 1%of total emissions inventory