28
CITY & COUNTY OF SAN FRANCISCO Office of the Controller City Services Auditor, City Performance City Services Benchmarking: Airport Services Benchmarking July 28, 2015

CITY
& C
OU
NTY
OF
SAN
FRA
NCI
SCO
Off
ice
of th
e Co
ntro
ller
City
Ser
vice
s Aud
itor,
City
Per
form
ance
City Services Benchmarking:
Airport Services Benchmarking
July 28, 2015
CONTROLLER’S OFFICE CITY SERVICES AUDITOR
The City Services Auditor was created within the Controller’s Office through an amendment to the City Charter that was approved by voters in November 2003. Under Appendix F to the City Charter, the City Services Auditor has broad authority for:
• Reporting on the level and effectiveness of San Francisco’s public services and benchmarking the city to other public agencies and jurisdictions.
• Conducting financial and performance audits of city departments, contractors, and functions to assess efficiency and effectiveness of processes and services.
• Operating a whistleblower hotline and website and investigating reports of waste, fraud, and abuse of city resources.
• Ensuring the financial integrity and improving the overall performance and efficiency of city government.
Project Team City Performance Unit Peg Stevenson, Director Natasha Mihal, Project Manager Ashley Groffenberger, Performance Analyst For more information, please contact: Ashley Groffenberger Office of the Controller City and County of San Francisco (415) 554-5311 | [email protected]

SUMMARY The City and County of San Francisco Charter requires the City Services Auditor (CSA) to monitor the level and effectiveness of City services. Specifically, CSA shall review performance and cost benchmarks, and conduct comparisons of the cost and performance of San Francisco City government with other cities, counties, and public agencies performing similar functions.
This report compares airport services and practices at San Francisco International Airport (SFO) to those of twelve other peer airports across the continental United States. This report benchmarks key performance metrics between SFO and its peers, focused on air service and economic indicators as well as service quality.
Peers This report examines twelve large hub, international gateway airports in the continental United States with comparable origin & destination percentages, and a similar number of airlines servicing the airport. Peers for this report include:
Boston Logan International (BOS) Chicago O’Hare International (ORD) Dallas/Fort Worth International (DFW) Ft. Lauderdale-Hollywood International (FLL) Houston Intercontinental (IAH) JFK International (JFK)
Los Angeles International (LAX) Las Vegas McCarren International (LAS) Miami International (MIA) Newark Liberty International (EWR) Seattle-Tacoma International (SEA) Washington Dulles International (IAD)
HIGHLIGHTS Enplanements Enplanements are a measure of passenger boardings at a given airport, and signify the strength of an airport’s service and passenger demand. Enplanements at SFO grew 33 percent from Calendar Year (CY) 2007 to 2014, the highest rate of growth amongst the peer group, and 13 percentage points higher than the closest peers, Miami and Seattle-Tacoma. During the same period, five peer airports experienced a loss in enplanements, with Washington Dulles experiencing the greatest loss of 13 percent.
In CY 2014, SFO had approximately 23.5 million total enplanements, 78 percent (18.4 million) domestic and 22 percent (5.1 million) international – the fifth highest in the peer group. Los Angeles led the peer group in total enplanements with 35.3 million, 73 percent domestic and 27 percent international.

Origin and Destination Percentage An airport’s Origin & Destination (O&D) percentage measures the percentage of passengers that originate or terminate their trip at a given airport (as opposed to connecting to another flight), and is used as a measure of local demand, with a high O&D percentage indicating strong local demand. In CY 2014, SFO had an O&D percentage of 79 percent, the fifth highest in the peer group. Boston led the peer group with 94 percent O&D. Dallas-Fort Worth had the lowest O&D percentage with 42 percent. Gross Concession Sales per Enplanement SFO generated $34.60 in gross concession sales per enplanement in CY 2013, the highest in the peer group, and $12.08 higher than the peer average of $22.52. SFO led the peer group in gross food and beverage sales per enplanement, generating $8.15 in gross food and beverage sales per enplanement, $1.14 higher than the peer average of $7.01. In gross retail sales, SFO generated $4.77 per enplanement, the fifth highest in the peer group and $0.39 higher than the peer average of $4.38. Lastly, SFO generated $21.67 in gross duty-free sales per international enplanement, the highest in the peer group, and $10.54 above the peer average of $11.13.
*Includes passenger services concession sales such as banking and currency exchange services.
**Total duty-free sales are calculated per international enplanements
Airport Service Quality The Airport Service Quality (ASQ) survey is a passenger-experience survey conducted by the Airports Council International (ACI) which asks passengers in participating airports to rate the airport in a variety of services including security and airport environment. The survey is distributed to 1,400 randomly selected passengers each quarter by a third party vendor of ACI. In the 2014 survey, SFO exceeded the panel average in all but one of the service quality categories. Airport customers gave SFO an overall satisfaction rating of 4.17 out of 5, compared to the panel average of 3.99.

Contents SFO: From 30,000 Feet .................................................................................................................................. 1
Methodology ................................................................................................................................................. 2
Air Service and Economic Indicators ............................................................................................................. 3
Enplanements ........................................................................................................................................... 3
Growth in Enplanements .......................................................................................................................... 5
Total Number of Flights ............................................................................................................................ 6
Enplanements per Flight ........................................................................................................................... 8
Origin & Destination Percentage .............................................................................................................. 9
Non-Stop Destinations ............................................................................................................................ 10
Number of Airlines .................................................................................................................................. 12
Gross Terminal Concession Sales per Enplanement ............................................................................... 13
Revenue from Non-Aeronautical Sources .............................................................................................. 16
Service Quality ............................................................................................................................................ 17
Appendix A. Peer Selection Methodology .................................................................................................. 18
Appendix B. Air Service and Economic Indicators. ..................................................................................... 19
Appendix C. Airport Service Quality Survey ................................................................................................ 21
References .................................................................................................................................................. 23
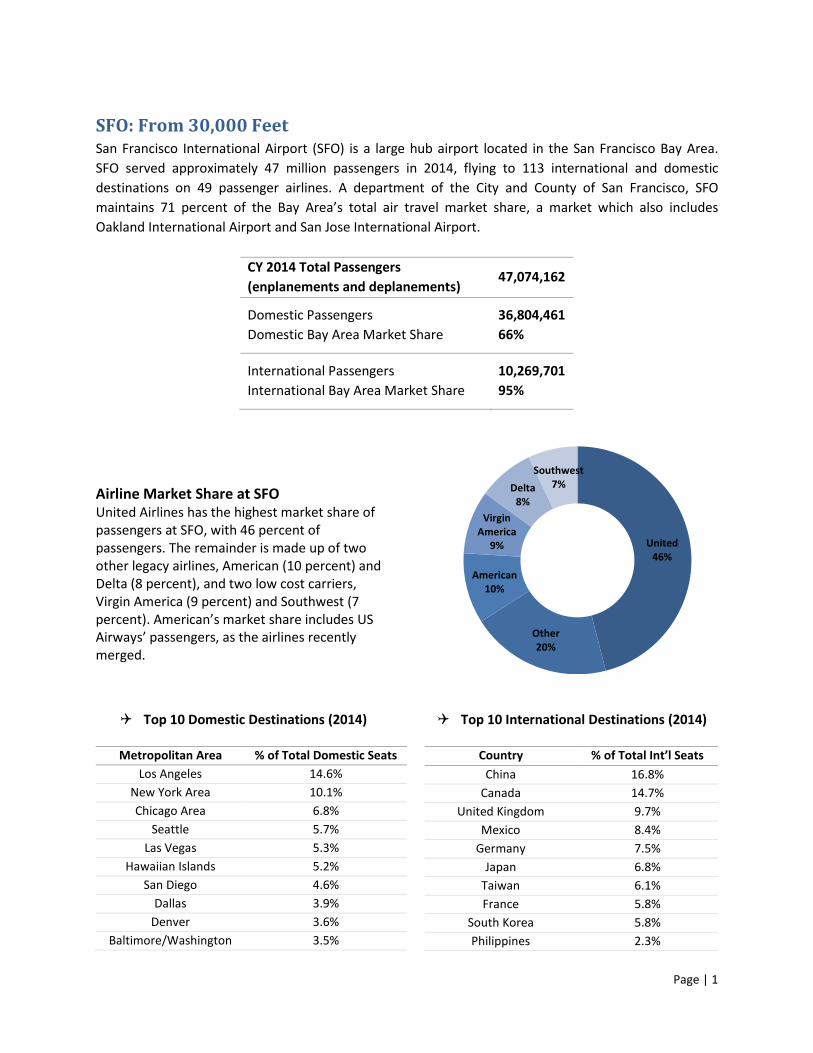
SFO: From 30,000 Feet San Francisco International Airport (SFO) is a large hub airport located in the San Francisco Bay Area. SFO served approximately 47 million passengers in 2014, flying to 113 international and domestic destinations on 49 passenger airlines. A department of the City and County of San Francisco, SFO maintains 71 percent of the Bay Area’s total air travel market share, a market which also includes Oakland International Airport and San Jose International Airport.
CY 2014 Total Passengers (enplanements and deplanements)
47,074,162
Domestic Passengers 36,804,461 Domestic Bay Area Market Share 66%
International Passengers 10,269,701 International Bay Area Market Share 95%
Airline Market Share at SFO United Airlines has the highest market share of passengers at SFO, with 46 percent of passengers. The remainder is made up of two other legacy airlines, American (10 percent) and Delta (8 percent), and two low cost carriers, Virgin America (9 percent) and Southwest (7 percent). American’s market share includes US Airways’ passengers, as the airlines recently merged.
Top 10 Domestic Destinations (2014)
Metropolitan Area % of Total Domestic Seats Los Angeles 14.6%
New York Area 10.1% Chicago Area 6.8%
Seattle 5.7% Las Vegas 5.3%
Hawaiian Islands 5.2% San Diego 4.6%
Dallas 3.9% Denver 3.6%
Baltimore/Washington 3.5%
Top 10 International Destinations (2014)
Country % of Total Int’l Seats China 16.8%
Canada 14.7% United Kingdom 9.7%
Mexico 8.4% Germany 7.5%
Japan 6.8% Taiwan 6.1% France 5.8%
South Korea 5.8% Philippines 2.3%
United 46%
Other 20%
American 10%
Virgin America
9%
Delta 8%
Southwest 7%
Page | 1
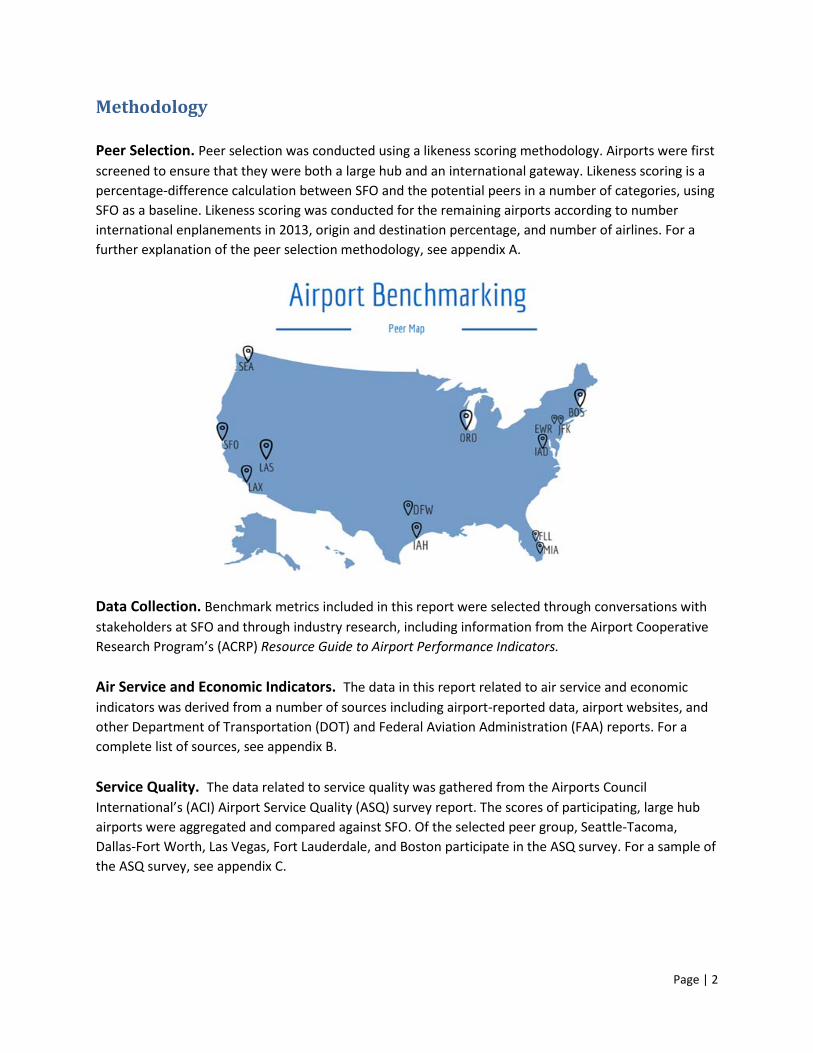
Methodology Peer Selection. Peer selection was conducted using a likeness scoring methodology. Airports were first screened to ensure that they were both a large hub and an international gateway. Likeness scoring is a percentage-difference calculation between SFO and the potential peers in a number of categories, using SFO as a baseline. Likeness scoring was conducted for the remaining airports according to number international enplanements in 2013, origin and destination percentage, and number of airlines. For a further explanation of the peer selection methodology, see appendix A.
Data Collection. Benchmark metrics included in this report were selected through conversations with stakeholders at SFO and through industry research, including information from the Airport Cooperative Research Program’s (ACRP) Resource Guide to Airport Performance Indicators. Air Service and Economic Indicators. The data in this report related to air service and economic indicators was derived from a number of sources including airport-reported data, airport websites, and other Department of Transportation (DOT) and Federal Aviation Administration (FAA) reports. For a complete list of sources, see appendix B. Service Quality. The data related to service quality was gathered from the Airports Council International’s (ACI) Airport Service Quality (ASQ) survey report. The scores of participating, large hub airports were aggregated and compared against SFO. Of the selected peer group, Seattle-Tacoma, Dallas-Fort Worth, Las Vegas, Fort Lauderdale, and Boston participate in the ASQ survey. For a sample of the ASQ survey, see appendix C.
Page | 2

Air Service and Economic Indicators Performance indicators in the air service and economic category focus on the strength of an airport’s passenger market, diversification of airlines, and ability to generate revenue from non-airline sources. Enplanements Enplanements are a measure of passenger boardings at a given airport. It does not include those who terminate their trip, or deplane, at a given airport. This is a common measure that airports use to measure the level of an airport’s service and passenger demand. The level of enplanements is the primary driving variable for all other air service indicators at an airport. For this report, enplanement data include both revenue and non-revenue passengers, where revenue passengers are those passengers who have purchased tickets, and non-revenue passengers are those small subset of passengers who fly free of charge, such as airline employees and flight crew transferring to another base. In 2014, Los Angeles International (LAX) led the peer group in total enplanements with 35.3 million, only slightly higher than Chicago O’Hare (ORD). SFO had 23.5 million enplanements in 2014, the fifth highest amongst the peer group, and above the peer average of 22.4 million.
Domestic and International Enplanements Enplanements can be further broken down between domestic and international. In 2014, ORD led the peer group in the number of domestic enplanements, with 29.7 million. SFO ranked fifth with 18.4 million domestic enplanements in 2014, higher than the 17.0 million peer average. JFK International (JFK) had the highest number of international enplanements, with 14.1 million, significantly higher than the remainder of the peer group. SFO ranked sixth in international enplanements with 5.1 million in 2014, below the peer average of 5.4 million.
Washington-Dulles Fort Lauderdale Boston Newark Seattle-Tacoma Miami Houston Las Vegas San Francisco New York - JFK Dallas Fort Worth Chicago O'Hare Los Angeles
- 5 10 15 20 25 30 35 40Passengers (millions)
Total Enplanements (2014)
Page | 3
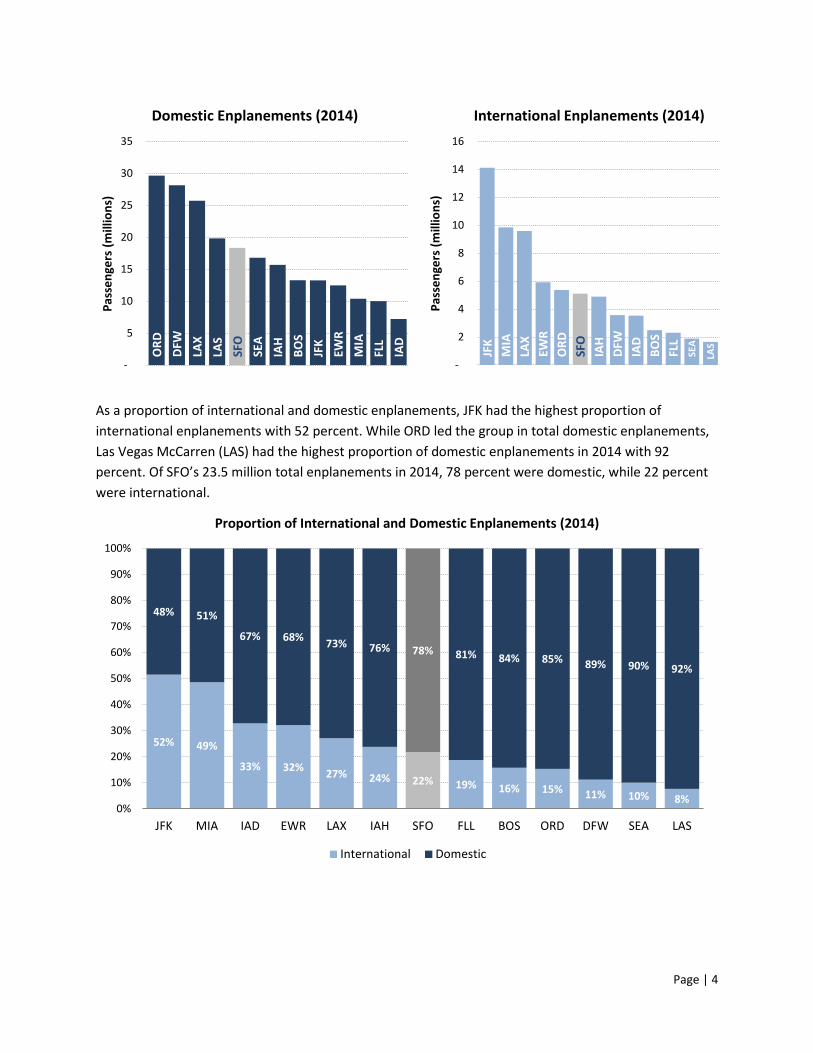
As a proportion of international and domestic enplanements, JFK had the highest proportion of international enplanements with 52 percent. While ORD led the group in total domestic enplanements, Las Vegas McCarren (LAS) had the highest proportion of domestic enplanements in 2014 with 92 percent. Of SFO’s 23.5 million total enplanements in 2014, 78 percent were domestic, while 22 percent were international.
ORD
DF
W
LAX
LA
S
SFO
SE
A
IAH
BO
S JF
K
EWR
M
IA
FLL
IAD
-
5
10
15
20
25
30
35
Pass
enge
rs (m
illio
ns)
Domestic Enplanements (2014)
JFK
M
IA
LAX
EWR
ORD
SF
O
IAH
DF
W
IAD
BO
S
FLL
SE
A
LAS
-
2
4
6
8
10
12
14
16
Pass
enge
rs (m
illio
ns)
International Enplanements (2014)
52% 49%
33% 32% 27% 24% 22% 19% 16% 15% 11% 10% 8%
48% 51%
67% 68% 73% 76% 78% 81% 84% 85% 89% 90% 92%
0%
10%
20%
30%
40%
50%
60%
70%
80%
90%
100%
JFK MIA IAD EWR LAX IAH SFO FLL BOS ORD DFW SEA LAS
Proportion of International and Domestic Enplanements (2014)
International Domestic
Page | 4

Growth in Enplanements Calendar Years (CY) 2007 and 2014 were chosen as measuring points to show growth in enplanements, because they represent periods of time before and after the latest global recession, an inflection point in air travel demand.
From 2007 to 2014, SFO experienced the highest percentage growth in enplanements amongst the peer group, with an increase of 33 percent. Within the peer group, seven airports experienced positive growth during the time period, while five peers experienced negative growth. Washington Dulles (IAD) experienced the greatest percentage loss in enplanements with a decline of 13 percent.
Los Angeles
Chicago O'Hare
Dallas/Fort Worth
New York - JFK
San Francisco
Las Vegas
Houston
Miami
Seattle-Tacoma
Newark
Boston
Fort Lauderdale
Washington Dulles
- 10 20 30 40Passengers (millions)
Total Enplanements (2007 vs. 2014)
CY 2007CY 2014
IAD LAS
ORD
IAH
EWR DFW FLL
JFK
BOS LAX SEA
MIA
SFO
-20% -10% 0% 10% 20% 30% 40%
Enplanement Growth (2007 vs. 2014) 32.7%
20.2%
19.5%
13.2%
12.7%
11.9%
8.7%
6.1%
-1.5%
-13.1%
-10.0%
-8.0%
-4.7%
Page | 5

Total Number of Flights In addition to the number of enplanements, the number of passenger flights is an important metric since more flights generally indicate a higher volume of air service, although partly influenced by aircraft size. A greater number of flights in individual markets create more options for passengers.
In Fiscal Year (FY) 2014, ORD led in the number of flights offered, with approximately 436,000 flights. SFO offered just over 200,000 passenger flights, the fifth highest amongst the peer group, and below the peer average of 212,459. For the purposes of this study, a flight is defined as one commercial passenger aircraft landing.
Domestic and International Flights ORD offered the greatest number of domestic flights in FY 2014 with nearly 390,000 flights. SFO ranked fifth in the number of domestic flights, offering nearly 175,000 flights in FY 2014 close to the peer average of 175,675 flights. JFK offered the greatest number of international flights with over 77,000 flights in FY 2014. SFO ranked eighth in the number of international flights offered, with nearly 26,000 flights which is lower than the peer average of 36,784 flights.
Ft. Lauderdale
Washington Dulles
Miami
Seattle-Tacoma
Las Vegas
Boston
Newark
New York - JFK
San Francisco
Houston
Los Angeles
Dallas-Fort Worth
Chicago O'Hare
0 50,000 100,000 150,000 200,000 250,000 300,000 350,000 400,000 450,000 500,000
Total Passenger Flights (FY 2014)
Page | 6
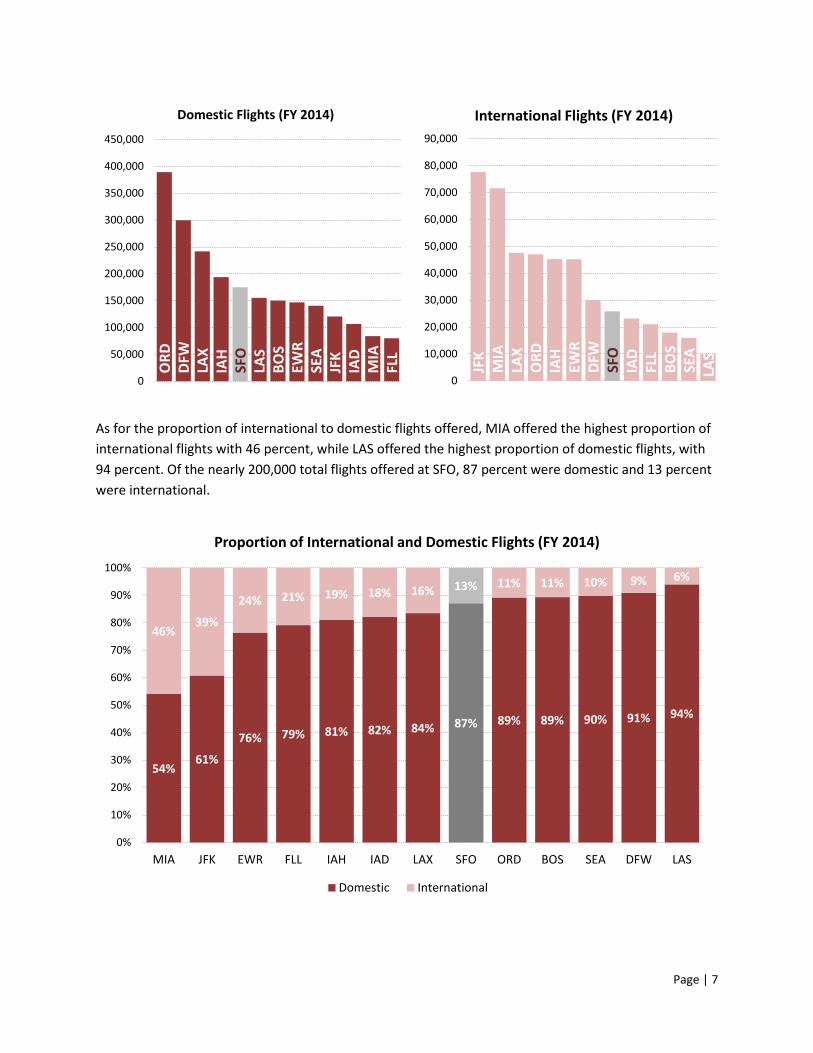
As for the proportion of international to domestic flights offered, MIA offered the highest proportion of international flights with 46 percent, while LAS offered the highest proportion of domestic flights, with 94 percent. Of the nearly 200,000 total flights offered at SFO, 87 percent were domestic and 13 percent were international.
ORD
DF
W
LAX
IAH
SFO
LA
S BO
S EW
R SE
A JF
K IA
D M
IA
FLL
0
50,000
100,000
150,000
200,000
250,000
300,000
350,000
400,000
450,000
Domestic Flights (FY 2014)
JFK
MIA
LA
X O
RD
IAH
EWR
DFW
SF
O
IAD
FLL
BOS
SEA
LAS
0
10,000
20,000
30,000
40,000
50,000
60,000
70,000
80,000
90,000
International Flights (FY 2014)
54% 61%
76% 79% 81% 82% 84% 87% 89% 89% 90% 91% 94%
46% 39%
24% 21% 19% 18% 16% 13% 11% 11% 10% 9% 6%
0%
10%
20%
30%
40%
50%
60%
70%
80%
90%
100%
MIA JFK EWR FLL IAH IAD LAX SFO ORD BOS SEA DFW LAS
Proportion of International and Domestic Flights (FY 2014)
Domestic International
Page | 7

Enplanements per Flight Enplanements per flight are an indicator of average aircraft size and aircraft occupancy, referred to in the industry as load factor. Generally, a high number of enplanements per flight mean larger average aircraft size and higher average load factors. Airports with a higher share of overseas international flights and long haul domestic flights on relatively large aircraft tend to have a high number of enplanements per flight. In Fiscal Year (FY) 2014, JFK led the peer group with 134 enplanements per flight. SFO ranked sixth with 115 enplanements per flight, higher than the peer average of 107. ORD had the lowest enplanements per flight of 78 passengers.
In the domestic sector, LAS had the highest number of enplanements per flight of 127 passengers. SFO had 103 enplanements per flight, ranking sixth among the peer group. In the international sector, LAX led the peer group with 196 enplanements per flight. SFO ranked second with 194 enplanements per flight.
Chicago O'Hare Washington Dulles Houston Boston Dallas-Fort Worth Newark Seattle-Tacoma San Francisco Los Angeles Ft. Lauderdale Las Vegas Miami New York-JFK
0 20 40 60 80 100 120 140 160
Total Enplanements per Flight (FY 2014)
LAS
MIA
FL
L SE
A LA
X SF
O
JFK
DFW
BO
S EW
R IA
H O
RD
IAD
0
20
40
60
80
100
120
140
Domestic Enplanements per Flight (FY 2014)
LAX
SFO
JF
K LA
S IA
D M
IA
BOS
EWR
DFW
SE
A O
RD
FLL
IAH
0
50
100
150
200
250
Int'l Enplanements per Flight (FY 2014)
Page | 8

Origin & Destination Percentage An airport’s Origin & Destination (O&D) percentage refers to the percentage of passengers that begin or end their trip at a given airport. This measure does not include those passengers connecting through a given airport. This is an important metric because it measures local demand, and a high O&D percentage indicates strong local demand, which helps mitigate the risk of passenger declines caused by changes in the airline industry, such as airline consolidation, route network restructuring, etc. Boston (BOS) had the highest O&D percentage in the peer group, with an O&D percentage of 94 percent. SFO ranked fifth amongst the peer group, with an O&D percentage of 79 percent, higher than the peer average of 70 percent. Meanwhile, Dallas Fort Worth (DFW) had the lowest O&D percentage in the group with 42 percent.
Dallas Fort Worth
Houston
Chicago O'Hare
Washington Dulles
Miami
Newark
Seattle-Tacoma
Los Angeles
San Francisco
New York - JFK
Las Vegas
Fort Lauderdale
Boston
0% 10% 20% 30% 40% 50% 60% 70% 80% 90% 100%
Origin & Destination % (FY 2014)
Page | 9
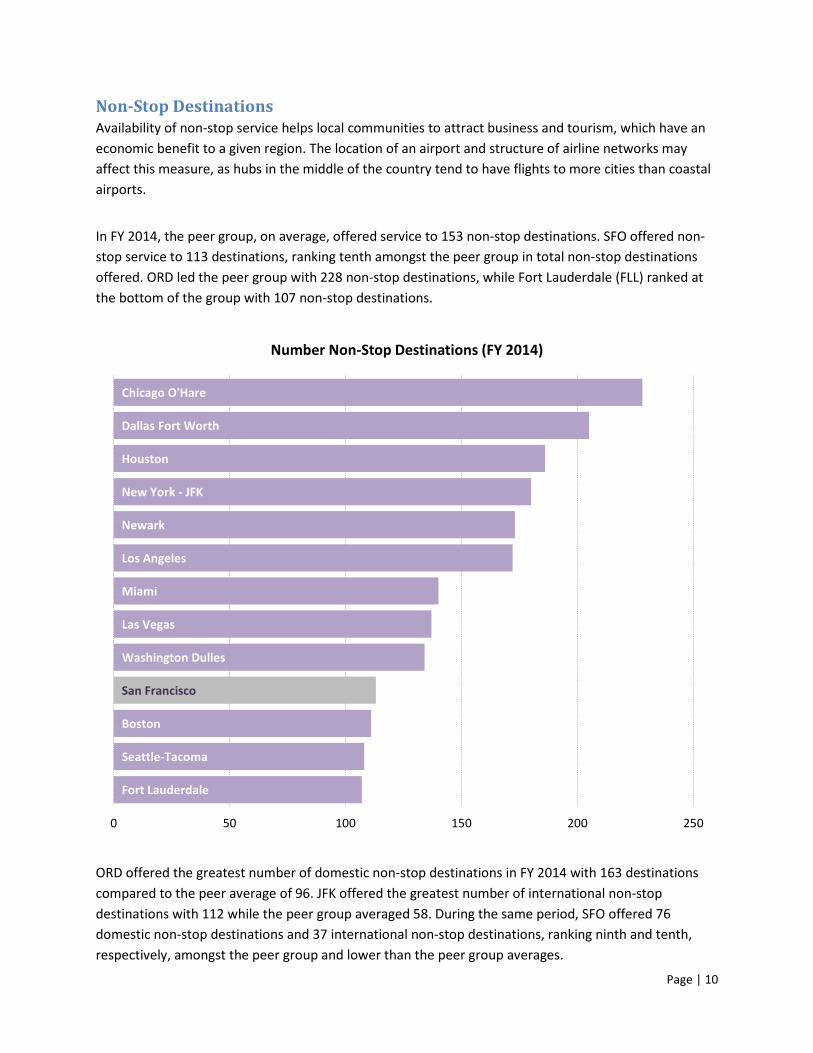
Non-Stop Destinations Availability of non-stop service helps local communities to attract business and tourism, which have an economic benefit to a given region. The location of an airport and structure of airline networks may affect this measure, as hubs in the middle of the country tend to have flights to more cities than coastal airports.
In FY 2014, the peer group, on average, offered service to 153 non-stop destinations. SFO offered non-stop service to 113 destinations, ranking tenth amongst the peer group in total non-stop destinations offered. ORD led the peer group with 228 non-stop destinations, while Fort Lauderdale (FLL) ranked at the bottom of the group with 107 non-stop destinations.
ORD offered the greatest number of domestic non-stop destinations in FY 2014 with 163 destinations compared to the peer average of 96. JFK offered the greatest number of international non-stop destinations with 112 while the peer group averaged 58. During the same period, SFO offered 76 domestic non-stop destinations and 37 international non-stop destinations, ranking ninth and tenth, respectively, amongst the peer group and lower than the peer group averages.
Fort Lauderdale
Seattle-Tacoma
Boston
San Francisco
Washington Dulles
Las Vegas
Miami
Los Angeles
Newark
New York - JFK
Houston
Dallas Fort Worth
Chicago O'Hare
0 50 100 150 200 250
Number Non-Stop Destinations (FY 2014)
Page | 10

As for the proportion of international to domestic non-stop destinations, MIA offered the highest proportion of international non-stop destinations, with 63 percent. Meanwhile, LAS offered the highest proportion of domestic non-stop destinations with 83 percent. At SFO, 67 percent of non-stop destinations serviced were domestic, while 33 percent were international.
ORD
DF
W
IAH
LAS
LAX
EWR
IAD
SEA
SFO
BO
S JF
K FL
L M
IA
0
20
40
60
80
100
120
140
160
180
Number Domestic Non-Stop Destinations
JFK
MIA
EW
R LA
X IA
H O
RD
DFW
IA
D FL
L SF
O
BOS
LAS
SEA
0
20
40
60
80
100
120
Number International Non-Stop Flight
37% 38% 52% 59% 63% 63% 64% 67% 68% 71% 73% 80% 83%
63% 62% 48% 41% 37% 37% 36% 33% 32% 29% 27% 20% 17%
0%
10%
20%
30%
40%
50%
60%
70%
80%
90%
100%
MIA JFK EWR LAX FLL IAH IAD SFO BOS ORD DFW SEA LAS
Proportion of Non Stop Destinations (FY 2014)
Domestic International
Page | 11

Number of Airlines The number (or diversity) of passenger airlines offering service at a given airport not only creates competition, but also helps to lessen risk for an airport in the event of airline consolidation or service reductions. The diversity of airlines also helps to create competition amongst airlines, which helps to moderate fares, and ultimately drive demand for air travel. Currently, SFO has service offered by 49 airlines, the third highest in the peer group and above the peer group average of 40 airlines. JFK currently has service offered by 80 airlines, the highest in the group.
Low Cost Carriers Low Cost Carriers (LCC) refers to airlines that offer point-to-point service with generally lower fares than “legacy” airlines, such as United, Delta or American. Examples of LCCs include Southwest, JetBlue and Virgin America. The impact of LCCs at an airport is that it moderates fares, as existing carriers tend to compete on price. In addition to driving competitive pricing, LCCs may also drive existing carriers to increase capacity, generating more service offerings. In FY 2014, enplanements on LCCs represented 24 percent of SFO’s domestic enplanements. FLL had the highest percentage of service on LCCs with 61 percent, while MIA had the least, with less than one percent.
Seattle-Tacoma
Dallas Fort Worth
Fort Lauderdale
Houston
Newark
Las Vegas
Boston
Washington Dulles
Chicago O'Hare
Miami
San Francisco
Los Angeles
New York - JFK
0 10 20 30 40 50 60 70 80 90
Number of Airlines
0% 10% 20% 30% 40% 50% 60% 70%
MiamiHouston
Chicago O'HareDallas Fort Worth
Washington DullesNewark
Seattle-TacomaSan Francisco
Los AngelesNew York - JFK
BostonFort Lauderdale
Las Vegas
Percentage Enplanements on Low Cost Carriers (FY 2014)
Page | 12

Gross Terminal Concession Sales per Enplanement One important source of non-aeronautical revenue is terminal concession sales. The primary sources of terminal concession sales are: food and beverage, retail, and duty-free. Concession sales are also a measure of the quality and quantity of concession offerings, which are important in driving non-aeronautical revenue. SFO generated $34.60 in gross terminal concession sales per enplanement in CY 2013, the highest in the peer group and $12.08 higher than the peer average of $22.52.
*Includes passenger services concession sales such as banking and currency exchange services.
**Total duty-free sales are calculated per international enplanements
Food and Beverage Food and beverage sales are an important concession category for airports, with a peer average of $7.01 per enplanement. SFO led the peer group in gross food and beverage sales per enplanement, with $8.15 per enplanement. The recently renovated Terminal 2 at SFO has contributed to the success of SFO’s concession program. In addition to offering a wide variety of food and beverage choices, two-thirds of concessionaires are locally-owned.
Average $22.52
$0
$5
$10
$15
$20
$25
$30
$35
$40
SFO LAS* JFK* LAX* MIA IAH* EWR* SEA ORD* BOS IAD DFW* FLL
Total Gross Concession Sales per Enplanement (2013)
Food & Beverage Retail Duty-Free** AVG
Page | 13
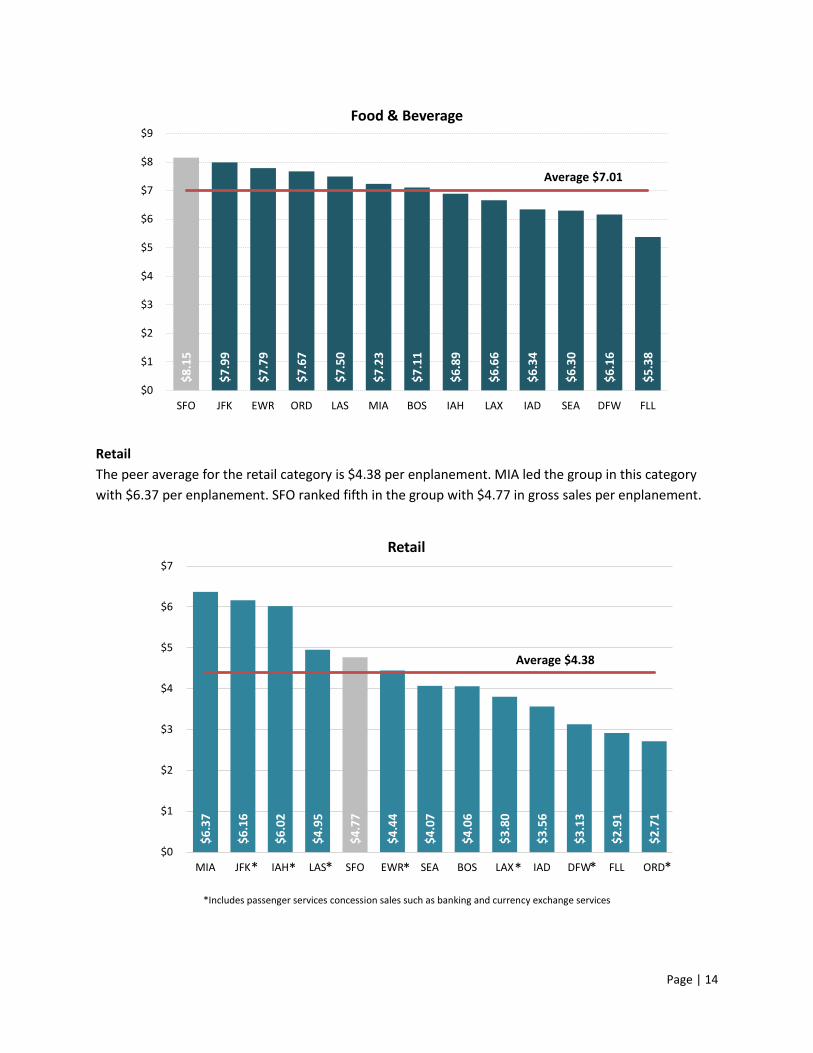
Retail The peer average for the retail category is $4.38 per enplanement. MIA led the group in this category with $6.37 per enplanement. SFO ranked fifth in the group with $4.77 in gross sales per enplanement.
*Includes passenger services concession sales such as banking and currency exchange services
$8.1
5
$7.9
9
$7.7
9
$7.6
7
$7.5
0
$7.2
3
$7.1
1
$6.8
9
$6.6
6
$6.3
4
$6.3
0
$6.1
6
$5.3
8
Average $7.01
$0
$1
$2
$3
$4
$5
$6
$7
$8
$9
SFO JFK EWR ORD LAS MIA BOS IAH LAX IAD SEA DFW FLL
Food & Beverage
$6.3
7
$6.1
6
$6.0
2
$4.9
5
$4.7
7
$4.4
4
$4.0
7
$4.0
6
$3.8
0
$3.5
6
$3.1
3
$2.9
1
$2.7
1
Average $4.38
$0
$1
$2
$3
$4
$5
$6
$7
MIA JFK IAH LAS SFO EWR SEA BOS LAX IAD DFW FLL ORD
Retail
* * * * * * *
Page | 14

Duty Free Duty free sales tend to be higher in coastal airports and airports with higher international enplanements. SFO led the peer group in this category with sales of $21.67 per international enplanement, $10.54 higher than the peer average of $11.13 per international enplanement. New and added service to regions with strong economic growth resulted in SFO’s relatively high duty free sales per international enplanement.
$21.
67
$20.
08
$18.
32
$16.
10
$11.
81
$9.5
3
$9.3
1
$8.6
9
$8.1
8
$6.9
4
$5.9
4
$4.8
0
$3.2
7
$0
$5
$10
$15
$20
$25
SFO LAS LAX JFK MIA IAH SEA EWR ORD IAD BOS DFW FLL
Duty-Free
Average $11.13
Page | 15
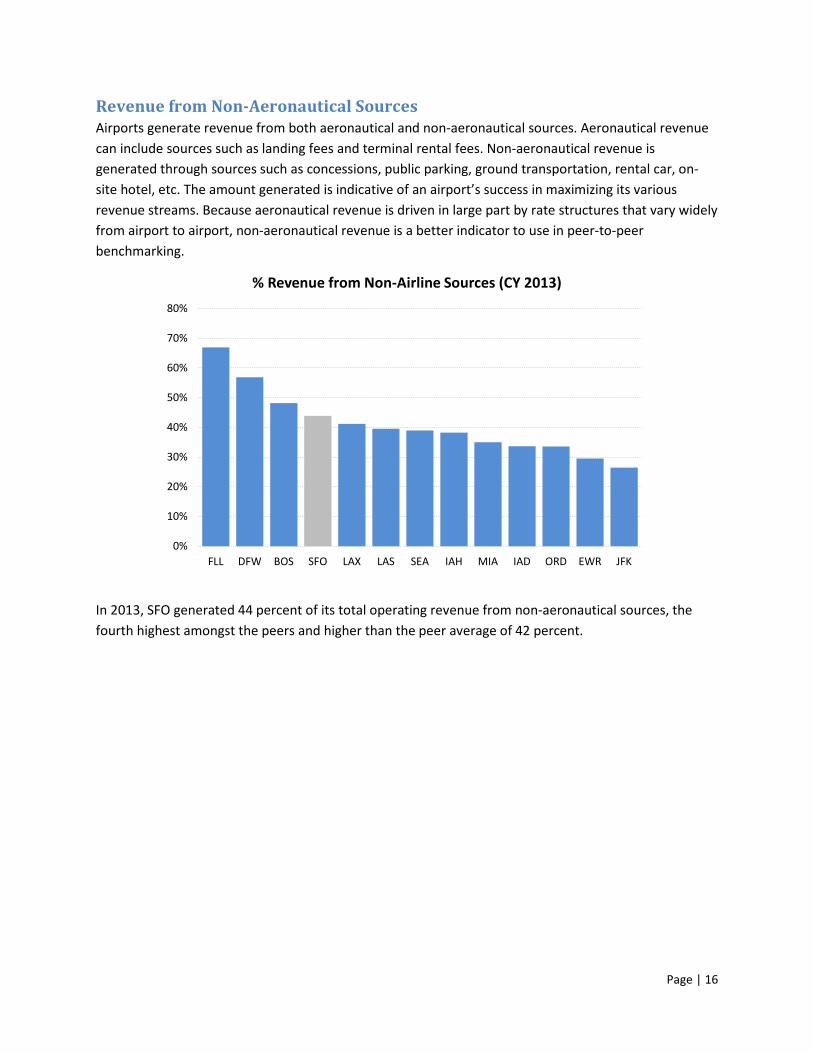
Revenue from Non-Aeronautical Sources Airports generate revenue from both aeronautical and non-aeronautical sources. Aeronautical revenue can include sources such as landing fees and terminal rental fees. Non-aeronautical revenue is generated through sources such as concessions, public parking, ground transportation, rental car, on-site hotel, etc. The amount generated is indicative of an airport’s success in maximizing its various revenue streams. Because aeronautical revenue is driven in large part by rate structures that vary widely from airport to airport, non-aeronautical revenue is a better indicator to use in peer-to-peer benchmarking.
In 2013, SFO generated 44 percent of its total operating revenue from non-aeronautical sources, the fourth highest amongst the peers and higher than the peer average of 42 percent.
0%
10%
20%
30%
40%
50%
60%
70%
80%
FLL DFW BOS SFO LAX LAS SEA IAH MIA IAD ORD EWR JFK
% Revenue from Non-Airline Sources (CY 2013)
Page | 16

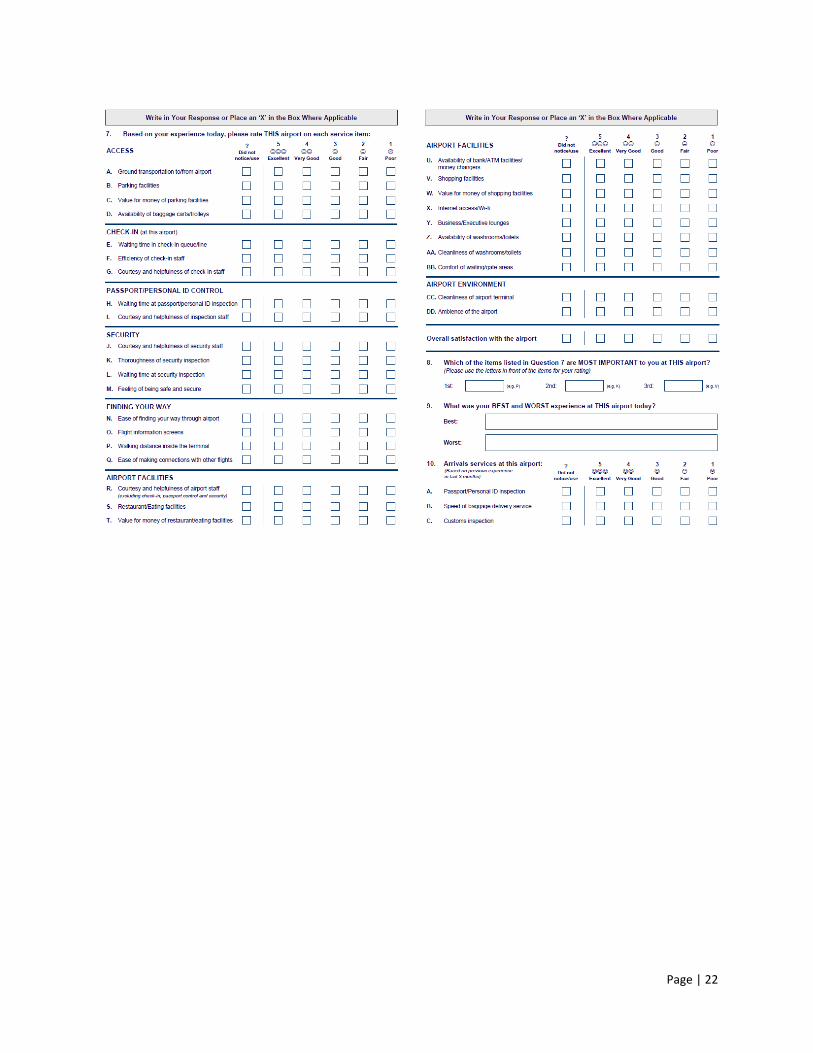
Service Quality The Airports Council International’s (ACI) Airport Service Quality (ASQ) survey is a benchmarking tool used by more than 250 airports worldwide to measure customer satisfaction across a number of service areas, including security, facilities and airport environment. Surveys are conducted by a third party vendor of ACI with a minimum of 350 randomly selected passengers at participating airports each quarter. SFO’s sample size is 1,400 per quarter. Surveys are conducted 30-45 minutes prior to boarding, so that customers have had the full range of experiences at the airport. Because of the confidentiality of individual airport scores, the scores of participating, large hub airports in North America for each service category were aggregated by Guest Experience staff at SFO and compared against the individual scores for SFO. Of the peer group selected for this benchmarking report, Seattle-Tacoma, Dallas-Fort Worth, Las Vegas McCarran, Fort Lauderdale, Boston Logan, and Washington Dulles participate in the ASQ survey. The 2014 ASQ Survey was used for the purposes of this report. Compared against aggregated data from participating peer airports, SFO exceeds the panel average in all, but one, service areas, including overall passenger satisfaction.
SFO Average Difference Overall
Overall Satisfaction 4.17 3.99 0.18 Passport/Personal ID Control Passport Control Wait times 4.25 4.01 0.24 Passport Staff Courtesy 4.16 4.02 0.14 Security
Security Checkpoint Wait Times 4.13 3.94 0.19 Security Checkpoint Staff Courtesy 4.09 4.01 0.08 Thoroughness of Inspection 4.17 4.02 0.15 Feeling of being safe 4.23 4.11 0.12 Airport Facilities
Courtesy of Airport Staff 4.24 4.11 0.13 Dining 3.80 3.70 0.10 Dining Value for Money 3.03 3.29 -0.26 Wi-Fi 3.83 3.78 0.05 Restroom Availability 4.18 4.06 0.12 Restroom Cleanliness 4.02 3.82 0.20 Baggage Claim Wait times 3.75 3.75 - Comfort of Waiting Areas 4.05 3.84 0.21 Airport Environment
Airport Cleanliness 4.31 4.03 0.28 Airport Ambience 4.08 3.84 0.24
Page | 17

Appendix A. Peer Selection Methodology Peer selection is an important first step in developing a benchmarking report. Given the wide variety of factors that differentiate one airport from another, the following peer selection methodology was utilized to select the most similar peer group.
i. Initial Screening. Two screening factors were used to ensure that potential peers share important characteristics with SFO.
1. Large Hub - Whether an airport is considered a “large hub” based on FAA classification (1% or more of U.S. annual passenger enplanements).
2. International Gateway - Whether a significant level of international service is offered by airlines at a given airport.
ii. Selection Criteria. The following grouping factors were then used to determine which potential peer airports were most similar to SFO.
1. International Enplanements – The number of passenger boardings for international travel.
2. Origin and Destination (O&D) Passenger Percentage – The percentage of passengers that begin or end their trip at a given airport.
3. Number of Airlines - The number of airlines offering service at a given airport, a measure of diversification.
iii. Peer Likeness Score. CSA used a likeness score methodology to rank potential peers in these categories. Generally speaking, a likeness score is a percentage-difference calculation. Using SFO as a baseline, CSA calculated the percent difference in the categories listed above, and then calculated an aggregate likeness score for all potential peers. A likeness score below 1 is considered good and means that the peer shares characteristics similar to the baseline. A likeness score of 1 or greater indicates that a given potential peer is 100% (or more) different than the baseline.
Code Airport NameScreening Factor:
Hub Size
Screening Factor: International
Gateway
Grouping Factor: International
Enplanements (2013)Score
Grouping Factor: Originating
PassengersScore
Grouping Factor: Number of Airlines Score
Aggregate Likeness Score
SFO San Francisco International L Yes 4,605,000 0.00 78% 0.00 40 0.00 0.00
EWR New ark Liberty International L Yes 5,564,000 -0.21 71% 0.10 30 0.33 0.07
ORD Chicago O'Hare International L Yes 5,175,000 -0.12 53% 0.47 43 -0.08 0.09
IAD Washington Dulles International L Yes 3,275,000 0.41 60% 0.30 37 0.08 0.26
MIA Miami International L Yes 9,957,000 -1.16 57% 0.37 47 -0.18 0.32
BOSGeneral Edw ard Law rence
Logan International L Yes 2,032,000 1.27 94% -0.21 34 0.18 0.41
IAHGeorge Bush
Intercontinental/Houston L Yes 4,285,000 0.07 53% 0.47 21 0.90 0.48
LAX Los Angeles International L Yes 8,386,000 -0.82 76% 0.03 72 -0.80 0.53
FLLFort Lauderdale/Hollyw ood
International L Yes 1,792,000 1.57 90% -0.15 29 0.38 0.60
DFW Dallas/Fort Worth International L Yes 3,057,000 0.51 42% 0.86 24 0.67 0.68
LAS McCarran International L Yes 1,431,000 2.22 85% -0.09 30 0.33 0.82
SEA Seattle-Tacoma International L Yes 1,622,000 1.84 70% 0.11 23 0.74 0.90
JFK John F Kennedy International L Yes 12,694,000 -1.76 80% -0.03 80 -1.00 0.93
Page | 18
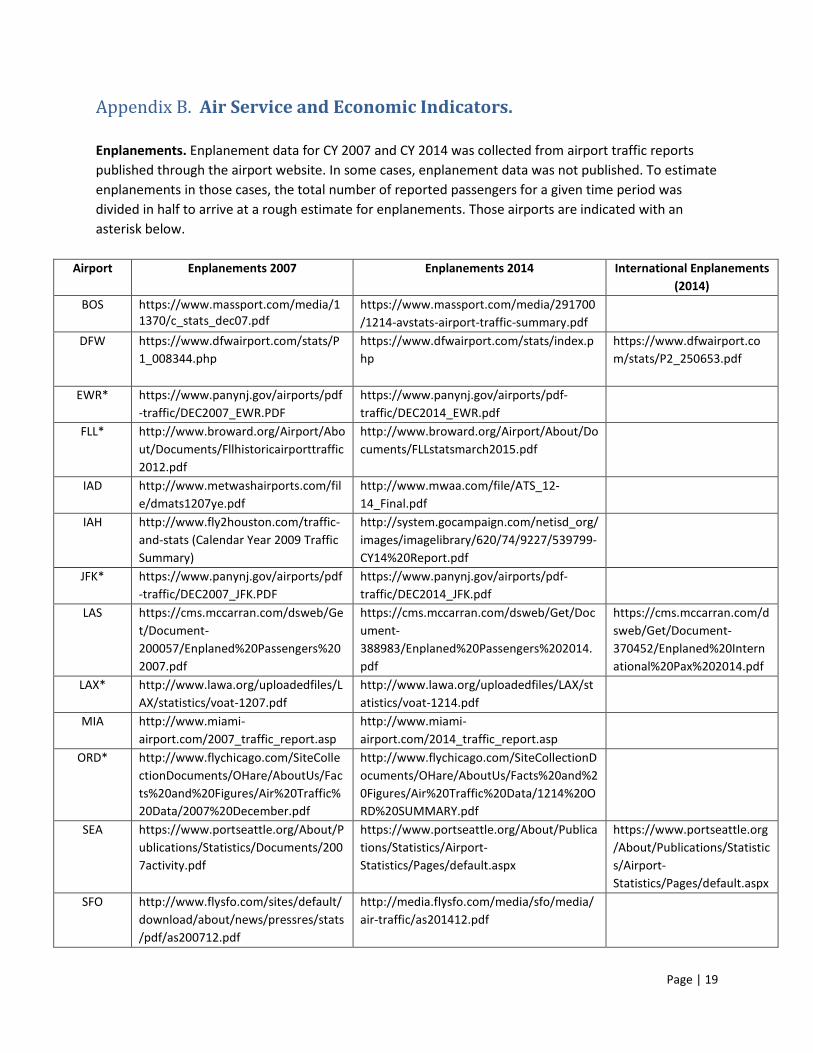
Appendix B. Air Service and Economic Indicators. Enplanements. Enplanement data for CY 2007 and CY 2014 was collected from airport traffic reports published through the airport website. In some cases, enplanement data was not published. To estimate enplanements in those cases, the total number of reported passengers for a given time period was divided in half to arrive at a rough estimate for enplanements. Those airports are indicated with an asterisk below.
Airport Enplanements 2007 Enplanements 2014 International Enplanements
(2014) BOS https://www.massport.com/media/1
1370/c_stats_dec07.pdf https://www.massport.com/media/291700/1214-avstats-airport-traffic-summary.pdf
DFW https://www.dfwairport.com/stats/P1_008344.php
https://www.dfwairport.com/stats/index.php
https://www.dfwairport.com/stats/P2_250653.pdf
EWR* https://www.panynj.gov/airports/pdf-traffic/DEC2007_EWR.PDF
https://www.panynj.gov/airports/pdf-traffic/DEC2014_EWR.pdf
FLL* http://www.broward.org/Airport/About/Documents/Fllhistoricairporttraffic2012.pdf
http://www.broward.org/Airport/About/Documents/FLLstatsmarch2015.pdf
IAD http://www.metwashairports.com/file/dmats1207ye.pdf
http://www.mwaa.com/file/ATS_12-14_Final.pdf
IAH http://www.fly2houston.com/traffic-and-stats (Calendar Year 2009 Traffic Summary)
http://system.gocampaign.com/netisd_org/images/imagelibrary/620/74/9227/539799-CY14%20Report.pdf
JFK* https://www.panynj.gov/airports/pdf-traffic/DEC2007_JFK.PDF
https://www.panynj.gov/airports/pdf-traffic/DEC2014_JFK.pdf
LAS https://cms.mccarran.com/dsweb/Get/Document-200057/Enplaned%20Passengers%202007.pdf
https://cms.mccarran.com/dsweb/Get/Document-388983/Enplaned%20Passengers%202014.pdf
https://cms.mccarran.com/dsweb/Get/Document-370452/Enplaned%20International%20Pax%202014.pdf
LAX* http://www.lawa.org/uploadedfiles/LAX/statistics/voat-1207.pdf
http://www.lawa.org/uploadedfiles/LAX/statistics/voat-1214.pdf
MIA http://www.miami-airport.com/2007_traffic_report.asp
http://www.miami-airport.com/2014_traffic_report.asp
ORD* http://www.flychicago.com/SiteCollectionDocuments/OHare/AboutUs/Facts%20and%20Figures/Air%20Traffic%20Data/2007%20December.pdf
http://www.flychicago.com/SiteCollectionDocuments/OHare/AboutUs/Facts%20and%20Figures/Air%20Traffic%20Data/1214%20ORD%20SUMMARY.pdf
SEA https://www.portseattle.org/About/Publications/Statistics/Documents/2007activity.pdf
https://www.portseattle.org/About/Publications/Statistics/Airport-Statistics/Pages/default.aspx
https://www.portseattle.org/About/Publications/Statistics/Airport-Statistics/Pages/default.aspx
SFO http://www.flysfo.com/sites/default/download/about/news/pressres/stats/pdf/as200712.pdf
http://media.flysfo.com/media/sfo/media/air-traffic/as201412.pdf
Page | 19

Number of Airlines. Information on number of airlines was gathered through searches of peer airport websites. In all cases, the number of airlines was limited to the number of passenger airlines.
Airport Source Boston Logan International (BOS)
https://www.massport.com/logan-airport/airlines-at-boston-logan/
Dallas-Fort Worth (DFW) https://www.dfwairport.com/airlines/index.php Newark Liberty (EWR) http://www.panynj.gov/airports/ewr-airlines.html Fort Lauderdale (FLL) http://www.broward.org/Airport/Flights/Pages/WhereIsMyAirline.aspx Washington-Dulles (IAD) http://www.metwashairports.com/dulles/831.htm Houston Intercontinental (IAH)
http://www.fly2houston.com/iah-About-IAH
JFK International (JFK) http://www.panynj.gov/airports/jfk-airlines.html McCarren International (LAS) https://www.mccarran.com/Fly/Airlines.aspx Los Angeles International (LAX)
http://www.lawa.org/LAXAirlines.aspx
Miami International (MIA) http://www.miami-airport.com/airline_information.asp Chicago O’Hare (ORD) http://www.flychicago.com/ohare/en/myflight/airline/pages/airline-
information.aspx Seattle-Tacoma International (SEA)
http://www.portseattle.org/Sea-Tac/Flights-Airlines/Airlines/Pages/default.aspx
San Francisco International (SFO)
http://media.flysfo.com/sfo-facts-2014.pdf
Flights, Enplanements per Flight, and Non-Stop Destinations: Data from Official Airline Guide (OAG), May 29, 2015. Origin & Destination Percentages and Low Cost Carrier Percentages: Leigh Fisher Non-Operating Revenue: Federal Aviation Administration. Form 127, 2013. <http://cats.airports.faa.gov/Reports/reports.cfm>. Concession Gross Sales per Enplanement: Airport Revenue News (ARN) Factbook, 2014.
Page | 20
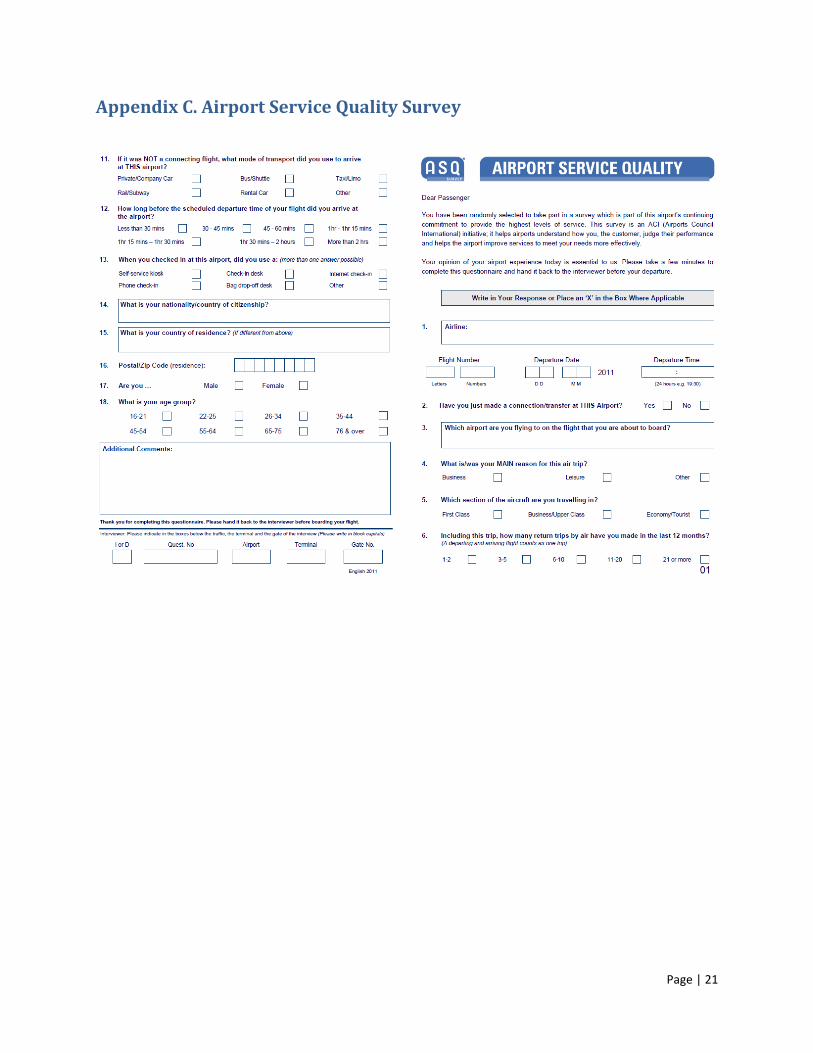
Appendix C. Airport Service Quality Survey
Page | 21
Page | 22

References Hazel, Robert A., Jan David Blais, Thomas J. Browne, and Daniel M. Benzon. “ACRP Report 19A: Resource Guide to Airport Performance Indicators.” Airport Cooperative Research Program, 2011. “Fact Sheet: San Francisco International Airport.” 2014. <http://media.flysfo.com/sfo-facts-2014.pdf>. Federal Aviation Administration. Form 127, 2013. <http://cats.airports.faa.gov/Reports/reports.cfm>. Krummenacker, Kurt and Duston Hodgkins. “Special Comment: US Airports: Top US International Gateway Airports Will Be More Resilient Than Sector Overall.” Moody’s Investors Service, November 16, 2014. Lee, Mayor Edwin M. “Mayor’s 2015-16 and 2016-17 Proposed Budget.” San Francisco, Mayor’s Office of Public Policy and Finance. San Francisco International Airport Official Statement, 2014. “San Francisco International Airport 2014 Sustainability Report.” 2014. <http://media.flysfo.com/media/sfo/community-environment/sfo-2014-sustainability-report.pdf/>.
Page | 23


![Airport IT Trends Survey 2011[1]](https://static.documents.pub/doc/80x56/547a4c85b47959a9098b49b2/airport-it-trends-survey-20111.jpg)


