i< n istitutional and Technical Implications ot Alternative Urban Sanitation and Recycling Options A Case Study of Chonburi, Thailand AIT Research Report No. 230 Asian Institute of Technology Coopers & Lybrand Associates Co.Ltd. Bangkok, Thailand May 1988
Transcript
i< n istitutional and Technical Implications ot Alternative Urban Sanitation and Recycling Options
A Case Study of Chonburi, Thailand
AIT Research Report No. 230
Asian Institute of Technology
Coopers & Lybrand Associates Co.Ltd.
Bangkok, Thailand May 1988
Economic, Institutional and Technical Implications of Alternative Urban Sanitation and Recycling Options
A Case Study of Chonburi, Thailand
AIT Research Report No. 230
Funded by
Deutsche Gesellschaft fuer Technische Zusammenarbeit (GTZ) GmbH
: ?:<:. .:'.-. ." , 2509 AD Tr._ ' V... v:.•:„•) ; r i 4 J H ex t 141/1^2
r0: 301 &&kc
ACKNOWLEDGEMENTS
This study was financed by the Government of the Federal Republic < of Germany through Deutsche Gesellschaft fuer Technische Zusammenarbeit (GTZ) GmbH, Project No.: 83.2085.5. The authors should like to acknowledge the financial and professional support extended by GTZ.
Special thanks are due to the officials of various agencies in _• Chonburi who readily provided their time for several meetings in order to clarify questions by the AIT team.
The editing assistance of Miss Celine T.M. Vicente and the services of AIT secretarial staff are gratefully acknowledged.
(ii)
RESEARCH PERSONNEL
Sewer Networks and Sewage Treatment
Principal Investigator Dr. Hermann Orth, Associate Professor
Division of Environmental Engineering
Research Associates Mr. Ravi V. Sundaram
Mr. Vaithilingam Mohanathasan
Urban Planning and Appropriate Sanitation Technology
Principal Investigator Mr. H. Detlef Kammeier, Associate Professor Division of Human Settlements Development
Research Associate Mr. S.M. Bazlul Haque
Septic Tanks and Septage Treatment
Principal Investigator Dr. Chongrak Polprasert, Associate Professor
Division of Environmental Engineering Research Associate Mr. Seni Karnchanawong
Aquaculture
Principal Investigator Dr. Peter Edwards, Professor Division of Agricultural and Food Engineering
Research Associate Mr. Seik Tuan Foo
Economic and Institutional Assessment
Mr. Chaiyong Ratanachareonsiri Economist, Coopers & Lybrand Associates Co.Ltd.
(iii)
Table of Contents
Chapter Title Page
Acknowledgements Research Personnels List of Tables List of Figures List of Maps
OBJECTIVES AND METHODOLOGY OF THE STUDY 1.1 Introductory Remarks 1.2 Objectives and Scope 1.3 Methodology
THE STUDY SCENARIO 2.1 Chonburi as a Representative Example 2.2 Regional Cities Development in Thailand 2.3 Population and Land Use Characteristics of
Small and Medium Sized Towns 2.4 Basic Population and Land Use Data on
Chonburi 2.4.1 Topography 2.4.2 Delimitation of the Study Area 2.4.3 Sources of Base Line Data 2.4.4 Land Use Categories 2.4.5 Land Use Characteristics 2.4.6 Comparison of Land Use Data
between the Municipality and the Rest of the Study Area
2.4.7 Distribution of Area and Population by Land Use Category
APPROPRIATE SANITATION TECHNOLOGY 3.1 Introductory Remarks 3.2 The Search for Affordable Solutions 3.3 Sanitation Program Planning and
Technology Selection 3.4 The Case Study Options
SEWERAGE SYSTEMS 4.1 Design Criteria
4.1.1 Design Criteria for Conventional Sewers
4.1.2 Design Criteria for Small Bore Sewers
4.1.3 Design Criteria for Pumping Stations
4.2 Unit Costs and Cost Evaluation Procedures 4.2.1 General Procedures for Cost
Estimates 4.2.2 Construction of Sewers 4.2.3 Cost of Manholes and Cleanouts 4.2.4 Cost of Pumping Stations 4.2.5 Operation and Maintenance Cost
(ii) (iii) (vii) (x) (xi)
1 1 1 2
4 4 4
10 10 10 13 13 16
17
17
21 21 21
23 24
33 33
33
36
38
39
39 40 42 43 44
(iv)
4.3 Design and Evaluation of Basic Costs 44 4.3.1 Service Areas for Alternative
Sewerage Options 44 4.3.2 Main Sewer Alignment 47 4.3.3 Design and Basic Cost of Main
Sewers 48 4.3.4 Layout and Cost Estimation Procedure
for Lateral Sewers 54 4.3.5 Basic Cost of the Lateral Sewer
System 57 4.3.6 Basic Cost of Pumping Stations 60
4.4 Compilation and Comparison of Costs of Sewerage Options 64 4.4.1 Overview of Costs of the Various
Sewerage Options 64 4.4.2 Construction Cost of Conventional
6.1.4 Cost Evaluation of Alternatives 102 6.2 Economic Analysis of Fish Culture in
Waste Stabilization Ponds for the Selected System Options of Waste Treatment 102 6.2.1 Introduction 102 6.2.2 Waste Treatment Alternatives 103 6.2.3 Design Assumptions 103 6.2.4 Results 107
6.3 Conventional Wastewater Treatment 107 6.3.1 Design Criteria for Wastewater
Treatment Facilities 107 6.3.2 Design of Conventional Treatment
Facilities 112 6.3.3 Cost Evaluation 112
(v)
p
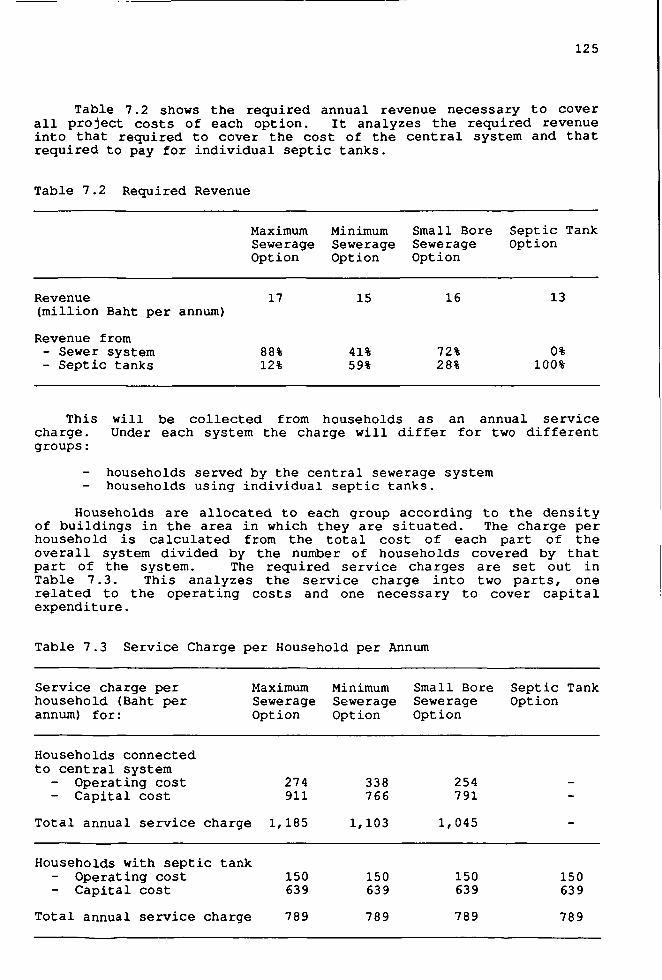
FINANCIAL ANALYSIS 123 7.1 Introduction 123 7.2 Capital Investment and Operating Cost 123 7.3 Required Revenue and User Charges 124 7.4 Affordability of the Proposed Systems 126 7.5 Capital Funding 12 6
INSTITUTIONAL ASPECTS 129 8.1 Introduction 12 9 8.2 Regulatory Background 129 8.3 Institutional Factors 130 8.4 Roles of Agencies Involved 130 8.5 Project Implementation 133 8.6 Major Obstacles to the Implementation of the
Proposed System 137
CONCLUSIONS 138 9.1 Summary of Results 138 9.2 Conclusions and Suggestions 138
APPENDIX 146
(vi)
List of Tables
Table No. Title Page
2.1 Comparative Economic Performance of Changwat Chonburi 5
2.2 Urban Area Characteristics: 25 Small and Medium-Sized Towns Compared with Chonburi 11
2.3 Base Line Data in Comparison with Data from
the Water Supply Study 15
2.4 Land Use Characteristics 18
2.5 Summary of Land Use Data 19 2.6 Area and Population Distribution by Land Use
Category 20
3.1 A Summary of the Significant Characteristics of the Three Classes of Sanitation Systems 23
3.2 Technical Alternatives Selected for Preliminary Assessment 30
3.3 Synopsis of the Four Options Selected for
Economic Evaluation 31
4.1 Summary of Daily Flow Rates 35
4.2 Summary of Design Criteria for Sewers 38
4.3 Unit Cost of Pipe Materials and Installation
from Different Sources in Baht 41
4.4 Unit Costs of Civil Works 43
4.5 Unit Costs of Manholes 43
4.6 Unit Costs of Mechanical and Electrical Equipment 4 4
4.7 Gross Area, Built-up Area, Population Density, and Population in Service Areas Considered for Sewerage 45
4.8 Basic Main Sewer Costs: Maximum Sewerage Option, Alternative I 52
4.9 Basic Main Sewer Costs: Maximum Sewerage Option, Alternative II 52
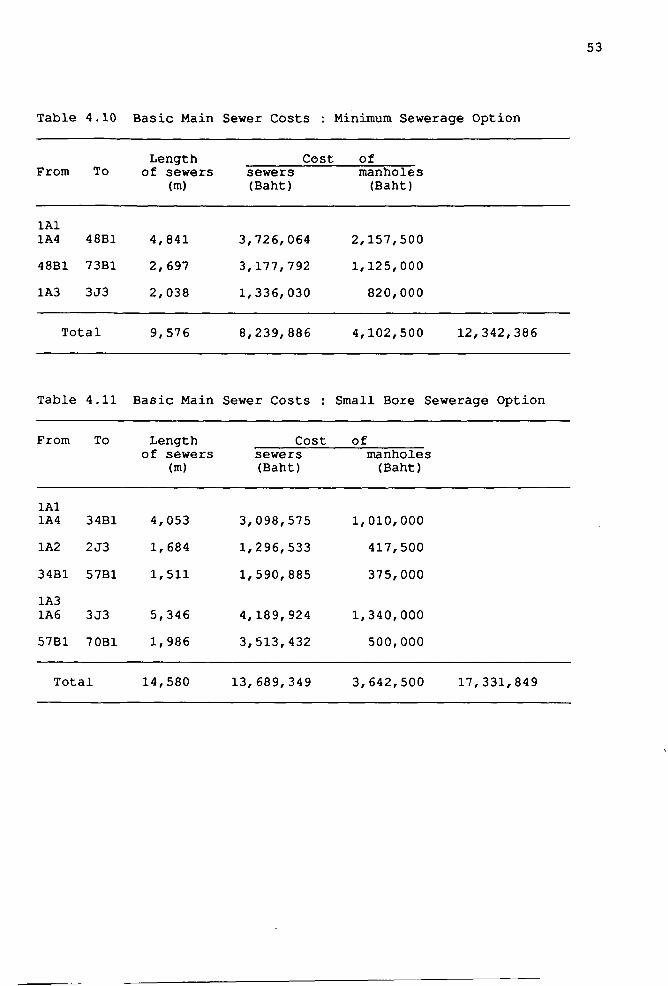
4.10 Basic Main Sewer Costs: Minimum Sewerage Option 53
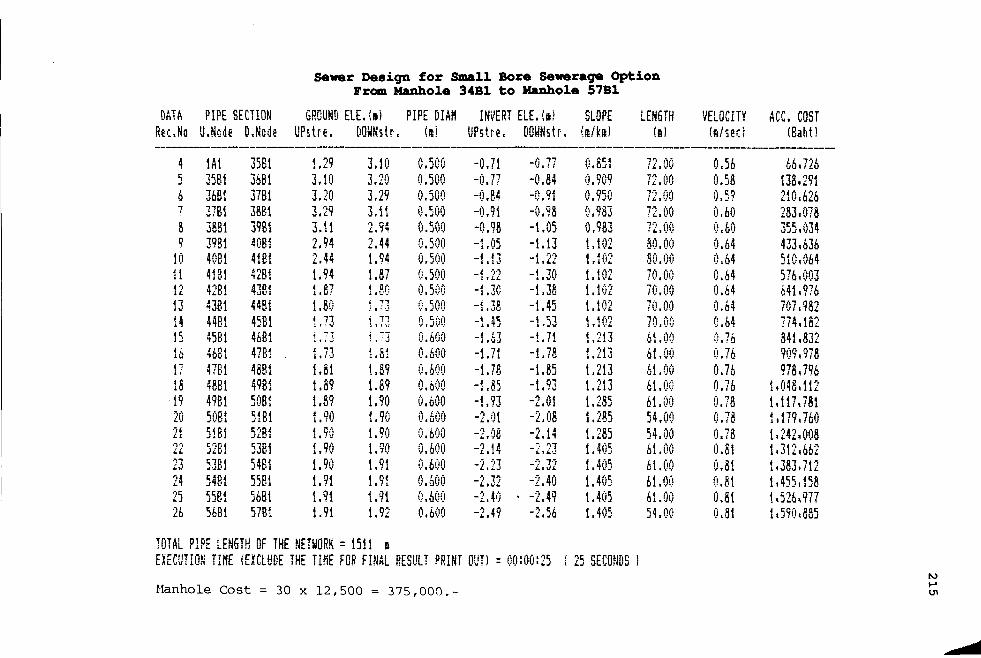
4.11 Basic Main Sewer Costs: Small Bore Sewerage Option 53
4.12 Length of Lateral Sewers and House Connections and Number of Houses/ Institutions in the Representative Service Areas 56
(vii)
Basic Cost per Hectare of the Lateral Sewer System for Conventional Sewerage 58 Basic Cost of the Lateral Sewer System for the Maximum Sewerage Option 59 Basic Cost of the Lateral. Sewer System for the Minimum Sewerage Option 60 Basic Cost per Hectare of the Lateral Sewer System for the Small Bore Sewerage Option 61 Basic Cost of the Lateral Sewer System for
the Small Bore Sewerage Option 62
Basic Construction Cost of Pumping Stations 63
Annual Energy Consumption and Basic Cost of Pumps 64 Construction Cost,of Conventional Sewerage versus Small Bore Sewerage 68 Basic Areal Costs of Conventional Sewerage Versus Small Bore Sewerage for Different Population Densities (Without Interceptor Tanks) 68
Excreta Disposal Systems - Chonburi Survey Results 74 Wastewater Flow Rates From Institutional Sources 78 Minimum Distance Requirements for Septic Tanks and Soakage Pits in Common Well-Developed Soils 79
Cost Estimation of the Household Septic Tank 81
Cost Estimation of the Household Soakage Pit 81
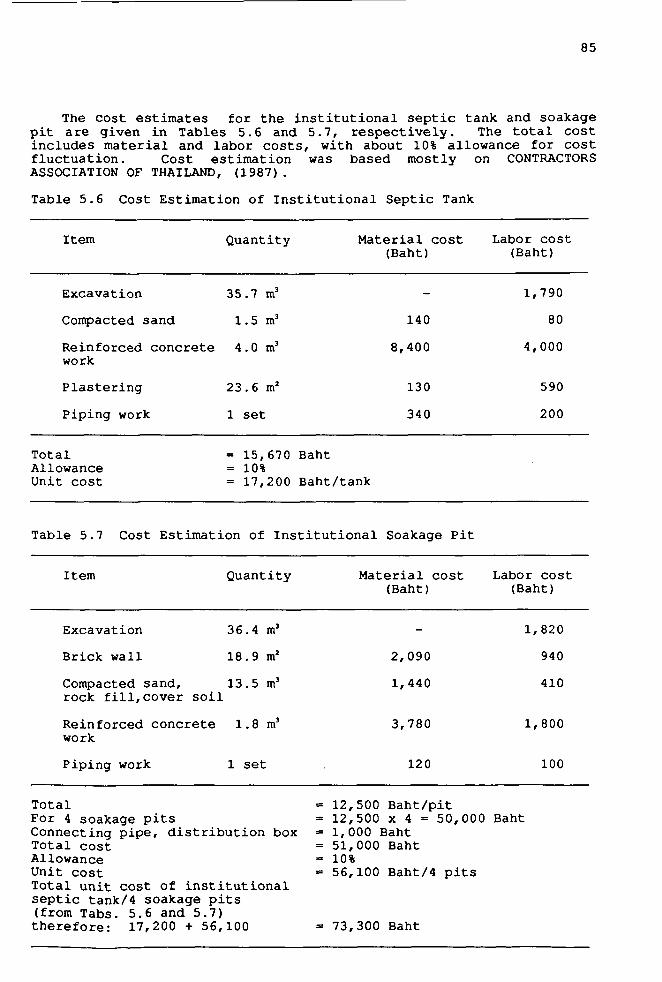
Cost Estimation of Institutional Septic Tank 85
Cost Estimation of Institutional Soakage Pit 85
Cost Estimation of Cesspool System 86
Construction Costs of Septic Tanks/Soakage Pits 87
Septage Quantity 88
Collection Fee of Septage 88
Fuel Costs of Septage Collection 89
Septage Characteristics 93
Sizing of Septage Treatment Units and
Associated Costs, (Alternative 1) 94
Operating Cost, (Alternative 1) 97
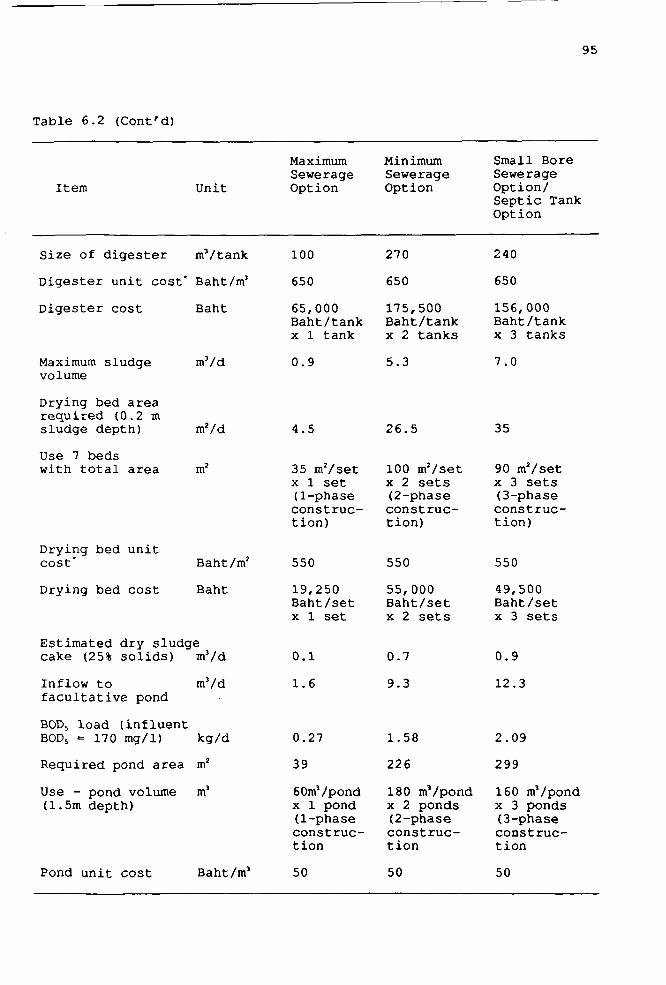
Sizing of Septage Treatment Units and Associated Cost, (Alternative 2) 100
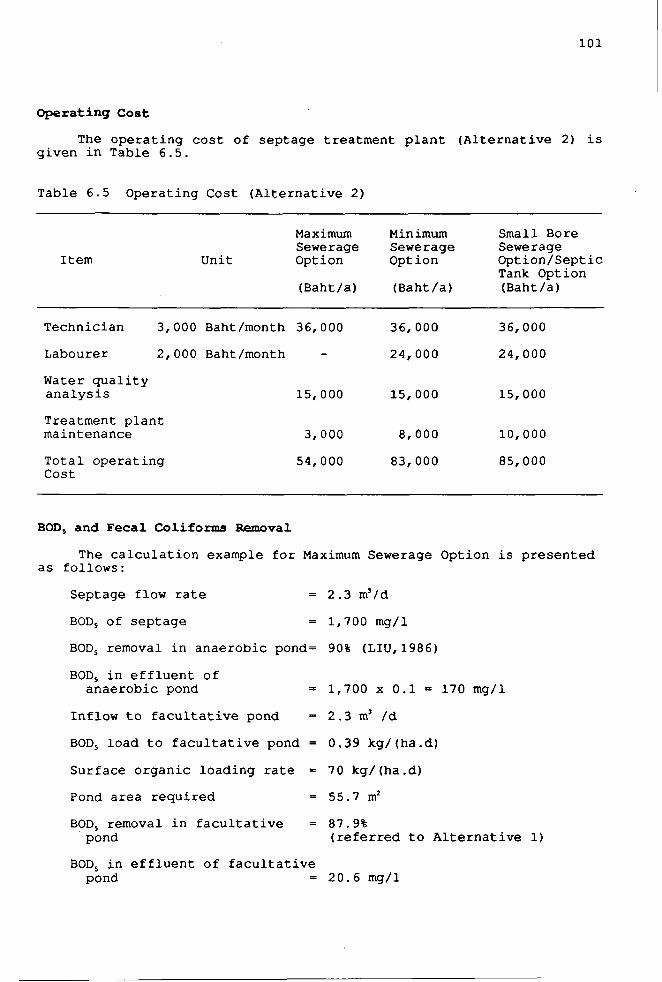
6.5 Operating Cost, (Alternative 2) 101
4 .
4 .
4 .
4 .
4 .
4 .
4 .
4 .
4.
5.
5.
5,
5,
5,
5
5
5
5
5
5
5
6
6
6
6
13
14
15
16
17
18
19
20
.21
.1
.2
.3
.4
.5
.6
.7
.8
. 9
. 10
. 1 1
.12
. 1
.2
.3
.4
(viii)
6 Population Serviced, Sewage/Septage Loading, and Maturation Pond Sizes of Sanitation Options Under Consideration 106
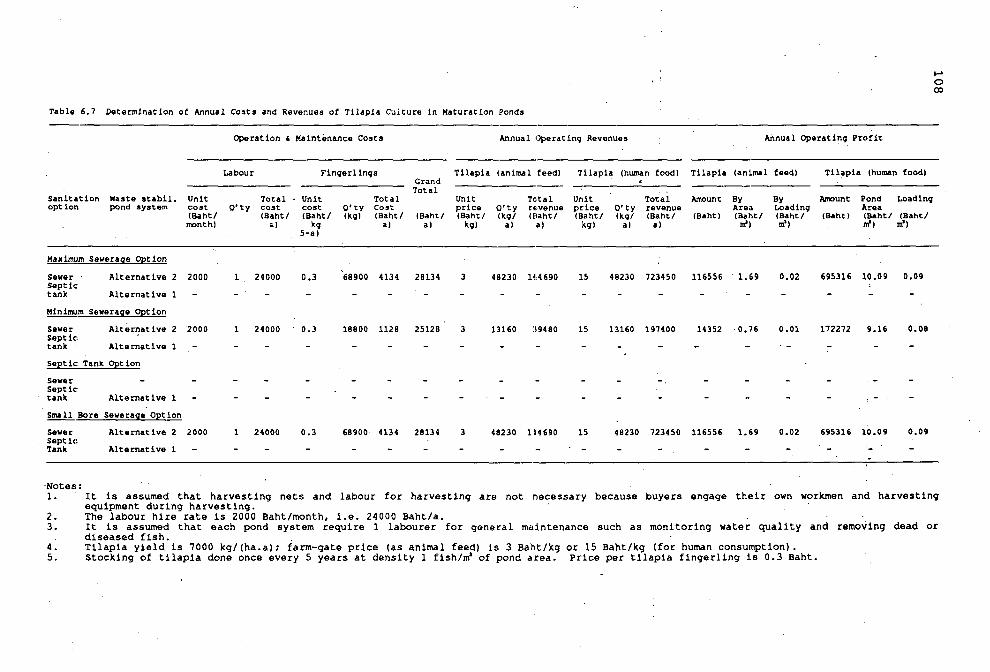
7 Determination of Annual Costs and Revenues of Tilapia Culture in Maturation Ponds 108
8 Summary of Design Criteria for Wastewater Treatment Facilities 111
9 Main Dimensions of the Stabilization Pond
System 113
10 Main Dimensions of the Aerated Lagoon System 114
11 Construction and Operation Costs of the Activated Sludge Plants (without land cost) 115
12 Cost of Stabilization Pond System for the Maximum Sewerage Option 116
13 Cost of Aerated Lagoon System for the Maximum Sewerage and the Small Bore Sewerage Option 117
14 Cost of Stabilization Pond System for the Minimum Sewerage Option 118
15 Cost of Aerated Lagoon System for the Maximum Sewerage Option 119
16 Cost of Stabilization Pond System for the
Small Bore Sewerage Option 120
17 Investment Cost of Treatment Facilities 121
18 Annual Operation Cost of Treatment Facilities
in Baht per Person per Annum 121
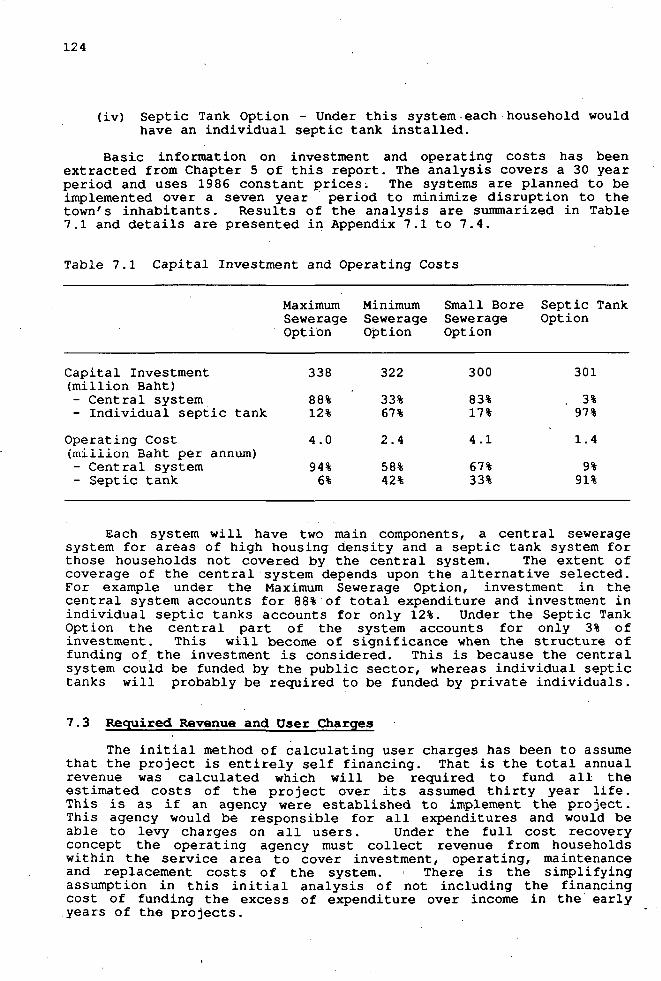
1 Capital Investment and Operating Costs 124
2 Required Revenue 125
3 Service Charge per Household Per Annum 125
4 Structure of Capital Funding 127
5 Annual Service Charge and Contribution to Capital per Household 127
1 Summary of Costs for Construction and Operation/Maintenance 139
(i*>
List of Figures
Figure No Title Page
2.1 Urban Household Income Distribution, 1981 8
2.2 Alternative Definitions of Urban Area, Example Chonburi 12
2.3 Delimitation of the Study Area 14
3.1 First-Stage Algorithm for Selection of Sanitation Technology 25
3.2 Second-Stage Algorithm for Selection of Sanitation Technology 26
3.3 Third-Stage Algorithm for Selection of Sanitation Technology 27
3.4 Generic Classification of Sanitation Systems 28
4.1 Cost of Pipe Material, Laying and Surface
Repair as a function of the Pipe Diameter 42
4.2 Main Sewer Layout for Maximum Sewerage Option I 46
4.3 Main Sewer Layout for Maximum Sewerage Option II 49
4.4 Main Sewer Layout for Minimum Sewerage Option 50
4.5 Main Sewer Layout for Small Bore Sewerage Option 51
4.6 Representative Areas for the Lateral Sewer
System in Various Landuse Categories 55
5.1 Schematic Diagram of Septic Tank and Soakage Pit 71
5.2 Typical Cesspool Unit in Thailand 72
5.3 Typical Layout of Rowhouse With Drainage of Cesspool System Overflow to Public Drain 75
5.4 Septic Tank Capacities for Sewage Flows upto
14,500 gal/d 77
5.5 Household Septic Tank - Soakage Pit 82
5.6 Institutional Septic Tank with Four Soakage Pits 83
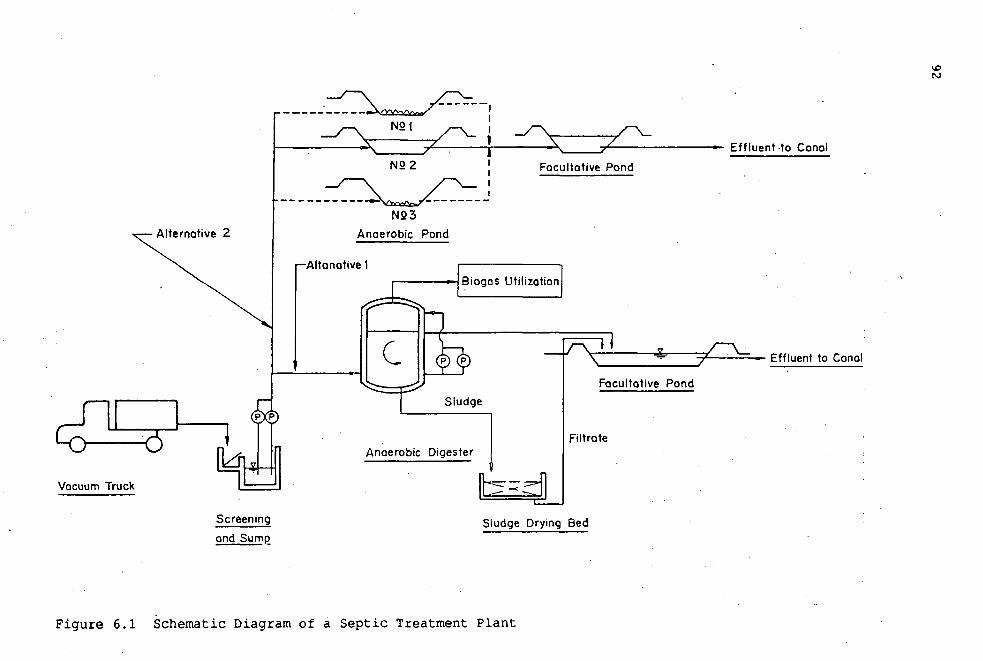
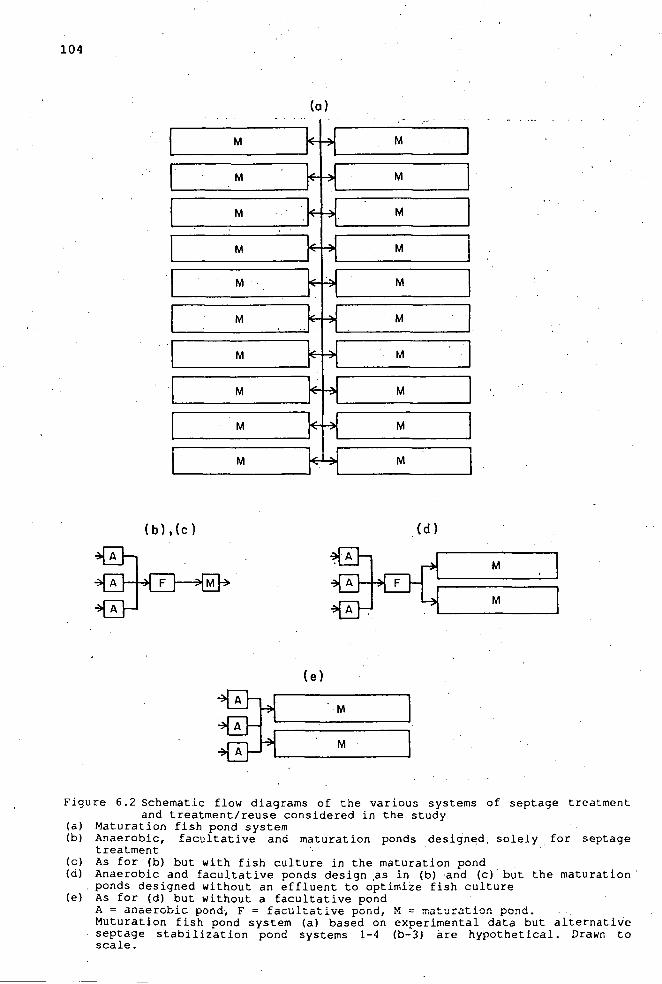
6.1 Schematic Diagram of a Septic Treatment Plant 92 6.2 Schematic Flow Diagrams of the Various Systems of
Septage Treatment and Treatment/Reuse Considered in the Study 104
8.1 Communication Between Government and Changwat Government 132
8.2 Implementation of Sewerage System 134
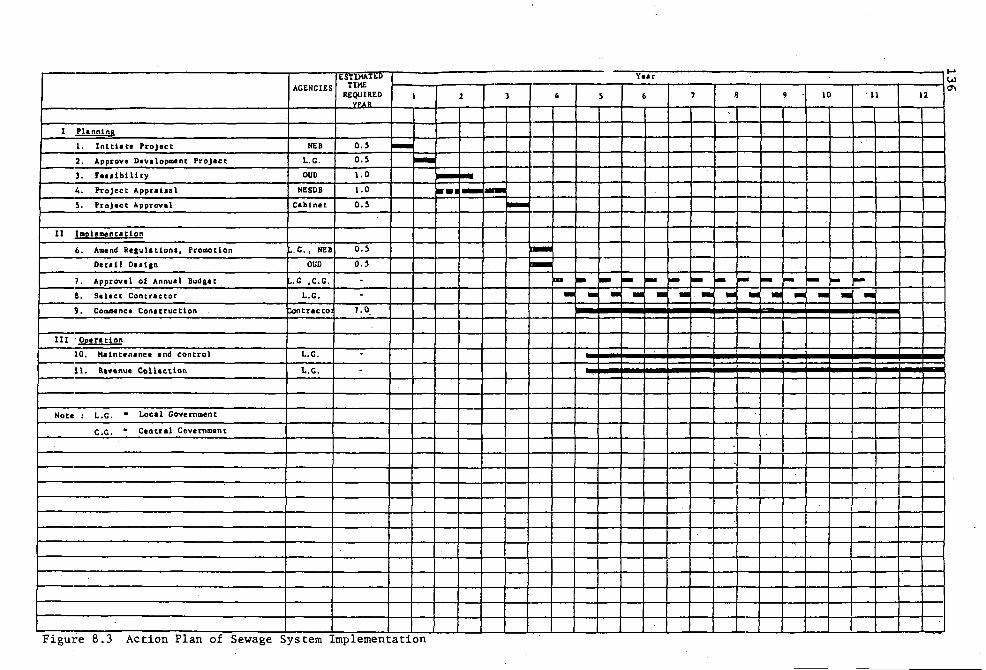
8.3 Action Plan of Sewage System Implementation 136
9.1 Selection of Sanitation Technology Scenario 1 144
9.2 Selection of Sanitation Technololgy Scenario 2 145
(x)
List of Maps
Map No. Title
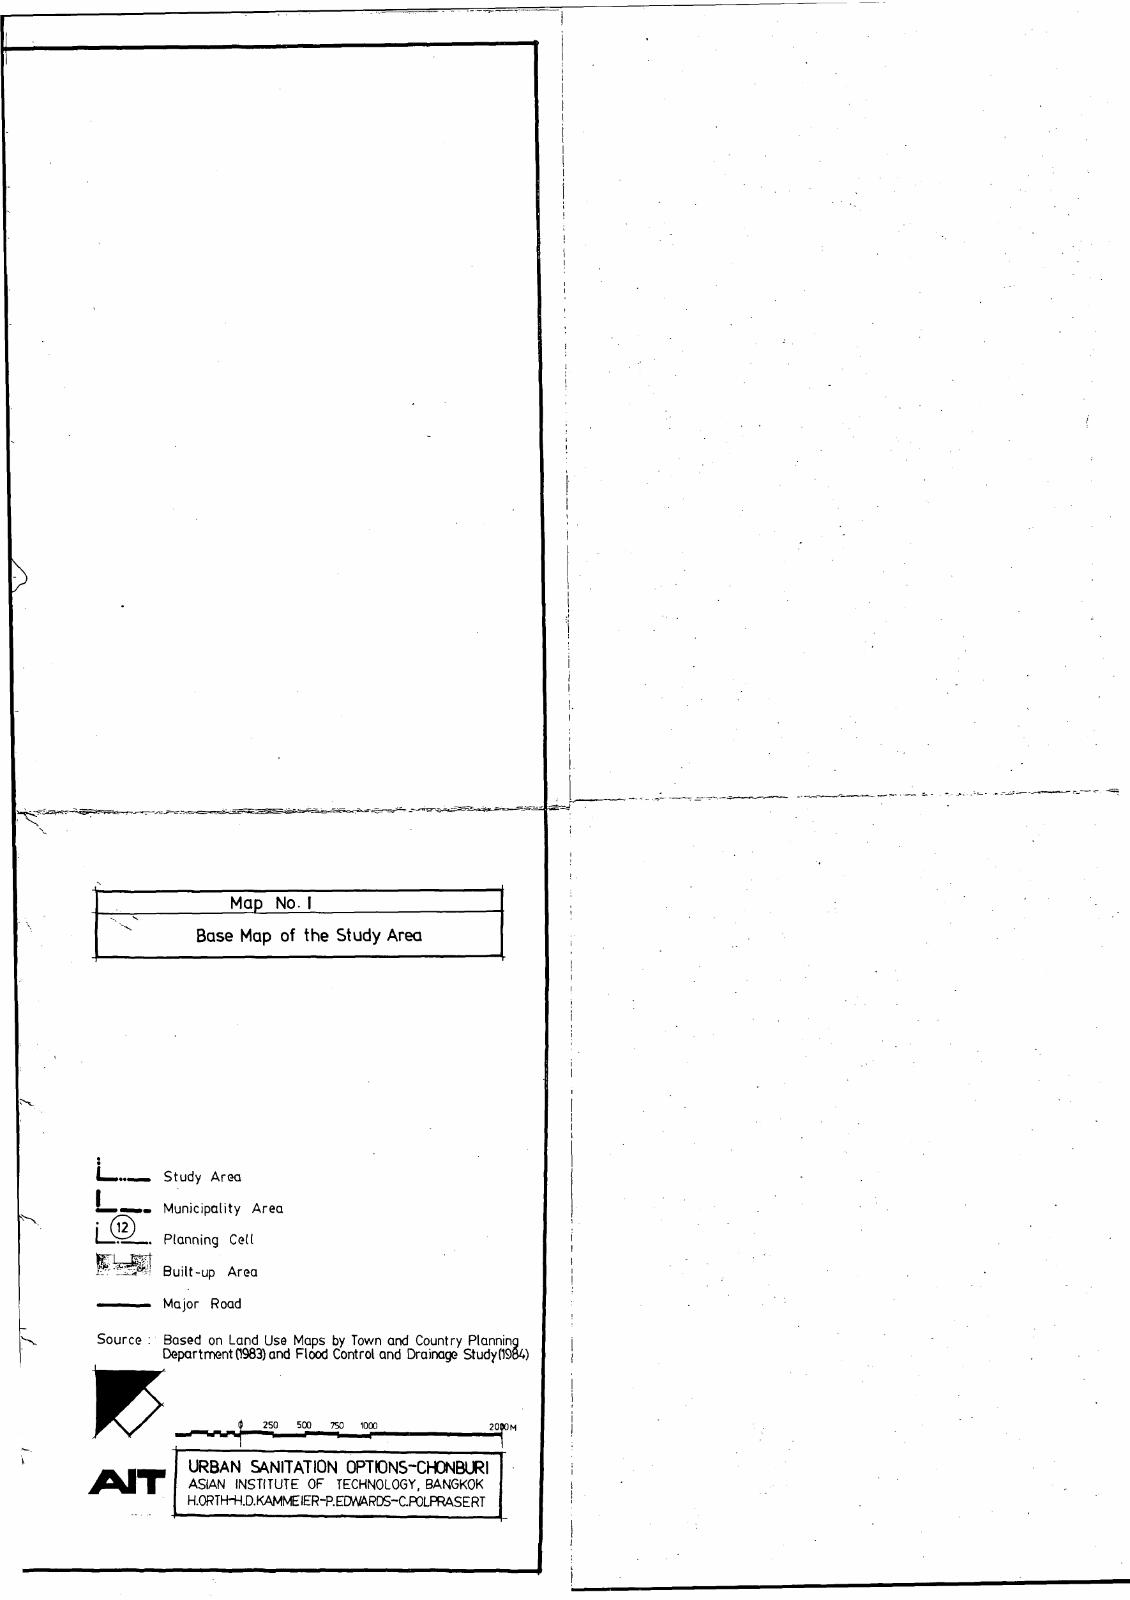
1 Base Map of the Study Area
2 Base Map of the Municipality and Its Surroundings
3 Secondary Sewer Network in Planning Cells 8, 9 and 19
4 Secondary Sewer Network in Planning Cells 19, 20, 24 and 25
5 Secondary Sewer Network in Planning Cells 21 and 29
(*i)
1
1. OBJECTIVES AND METHODOLOGY OF THE STUDY
1.1 Introductory Remarks
"Foul water may well rate as the greatest single source of human disease and misery. It is, therefore, encouraging to see it moving towards the head of the world's priority list of basic needs.... However, the emphasis on 'clean water' carries with it a risk. It can allow policymakers to neglect the equally urgent need for sanitation." (Barbara Ward, in RYBCZYNSKI, POLPRASERT and MCGARRY, 1978). Barbara Ward, the late President of the International Institute for Environment and Development, pointed to one of the problems implied in the goals of the International Drinking Water and Sanitation Decade 1980-1990: Providing improved water supply must include the rather more complex requirements of sanitation, i.e. disposal, treatment, and possible reuse of human waste and wastewater.
Sanitation technology for developing countries in the tropics is not limited to either primitive and unhygienic latrines or "Western" waterborne sewerage. Between these extremes, a wide range of alternatives have been advocated that are claimed to be "appropriate", i.e. both effective and affordable. Unfortunately, however, there is a widespread lack of knowledge about acceptable alternatives, apart from the two other primary constraints to sanitation improvements, lack of funds, and lack of trained personnel (KALBERMATTEN et al., 1980).
For more than a decade, the World Bank in particular, as well as other international agencies, have been very active in exploring and publicizing alternative sanitation technologies for developing countries. However, while the available case studies and field manuals provide in-depth coverage of the solutions at the levels of the individual household and the smaller low-income community, there is a lack of applied system comparisons. This would imply a systematic assessment of the technical, economic and institutional problems associated with implementing selected sanitation plans and programmes.
1.2 Objectives and Scope
The broad objective of the study is to show the economic and institional implications of alternative sanitation options, as applied to a typical medium-sized town in Thailand. The term "option" is used to cover specific sets of sanitation systems that consist of alternative solutions to wastewater collection, transportation, treatment and disposal. As the study was not conceptualized as a plan for a particular town, the details of the sanitation options were kept at the level of preliminary engineering design. This permitted to prove the technical feasibility of the options considered as well as to establish a reasonably reliable basis for an economic assessment. For reasons of logical consistency, the four options selected for economic evaluation, were designed to provide identical levels of service, in terms of public health and environmental safety, but not necessarily in terms of user convenience.
The main objectives of the study are:
1. comparative assessment of the technical feasibility of alternative sanitation systems, as applied to the density and land-use patterns of a typical medium-sized town.
2
2. Comparative economic evaluation of the sanitation options, with regard to investment costs and annual operation costs, assuming the line of loan financing common in Thailand.
3. Assessment of the possibilities for cost recovery by means of user charges - one-time connection charges and/or annual fees - as well as revenue generation through various forms of recycling, for example biogas production and aquaculture.
4. Assessment of the institutional opportunities arid constraints involved in implementing the alternative sanitation systems; in particular, this would refer to the implied funding patterns of the various sanitation systems, which may require very different financial responsibilities to be borne by the public and private sectors.
As the study is not intended to serve as a plan for Chonburi, many data that are used in the calculations are based on secondary sources and reasonably justified estimates, but not on specific surveys. The aim was to make the system comparison reliable in terms of order of magniture, rather than specific details for the case of Chonburi. This approach is hoped to provide some technical, economic and management answers with regard to the actual "appropriateness" of certain technical solutions that have been advocated in the last few years. At the same time, however, any "appropriate" technology must be within "affordable" limits of the various sectors of the society.
The definition of what may be affordable, to a considerable extent depends on value judgements, apart from hard economic facts and figures. Hence the answer can hardly be a clearcut "yes" or "no". Therefore, the purpose of the study may be seen also in raising some, further questions, rather than providing definite answers, in view of the necessary policy discussions among the government bodies concerned.
1.3 Methodology
To a certain extent, the present study aims at demonstrating the principles of sanitation program planning, as applied to the specific conditions of medium-sized towns in Thailand. Much emphasis was put on the discussion of opportunities and constraints for applying the various components of alternative sanitation systems. Therefore, what the study addresses, is the socio-economic and institutional context, and even the political framework, in addition to the technical aspects of sanitation improvements. In other words, the attention paid to the planning and implementation process in the study is as important as its results.
"Sanitation program planning is the process by which the most appropriate sanitation technology for a given community is identified, designed, and implemented. The most appropriate technology is defined as that. which provides the most socially and environmentally acceptable level of service at the least economic cost." (KALBERMATTEN et al., 1980: p. 4) Based on this kind of approach, which has been recommended by the World Bank, the first task is to identify the existing sanitation problems specific to the various land use areas and social groups in the sample city. This was done by referring to the urban planning and infrastructure engineering studies that have been undertaken for Chonburi during the last ten years or so.
Apart from describing the problems, the initial review of the
3
existing situation also establishes the scope for what type of sanitation technology would actually constitute an improvement, thus narrowing the scope for the second step of the analysis, i.e., an examination of the principal alternatives that may be available. For example, in Chonburi as well as in the other intermediate cities in Thailand, most households have piped water supply, and virtually all households have individual pour-flush toilets. The problem in many parts of the urban areas is not that of too few or unhygienic toilets, but that of leaking cesspools combined with high ground water tables. Therefore, to continue this example, a whole range of technically sound solutions must be discarded from the outset on the grounds of social acceptability - such as, for example, communal toilet facilities.
The second step of the methodology, a review of possible sanitation improvements, leads on to the formulation of four options, which are technically sound systems to meet the sanitation needs of the city as a whole. The four options considered are:
- Maximum Sewerage Option - Minimum Sewerage Option - Small-bore Sewerage Option - Septic Tank Option
The system options will be presented in Chapter 3, in the context of a broad review of sanitation technologies. This chapter also refers to the physical, socio-economic and administrative conditions of the study area, which is introduced in Chapter 2, entitled "the study scenario".
Both, a more general discussion of technical alternatives as well as the specific calculations related to the four options, are contained in Chapters 4,5, and 6 which deal with
- sewerage systems (Chapter 4),
- on-site wastewater treatment (Chapter 5), and
- central wastewater treatment, including recycling by means of aquaculture (Chapter 6).
The technical systems discussion related to the four options results in a framework of cost estimates for investment as well as operation and maintenance costs. These in turn are used as inputs for an economic evaluation (Chapter 7) and an assessment of the institutional implications (Chapter 8). Chapter 9, finally, presents a set of conclusions - both in terms of definite answers and possible further questions.
REFERENCES
1. KALBERMATTEN, J.M. et al. (1980), Appropriate Technology for Water Supply and Sanitation, A Sanitation Field Manual, The World Bank, Washington, D.C.
2. RYBCZYNSKI, W., C. POLPRASERT, and M. MCGARRY (1978), Low-Cost Technology Options for Sanitation, IDRC, Ottawa, Ont.
4
2. THE STUDY SCENARIO
2.1 Chonburi as a Representative Example
Chonburi as a study area was selected for two reasons: (i) it is a medium-sized town which in various ways represents the physical, socio-economic, and administrative conditions of many smaller and medium-sized towns in Thailand. Furthermore (ii), there are a number of recent technical studies on urban development as well as infrastructure provision for Chonburi, containing the kind of base line data that were needed for the present study. The emphasis of the study is on a Thailand-specific systematic comparison of sanitation options, but it is not a Chonburi-specific planning project. The available background materials on Chonburi provided sufficient information on most aspects dealt with in the study. Therefore, all socio-economic and land use data were based on secondary sources in order to avoid unnecessary and time-consuming original surveys.
At a population size of just over 100,000, Chonburi, which is the capital of a province of the same name, may be at rank seven or eight' among the 124 municipality towns in Thailand. (This number does not include Bangkok which has a different administrative status, equivalent to a province.) It is one of the characteristic features of the urban sector in Thailand that such a statement cannot be made with more certainty: in many cases, the statistical "urban" population number is considerably smaller than the actual urban population, because the administrative area of the municipality is normally much smaller than the actual urban aggregate. However, defining such an area by means of functional geographic criteria would require a special survey, and the resulting figures would be just unofficial estimates. In an attempt at calculating the actual magnitude of urban population in Thailand, KAMMEIER (1986) estimated the urbanization ratio of 197 9 at 27% as compared with the "official" figure of under 18%.
In terms of economic growth dynamics, Chonburi may represent a rather smaller number of towns and their corresponding provinces, as Changwat Chonburi has one of the highest provincial per capita incomes (Table 2.1). Nevertheless, in many respects, such as land use and activity patterns as well as local government and its limited financial potential, Chonburi definitely constitutes a typical example of an intermediate city.
2.2 Regional Cities Development in Thailand
Over the last 10 to 15 years, many developing countries have made increasing efforts towards planning and implementing national urbanization strategies. The rationale for such programs is often based on two interrelated themes, i.e., providing complementary urban support functions to rural development, and diverting the migration pressure from the metropolitan regions. In this context, the intermediate cities provide the greatest potential for successful development programs (KAMMEIER and SWAN, 1984).
5
Table 2.1 Comparative Economic Performance of Changwat Chonburi
Gross Provincial Product (GPP) Per Capita (1984)
Area Baht Index'
Whole kingdom 19,551 100
(mean)
Chonburi 47,963 245
Greater Bangkok Area 56,092 287 (highest) Kalasin 6,242 32 (lowest)
Central Region2' - Eastern 25,210 129 - Central 16,146 83 - Western 21,228 109
1) Mean value (whole kingdom) = 100 2) Gross Regional Product by statistical subregion
(excluding Greater Bangkok Area)
Source: GPP data from National Economic and Social Development Board
For many years, the National Development Plans of the Thai Government have emphasized the need to develop the peripheral regions. Although earlier plans had included the importance of decentralized urban development, it has only been since the Fourth Plan (1977-1981) that a specific program for "regional cities" was set up. From the initially nominated nine growth centers, five were selected for the Regional Cities Development Project which was launched in 1980. These cities are: Chiang Mai, Khon Kaen, Nakhon Ratchasima, Hat Yai, and Songkhla. The Regional Cities Development Project aims at strengthening the cities by means of strategic infrastructure projects that are funded by a large World Bank loan. The project is being carried out with technical management by the Office of Urban Development within the Department of Local Administration (DOLA). The work of this office is supported by a UNDP/Australian consulting team, as well as by the respective municipal and provincial offices. On the basis of the appropriate studies at pre-investment and feasibility levels, a number of key infrastructure projects are now under construction. Typically, the proposed infrastructure improvements consist of the following components:
drainage and flood control water supply wastewater treatment solid waste disposal roads improvement of mixed-use areas and slums specific projects, such as slaughterhouse, bridges, port development, etc.
6
By the time of completing the feasibility studies, the total cost of these projects in all five cities was estimated at 2,630 million Baht (see SINCLAIR KNIGHT & Partners et al., 1983, Vol. 1 - Main Report).
Chonburi is not included in the Regional Cities Project, but it has received even greater attention as the main center of the Eastern Seaboard Region. The industrial development projects around the new ports at Laem Chabang and Map Ta Phut are in various stages of planning and implementation. Located in between the national capital and the newly developing industrial port centers, Chonburi is expected and proposed to be strengthened as the most important commercial center of the area, with a considerable role in manufacturing as well. Pursuant to the priority proposals for urban development in Chonburi (as described in the Eastern Seaboard Study, Sector Studies, COOPERS & LYBRAND et al., 1982), major efforts are being made for infrastructure improvements in the city. The most important interrelated proposals and projects are on the following subject areas (for detailed references, see Appendix 2.1):
Urban development, Eastern Seaboard (COOPERS & LYBRAND et al., 1982)
Drainage and flood control (ENGINEERING CONSULTANCY Services Centre/TISTR, 1985)
Sewerage and excreta disposal (GTZ/WHO/PWD/SEATEC International, 1983)
Water supply (KOCKS Consult/THAI PROFESSIONAL Engineering Consultants/PWWA, 1984/1985)
All of these studies were used to some extent in order to establish the baseline data for the present study.
Under the Sixth National Development Plan (1987-1991), the current policy for concentrated decentralization of urban development in the regional cities is to be supplemented by a "second generation" of regional cities, as well as a range of lower order centers. Although the present regional cities hardly reach a population size of 200,000, the projected growth rates of 2.5% to 4.3% per annum suggest that, by the end of this century, Thailand may well have a number of cities in the 250 to 350,000 range. Their contribution to national economic and social development will depend on effective planning, which must be concerned with, among other issues, appropriate levels and forms of infrastructure provision. There is no doubt that this requires well-founded early decisions on key systems such as wastewater collection and treatment. In this context, the present study definitely addresses a medium- to long-term perspective, although, for methodical reasons, only current data were used.
2.3 Population and Land Use Characteristics of Small and Medium-Sized Towns
In view of the general applicability of the present study, it will be advantageous to highlight some of the typical features of smaller and medium-sized towns and cities in Thailand. Urban sanitation is one of those fields of infrastructure provision and management where the "human factor" plays a significant role, apart from topographic and climatic data. In other words, any proposed
7
sanitation plan and its eventual implementation and management, will have to respond to certain patterns of the society and the economy, as well as their changing mirror images of land utilization and development.
In addressing the complex problem of affordability first, it is extremely difficult to determine the level of costs that a majority of the population is able or rather, willing, to pay for an adequate level of sanitation. Using the data from the Regional Cities Development Project, Figure 2.1 may illustrate representative income distribution patterns. However, it is difficult indeed to relate such statistics to adequate levels of service, or, to a feasible mix of different sanitation systems. This may consist of a simplified "appropriate technology" system of doubtful performance, for poor people's areas, and a more advanced, environmentally safe system for the more affluent sectors of the society. (As a footnote to this complex issue, see Appendix 2.2.) Convincing as a multiple-standard system may sound in theory, it would not be easy to implement it in a city of mixed land uses that lack a clear locational separation of income groups. Another problem in this context is how to determine acceptable, and enforceable, levels of user charges among rather different income groups. It is not clear whether a small but arbitrary percentage can be used on the basis of some international comparison, or, as appears to be the case, that the very low costs of the deficient present sanitation system would have to be used as a yardstick. (In this respect, refer to the discussion of costs and user charges in Chapter 7.)
It may be relevant to use the example of property taxation for comparison. Although the legal basis is already weak, as it grants unusually generous tax exemptions, there appear to be considerable administrative constraints to efficient revenue collection from property taxes (MANNING, 1984). In view of this deficiency, the World Bank loan for regional cities development is combined with a subproject which aims at improving cadastral maps as well as procedures for property tax collection. Among several other cities, Chonburi has already begun to set up detailed new property tax maps (1:1000). However, it is not yet known whether there is any significant effect on raising and collecting more property taxes.
Urban development in Thailand has been dominated by the forces of the market rather than the effects of planning. This refers to urbanization at the national and regional levels, as well as to the local level, where some generalizations can be made with regard to typical development patterns and spatial elements. Normally, a close relationship between urban development and major transport routes can be observed. This applies to locational shifts of the city center away from a river bank or a fishing port, towards a highway connection or intersection that was originally built at the periphery of a town. In most cities in Thailand, road traffic is much more important to the economy than water or rail transport. Apart from the visible influence of accessibility, major public-use locations often attract, like magnets, private commercial land uses.
On the whole, growth and change processes are reflected in some typical urban patterns:
Most cities and small towns have an older center with one-to two-story wooden shophouses, often along with a busy market that spills over into the adjacent narrow lanes.
All municipalities Excl. Central Region and Bangkok Bangkok
Source: SINCLAIR KNIGHT & Partners et al. (1983)
Figure 2.1 Urban Household Income Distribution, 1981
9
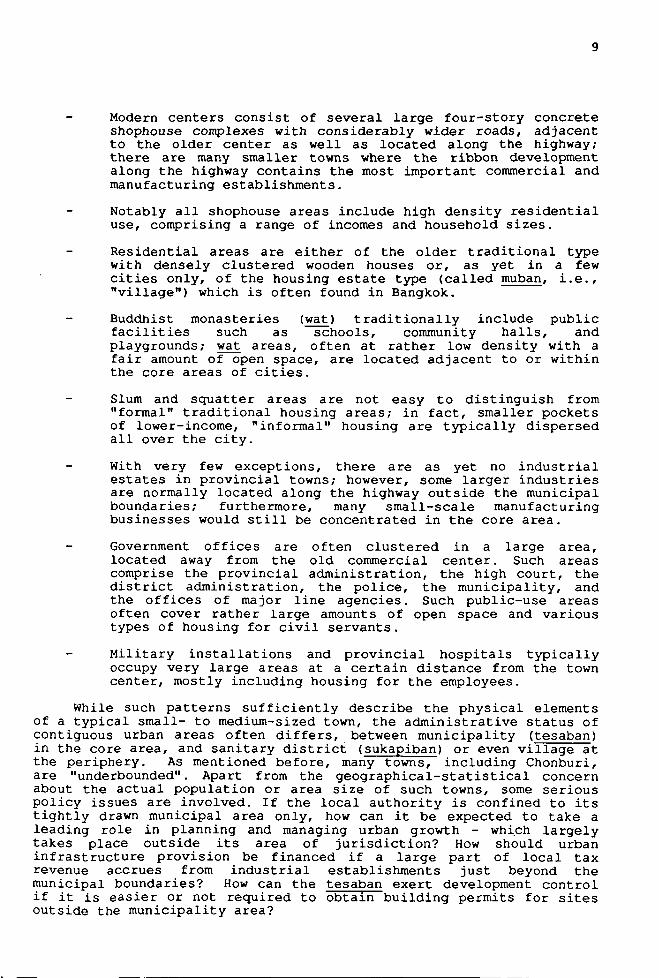
Modern centers consist of several large four-story concrete shophouse complexes with considerably wider roads, adjacent to the older center as well as located along the highway; there are many smaller towns where the ribbon development along the highway contains the most important commercial and manufacturing establishments.
Notably all shophouse areas include high density residential use, comprising a range of incomes and household sizes.
Residential areas are either of the older traditional type with densely clustered wooden houses or, as yet in a few cities only, of the housing estate type (called muban, i.e., "village") which is often found in Bangkok.
Buddhist monasteries (wat) traditionally include public facilities such as schools, community halls, and playgrounds; wat areas, often at rather low density with a fair amount of open space, are located adjacent to or within the core areas of cities.
Slum and squatter areas are not easy to distinguish from "formal" traditional housing areas; in fact, smaller pockets of lower-income, "informal" housing are typically dispersed all over the city.
With very few exceptions, there are as yet no industrial estates in provincial towns; however, some larger industries are normally located along the highway outside the municipal boundaries; furthermore, many small-scale manufacturing businesses would still be concentrated in the core area.
Government offices are often clustered in a large area, located away from the old commercial center. Such areas comprise the provincial administration, the high court, the district administration, the police, the municipality, and the offices of major line agencies. Such public-use areas often cover rather large amounts of open space and various types of housing for civil servants.
Military installations and provincial hospitals typically occupy very large areas at a certain distance from the town center, mostly including housing for the employees.
While such patterns sufficiently describe the physical elements of a typical small- to medium-sized town, the administrative status of contiguous urban areas often differs, between municipality (tesaban) in the core area, and sanitary district (sukapiban) or even village at the periphery. As mentioned before, many towns, including Chonburi, are "underbounded". Apart from the geographical-statistical concern about the actual population or area size of such towns, some serious policy issues are involved. If the local authority is confined to its tightly drawn municipal area only, how can it be expected to take a leading role in planning and managing urban growth - which largely takes place outside its area of jurisdiction? How should urban infrastructure provision be financed if a large part of local tax revenue accrues from industrial establishments just beyond the municipal boundaries? How can the tesaban exert development control if it is easier or not required to obtain building permits for sites outside the municipality area?
10
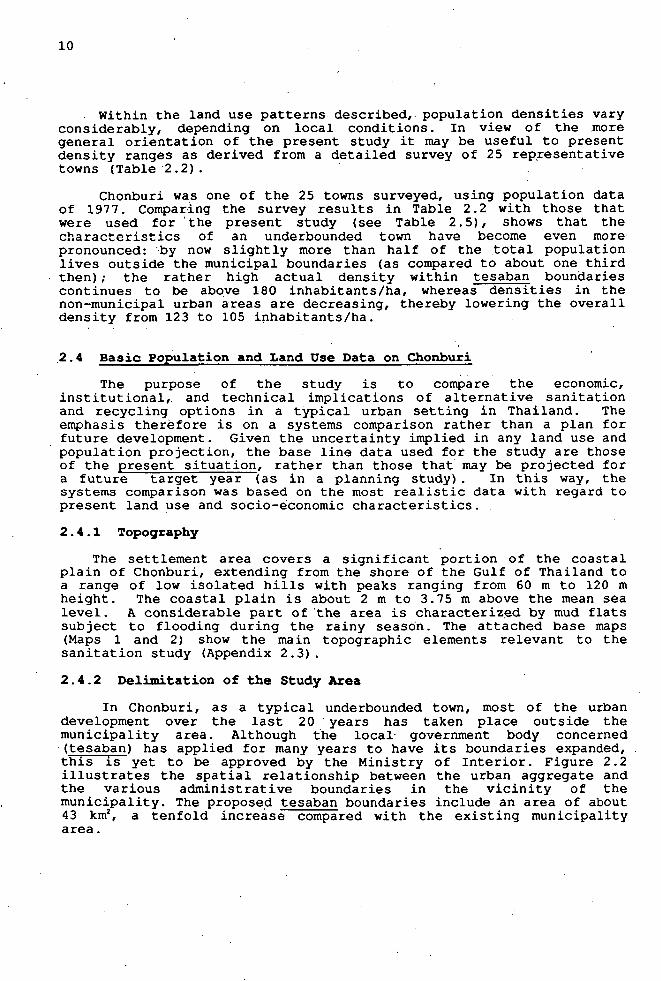
Within the land use patterns described, population densities vary considerably, depending on local conditions. In view of the more general orientation of the present study it may be useful to present density ranges as derived from a detailed survey of 25 representative towns (Table 2.2).
Chonburi was one of the 25 towns surveyed, using population data of 1977. Comparing the survey results in Table 2.2 with those that were used for the present study (see Table 2.5), shows that the characteristics of an underbounded town have become even more pronounced: by now slightly more than half of the total population lives outside the municipal boundaries (as compared to about one third then); the rather high actual density within tesaban boundaries continues to be above 180 inhabitants/ha, whereas densities in the non-municipal urban areas are decreasing, thereby lowering the overall density from 123 to 105 inhabitants/ha.
2.4 Basic Population and Land U3e Data on Chonburi
The purpose of the study is to compare the economic, institutional,, and technical implications of alternative sanitation and recycling options in a typical urban setting in Thailand. The emphasis therefore is on a systems comparison rather than a plan for future development. Given the uncertainty implied in any land use and population projection, the base line data used for the study are those of the present situation, rather than those that may be projected for a future target year (as in a planning study) . In this way, the systems comparison was based on the most realistic data with regard to present land use and socio-economic characteristics.
2.4.1 Topography
The settlement area covers a significant portion of the coastal plain of Chonburi, extending from the shore of the Gulf of Thailand to a range of low isolated hills with peaks ranging from 60 m to 120 m height. The coastal plain is about 2 m to 3.75 m above the mean sea level. A considerable part of the area is characterized by mud flats subject to flooding during the rainy season. The attached base maps (Maps 1 and 2) show the main topographic elements relevant to the sanitation study (Appendix 2.3).
2.4.2 Delimitation of the Study Area
In Chonburi, as a typical underbounded town, most of the urban development over the last 20 years has taken place outside the municipality area. Although the local government body concerned (tesaban) has applied for many years to have its boundaries expanded, this Is-yet to be approved by the Ministry of Interior. Figure 2.2 illustrates the spatial relationship between the urban aggregate and the various administrative boundaries in the vicinity of the municipality. The proposed tesaban boundaries include an area of about 43 km2, a tenfold increase compared with the existing municipality area.
11
Table 2.2 Urban Area Characteristics: 25 Small and Medium-sized Towns Compared with Chonburi
Characteristics11 Group l21 Group 2" Mean/Chonburi4'
Total urban population as ratio of tesaban population (%)
range mean
- Chonburi
Gross density (inn./ha) (within tesaban boundaries)
- range 14-184 8-28 - mean 59 19
- ChonburiS|
Actual core density (inh./ha) (urbanized area within tesaban)
- range 64-208 61-115 - mean 117 82 105
Chonburi - - 187
Actual total density (inh./ha) (total urbanized area)
- range 55-172 45-113 - mean 83 73 80
- Chonburi - - 123
1) Selected results of an air photography survey which was carried out in 1979; population data as of 31 Dec. 1977
2) 17 towns whose boundaries were not expanded after 1968 3) 8 towns whose boundaries were expanded between 1968 and 1978 4) Compare these figures (1977) with the ones used for the present
study (1983) - see section 2.4 5) Land area only, not including the 1.5 km2 of water surface
included in the tesaban boundaries
110-198 103-144 147 118 140
146
38
158
Source: KAMMEIER, 1986, p. 305
12
Gulf of Thailand
\ \
\ \
l «
,'m v.
. 2, . -nmilr*? > .56 km? ) * J W f ^
•^5A> *%. ' i
A, >' / /
Proposed Tesaban ^—•;< '
(43.50 km )
v.
/ / / /
/ / / / / / /
/ /
/ /
Town Planning Area.
(130.30 km ) ,
S /
/ J
2km
Figure 2.2 Alternative Definitions of Urban Area, Example Chonburi
13
All of the various infrastructure planning studies that have been undertaken in the last five years, use considerably larger study areas than the municipality. Among them, the land use map of the draft Structure Plan (1983), the Waste Disposal Study (1983), the Water Supply Study (1985), and the Flood Control and Drainage Study (1984/85) are to be mentioned. These studies have been taken into consideration to delimitate the present study area. The study area is delimited in such a way that information from previous studies can be transferred without major difficulties while meeting the requirement of an adequate reference area. Figure 2.3 shows the study area in comparison with those of relevant previous studies. The study area which is in fact equivalent to the proposed tesaban areas, covers approximately 4,353 ha (43.5 km2 ) of land, of which the existing municipality occupies only 300 ha. This figure differs from the official municipality area of 457 ha which covers more than 150 ha of water surface in front of the shore line. The same study area was also used in the Drainage and Flood Control Study (1985) .
2.4.3 Sources of Base Line Data
The base line data on land use areas and population distribution were mainly derived from the Water Supply Study for its relevance and suitability. Furthermore, to adapt the base line data to the objectives of the present study, the study area was divided into 33 "cells", more or less corresponding to the "zones" of the Water Supply Study, although the latter refers to a considerably larger total area, especially towards the south of Chonburi. The boundaries of cells in the municipality area have also been laid out in such a way that they tally with the municipal boundary as this will facilitate the comparative analysis between areas within and outside the municipality area (refer to Maps 1 and 2).
Table 2.3 shows a comparison between the base line data of the present study and the data from the Water Supply Study. There are eight different land use categories which are based on the Water Supply Study as well as some other considerations. For example, two new land use categories - "Agricultural" and "Residential II" - were introduced, in addition to the single "Residential" category of the Water Supply Study. The land use categories are supposed to describe the general character of the built-up area, and the predominant land utilization in a particular cell. In fact, the residential population is distributed among all categories of land use including "Commercial" in particular, because Chonburi, as all other towns and cities in Thailand, has a thoroughly mixed land use pattern.
2.4.4 Land Use Categories
The land use categories determined for the purpose of the study are:
1) Agricultural
2) Residential I
- Residential areas situated along the coastal plain (high density)
3) Residential II
- Residential areas other than the coastal plain (lower density, some areas in the process of development)
14
Source: Based on Land Use Maps by Town and Country Planning Department (1983) and Flood Control and Drainage Study (1984)
Figure 2.3 Delimitation of the Study Area
15
Table 2.3 Base Line Data in Comparison with Data from the Water Supply Study
Cell No.
1
2
3
4
5
6
7
8
9
10
11
12
13
14
15
16
17
18
19
20
21
22
23
24
25
26
27
28
29
30
31
32
33
BASE LINE DATA FOR
Land Use Category
Agricultural
Agricultural
Agricultural
Agricultural
Agricultural
Residential I
Residential I
Residential I
Residential I
Residential I
Residential II
Residential II
Residential 11
Residential II
Residential II
Residential II
Residential TT
Commercial
Corrmercial
Comnercial
Conmercial
Commercial
Mixed
Mixed
Mixed
Mixed
Mixed
Mixed
Institutional
Institutional
Industrial
TOTAL
Special
Special
GRAND TOTAL (Study Area)
Gross Area (ha)
250
350
210
60
275
26
22
33
22
44
77
173
51
96
101
264
28
6
18
38
30
25
84
20
38
67
90
151
51
161
670
3,531
648
174
4,353
THE PRESENT STUDY
Built-up Area (ha)
22
12
31
5
10
14
22
33
22
44
32
14
14
17
18
50
20
6
18
38
30
17
66
20
32
21
58
30
39
123
131
1,009
N.A.
N.A.
Net Pop. Density (pop./ha)
17
43
10
18
40
250
250
250
250
244
16
82
25
35
39
36
90
181
181
181
181
265
114
190
156
186
152
53
47
48
32
105
N.A.
N.A.
Population
370
520
310
90
400
3,500
5,500
8,250
5,500
10,750
500
1,150
350
600
700
1,800
1,780
1,100
3,300
6,900
5,400
4,500
7,500
3,800
5,000
3,900
8,800
1,600
1,850
5,850
4,200
105,770
N.A.
N.A.
Zone No.
9
3) N.A.
i) (24, 25)
1
-
-
2
7.1
7.3
7.2
7.4
7.5
7.6
6
-
--
-
4
3
3) (21)
5
8
J) N.A.
3) N.A.
1) WATER SUPPLY STUDY
Land Use Category
Residential
-
Residential
Residential
Residential
Residential
Residential
Residential
Residential
Residential
Residential
Residential
Conmercial
Mixed
Mixed
Institutional
Industrial
-
Ill 2)
250 2)
350 2)
210
2) 60
2) 275
26
121
77
173
51
96
101
264
28
117
299
2) 151
212
670
3,531
2) 648 2)
174
4,353
Gross Population Density (pop./ha)
4) 1.5
i) 1.5
4) 1.5
135
248
6.5
6.6
6.9
6.3
6.9
6.8
64
181
97
10.6
36
6.3
30
N.A.
N.A.
Population (1983)
1,200
2) 90
2) 400
3,500
30,000
500
1,150
350
600
700
1,800
1,780
21,200
29,000
2) 1,600
7,700
4,200
5) 105,770
N.A.
N.A.
1) Figures from Chonburi Water Supply Project, Vol. II, pp. 11-14 to 11-18 (Table II. 2-1).
2) Area and population figures marked by this footnote are not explicitly shown in the reference table of the Water Supply Study. However, these figures are reasonably reliable estimates.
3) Cell No. 4, 32 and 33 are not part of the Water Supply Study area, whereas Cell No. 5 and 28 of the present study include small sections of Zones 24 and 25 and a small section of Zone 21, respectively, of the Water Supply Study.
4) Implicit gross density figures.
5) Total population from Water Supply Study (103,680) plus estimated population in Cell No. 4, 5 and 28.
16
4) Commercial
5) Mixed
- Areas mixed with residential, commercial, and scattered institutional activities
6) Institutional
7) Industrial
8) Special
- Restricted government institutional areas such as military camp, police training centre etc.
The total study area for the purpose of analysis covers 3,531 ha of land and a population of 105,770. Cells 32 and 33 were not included in this total as the population data of these special areas were not available. These areas were assumed to be served by their own wastewater collection and treatment systems. They were therefore excluded from the calculations and considerations under the sanitation options.
The gross density figures used in the Water Supply Study are significant only to a limited extent for the present study. Therefore, a mapping survey had to be carried out with a focus on the built-up areas, which provide the more appropriate net density figures.
The most densely populated areas (240 to 250 persons/ha in cells 6, 7, 8, 9, 10) are located along the coastal plain with a population of 33,500. These areas fall under the "Residential I" land use category and cover 147 and 135 ha of gross and built-up area respectively. On the other hand, the least densely populated cells 1, 2, 3, 4, 5 (10 to 43 persons/ha) are located all along the Chonburi by-pass and the road to Ang Sila with a population of only 1,690. These areas fall under the "Agricultural" land use category and cover a gross area of about 1,145 ha.
The most densely populated single cell, No. 22 (265 persons/ha) is located just outside the eastern municipal boundary along Sukhumvit Road with a population of 4,500. This area falls under the "Commercial" land use category and covers 17 ha of built-up area. By comparison, the least densely populated single cell, No. 3 (10 persons/ha) is located along the Chonburi by-pass to the east of the study area, with an estimated population of only 310. This area, under the "Agricultural" land use category, covers only 31 ha of built-up areas. A detailed breakdown of all cells is shown in Table 2.3.
2.4.5 Land Use Characteristics
The municipality area and its vicinity are characterized as the core area of Chonburi where most of the residential and commercial dwellings are concentrated (4 9% of the population on 6.9% of the study area). These areas are situated along and in-between Sukhumvit and Vachiraprakarn Road and extend towards Suk Prayun and Akkaniwat Road. The rest of the area is characterized as agricultural or scattered residential with the exception of cells 30, 31, 32, and 33, where institutional, industrial and special land uses are concentrated (Map 2). The population concentration is the highest in and around the municipality area, ranging from 181 to 265 persons/ha. The structures
17
in and around the municipality area are mostly brick and concrete shophouses used both for commercial and residential purposes except in coastal areas where wooden houses on stilts are found built over tidal mud flats. A descriptive overview of the cells and their land use characteristics is shown in Table 2.4.
2.4.6 Comparison of Land Use Data between the Municipality and the Rest of the Study Area
The total study area covers a total of 4,353 ha of land, of which the municipality area occupies only 300 hectares. However, only 3,531 ha of land were taken into consideration for the purpose of analysis as population data for the remaining 822 ha of special areas were not available. Table 2.5 shows a comparative overview of land use data for the municipality and the rest of the study area.
There are altogether 10 cells which cover the municipality area. These cells lie in between Vachiraprakarn and Sukhumvit Road and extend towards the coastal plain to the west and towards Suk Prayun Road to the east of the study area (Map 2).
The overall net densities of the municipality and the rest of the study area are 184 and 74 persons/ha respectively. The population of the municipality is 51,850, roughly 49% of the total population of 105,770, indicating a high population concentration. The municipality area covers 282 ha of built-up area, which represents 27.96% of the total built-up area of 1,009 ha.
The most densely populated cells (8, 9, 10) in the municipality (248 persons/ha) have altogether 24,500 inhabitants, roughly 23% of the total population, and cover the old coastal settlement areas (Residential I). Although predominantly residential, these areas include a range of activities related to fish and food preservation as well as small workshops.
The most densely populated cells, No. 6, 7 (250 persons/ha) in the rest of the study area have altogether 9,000 inhabitants, 8.51% of the total population. These areas are located north of the municipality boundaries. Their land use character is similar to the old coastal settlement zone within the municipality. The least densely populated cells, No. 24, 25 (169 persons/ha) in the municipality have altogether 8,800 inhabitants, 8.32% of the total population. These cells fall under the "Mixed" land use category.
2.4.7 Distribution of Area and Population by Land Use Category
Among the 8 land use categories, "Residential I" occupies the highest number of inhabitants (33,500), or 31.67% of the total population of 105,770. It has a gross area of 147 and a built-up area of 135 ha, respectively. On the other hand, the least number of inhabitants (1,690) is under the "Agricultural" land use category, roughly 1.60% of the total population. This corresponds to the largest gross area (1,145 ha) but the smallest built-up area (80 ha). A detailed breakdown of area and population figures by land use category is shown in Table 2.6.
Table 2.4 Land Use Characteristics
Cell No.
1-5
6-10
11-17
18-22
23-28
29-30
31
32-33
Land Use Category
Agricultural
Residential I
Residential II
Cocrmercial
Mixed
Institutional
Industrial
Special
Description
Predominantly used as salt evaporator, rice field, vegetable and upland crop area. Negligible residential
structures.
Large portion (75%) of wooden stilt houses built over tidal mud flats except for Cell No. 6 where most of the dwellings are in permanent compounds. Inadequate infrastructure.
At present the dwellings are scattered, with a great variety of types except in Cell No. 17 where most of the.-houses are bungalow type with all the services available. Such areas are expected to be developed both by the private and public sector with various types of houses and shophouses.
Mostly concrete shophouses used both for conmercial and residential purposes; old shophouses 1-2 stories, new shophouses 2-4 stories.
Varies greatly, ranging from market gardening, commercial, residential to institutional use. Most of the dwellings are concrete shophouses especially in the areas facing Sukhumvit, Suk Prayun and Sethakit Road. Wooden structures dominate in other areas.
Most of the government and other institutions are located in these cells.
At present scattered development. The area is expected to be developed as an industrial estate, as proposed in the Eastern Seaboard Study.
These cells contain a provincial sports centre, police training centre, Chinese cemetery, military canp and highway department land.
Location
Situated along Chonburi by-pass and west of Sukhumvit Road in the northern part of Chonburi and on both sides of Sukhumvit Road in the southern part of Chonburi
To the west of Sukhumvit and Vachiraprakarn Road in the northern part of Chonburi.
To the north and south of Akkhaniwat Road and west of by-pass. Also to the west of Sukhumvit Road in the southern part of Chonburi.
Located mainly between Sukhumvit and Vachiraprakarn Road.
To the north and east of Chonburi commercial district.
To the south of Chonburi commercial district.
To the southern end of Chonburi by-pass and in the eastern part of Samet.
To the east of Sukhumvit Road and to the south of Suk Prayun Road.
Characteristic Figures
No. of Stories
1
1-2
1-2
1-2 2-4
1-2
1)
1)
2)
Net Pop. Density Range
(pop./ha)
10-43
ft
250
16-90
181-265
53-190
48
32
1) Various types of structures, number of stories not a significant characteristic.
2) Population figures not available; police training centre and military camp not accessible; therefore, no attempt at estimating extent of built-up area.
19
Table 2.5 Summary of Land Use Data (Municipality vs. Study Area)
C e l l No.
8
9
10
18
19
20
21
24
2 5
29
Land Use C a t e g o r y
R e s i d e n t i a l I
C o m r e r c i a l
Mixed
I n s t i t u t i o n a l
SUB M u n i c i p a l i t y TOTAL A r e a I :
1
2
3
4
5
6
7
11
12
13
14
15
16
17
22
23
26
27
28
30
31
A g r i c u l t u r a l
R e s i d e n t i a l I
R e s i d e n t i a l I I
C c m r e r c i a l
Mixed
I n s t i t u t i o n a l
I n d u s t r i a l
SUB A r e a s o u t s i d e TOTAL M u n i c i p a l I I : Boundary
32
33 S p e c i a l
1) GRAND TOTAL ( S t u d y A r e a )
G r o s s A r e a
A b s o l u t e (ha )
33
22
44
6
18
38
30
20
38
51
300
250
350
210
60
275
26
22
77
173
51
96
101
264
28
25
84
67
90
151
161
670
3 , 2 3 1
648
174
4 , 3 5 3
99
92
58
1,145
48
790
392
822
«
0 . 9 3
0 . 6 2
1.25
0 . 1 7
0 . 5 1
1.08
0 . 8 5
0 . 5 7
1 .08
1.44
8 . 5 0 ( 6 . 9 )
7 . 0 8
9 . 9 1
5 . 9 5
1 .70
7 . 7 9
0 . 7 4
0 . 6 2
2 . 1 8
4 . 8 9
1.44
2 . 7 2
2 . 8 6
7 . 4 8
0 . 7 9
0 . 7 1
2 . 3 8
1.90
2 . 5 5
4 . 2 8
4 . 5 6
1 8 . 9 7
9 1 . 5 0 ( 7 4 . 2 )
( 1 8 . 9 )
( 1 0 0 . 0 )
2 . 8 0
2 . 6 1
1.65
3 2 . 4 3
1.36
2 2 . 3 6
1 1 . 1 1
B u i l t - u p A r e a
A b s o l u t e (ha )
33
22
44
6
18
38
30
20
32
39
282
22
12
31
5
10
14
22
32
14
14
17
18
50
20
17
66
21
58
30
123
131
727
N.A.
N.A.
1.009
99
92
52
80
36
165
175
f
3 . 2 7
2 . 1 8
4 . 3 6
0 . 6 0
1.79
3 .77
2 . 9 7
1.98
3 . 1 7
3 .87
2 7 . 9 6
2 . 1 8
1.19
3 . 0 7
0 . 5 0
0 . 9 9
1.38
2 . 1 8
3 . 1 7
1.38
1.38
1.69
1.79
4 . 9 5
1,98
1.69
6 .54
2 . 0 8
5 . 7 5
2 . 9 7
1 2 . 1 9
1 2 . 9 9
7 2 . 0 4
-
100 .00
9 - 8 1
9 . 1 3
5 . 1 5
7 . 9 3
3 . 5 6
16 .34
17 .34
P o p u l a t i o n
A b s o l u t e ( p e r s . )
8 , 2 5 0
5 , 5 0 0
1 0 , 7 5 0
1,100
3 , 3 0 0
6 , 9 0 0
5 , 4 0 0
3 , 8 0 0
5 , 0 0 0
1,850
5 1 , 8 5 0
370
520
310
90
400
3 , 5 0 0
5 , 5 0 0
500
1,150
350
600
700
1,800
1,780
4 , 5 0 0
7 , 5 0 0
3 , 9 0 0
8 , 8 0 0
1,600
5 , 8 5 0
4 , 2 0 0
5 3 , 9 2 0
N.A.
N.A.
105 ,770
2 4 , 5 0 0
1 6 , 7 0 0
8 , 8 0 0
1 ,690
9 , 0 0 0
6 , 8 8 0
2 1 , 8 0 0
%
7 . 8 0
5 . 2 0
1 0 . 1 6
1.04
3 . 1 2
6 . 5 2
5 . 1 1
3 . 5 9
4 . 7 3
1 .75
4 9 . 0 2
0 . 3 5
0 . 4 9
0 . 2 9
0 . 0 9
0 . 3 8
3 . 3 1
5 . 2 0
0 . 4 7
1 .09
0 . 3 3
0 . 5 7
0 . 6 6
1.70
1 .68
4 . 2 5
7 . 1 0
3 . 6 9
8 . 3 2
1 .51
5 . 5 3
3 . 9 7
5 0 . 9 8
-
1 0 0 . 0 0
2 3 . 1 6
1 5 . 7 9
8 . 3 2
1.60
8 . 5 1
6 . 5 0
2 0 . 6 2
N e t P o p u l a t i o n D e n s i t y
( p o p . / h a )
250
250
244
181
181
181
181
190
156
47
184
17
43
10
18
40
250
250
16
82
25
35
39
36
90
265
114
186
152
53
48
32
74
N.A.
N.A.
105
2 4 8
181
169
2 1
250
42
125
1) Gross Area percentages in parentheses related to total study area; all other totals related to sum of subtotals I and XI, i.e., as far as figures (population, built-up area) are available.
20
Table 2.6 Area and Population.Distribution by Land Use Category
Cell No.
1-5
6-10
11-17
18-22
23-28
29-30
31
TOTAL
Land Use Category
Agricultural
Residential I
Residential II
Commercial
Mixed
Institutional
Industrial
Gross Area
Absolute % (ha)
1,145
147
790
117
450
212
67 0
3,531
32.43
4.16
22.36
.3.32
12.76
6.00
18.97
100.00
Built- up Area
Absolute % (ha)
80
135
165
109
227
162
131
1,009
7.93
13.37
16.34
10.82
22.49
16.06
12.99
100.00
Population
Absolute % (persons)
1,690
33,500
6,880
21,200
30,600
7,700
4,200
105/770
1.60
31.67
6.50
20.04
28.94
7.28
3.97
100.00
32-33 Special 822 Information not available
GRAND TOTAL 4,353 (Study Area)
REFERENCES
1. KAMMEIER, H.D. (1986), "Thailand's Small Towns: Exploring Facts and Figures Beyond the Population Statistics", in'K. HUSA et al., eds., Beitraege zur Bevoelkerungsforschung, Ferdinand Hirt Verlag, Wien, pp. 299-320.
2. KAMMEIER, H.D. and P.J. SWAN, eds. (1984), Equity with Growth? Planning Perspectives' for Small Towns in Developing Countries, Asian Institute of Technology, Bangkok.
3. MANNING, H. (1984), "Small Towns Financing: Where Does the Money Come From?" in Kammeier and Swan, eds., Equity with Growth, AIT, Bangkok, pp. 694-699.
4. SINCLAIR KNIGHT & Partners Pty Ltd. et al. (1983), on behalf of Kingdom of Thailand, Ministry of Interior, and United Nations Development Programme, Feasibility Studies for Regional Cities Development, Final Report, 5 Vols.
21
3. APPROPRIATE SANITATION TECHNOLOGY
3.1 Introductory Remarks
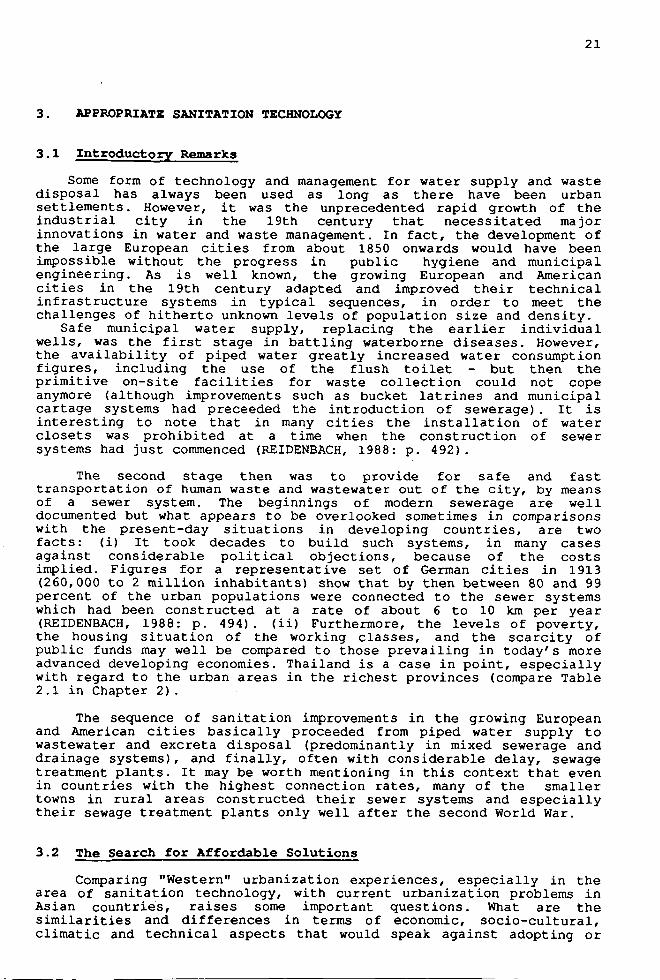
Some form of technology and management for water supply and waste disposal has always been used as long as there have been urban settlements. However, it was the unprecedented rapid growth of the industrial city in the 19th century that necessitated major innovations in water and waste management. In fact, the development of the large European cities from about 1850 onwards would have been impossible without the progress in public hygiene and municipal engineering. As is well known, the growing European and American cities in the 19th century adapted and improved their technical infrastructure systems in typical sequences, in order to meet the challenges of hitherto unknown levels of population size and density.
Safe municipal water supply, replacing the earlier individual wells, was the first stage in battling waterborne diseases. However, the availability of piped water greatly increased water consumption figures, including the use of the flush toilet - but then the primitive on-site facilities for waste collection could not cope anymore (although improvements such as bucket latrines and municipal cartage systems had preceeded the introduction of sewerage). It is interesting to note that in many cities the installation of water closets was prohibited at a time when the construction of sewer systems had just commenced (REIDENBACH, 1988: p. 492).
The second stage then was to provide for safe and fast transportation of human waste and wastewater out of the city, by means of a sewer system. The beginnings of modern sewerage are well documented but what appears to be overlooked sometimes in comparisons with the present-day situations in developing countries, are two facts: (i) It took decades to build such systems, in many cases against considerable political objections, because of the costs implied. Figures for a representative set of German cities in 1913 (260,000 to 2 million inhabitants) show that by then between 80 and 99 percent of the urban populations were connected to the sewer systems which had been constructed at a rate of about 6 to 10 km per year (REIDENBACH, 1988: p. 494) . (ii) Furthermore, the levels of poverty, the housing situation of the working classes, and the scarcity of public funds may well be compared to those prevailing in today's more advanced developing economies. Thailand is a case in point, especially with regard to the urban areas in the richest provinces (compare Table 2.1 in Chapter 2).
The sequence of sanitation improvements in the growing European and American cities basically proceeded from piped water supply to wastewater and excreta disposal (predominantly in mixed sewerage and drainage systems), and finally, often with considerable delay, sewage treatment plants. It may be worth mentioning in this context that even in countries with the highest connection rates, many of the smaller towns in rural areas constructed their sewer systems and especially their sewage treatment plants only well after the second World War.
3.2 The Search for Affordable Solutions
Comparing "Western" urbanization experiences, especially in the area of sanitation technology, with current urbanization problems in Asian countries, raises some important questions. What are the similarities and differences in terms of economic, socio-cultural, climatic and technical aspects that would speak against adopting or
22
adapting the sanitation technology of industrialized countries? In this respect, it is worth mentioning the considerable differences between the conventional "Western" solution of the sewer network, and the prevailing Japanese system of night-soil collection by vacuum truck. The arguments brought forward against sewerage as the standard solution are (after KALBERMATTEN et al., 1980, as well as RYBCZYNSKI et al., 1978), briefly summarized:
The magnitude and speed of present urban growth in Asia is so much greater than that in Europe and North America in the past, that the two situations cannot really be compared;
The financial resources will hardly ever be sufficient to cover sewerage as the standard solution;
In view of the fecally transmitted diseases due to heat and humidity, the prime purpose of sanitation in a tropical climate must be pathogen destruction, with eventually even higher priority than in temperate regions;
Periodic or permanent water shortages in many tropical countries are a severe obstacle to waterborne waste-disposal systems; and, finally,
There are alternative technologies available that provide socially acceptable, technically sound and economically viable sanitation services.
It is further argued that conventional sewerage still provides the best and indeed the only viable solution to the sanitation problem of high-density, modernized ("Westernized") parts of the city. However, a range of less costly, more flexible and thus, more "appropriate", technologies can be applied, although many of them were already available when the now industrialized countries adopted the sewer system.
The documentation and research project which was carried out by the World Bank in 1976-1978 has been widely publicized. Its results indeed provide invaluable guidance to policymakers and sanitary engineers whose education may have left them with an unrealistic bias in favour of conventional sewerage, and, on the other hand, not enough knowledge about possible alternatives. To be mentioned in the context of the World Bank sanitation reports are the IDRC-supported documentation efforts, the comparative economic data, the proposed comprehensive methodology for community-based sanitation planning, and the sanitation field manual' (based on the experiences from slum improvement projects in Jakarta).
The World Bank reports clearly show that there is considerable scope for effective as well as affordable improvements, especially at the lower end of the technology range, reviewed with regard to improved on-site facilities. Similarly, at the upper end of the scale, the innovative system of small-diameter sewers has been propagated as a cost-effective alternative to conventional sewerage. One of the most important recommendations arising from the World Bank research results is to plan and implement sanitation systems incrementally. This implies careful analyses of needs and specific objectives, constraints and opportunities, the scope for community participation or self-help, and the potential for waste recycling. Table 3.1 provides a descriptive overview of the three basic classes of sanitation systems that are assessed under various broad criteria of feasibility and appropriateness.
23
Table 3.1 A Summary of the Significant Characteristics of the Three Classes of Sanitation Systems
Waterborne Cartage On-site
Capital cost High High/low Low Operating cost Low High Low Offshore cost component High High/low Nil
Water consumption High Low/nil Low/nil
Optimal density High density High density High and low density (high rise) (low rise) (low rise)
Adaptability to incre- Nil High High mental implementation
Adaptability to self- Nil Low High help
Reuse potential High High High/low
Source: RYBCZYNSKI, POLPRASERT and MCGARRY (1978)
3.3 Sanitation Program Planning and Technology Selection
Proper sanitation is both an indispensible requirement of public health and an extremely costly element of the technical infrastructure of urban areas. Given the very wide range of local conditions, it is difficult to provide a cost framework for sanitation in comparison with other elements of infrastructure. Based on European data about 1970, the following proportional figures may serve as first approximation for comparative purposes:
(a) Index of basic infrastructure costs per inhabitant (based on BORCHARD, 1974):
(b) Index of average costs of utility networks (per m) (based on GASSNER, 1982: p. 198):
electricity: 40 - gas: 70 - water supply: 100
sewer: 175 (not including sewage treatment)
Even though such figures may be of limited value in the context of a study on urban sanitation in Thailand, the comparison shows that it is obviously necessary to search for every possibility for lowering especially the high costs of the most important infrastructure components, i.e. roads and wastewater disposal. The World Bank research results (KALBERMATTEN et al., 1980) provided the useful measure of TACH (total annual cost per household) as a tool for system comparisons. TACH figures cover all on-site and system investment costs as well as recurrent costs for collection and treatment. In 1978
24
figures, there were three distinctly different cost groups' among the 10 sanitation technologies analyzed:
low cost: range .18.7 - 64.9 US$ (a.o., pour-flush toilet, composting toilet, bucket cartage) medium cost: range 159.2 - 187.7 US$ (sewered aquaprivy, aquaprivy, Japanese vacuum truck) high cost: range 369.2 - 400.3 US$ (septic tank, sewerage)
Such cost comparisons must be read cautiously, because the underlying data may have been taken from areas of very different densities, apart from the specific economic conditions of different countries. The extremely high figure for conventional sewerage may have been influenced by case study data from low-density residential areas. Nevertheless, it. is very difficult indeed to obtain reasonably reliable comparative cost figures from other sources.
An important result of the World Bank research documentation is the demonstrable effect of "sanitation sequences" on cost reduction. Planned step-by-step implementation of sanitation programs over periods of 20 years would bring the total economic cost per household within an affordable range, while the respective initial stage of basic sanitation provision meets the basic requirements without exceeding the economic capacity of the household or the community.
Apart from its emphasis on sanitation sequences, the World Bank research reports elaborate the need to cover a wide scope of socio-economic and behavioural concerns, apart from the necessary steps of technical feasibility studies. Sanitation program planning as described by KALBERMATTEN et al. (1980) includes a carefully prepared approach to technology selection, as illustrated in Figures 3.1 - 3.3. Using such an approach in addition to the available background data on Chonburi, would provide the logic for a reasonable short list of alternatives to be considered in the framework of the present study.
3.4 The Ca3e Study Options
Although a review of the recent literature on appropriate sanitation technology provides an almost bewildering range of technical and operating data, the systems can be classified (i) into household and communal systems, depending on where the treatment of the waste materials (excrements and sullage) takes place; (ii) into dry and wet systems with on-site or off-site collection and treatment. The generic classification in Figure 3.4 shows, in relation to the conditions typical for urban areas in' Thailand, that a large number of solutions must be excluded from the outset, on the grounds of social acceptability. In comparison with the many options reviewed in the World Bank research, the present conditions in Chonburi indicate a rather high level of service, i.e. piped water and individual pour flush toilets for most households. Thus the range of alternatives to be considered must constitute genuine improvements for the users while providing higher levels of public health protection. As the greatest problems are associated with high-density areas and adverse ground water conditions, the range of alternatives was reduced essentially to septic tanks and various configurations of conventional or small-bore sewer systems. Applying the sanitation sequence approach to some of the less developedmedium-sized cities in Thailand, may in fact result in a different set of recommendations, because the existing conditions may be poorer.
25
Stan
I Are there water taps
served*
•
Yes
Are there strong social of environmental reasons that preclude the use of conventional sewerage?
No
•
I i the soil sufficiently permeable for on-site disposal of septic tank effluent'
Yes
Are the plot sizes large enough for septic tanks and soakaways?
Yei
No
Yei
No s J
No
Is the wastewater flow greater than
50 titers per capita daily?
Yes
Is there a strong social preference to reuse excreta?
1 No
Are sewered pour-flush toilets afford-able"1
, , Yes
Can water consumption be reduced so that on-site disposal of septic tank effluent is possible*
Yes
No
Yes
No
No
No
Go to second-stage algorithm and make
suitable arrangements for sullage disposal
Sewered
r
.
"\
Are Jewers
affordable?
No
Are septic tanks with soakaways
conven sewerar.
ional e>
Yes
toilets
Yes
No
Are septic tanks aff ordabie ?
Y e s Septic tanks and soakaway
Source: KALBERMATTEN et al. (1980)
Figure 3.1 First-Stage Algorithm for Selection of Sanitation Technology
Slart
1 Is thi;re an assumed use for compost or stabilised humus by household or otheis?
•
No
Yes Is reuse of liquid preferred over use of composted excreta?
No
•
Is sufficient organic waste material or ash available?
No
•
Are ventilated' improved double-pit latrines affordable?
' No
Yes
Yes
Yes
Is sufficient water available lor pour-flush toilet?
No
Can double-vault composting toilets be expected to be well maintained?
No • '
Yes
Yes
Are three-stage septic tanks affordable''
No
Are double-vault composting toilets affordable?
No
e
Yes Three-stage septic tanks
Yes Oouble-valult •composting
toilets
Ventilated improved double-pit latrine
Go to third-stage algorithm
Source: KALBERMATTEN et al. (1980)
Figure 3.2 Second-Stage Algorithm for Selection of Sanitation Technology
Sl8M
AM? plot st/es lnr(ie enouyh for two al Utrnnnnq pit sites-
N o
ts there sufficient Miner lor a permanent double-pit system with ;i imiiiinum ol 1 yeai storaiji: per vault?
Yes
No
Is there either a niunicip.il or private system lor emptymtj latrines?
Is walcr table inure than 1 meter below {(round sin luce?
Yi:s
No
Can tatrtne level he raised7
ts sudirieni water available lor (jour (lush toilets'
Yes
Is soil sufficiently permeable?
Yes
Arc local anal cleansing maiotials suitable for use with pour Hush toilets?
I I I 1. Overhung latrine 2. Trench latrine 3. Pit latrine 4. Reed Odorless
Earth Closet 5. Ventilated improved
pit latrine 6. Batch composting
latrine 7. Continuous
composting latrine
10.
11.
12.
13.
Pour flush latrine, soakaway Pour flush latrine, aquaprivy, soakaway Pour flush, septic tank, vault Sullage flush, aquaprivy, soakaway Sullage flush, septic tank, soakaway Conventional septic tank
Off-site
I Wet I
I I I 17. Conventional 18.
sewerage 19.
20. 21.
I Dry I
On-site or Off-site
Wet
I I 14. Low-volume cistern-flush,
soakaway, or sewer 15. Low-volume cistern-flush,
aquaprivy, soakaway, or sewer
16. Low-volume cistern-flush, septic tank, soakaway, or sewer
I Vault and vacuum tank Vault, manual removal, truck, or cart Bucket latrine Mechanical bucket latrine
Source: KALBERMATTEN et al. (1980)
Figure 3.4 Generic Classification of Sanitation Systems
29
Apart from that, it was considered to be essential to assess the scope for alternative recycling possibilities, especially biogas production and fish cultivation.
The approach was divided into two steps:
(i) discussing and evaluating principal alternatives within the fields of on-site treatment, sewer networks, sewage and septage treatment, and recycling; and
(ii) establishing four exemplary options to be evaluated in greater detail, in terms of their technical, economic and institutional implications.
Table 3.2 shows an overview of the alternatives for preliminary technical and economic assessment; these are discussed within Chapters 4,5 and 6.
As shown in Chapter 2, the very different topographic and land use conditions, especially the densities, require different solutions to be technically and economically sound. Therefore, three of the four options consist of combinations of septic tanks and sewer systems whereas only the fourth option is exclusively based on the assumption of on-site facilities. Table 3.3 provides a synopsis of the four patterns that are referred to as
Maximum Sewerage Option,
Minimum Sewerage Option,
Small-bore Sewerage Option, and
Septic Tank Option.
For reasons of consistency, all four options were laid out in such a way that the level of service would be identical, thus avoiding the difficulty of comparing and quantifying the different benefits (health and user convenience, for example) within the systems options. Another simplifying assumption was to have the four systems installed as described, without explicitly evaluating intermediate phases of implementation. One may, however, think of the limited sewer network in the Minimum Sewerage Option, as an early stage of a more complete sewer network, such as the one in the Maximum Sewerage Option.
The systematic order of the study was thus hoped to allow sufficiently detailed calculations as to the per-household costs in areas of different densities, as well as the possibilities for partial cost recovery by means of aquaculture.
30
Table 3.2 Technical Alternatives. Selected for Preliminary Assessment
System Component
Alternatives Considered
Remark
In-house facilities Pour-flush toilet
On-site Treatment
Sewerage
Sludge Cartage
Treatment
(a) Sewage
(b) Septage
Recycling
Two-compartment septic tank (households)
Three-compartment septic tank (institutions)
Various configurations of conventional sewer network
Small-bore sewer network with interceptor tanks, either by using existing on-site facilities, or new tanks
Anaerobic digestion (biogas)/facultative pond/sludge drying bed
Stabilization ponds
- Biogas production
No alternatives considered, but increasing use of cistern-flush toilet implied in water consumption figure
No alternatives such as lower-cost aquaprivy and •vault systems considered
No alternatives considered
Adopted for further analysis: stabilization ponds
Adopted for further analysis: stabilization ponds
- Aquaculture, using Adopted for further different procedures analysis
Table 3.3 Synopsis of the Four Options Selected for Economic Evaluation
Option System Component
Collection
Households (%) Institutions(%)
Distribution
Treatment (2-sector plant for sewage and septage/siudge treatment)
Recycling
I Maximum Sewerage
Option
(a) Sewer*)
84.0 92.5
Larger Convent. Sewer Network
V
Stabilization Ponds: - Anaerobic P. - Facultat. P . - Maturation P.
Aquaculture (Maturation P.)
(b) Septic Tank
16.0 7.5
Sludge Cartage
V
Stabilization Ponds: - Anaerobic P. - Facultat. P.
(Fertilizer)
II Minimum Sewerage
Option
(a) Sewer
35.9 2.2
Limited Convent. Sewer Network
V
Stabiliz. P.
(Sewage)
Aquaculture
(b) Septic Tank
64.1 97.8
Sludge Cartage
V
Stabiliz. P.
(Septage)
(Fertilizer)
III Small Bore Sewerage
Option
(a) Sewer
84.0 92.5
Small-bore Sewer Network (liquids)
Sludge —
Cartage (Interceptor Tanks) _
Stabiliz. P.
(Sewage)
Aquaculture
(b) Septic Tank
16.0 7.5
Sludge Cartage
V
Stabiliz. P.
(Septage)
(Fertilizer)
IV Septic Tank Option
100 100
Sludge Cartage
Stabiliz. Ponds
(Septage)
(Fertilizer)
') In options I, II, and III different percentages of all households and Institutional users are connected to a sewer system, and the balance is served by individual septic tanks
OJ
32
REFERENCES
1. BORCHARD, K. (1974), Orientierungswerte fuer die staedtebauliche Planung, Dt. Akad. f. Staedtebau u. Landespl., Munich, Germany
2. GASSNER, E. (1982), "Bauleitplanung und Kanalisation", Chapter 10 in Lehr-und Handbuch der Abwassertechnik, Vol. 1, Ernst & Sohn, Munich, Germany
3. KALBERMATTEN, J.M., S.J. DeAnne and C.G. GUNNERSON (1980), Appropriate Technology for Water Supply and Sanitation, A Summary of Technical and Economic Options, World Bank, Washington, D.C.
4. REIDENBACH, M. (1988) "Aus den Augen aus dem Sinn? Zur Erhaltung der staedtischen Kanalisation", Stadtbauwelt No. 97, pp. 492-495
5. RYBCZYNSKI, W., C. POLPRASERT and M. MCGARRY (1978), Low-Cost Technology Options for Sanitation, IDRC, Ottawa, Ont.
33
4. SEWERAGE SYSTEMS
4.1 Design Criteria
The design criteria underlying the design of a sewerage system considerably influence the operational conditions and cost of the system. This becomes apparent, for instance, when comparing the cost of conventional against small bore sewerage. The cost saving and other benefits of small bore sewerage result primarily from its design criteria as differentiated from those for a conventional system. Any comparison between different sewerage systems, or even individual designs for a system of the same type, must therefore take into account the underlying design criteria.
To facilitate the interpretation of the results of this study, respective design criteria are briefly explained. This discussion, is primarily related to parameters for which a wider range of values is in common use and reference is made to literature and locally used values as well.
Sewerage systems in developing countries usually operate under more restrictive conditions compared to those functioning in industrialized countries. For example, financial constraints frequently hinder the acquisition of expensive maintenance equipment. This restrictive situation in developing countries has been taken into account in setting forth the design criteria for this study of alternative sewerage systems. Consequently, rather conservative values have been adopted.
4.1.1 Design Criteria for Conventional Sewers
4.1.1.1 Minimum Slope
METCALF and EDDY (1981) have mentioned that the minimum practicable slope for construction is about 0.8 m/km. However, other sources frequently cite 1 m/km as the minimum value for this parameter. Since the minimum diameter for conventional main sewers adopted in this study is only 300 mm, the minimum slope used here for main sewer design is 1 m/km. METCALF and EDDY (1981) have also suggested that the minimum slopes for gravity flow sanitary sewers of various pipe diameters be based on Manning's equation (n = 0.013), with a minimum velocity of 0.6 m/s. Accordingly, for a 200 mm diameter pipe, the minimum slope suggested is 3.3 m/km, while for a 300 mm diameter pipe, the minimum slope suggested is 1.9 m/km. These values were adopted for checking the depths of some critical lateral sewers, particularly at their point of discharge into the main sewer system. (See also the following paragraph.) House connection pipes are laid at a minimum slope of 20 m/km.
4.1.1.2 Minimum Cover
Whereas it is required that the sewer pipes be protected from damaging activities on the ground, sufficient depth must also be provided for the connection of laterals and for house connections. However, an increase in the minimum depth of ground cover would entail a higher excavation cost. To determine the minimum ground cover for the sewer pipes in this study, the following approach was adopted: Main sewers were designed with a minimum cover depth of 2 m. Then, from the layout plan of the lateral sewer system in representative areas, some critical sewers were selected. Using a minimum cover depth of 1.5 m above the crown of these critical sewers and adopting the
34
slopes mentioned in the previous sub-section, the resulting sewer invert elevation level downstream (critical point) was calculated. This value was compared with the actual main sewer invert elevation at the critical point, as determined by the assumption of a minimum cover depth of 2 m for the main sewers. The minimum cover depth of 2 m for main sewers and 1.5 m for laterals proved sufficient, but less cover depth would make the connection of several laterals and houses in some distance of roads critical. The abovementioned values were, therefore, adopted as the minimum cover depth for conventional sewerage.
4.1.1.3 Maximum Excavation Depth
Previous soil investigations, including shallow and deep borings, for the drainage and flood control project in Chonburi revealed that the ground water table lies near the ground surface (with a difference of less than 2 m) in most places in the study area (TISTR, 1985) . Moreover, an earlier study mentioned that shallow wells in the project area usually have water in them at depths of 1 to 1.5 m below ground level, though water levels drop from 2 to 3 m during the dry season (SEATEC International, 1983). These findings imply that the major portion of the proposed sewer network has to be placed below the indicated ground water table. This will require not only higher expenditures for construction and maintenance but also a high standard of construction and workmanship. Considering this, the maximum allowable depth of the sewer invert level below the ground level was limited to 5 m. An exception was made only with regard to the inlet section of the treatment plant in keeping a maximum invert depth of 6.3 m for the Maximum Sewerage Option. In this way, an additional pumping station would be avoided.
4.1.1.4 Hydraulic Design Equation
The Manning equation with the value of 0.013 for the roughness coefficient (n) was used for hydraulic design.
4.1.1.5 Minimum and Maximum Flow Velocity
The main criteria for the minimum velocity of flow in a conduit are the self-cleaning capacity and the prevention of extensive sulphide generation. Most commonly, values between 0.4 to 0.6 m/s for this parameter are suggested. In this study/ the minimum flow velocity for conventional sewer pipes was taken as 0.5 m/s, at partial flow conditions. A maximum flow velocity of 3.0 m/s was considered here.
4.1.1.6 Wastewater Peak Factor
Peak factors of 2.5 for the design of main sewers and 3.0 for the design of lateral sewers were considered as the respective average values for residential, commercial, institutional, and industrial wastewater sources.
4.1.1.7 Wastewater Quantities and Infiltration Allowance
The wastewater discharge from domestic areas was taken as 120 l/(c.d). This figure was based on the reports by Kocks Consult-TPEC (1985) and by SEATEC International (1983). The latter report stated that a calculation of the per capita water consumption based on 1981 figures of water supply gives consumption figures of 108 to 150 l/(c.d) in the municipal area of Chonburi. In this study, 80% of 150 l/(c.d) was taken as the wastewater discharge from domestic sources. For other sources such as commercial, institutional, and industrial activities, data were taken from the list of major customers of the
35
Chonburi water supply system in the same SEATEC Report. An additional 0.1 l/(s.ha) was provided for minor commercial and institutional sources, distributed over the land use categories commercial, institutional, and mixed uses. Table 4.1 presents the total daily average flow rates for the study area.
Table 4.1 Summary of Daily Flow Rates
Served Served Cell Land use Built-up Pop. Major Domestic Conun./ Max. Min. no. category area sources Inst. Sewerage Sewerage
Infiltration/inflow into sewers is dependent on the quality of sewers and building connections, maintenance, and the ground water level with reference to the level of sewers. In the case of the latter factor, the presence of a high ground water table causes considerable leakage into the sewers. Other factors influencing the rate and quantity of infiltration/inflow are the length of the sewers, the area sewered, soil and topographical conditions, .and, to some extent, the population density which affects the number and total length of house connections. Design recommendations for the peak inlow/infiltration rate in sewers differ widely. For the design of wastewater pipes of a separate system, literature recommends values ranging from 0.05 to 1.5 l/(s.ha) for inflow/infiltration rates. Other sources recommend a percentage addition to the basic flow rates. Considering the high ground water table as well as the soil and topographical conditions in the study area, a peak infiltration/inflow allowance of 100% of the basic wastewater flow rate from all sources was used here for conventional sewerage. This value is equivalent to about 0.3 l/(s.ha).
36
4.1.1.8 Manhole Spacing
METCALF and EDDY (1981) have recommended that manholes for smaller sewers of 600 mm diameter and less should be placed at intervals not greater than 100 m. For sewers 700 mm to 1200 mm in diameter, the maximum manhole spacing should be 120 m. But the length between two manholes should not exceed the length of sewers that can be cleaned with the equipment expected to be used. Based on present experience and the fact that cleaning of sewers is mainly undertaken manually, manhole spacing was taken as 25 m for pipes having diameters 500 mm or less and 30 m for pipes of larger diameters.
4.1.2 Design Criteria for Small Bore Sewers
4.1.2.1 Minimum Slope
According to OTIS and MARA (1985), since small bore sewers are designed to collect only the liquid portion of wastewater, the maintenance of strict sewer gradients to ensure minimum self-cleaning velocities is not necessary. Nevertheless, the design of small bore sewers must ensure that sufficient headloss - an overall net fall from the inlet to the outlet - is provided across the system and also that the hydraulic grade line during estimated peak flows does not rise above the outlet of any intercepter tank. "High points where the flow changes from pressure flow to open channel flow and points at the end of long flat sections are critical locations, where the maximum elevation must be established above which the sewer pipe cannot rise."
Considering high flow rates, which require diameters for sewer pipes of up to 1 m, and the eventual effects of backwater or operational disturbances in the main sewers, a more restrictive requirement was set for the minimum slope of main sewers than that for laterals. No inflections were allowed for main sewers, meaning a positive slope is maintained at all sections. This did not influence the hydraulic design since the minimum velocity turned out to be the more restrictive parameter.
4.1.2.2 Minimum Cover
OTIS and MARA (1985) have cited locations in Australia where the minimum cover provided is 1 m. For small bore sewerage in this study, a minimum ground cover of 1.5 m, 1 m, and 0.5 m for main sewers, laterals, and house connections respectively were used.
4.1.2.3 Maximum Depth
As with conventional sewerage, a maximum excavation depth of 5 m was adopted for small bore sewerage.
4.1.2.4 Hydraulic Design Equation
The Manning equation with n = 0.013 was used for small bore sewerage, as for the conventional system.
37
4.1.2.5 Minimum and Maximum Flow Velocity
Since the small bore sewers are to carry solely interceptor tank effluents and no coarse solids, the minimum velocity required can be lower than that for conventional sewers. A value of 0.3 m/s for the minimum flow velocity, which OTIS and MARA (1985) cited as the value adopted in practice in the USA, was taken. For the maximum flow velocity, a value of 3 m/s, as for conventional sewerage, was taken.
4.1.2.6 Wastewater Peak Factor
OTIS and MARA (1985) have noted that there are very few field data on the magnitude of peak flows in small bore sewers. A peak factor of 1.2 to 1.3 in a system in Westboro, Wisconsin, USA and a design peak factor of 3 in South Australian small bore sewer schemes have been cited. For the small bore sewer system in this study, a design peak factor of 2 for the main sewers was taken, as suggested by OTIS and MARA (1985) in the absence of sufficient field data. A factor of 3 for laterals was adopted.
4.1.2.7 Wastewater Quantities and Infiltration Allowance
The average wastewater discharge quantities from residential, commercial, and institutional sources are presented in Table 4.1. The infiltration allowance in the case of small bore sewers can be less than in the case of conventional sewers as the pipe material for a large part of the small bore sewer network is PVC since smaller diameters are used. Accordingly, a peak infiltration/inflow allowance of 50% of the basic wastewater flow rates from all sources was considered.
4.1.2.8 Cleanouts and Manholes
Cleanouts and manholes are points of access through which sewers are cleaned and maintained. OTIS and MARA (1985) have recommended that cleanouts be used in place of manholes except at major junctions. A manhole spacing of 245 m on straight flat sections is adopted in South Astralian small bore sewer schemes. For the main sewer of the small bore sewer system in this study, the manhole spacing used were 40 m for pipe diameters 300 mm or less and 50 m for pipe diameters greater than 300 mm. For the lateral sewer system, the manhole spacing considered was 150 m. Simple cleanouts in the lateral sewer system, installed after every 25 m of sewer length, enable the necessary flushing of the sewers with water. Cleanouts as replacement for manholes were not adopted in the main sewer system for greater reliability. This seems appropriate since current experience with small bore sewerage is based on a rather small system only, whereas the failure of main sewers of a larger system would affect larger parts of the town.
Design criteria for both conventional and small bore sewer systems are summarized in Table 4.2.
38
Table 4.2 Summary of Design Criteria for Sewers
Design parameter Conventional sewer Small bore sewer
Minimum slope main sewers: lateral sewers: 300 mm dia. 200 mm dia.
Minimum cover main sewers: lateral sewers: house connections:
Maximum excavation depth Manning's coefficient Minimum velocity Maximum velocity W/W peak factor
main sewers lateral sewers
1
1 3
2 1 1
5 0 0 3
2 3
0 m/km
9 m/km 3 m/km
0 m 5 m .0 m
0' m 013 5 m/s .0 m/s
.5
.0
Infiltration allowance
Minimum diameter
Cleanouts spacing laterals
Life time
100 %
mam sewers lateral sewers house connections
Manhole spacing dia. < 500 mm dia. > 500 mm dia. < 300 mm dia. > 300 mm lateral sewers
300 200 100
25 30 ---
mm mm mm
m m
30 years
>0 m/km
1 1 0
5 0 0 3
2 3
5 0 •5
.0
m m m
m .013 .3 .0
.0
.0
m/s m/s
50%
200 mm 150 mm 75 mm
40 m 50 m 150 m
25 m 30 years
4.1.3 Design Criteria for Pumping Stations
Pumping stations were placed where all alternative sewer layouts caused the sewer invert level to fall more than 5 m below the ground level.
The volume of the pump sump necessary at a pumping station was determined using equation (4.1).
V - 0.9 x Q/z
where V is the volume of the sump in mJ
Q = peak flow rate in 1/s
z = number.of pumping cycles per hour (assumed as 10)
(4.1)
39
The installed power of the pump in the pumping stations was calculated using equation (4.2) with a safety factor of 1.25.
N =• 1.25 (9.81 x 10"' x Q x H)/u (4.2)
where N «= installed power of the pump in kW
Q = peak flow rate in 1/s
H = head provided in m
u = pump efficiency (assumed as 0.7)
The power consumption by the pumps was calculated by equation (4.3) .
P = (9.81 x 10° x Q x H x 24 x 365)/p (4.3)
where P = power consumed in kWh/a
Q - daily average flow rate in 1/s
H = head provided in m
u = pump efficiency (assumed as 0.7)
The lifetime of pumps and electro-mechanical equipment is assumed to be 10 years.
4.2 Unit Coats and Cost Evaluation Procedures
4.2.1 General Procedures for Cost Estimates
Establishing the cost functions needed to compare the various alternatives for sewerage systems was marked by some difficulties, as in obtaining complete and reliable cost data for the various options in consideration. It was not possible to obtain a complete set of unit costs from any single source. Hence, some unit costs were obtained from local sources, e.g. the municipality or local contractors. Also, other unit costs were taken from related studies and from other locations. As far as possible, the unit costs obtained from various sources were compared and checked against standard designs. In obtaining unit costs from local sources, another problem, which may be frequent in countries with limited experience in the construction of sewer systems, became apparent. In some cases, the unit costs obtained from local sources were surprisingly low and considerably lower than costs obtained from other sources. Field surveys of sewers under construction in local areas revealed that poor or substandard workmanship and materials were positively related to extraordinarily low unit costs. Considering this, unit costs obtained from local sources were adjusted, when deemed necessary, to reflect levels at par with appropriate standards of workmanship and construction.
Unit costs of pipe materials and pipe laying were worked out for a range of diameters of pipes laid at various depths. Cost functions for sewers, depending on diameter and depth, were then established through regression analysis. Manholes of specified standard dimensions were considered for use depending on the pipe diameter and depth. Manhole costs obtained from various sources were compared with those estimated from standard designs as well as related material and construction cost.
40
s
The cost of pumping stations was derived from the construction cost of the pumping station and the cost of the pump and its accessories, including installation. The costs of pumping stations of varying capacities were estimated from unit material and construction costs. Using these costs, a function relating the pumping station costs to the pump sump volume was determined. The unit costs of pumps and accessories including installation were obtained from various manufacturers or their representatives in Bangkok.
As customary in Thailand, the basic unit cost does not include costs of contingencies, operation, profit, and taxes. The final total cost is derived by multiplying the basic cost by a proportion of the cost according to the scale of the project. A rate of 40% was assumed in this study. This rate allows the subdivision of the project into a number of independent lots.
The annual operational and maintenance cost of sewers was taken as a percentage of the total construction cost. The annual operation and maintenance cost for pumping consists of the annual energy and maintenance cost of pumps. The energy cost was derived by using the prevailing rate per kWh while the maintenance cost of pumps was taken as a percentage of the energy cost.
4.2.2 Construction of Sewers
PVC pipes were selected for use for all required sewer pipes of diameters 200 mm or lower. Inspite of higher unit material costs compared to other pipes, PVC pipes offer a number of advantages. The advantages of using PVC pipes with respect to operation and maintenance include corrosion resistance, high impact strength, less infiltration, and less sedimentation. Since sewer cleaning is done manually and the majority of sewer pipes in the lateral system have a diameter of 200 mm, the increased operational reliability arising from the use of PVC pipes justifies the slightly higher final construction cost. The lateral small bore sewers shall be PVC pipes only. For all pipe diameters greater than 200 mm reinforced concrete pipes shall be used.
Table 4.3 presents the unit costs of pipe materials, pipe laying, and civil works for pipe installation, as derived from TISTR (1986), and information from consultants, the Bangkok municipality, and local sources. All cost figures are given at the 1986 price levels. These unit costs were compared and assessed in order to establish the values adopted for the present study. The unit costs of pipe material and installation - but excluding those of excavation, backfilling, and manholes - for various pipe diameters are illustrated in Figure 4.1. A linear regression analysis of these cost values, including the unit costs of trenching and backfilling, was used in developing cost functions depending on the pipe diameter and invert depth. With a trench width of 1 m for D 400 ram and D + 0.7 m for D > 400 mm, the following cost functions were developed.
41
Table 4.3 Unit Costs of Pipe Materials andlnstallation from Different Sources in Bant
No. Description Unit Various sources (1986 price level)
Present study Nos. 2+3+4
1
2
3
4.1
4.2
4.3
4.4
4.5
4.6
4.7
4.8
4.9
4.10
Excavation and backfill
Bedding
Surface repair
75 mm dia. materials pipe laying
100 mm dia. materials pipe laying
150 mm dia. materials pipe laying
200 mm dia. materials pipe laying
300 mm dia. materials pipe laying
400 mm dia. materials pipe laying
500 mm dia. materials pipe laying
600 mm dia. materials pipe laying
700 mm dia. material pipe laying
800 mm dia. material pipe laying
m3
m2
m2
m m m
m m
m m m
m m m
m m m
m m m
m m m
m m m
m m m
m m m
47-138
80
105
63 -
80 -
140-235 115
90-500 130
160-315 68
180-380 74
250-470 80
275-680 80
645 -
400-980 84
55
80
105
113
130
305
460
310
415
490
650
740
840
298
315
490
645
495
600
712
891
999
1118
42 #
For D = 75 ran C = 298 + 55 x d
For 100 mm < D < 200 mm C =• -12 + 3300 x D + 55 x d
(4.4)
(4.5)
For D = 300 mm C = 495 + 55 x d (4.6)
For D = 400 mm C = 600 + 55 x d (4.7)
For D > 400 mm C = 68 + 1330 x D + (D + 0.7) x d x 55 (4.8)
where C is the cost of sewer material including installation in Baht/m, D is the diameter in m, and d is the sewer invert depth in m.
4.2.3 Cost of Manholes and Cleanouts
Standard manhole designs were considered for both conventional and small bore sewerage. The cost of manholes was obtained from the Sewerage Department of the Bangkok Municipality (BMA) or was estimated from unit material and construction costs as given in Table 4.4. Table 4.5 summarizes the unit costs of manholes according to pipe diameters and depths.
1.2
3 0.9 o c i-
z 08
E ^ 0.7 o - 0.6 H 8 0.5
0.4
0.3
PVC RC
r = 0.993
r- 0.999
200 400 PIPE DIAMETER (mm)
600 800
Figure 4.1 Cost of Pipe Materials, Laying and Surface Repair as a Function of the Pipe Diameter (without excavation and backfilling)
43
Table 4.4 Unit Costs of Civil Works
No. Description Unit Cost
1.
2.
3.
4.
5.
6.
Excavation by Machines 25 Baht/m3
Selected backfill compacted 32 Baht/m3
Concrete piling dia. (150 mmxl2 m) 1500 Baht/unit
Reinforced concrete works 3100 Baht/m3
Lean concrete works 900 Baht/m3
Formwork of wood 240 Baht/m2
Table 4.5 Unit Costs of Manholes
Dia. (mm)
Depth (m)
Manhole Size dia. x depth
Unit cost (Baht)
< 400 < 3 < 400 3 - 5 400 - 1000 < 5
1.0 m x 3 m 1.2 m x 5 m 1.2 m x 5 m
10,000 12,500 12,500
The unit cost of cleanouts for small bore sewers was determined from unit cost values of material and civil works and was estimated to be 2500 Baht each cleanout.
4.2.4 Cost of Pumping Stations
The cost of pumping stations was divided into cost of civil engineering works and cost of pumps, including the required electromechanical installations. From standard design and unit costs, a cost function was developed based on the type, capacities, and depths of pumping stations in consideration. This cost function gives the construction cost of civil engineering work depending on the volume of the pump sump. The function is as follows:
C = 23,500 V0"7
where C = construction cost in Baht,
V = sump volume in m3
(4.9)
The cost of submersible pumps was derived from various manufacturers or their representatives in Bangkok. The unit costs used are presented in Table 4.6.
44
Table 4.6 Unit Costs of Mechanical.and Electrical Equipment
Description Specifications Unit costs (Bant)
1. Submersible sewage 3 kW , 8 m 90,000 pump with electric motor & accessories
2.
3.
4.
5.
6.
- do -
- do '-
- do -
- do -
- do -
9 kW ,
12 kW ,
20 kW ,
32 kW ,
38 kW ,
10 m
10 m
1 0 m
10 m
10 m
180,000
200,000
350,000
500,000
800,000
4.2.5 Operation and Maintenance Cost
The annual operation and maintenance cost for sewers was taken as 1% of the total construction cost. The annual operation and maintenance cost for pumping comprises of annual energy and maintenance costs, the latter taken as 10% of the energy cost. The electricity charge was taken as 1.55 Baht/kWh, the prevailing rate in the study area.
4.3 Design and Evaluation of Basic Costs
4.3.1 Service Areas for Alternative Sewerage Options
As stated in Chapter 3, two service areas differing in size were defined for the provision of sewerage systems, one service area for the Maximum Sewerage Option and another service area for the Minimum Sewerage Option. The main criterion for the identification of the two areas is the population density. The Maximum Sewerage Option would service most parts of the planning area. Only areas with a very low population density were excluded from service through the Maximum Sewerage Option, since on-site sanitation is obviously more economical and does not impose technical difficulties in areas having very low population density. For the Minimum Sewerage Option, only areas with a very high population density were considered. Difficulties in providing sufficient infiltration areas exclude on-site options in these densely populated areas. (However, in this study, the Septic Tank Option also provides on-site sanitation to densely populated areas, as defined for the Minimum Sewerage Option, for the purpose of comparison.)
Table 4.7 and Map 2 show the population densities and the land use characteristics on which the definition of the two different sewerage areas was based. The net population density range of planning cells 1 to 5 of land use category "Agricultural" is between 10 and 43 persons per ha. Cells 12 to 17 of land use category "Residential II" have a net population density between 25 and 90 persons per ha. In both cases (cells 1 to 5 and 12 to 17) the dwellings are very . scattered and well distributed over the whole gross area. Planning cell 31 of land use category "Industrial" having
/
45
a population density of 32 persons per ha is at present also under scattered development over the whole gross area. Population data of planning cells 32 and 33, of land use category "Special", were either unavailable or irrelevant. Planing cells 1 to 5, 12 to 17, and 31 to 33, were assumed to have on-site treatment systems in the form of septic tanks and soakage pits or, for cells 32 and 33, their own wastewater collection and treatment system.
Table 4.7 Gross Area, Built-Up Area, Population Density, and Population in Service Areas Considered for Sewerage
Planning Land use Gross Built-up Pop. den. Pop. cell no. category area area (persons (persons)
For planning cells 27, 30 and 11, only parts of the planning cell were considered for the provision of sewerage. 20% of the built up area in planning cells 27 and 30, which is a scattered area, and 20% of the built-up area in planning cell 11 were excluded from the provision of sewerage. The latter area is adjacent to cells 25 and 27 which have also been considered for the provision of sewerage.
The areas thus defined for the provision of a sewerage system constitute the service area for the maximum sewerage option. Table 4.7 presents the gross area, built-up area, population, and population densities of the different planning cells to be serviced. 84% of the total population of 105,770 or 88,870 persons are shown to be serviced through the Maximum Sewerage Option. The remaining 16% of the total population (16,900 persons) are to be serviced by on-site treatment in the form of septic tanks and soakage pits. The total area to be served is shown in Figure 4.2 of the following section which presents the main sewer alignment.
46
LEGEND
I 10 j — Planning cell boundary 1 J
I — Service area
— Pumping station
S — Main fewer 70 Bl
TREATMENT PLANT
0 200 400 600 BOO 1000 n
Figure 4.2 Main Sewer Layout for Maximum Sewerage Option I
47
In the Minimum Sewerage Option only planning cells having a population density greater than 240 were assumed to be provided with conventional sewerage. These areas include planning cells 6, 7, 8, 9, and 10, which fall under "Residential I" land use category and have a population density ranging from 244 to 250 persons per ha, and planning cell 22, which is the most densely populated single cell (2 65 persons per ha) and is located just outside the eastern municipal boundary. Field observations of land uses in these high population density areas indicated that septic tank and soakage pits would be infeasible in these areas due to the high density of houses, narrow streets, and an extremely high ground water table. The Minimum Sewerage Option services a population of 38,000 (36% of the total population). The remaining part of the study area was assumed to have on-site septic tanks and soakage pits. The area to be served by on-site facilities constitutes a service population of 67,770 (64% of the total population).
The same service area as for the Maximum Sewerage Option was defined for the small bore sewer system in comparing this with conventional sewerage.
4.3.2 Main Sewer Alignment
The natural terrain in the study area (Map 2) generally slopes down from east to west and from north to south. A small chain of hills at the northeast and the east forms a natural border for the inner part of the town. A military camp is on-the northeast hillock. A large area is occupied by the Chinese cemetery on the eastern hills.
In accordance with the terrain, the population distribution, and the existing road layout, the main sewers are preferably laid along Sukhumvit road and Vachiraprakarn road. Coming from the north, Sukhumvit road shows a high point with a ground level of 13.4 m at the northern part of planning cell no. 23. Afterwards, Sukhumvit road falls down towards the flat areas at a ground level of about 2 m in the south of the municipality. The eastern main sewer for the Maximum Sewerage Option begins at the high point of Sukhumvit road and follows Sukhumvit road until turning to the west to join the western main sewer at Praya Sajja road.
The Vachiraprakarn main sewer begins at the northern end of the service area (planning cell no. 6) on Sukhumvit road and at a ground level of 8.4 m. The sewer diverts from Sukhumvit road before the road ascends to its high point and thereafter follows the lower Vachiraprakarn road. At the southern end of planning cell no. 10, the Vachiraprakarn main sewer turns west and continues along Praya Sajja road in the flat area along the shore-line until the sewer is joined by the Sukhumvit main sewer. From this point, the main sewer continues, still within the flat areas, toward the treatment plant in the south of the planning area. Since the drainage area slopes down from the east to the west, the Vachiraprakarn main sewer accordingly is laid at a lower level than the Sukhumvit main sewer. The area east of the Vachiraprakarn main sewer does not impose major difficulties for the layout of the sewer system. However, the area west of Vachiraprakarn road, in planning cell nos. 8 to 10, is flat and without any significant slope towards Vachiraprakarn road. The situation offers the possibility of exploring alternative concepts for the sewer layout in this flat coastal area. The first alternative is based on the assumption that a main sewer can be built through the center of the critical area. The need for pumping stations is thus reduced by the construction of an additional main sewer. Only one pumping station is required at the end of the additional main sewer to
48
lift the wastewater into the .higher Vachiraprakarn main sewer. No additional main sewer is used for the second alternative. However, more pumping stations are required. These two alternatives are denoted as Maximum Sewerage Option I and II. After comparing the cost of the main sewer system for each of these two alternatives, only the more economical one was subjected to further evaluation.
The main sewer system for the Minimum Sewerage Option is in principle based on the same alignment as for the Maximum Sewerage Option. The system for the Minimum Sewerage Option is only reduced in scale in accordance with its smaller service area. The main sewer aligment for, the Small Bore Sewerage Option is the same as that for the Maximum Sewerage Option, differing only with respect to the number of pumping stations as required by the hydraulic design. The main sewer alignment for the various options and for alternatives I and II of the Maximum Sewerage Option are shown in Figures 4.2 to 4:5.
According to hydraulic design calculations, the main sewer system for the various options reaches the treatment plant site at different levels. The wastewater shall be lifted up by the inlet pumping station of the treatment plant to a common level of 1.2 m above the ground level in all options. In order to make the sewer system in all options comparable, this inlet pumping station was considered part of the sewer system.
4.3.3 Design and Basic Cost of Main Sewers
For the design of main sewers, a design program developed at the Asian institute of Technology was used. The program calculates the required sewer diameters and levels, based on given ground levels and design criteria, the latter defined in Chapter 4.1. The program selects from among the various technically feasible solutions the most economical one through dynamic programming and branch-and-bound techniques.
The main advantage in applying this program to the present study is that it allowed the creation of alternative systems by simply changing the data input for the related design criteria. In designing the small bore sewer system, for example, the data set for the Maximum Sewerage Option was used after changing only the values of the minimum slope, the minimum velocity, and the minimum diameter. The cost of manholes was calculated separately and thereafter added to the cost of pipes.
Calculations for the various options and alternatives I and II of the Maximum Sewerage Option are given in the Appendix. The resulting basic costs are summarized in Tables 4.8 to 4.11.
49
LEGEND
Planning cell boundary
I I — Service areo
Pumping station
Main sewer
0 200 400 600 800 1000m
Figure 4.3 Main Sewer Layout for Maximum Sewerage Option II
50
,f XlA4
y
LEGEND
10 I — Plonning cell boundary i 1 . 1 I j — Service areo
y y — Pumping station
IAI IJ3 ^ — « ^ ^ ) — Main sewer
0 200 400 600 800 1000m
Figure 4.4 Main Sewer Layout for Minimum Sewerage Option
51
LEGEND
j 10 J — Plonning cell boundary I J
! j — Service area
S t\
i \
I
1 \
\ ^
l;_.;ii-
— Pumping station
IAI IJ3 Main sewer 7 0 B I
TREATMENT PLANT
0 200 400 600 800 1000 m
Figure 4.5 Main Sewer Layout for Small Bore Sewerage Option
52
Table 4.8 Basic Main Sewer Costs: Maximum Sewerage Option, Alternative I
From To Length Cost of of sewers sewers manholes (m) (Baht) (Baht)
Table 4.10 Basic Main Sewer Costs : Minimum Sewerage Option
From
1A1 1A4
48B1
1A3
To
48B1
73B1
3J3
Total
Length of sewers
(m)
4,841
2,697
2,038
9,576
Cost sewers (Baht)
3,726,064
3,177,792
1,336,030
8,239,886
of manholes (Baht)
2,157,500
1,125,000
820,000
4,102,500 12,342,386
Table 4.11 Basic Main Sewer Costs : Small Bore Sewerage Option
From
1A1 1A4
1A2
34B1
1A3 1A6
57B1
To
34B1
2J3
57B1
3J3
7 0B1
Length of sewers
(m)
4,053
1,684
1,511
5,346
1,986
Cost sewers (Baht)
3,098,575
1,296,533
1,590,885
4,189,924
3,513,432
of manholes (Baht)
1,010,000
417,500
375,000
1,340,000
500,000
Total 14,580 13,689,349 3,642,500 17,331,849
54
4.3.4 Layout and Cost Estimation Procedure for Lateral Sewers
In estimating the cost of the lateral sewer system, unit costs per hectare were derived for the various land use categories in selected representative areas. The unit costs were then multiplied by the area of each land use category in the three sewerage options. The development of unit costs is described in the following paragraphs.
Reference or base maps of the scale 1:2500 were used for the design of the lateral sewer network. Representative areas were chosen for each land use category. The selection of representative areas was restricted to those within the municipality and its vicinity where most of the residential and commercial dwellings are concentrated (49% of the population). Figure 4.6 shows the location of these representative areas. Maps 3, 4, and 5 display the representative areas of landuse categories Residential I, Commercial, Mixed and Institutional. In case of the representative area of landuse category Residential II (Planning cell 11) which falls outside the municipal boundary, the map of the study area (Map 2) was used as the base map, since no more detailed map of this area was available. The lateral sewer network was laid out on the map of representative areas considering the topography and existing network of roads. As far as possible, lateral sewers were laid out to run along existing streets. The representative areas cover about 39% of the total service area.
The area served in hectares and the total length of sewers, as determined from the layout in Maps 3 to 5 for each of the representative areas, are presented in Table 4.12. The area serviced and length of sewers in the case of Residential II land use category (representative area no. 3) were determined from Map 2. Representative area no. 6 is very much different, in terms of length of sewers per hectare, from the other two representative areas (area nos. 4 and 5) of the same land use category (Commercial). Area no. 6 is adjacent to the high population density, category Residential I. The differences in sewer length result in considerable differences in the cost per hectare of the lateral system. Thus, in costing the secondary sewers, the total built-up area under the land use category Commercial was divided into the categories Commercial I and Commercial II.
The total number of houses or institutions under each land use category for each of the representative areas was determined from the 1:1000 scale Tax Maps. Similarly, the length of house connection pipes in each of the representative areas was determined, depending on the relative location of the houses with respect to the sewer servicing it. The specific data thus developed for the representative areas are shown in Table 4.12.
55
c - A "® \\ A
=-<*.<
| , - \ 24 r / r *• 0 8
24
v'
23
- - - - -
16
-.-.
;>-.
V \
- ^ ^ f e ^ ; O: V. / ; . ; - ' \
\ 25'.
10
V
25
^ . U-
\ 21
29
\ 27 , •
i
\ 22
LEGEND
i 10 ! — Plonning cell boundary J i
I I ~ Representative area
<c V. -r
30
0 200 400 600 8001000 m
Figure 4.6 Representative Areas for the Lateral Sewer System in Various Landuse Categories
Table 4.12 Length of Lateral Sewers and House Connections, and Number of Houses/Institutions in the Representative Service Areas
Area Land use Population Built-up % of total Length of sewers Number of Length of no. category density area sewered houses/institutions house connections
In order to check the outlet levels of the lateral sewer system with respect to the levels of main sewers, 15 critical laterals were selected. These are marked in the maps of representative areas as Al to A5, Bl to B6, and CI to C4. These critical sewers start at the most remote parts of the service areas. The outlet levels for the critical laterals were then calculated according to the minimum slope and minimum cover depth, as stated in Chapter 4.1, and compared to the main sewer levels. The result of this analysis was satisfactory except for the case of laterals A3 to A5. These laterals are located in planning cell no. 9 where the built-up area has been extended towards the sea through land reclamation. Nevertheless, it was assumed for the purpose of this study, that the critical situation in the case of laterals A3 to A5 can be corrected in the final design by either modifying the lateral sewer layout and design criteria in this service area, or by lifting the wastewater of this area before its discharge into the main sewer using a small submersible pump. The pumping station would influence the cost of the entire system only insignificantly.
The levels of the critical lateral sewers were then used to evaluate an average pipe invert depth for the lateral sewer system. The average depth of the pipe invert was determind to be 2.5 m.
4.3.5 Basic Cost of the Lateral Sewer System
The cost estimate of lateral sewers for conventional sewerage was based on 90% of the pipes being 2 00 mm in diameter and the remaining 10% of the pipes being 300 mm in diameter. Using cost equations (4.5) and (4.6), with the pipe invert at an average depth of 2.5 m, as determined above, the resulting cost of sewer pipe materials and installation was calculated to be 770.2 Baht/m. Knowing the length of sewers from Table 4.12 in the representative areas and the criteria for manhole spacing, as cited in Chapter 4.1, the number of manholes along the sewer lines in the representative areas was determined.
Using cost equation (4.5) with a pipe diameter of 100 mm for the house connection pipes laid at an average depth of 1.2 m, the resulting cost of house connection pipes is 384 Baht/m. House connection pipes must be supported properly to avoid their damage by subsequent settling. Also, special joints and fittings may be necessary in connecting each house connection to the street sewer. With these requirements in view, the cost of house connections as calculated above, was increased by 20%. Thus, the final cost of house connections for conventional sewerage is 460.8 Baht/m.
Using the unit costs of sewers, manholes, and house connections, as determined above, the cost of the lateral sewer system per hectare for each of the representative areas was calculated. Results of calculations are presented in Table 4.13. The average cost per hectare, as calculated for each land use category, was used thereafter in calculating the total cost of the lateral sewer system according to the whole service area occupied by the different types of land uses. The resulting basic costs for the lateral sewer system of the Maximum and the Minimum Sewerage Options are presented in Tables 4.14 and 4.15 respectively.
Table 4.13 Basic Cost per Hectare of the Lateral Sewer System for Conventional Sewerage .
Area Land use no. category
(1> (2) *
1 Residential I
2 Residential I Average
3 Residential II
4 Commercial I
5 Commercial I Average
6 Commercial II
7 Institutional
8 Institutional Average
9 Mixed
10 Mixed Average
Built-up area
(ha) (3)
27.12
14.70
25.60
36.08
30.00
10.33
• 21.50
17.5
27.34
17.70
Length
(m) (4)
5620
3000
4500
5640
5375
2300
2800
2955
3710
2963
of sewers
(m/ha) (5) = (4)/(3)
207.2
204.1
175.8
156.3
179.2
222.7
130.2
168.9
135.7
165.9
Number
(no.) (6)
225
120
180
226
215
92
112
119
149
119
of manholes
(no./ha) (7) = (6)/(3)
8.3
8.2
7.0
6.3
7.2
8.9
5.2
6.8
5.4
6.7
Length of house connections
(m/ha) <8)
216.1
210.9
46.9
144.1
113.7
227.5
163.7
108.6
156.5
149.2
Total Cost
(Baht/ha) (9)
342,164
336,381 339,272
227,013
249,784
262,413 256,098
365,356
227,713
248,130 237,921
230,631
263,528 247,079
Cost of house connections
(Baht/ha) (10) = (8)x460.8
99,579
97,183 98,381
• 21,612.
66,401
52,393 59,397
104,832
75,433
50,043 62,738
72,115
68,751 70,433
Note : (9) «= 770.2 x (5) + 10,000 x (7) + 460.8 x (8) where cost of sewers = 770.2 Baht/m, cost of manholes = 10,000 Baht each and cost of house connections is 460.8 Baht/m
.V
Table 4.14 Basic Cost of the Lateral Sewer System for the Maximum Sewerage Option
Planning Land use cell category
Built-up area % of built-up
(1)
6 7 8 9 10
11
18 19 20 21
19 20 22
23 24 25 26 27
29 30
(2)
Residential I Residential I Residential I Residential I Residential I
Sub-total
Residential II
Commerical I Commercial I Commercial I Commercial I
Sub-total
Commercial II Commercial II Commercial II
Sub-total
Mixed Mixed Mixed Mixed Mixed
Sub-total
Institutional Institutional
Sub-total
(3)
14.0 22.0 33.0 22.0 44.0
32.0
6.0 7.7
28.4 30.0
10.3 9.6 17.0
66.0 20.0 32.0 21.0 58.0
39.0 123.0
of planning cell area considered from base data for sewerage
(%) (4)
Built-up area considered for sewerage
(ha) (5)=(3)x(4)
14.0 22.0 33.0 22.0 44.0
Average cost per ha house sewer conn. system (Baht/ha) (Baht/ha)
(6) (7)
Cost of Total cost of house sewer system conn. (Baht) (Baht) (8) = (6)x(5) (9) = .(7)x(5)
100 100 100 100 100
80
100 100 100 100
100 100 100
100 100 100 100 80
100 80
135.0
25.6
6.0 7.7
28.4 30.0
72.1
10.3 9.6 17.0
36.9
66.0 20.0 32.0 21.0 46.4
185.4
39.0 98.4
137.4
98,381 339,272 13,281,435 45,801,720
21,612 227,013 553,267 5,811,533
59,397 256,098 4,282,524 18,464,666
104,832 365,356 3,868,301 13,481,636
70,433 247,079 13,058,278 45,808,447
62,738 237,921 8,620,201 32,690,345
Total 635.0 592.4 43,664,006 162,058,347 tn
60
Table 4.15 Basic Cost of the.Lateral Sewer System for the Minimum Sewerage Option
Planning cell
6 to 10
22
Total
Land use category
Residential I
Commercial II
Area
(ha)
135.0
17.0
Cost of house connections
(Baht)
13,281,435 .
1,782,144
15,063,579
Total cost of sewer system
(Baht)
45,801,720
6,211,052
52,012,772
In costing the lateral sewers for the small bore system, it was assumed that 60% of the sewers are 150 mm in diameter while the remaining 40% of the sewers are 200 mm in diameter. The average sewer invert depth was assumed to be 2 m as a result of the lower minimum cover considered for small bore sewerage and the inflective gradient which the sewer may have.
From equation (4.5) and the above assumptions, the cost of pipe materials and installation for the lateral sewers of the small bore sewerage system was calculated. This value was found to be 659 Baht/m. The average cost of a manhole and a cleanout was taken as 10,000 Baht and 2,500 Baht per unit respectively. The cost of house connections was taken as 1.2 times the value obtained as per equation (4.4), using a pipe diameter of 75 mm laid at an average depth of 0.8 m. The cost of house connections was thus determined to be 410.4 Baht/m. Using the above mentioned values, the basic cost per hectare and the total basic cost of the lateral sewers of the Small Bore Sewerage Option were calculated in the same way as for conventional sewerage. The results are presented in Tables 4.16 and 4.17.
4.3.6 Basic Cost of Pumping Stations
The locations of pumping stations required for the main sewer system of the different sewerage options are shown, together with the main sewer alignment, in Figures 4.2 to 4.5. The locations, flow rate, and pumping heads follow the main sewer design. With these information, the basic cost of pumping stations was estimated from the design criteria and unit, costs stated in Chapters 4.1 and 4.2. Calculations are shown in Tables 4.18 and 4.19.
Table 4.16 Basic Cost per Hectare of the Lateral Sewer System for the Small Bore Sewerage Option
Area Land use no.
(1)
1 2
3
4 5
6
7 8
9 10
category
(2)
Residential I Residential I
Average
Residential II
Commercial I Commercial I
Average
Commerical II
Institutional Institutional
Average
Mixed Mixed
Average
Built-up area
(ha) (3)
27.12 14.70
25.60
36.08 30.00
10.33
21.50 17.50
27.34 17.70
Length
(m) (4)
5620 3000
4500
5640 5375
2300
2800 2955
3710 2963
of sewers
(m/ha) (5) = (4)/(3)
207.2 204.1
175.8
156.3 179.2
222.7
130.2 168.9
135.7 165.9
No.
(no (6)
38 20
30
38 36
16
19 20
25 20
of ma
.) (no (7)
nholes
./ha) =(6)/(3)
1.4 1.4
1.2
1.1 1.2
1.6
0.9 1.1
0.9 1.1
No. of
(no.) (8)
187 100
150
188 179
77
93 99
124 99
cleanouts
(no./ha) (9)=(8)/(3)
6.9 6.8
5.9
5.2 6.0
7.4
4.3 5.7
4.5 5.6
Length house connection (m/ha) (10)
216.1 210.9
46.9
144.1 113.7
227.5
163.7 108.6
156.5 149.2
of Total cost
(Baht/ha) (11)
256,482 252,055
254,269
161,850
186,140 191,755
188,948
274,625
172,734 181,125
176,929
173,904 195,560
184,732
Cost of house connections (Baht/ha) (12) =410.4x(10)
88,687 86,553
87,620
19,248
59,139 46,662
52,901
93,366
67,182 44,569
55,876
64,228 61,232
62,730
Note : (11) = 659 x (5) + 10,000 x (7) + 2500 x (9) + 410.4 x (10) where cost of sewers = 659 Baht/m, cost of manholes = 10,000 Baht each, cost of cleanouts = 2500 Baht each and cost of house connections is 410.4 Baht/m
CT>
Table 4.17 Basic Cost of the Lateral Sewer System for the Small Bore Sewerage Option
Planning cell
(1)
Land use category
(2)
Built-up area of planning cell from base data
(ha) (3)
% of built-up area considered for sewerage
(%) (4)
Built-up Average cost per ha Cost of Total cost of area considered house sewer house - sewer system for sewerage conn. system conn.
Residential I Residential I Residential I Residential I Residential I
Sub-total
Residential II
Commerical I Commercial I Commercial I Commercial I
Sub-total
Commercial II Commercial II Commercial II
Sub-total •
Mixed Mixed Mixed Mixed Mixed
Sub-total
Institutional Institutional
Sub-total
14.0 22.0 33.0 22.0 44.0
32.0
6, 7.
28. 30.0
10.3 9.6 17.0
66.0 20.0 32.0 21.0 58.0
39.0 123.0
100 100 100 100 100
80
100 100 100 100
100 100 100
100 100 100 100 80
100 80
14.0 22.0 33.0 22.0 44.0
135.0
25.6
6.0 7.7
28.4 30.0
72.1
10.3 9.6 17.0
36.9
66.0 20.0 32.0 21.0 46.4
185.4
39.0 98.4
137.4
87,620 254,269 11,828,700 34,326,315
19,248 161,850 492,749 4,143,360
52,901 188,948 3,814,162 13,623,151
93,366 .27.4,625 3,445,205 10,133,663
62,730 184,732 11,630,142 34,249,313
55,876 176,929 7,677,362 24,310,045
Total 592.4 38,888,321 120,785,846
63
Table 4.18 Basic Construction Cost of Pumping Stations
Pumping station location
Peak flow rate (1/s)
Pump sump volume required (m3)
Cost (Bant)
Maximum Sewerage Option I
2J3 70B1
123.9 697.5
11 63
116,326 372,587
Maximum Sewerage Option II Total 488,913
24B1 8B3 5J3
70B1
Minimum Sewerage Option
48B1 73B1
7 OBI
130.0 32.6
220.0 697.5
>pt ion
164.4 190.8
re Option
498.3
12 3
20 63
Total
15 17
Total
45
Total
123,277 48,900
173,322 372,587
718,086
143,060 155,517
298,577
297,688
297,688
64
Table 4.19 Annual Energy Consumption and Basic Cost of Pumps
Pumping Flowrate station location avg.
U/s)
1. Maximum Sewerage
2J3 70.5 70B1 398.6
2. Maximum Sewerage
24B1 74.3 8B3 18.6 5J3 152.9
70B1 .398.6
3. Minimum Sewerage
48B1 93.0 73B1 109.0
peak U/s)
Option
123.9 697.5
Option
130.0 32.6 220.0 697.5
Option
164.4 190.8
4. Small Bore Sewerage Opt:
70B1 299.0 498.3
Pump capacity
required (kW)
I
8.7 103.7
II
11.8 3.0
20.0 103.7
11.5 26.2
ion
71:6
provided No. x kW
2 x 4 x
Total
2 x 2 x 2 x 4 x
Total
2 x 3 x
Total
4 x
Total
9 3
12 31 20 38
12 12
32
Cost of pumps
*) (Baht)
360,000 83,200,000
3,560,000
400,000 80,000 700,000
3,200,000
4,480,000
400,000 600,000
1,000,000
2,000,000
2,000,000
Energy consumption
(kWh/a)
34,767 415,451
450,218
47,422 11,892 97,608
415,451
572,374
'46,111 105,044
151,155
300,996
300,996
k) Including-stand-by pumps
4.4 Compilation and Comparison of Costs of Sewerage Options
4.4.1 Overview of Costs of the Various Sewerage Options
Two alternative layouts for the main sewer system were compared for the Maximum Sewerage Option. Alternative I contained an additional main sewer branch, thus avoiding the installation of two additional pumping stations as in alternative II. The cost of sewers for the two main sewerage alternatives are 20.4 and 20.3 million Baht respectively. However, adding to these values the cost of pumping stations, alternative I exhibits a cost of 24.5 million Baht which is less than the total cost' of alternative II, the latter amounting to 25.5 million Baht. Moreover, alternative II would require higher operation expenses to oparate its. pumping stations. Alternative II is therefore excluded from further consideration and the term Maximum Sewerage Option from hereon refers to alternative I only.
The following compilation of total construction cost was derived from the basic construction costs presented in Chapter 4.3 by adding an allowance of 40%, as stated in Section 4.2.1. The total construction cost and the annual operation and maintenance cost for the Maximum Sewerage Option were calculated as follows:
65
Total construction cost in Bant :
Main sewers = 28,580,000 Lateral sewers + house con. = 226,881,000 Pumping stations = 5,668,500
Total = 261,129,500
0 & M Cost per annum in Bant :
Sewers and pumping stations = 2,611,300 (1% of capital cost) Energy cost = 697,800 @ 1.55 Baht/kWh Maintenance and repairof = 69, 800 pumps (10% of energy cost)
Total = 3,378,900
The per capita cost of the construction of conventional sewerage for the service area of 592.4 ha, having a population of 88,870, was then determined to be 2,938 Bant per person. The operation and maintenance cost is 38 Baht per person per annum.
The construction cost of the lateral sewer network constitutes 87% of the total construction cost while the installation of main sewers constitutes about 11% of the total construction cost. The remaining 2% of the construction cost is allotted for the construction of pumping stations and the purchase of submersible pumps.
In the Minimum Sewerage Option, only areas having a population density of more than 240 persons per ha were connected to the sewer system. The total construction cost and the annual operation and maintenance cost for this option were computed as follows:
Total construction cost in Baht :
Main sewers = 17,279,000 Lateral sewers+ house con. = 72,818,000 Pumping stations = 1,818,000
Total = 91,915,000
0 & M Cost per annum in Baht :
Sewers and pumping stations = 919,000 (1% of capital cost) Energy cost = 234,300 @ 1.55 Baht/kWh Maintainance and repairof = 23,400 pumps (10% of energy cost)
Total = 1,176,700
The per capita cost of providing conventional sewerage for the service area of 152 ha, having a population of 38,000, was then determined to be 2,418 Baht per person. The operation and maintenance cost is 31 Baht per person per annum.
66
The construction cost of the lateral sewer network constitutes 79.1% of the total construction cost while the installation of main sewers constitutes about 19% of the total construction cost. The remaining 2% of the total construction cost is allotted for the construction of the pumping stations and the purchase of submersible pumps.
Comparing the Minimum Sewerage Option with the Maximum Sewerage Option reveals that the extension of the sewerage system to less densely populated areas increases the per capita cost for construction as well as for operation and maintenance by 22% and 23% respectively. This increase in cost is mainly caused by higher per capita costs of the lateral sewers of the Maximum and Minimum Sewerage Options in areas of low population density. The per capita cost of the lateral sewer system including house connections is for the Maximum and the Minimum Sewerage option 2,553 Baht per person and 1,916 Baht per person respectively. This reflects an increase of 33% in the per capita construction cost of lateral sewers of the. Maximum Sewerage Option by the extension of sewers to areas of low population density. This effect becomes even more obvious when considering the cost for individual areas instead of the average cost for an entire sewerage option. For instance, the per capita construction cost for lateral sewers in the land use category Residential I with a population density of 250 persons per ha is 1,900 Baht per person. The corresponding value for land use category Residential II with a population density of 16 persons per ha is 19,864 Baht per person.
The total construction cost and the annual operation and maintenance cost for the Small Bore Sewerage Option were calculated as follows:
Total construction cost in Baht :
Main sewers = 24,265,000 Lateral sewers+ house con. = 169,100,000 Pumping stations = 3,216,800
Total = 196,581,800
Interceptor tanks = 24,133,000
Total (including int. tanks)= 220,714,800
0 & M Cost per annum in Baht :
Sewers and pumping stations = 1,965,800 (1% of capital cost) Energy cost = 466,500 @ 1.55 Baht/kWh Maintenance and repair of = 46, 600 pumps (10% of energy cost)
Total = 2,478,900
The per capita cost of providing small bore sewerage for the service area of 592.4 ha having a population of 88,870 was determined to be 2,212 Baht per person. The operation and maintenance cost is 25 Baht per person per annum. These rates exclude the cost of providing interceptor tanks at individual houses and reflect the situation wherein previously built on-site facilities can be used as interceptor tanks. Including interceptor tanks, the construction as well as
67
operation and maintenance costs are 2,484 Bant per person and 28 Bant per person respectively. Accordingly, if previously built on-site facilities can be used, the saving in cost would constitute about 11% of the per capita construction cost of the small bore sewer system.
The construction cost of the lateral sewer network, including interceptor tanks, constitutes 88% of the total construction cost whereas the installation of main sewers constitutes about 11% of the total construction cost. The remaining 1% of the total construction cost is allotted for the construction of the pumping stations and the purchase of submersible pumps.
4.4.2 Construction Cost of Conventional Sewerage and Small Bore Sewers
The comparison of the economic cost of a conventional sewerage system and a small bore sewerage is presented in Chapter 7. Nevertheless, an analysis of construction costs more clearly shows from which part of the sewerage system cost differences between options originate. Table 4.20 shows the construction costs of the two sewerage systems and the percentage of savings incurred through the installation of small bore sewerage. The construction cost of the lateral and main sewers are about 15% lower for small bore sewerage as compared to that for conventional sewerage. Under the assumption that existing on-site facilities can be used as interceptor tanks for small bore sewerage, the cost saving for the lateral sewers increases to about 25%. Since the construction of lateral sewers constitutes the major part of the total cost, this also contributes to the total saving. The percentage of savings for the lateral sewers and for the total sewerage are almost equal. This applies to the cases where there is and there is no cost for interceptor tanks as well.
The highest saving was incurred with respect to the construction cost of pumping stations, this being 43% less for small bore sewerage. The reason is simply that less pumping stations are required for small bore sewerage because of less stringent slope and flow velocity requirements. The reduced number of pumping stations required for small bore sewerage servicing flat areas obviously offers further advantages besides lower system cost. These benefits include less operational requirements and greater reliability.
It was initially expected that cost saving from the use of small bore sewers would be higher in areas with low population density. Table 4.21 confirms this expectation. The proportion of savings almost continuously increases with decreasing population density. However, the amount of this increase is rather small. The amount of saving increases from about 25% of total cost for serviced areas having densities between 169 and 250 persons per ha to about 29% of total cost for serviced areas having a density of 16 persons per ha.
68
Table 4.20 Construction Cost of Conventional Sewerage Versus Small Bore Sewerage
Type of • Construction cost (million Bant) Savings in % system element by small bore
Conventional Small bore sewerage
Main Sewers Lateral Sewers Pumping Stations
Total 1
Interceptor tanks
Total 2
28.58 226.88 5.67
24.27 169.10 3.22
261.13
0.0
261.13
196.58
24.13
220.71
15.1 25.5 [14.8]* 43.2
24.7
15.5,
*) including interceptor tanks
Table 4.21 Basic Areal Costs of Conventional Sewerage versus Small Bore Sewerage for Different Population Densities (without interceptor tanks)
Land use category
Density (persons/ha)
Construction cost
(103 Baht/ha)
Conventional Small bore
Savings in % by small bore sewerage
Residential I Commercial Mixed Institutional Residential II
2. METCALF and EDDY (1981), Wastewater Engineering Collection and Pumping of Wastewater, McGraw-Hill, Inc., New York.
3. OTIS R.J. and D.D. MARA (1985), The Design of Small Bore Sewer System, TAB Technical Note No. 14, Unxted Nations Development Programme, U.S.A.
4. SEATEC (1983), Report on Urban Sewerage and Excreta Disposal Planning for Chonburi, Thailand, SEATEC International Consultants, Bangkok.
5. TISTR (1985), Feasibility Study and Detailed Design for Drainage and Flood Control of Chonburi Regional City, Engineering Consultancy Services Center, Thailand Institute of Scientific and Technological Research, Bangkok.
REFERENCES
1. BORCHARD, K. (1974), Orientierungswerte fuer die staedtebauliche Planung, Dt. Akad. f. Staedtebau u. Landespl., Munich, Germany
2. GASSNER, E. (1982), "Bauleitplanung und Kanalisation", Chapter 10 in Lehr-und Handbuch der Abwassertechnik, Vol. 1, Ernst & Sohn, Munich, Germany
3. KALBERMATTEN, J.M., S.J. DeAnne and C.G. GUNNERSON (1980), Appropriate Technology for Water Supply and Sanitation, A Summary of Technical and Economic Options, World Bank, Washington, D.C.
4. REIDENBACH, M. (1988) "Aus den Augen aus dem Sinn? Zur Erhaltung der staedtischen Kanalisation", Stadtbauwelt No. 97, pp. 492-495
5. RYBCZYNSKI, W., C. POLPRASERT and M. MCGARRY (1978), Low-Cost Technology Options for Sanitation, IDRC, Ottawa, Ont.
70
5. ON-SITE WASTEWATER TREATMENT
5.1 Septic Tanks
5.1.1 Introduction
A septic tank is a watertight rectangular or cylindrical chamber, usually located just below ground level, which receives both excreta and flush water from toilets as well as other household wastewaters (or sullage such as water from kitchens, bathrooms, and laundry, etc.). As shown in Figure 5.1, settleable solids settle to the tank bottom, accumulate, and then are anaerobically digested. A scum of lightweight materials (including grease and fats) remain on or rise to the surface of the liquid in the tank. The clarified liquid flows through an outlet structure and is normally treated through a "subsurface soil absorption system such as leaching fields or soakage pits. Because the liquid in septic tanks has a retention time of one to three days, the effluent from septic tanks is obnoxious, and contains high concentrations of organic matter, nutrients, and enteric microorganisms. Hence, effluent should not be discharged to nearby storm drains, rivers, or lakes without prior treatment. In developing countries and Southeast Asia, soakage pits are most commonly employed in treating septic tank effluent.
Sludge accumulated in septic tanks, called septage, still contains a high concentration of organic matter, nutrients, and enteric microorganisms. The periodic removal of septage, at intervals of one to five years, is necessary to avoid excessive septage accumulation which can interfere with septic tank efficiency. Septage is usually treated by anaerobic digestion or lagooning. The treated residue can then be reused as a soil conditioner.
A cesspool is a primitive form of septic tank which is made of concrete rings as shown in Figure 5.2. In general, two cesspools arranged in series are constructed for a household. Only excreta and flush water flow into the cesspool. The settleable solids settle at the tank bottom and the liquid seeps out of the concrete rings to the surrounding soil through small holes (2. cm in diameter). Because the surrounding, soil is easily clogged, many cesspools have effluent pipes connected to nearby storm drains or canals. Because cesspool effluent possesses characteristics similar to those of septic tank effluent, this practice of cesspool effluent treatment and discharge is technically unsatisfactory. The cesspool effluent pollutes the nearby soil and water courses and, as such, poses as a possible health hazard to the population. Cesspool sludge or septage needs to be periodically removed from cesspool units, as with sludge or septage in septic tanks.
Cities in Thailand are not equipped with sewerage or wastewater collection systems. Cesspool units are commonly used to treat toilet wastewaters while sullage waters (also polluted) are discharged directly into storm drains or nearby canals. Because subsoil in most areas of the country is of impermeable clay and can become clogged sooner or later, overflow from cesspools together with sullage waters usually find their way, either directly or indirectly, into the drainage system, thereby causing pollution and other unsightly conditions, as cited earlier.
Inspection Opening
I Inspection Opening
» : : - . ' . ; *
Access Openings
(near side wall)
/ \
« ? • •
Liquid Level 3* 75 mm \
Scum
^ £ ^
Sluriae
4
« • • . • * • : • « • . ' . • • « •
First C o m p a r t m e n t ^ Length Second Comportment l / 3 Length
Total Length (equals two to three times width)
( a ) Septic Tank
- _ To Sookoge Pit
i_ E i
£ Septic Tank .'"•'.
Effluent
Rock'Fill (150 mm ;'• min.)
Tight Joints
Open Joints
( b ) Soakage Pit
Figure 5.1 Schematic Diagram of Septic Tank and Soakage Pit
72
Soakage Pit Soakage Pit 2
:H~I
Pipe 0 100 mm
(a) Plan
Concrete Slob Some with Toilet Placing Over the-Pit and Located inside the House
Some with Overflow Connection to Public Drain
: o * * # •S-o7:-9\
Concrete Slab
Ground Level
SDEESESZEllS mw><mmyA
-":"i -Seepage Hole
Sludge
Z 0 0.80 m
o
O
•3-5 Concrete Rings
Broken Brick
( b) Cross Section
Figure 5.2 Typical Cesspool Unit in Thailand
73
5.1.2 Excreta and Wastewater Disposal in Chonburi
The Chonburi municipal area was divided into a number of planning cells as shown in Map 1. A survey conducted by SEATEC (1983) found that most of the urban dwellers use pour-flush toilets with toilet wastewaters being treated by cesspool systems (Figure 5.2) . Pour-flush toilets are connected to cesspools located either beneath or beside the house.
A typical cesspool pit is constructed of three to five concrete rings whose diameter varies from 0.8 to 1.0 m. The pit depth is 1.2 to 2.0 m. Most of the houses and row shophouses are equipped with two cesspool pits which are constructed in series. Cesspool effluent is usually piped into the nearby storm drains or canals (Figure 5.3).
The infiltration capacitites of soils in the Chonburi municipal area are not known. A serious pollution problem is apparent in the old commercial district (cell number 19 and 20) where shallow wells and cesspools are located near each other. About 10% of the population obtain their waters from shallow wells for domestic uses such as dishwashing, bathing, and other cleansing activities. These well waters are most of the time slightly saline. The total coliforms content was found to be as high as 1800 MPN/lOOml (SEATEC, 1983) . This is indicative of the possible contamination of the wells by wastewater.
Commercial buildings, government offices, schools, and other institutional establishments normally have septic tanks for toilet wastewater treatment. According to SEATEC (1983) and the survey conducted for this study, soakage pits for the treatment of septic tank effluent are not properly constructed or non-existent. It is probable that some septic tank effluents are discharged directly into storm drains.
It should be noted that in the Chonburi municipality, similar to other provinces in Thailand, all sullage wastewaters are discharged without treatment directly into storm drains or nearby water courses. Since sullage wastewater contains high concentrations of organic matter and fecal microorganisms (FEACHEM et al., 1983), this practice of sullage disposal is also unsatisfactory and is a threat to public health.
The frequency of septage removal or desludging in the Chonburi municipality is given in Table 5.1. According to the survey done by SEATEC (1983), the long periods between emptying the pits had caused the sludge to pile up so that surplus liquid and feces bypassed the tanks and overflowed either into the surrounding subsoil or into adjacent water courses. This condition is evident in the areas of Chonburi which are inaccessible to desludging services such as vacuum trucks. In particular, inaccessibility to desludging services is common in low-income and urban fringe areas where these services are expensive.
The cesspool system relies to a great extent on the capacity of the subsoil to accept the infiltration of liquid from the cesspool pits. Where the ground water table is high and the soil is saturated or impermeable, percolation of effluent is limited so that this liquid flows directly into water courses. Improper design and location of cesspools and septic tanks, especially in high density areas, aggravate the aforementioned pollution problems.
z.z.z:dzzzzz~z[irzzzzzzzzzzazzzzz :!E zTJrr z "--- -_i-_-dzzzzzz.-z.n: FOOTPATH •PUBLIC DRAIN MANHOLE
Figure 5.3 Typical Layout of Rowhouse with Drainage of Cesspool System Overflow to Public Drain
76
It appears from the aforementioned information- that the current method of excreta and sullage treatment/disposal in the Chonburi municipality is not technically and hygienically effective, thereby resulting in pollution problems to the surrounding soils, groundwater, and storm drains. In this case study, the septic tank/soakage pit system (Figure 5.1) will be considered as the suitable and effective on-site treatment system. All the toilet and' sullage wastewaters shall first be treated in the septic tank and, thereafter, the septic tank effluent shall be treated in the soakage pit. The bacteria adhering to the rock media surrounding the soakage pit shall be responsible for wastewater treatment and also pathogen retention/ inactivation. The treated effluent shall seep into the surrounding soil leading to the ground water or nearby surface waters.
Other on-site treatment methods such as composting toilets and pit latrines are not socially accepted by the Thai people and can not treat sullage wastewaters. A watertight vault may be installed in a house to receive all types of wastewater; but septage/wastewater removal in this case must be more frequent, thereby causing additional expenses for households. '
5.1.3 Design Criteria of Septic Tank System for Chonburi Municipality
There are several methods available for the design of septic tanks (POLPRASERT and RAJPUT, 1982); but the method proposed by PICKFORD (1980) seemed to be appropriate in the design of household septic tanks for Chonburi. The design equations thus employed followed the detailed stages of calculations as outlined:
C = A + B (5.1)
where
C = total capacity of septic tank, 1
A = required sludge storage capacity, 1
B = required liquid retention capacity, 1
A and B were calculated separately from the following equations:
A = Pnfs (5.2)
where
P = number of people expected to contribute to the tank inputs
n = number of years between desludging
f = factor which is related to the ambient temperature
s = rate of sludge and scum accumulation, l/(c.a) According to SEATEC (1983), the number of persons per household
(P) should be taken as seven.
The desludging frequency (n) was taken as one per annum to avoid excessive sludge accumulation in the septic tank.
According to PICKFORD (1980), the value of 'f' should be taken as 1.3 for the desludging period of one year.
77
Also, PICKFORD (1980) suggested that the value of s should be taken as 40 l/(c.a).
The value of B was calculated using equation (5.3)
B = Pqt
where
(5.3)
q =» wastewater flow rate which for Chonburi was taken as 120 l/(c.d)
t = hydraulic retention time which is usually taken as one day to allow for sedimentation of settleable solids
Values for B and P are those defined previously.
The number of people to be served by septic tanks in the Maximum Sewerage Option, the Minimum Sewerage Option, and the Small Bore Sewerage Option and the Septic Tank Option are 16900, 67770, 16900, and 105770, respectively.
The value of C for institutional, commercial, and other kinds of establishments can be determined from guidelines prepared by the U.S. DEPARTMENT OF HEALTH, EDUCATION, AND WELFARE (1959) as shown in Figure 5.4. The design equation to determine the size of a septic tank is given in equation (5.4).
Figure 5.4 Septic Tank Capacities for Sewage Flows up to 14,500 gal/d (54.88 m3/d)
78
C = 1125 + 0.75 Q (5.4)
where
C = net volume of the tank, gal
Q = sewage flow rates, gal/d
The wastewater flow rates from institutional sources for the four wastewater treatment options are given in Table 5.2.
Table 5.2 Wastewater Flow Rates from Institutional Sources
Option Flow rates,1/s
Maximum Sewerage Option 5.7
Minimum Sewerage Option 74.1
Small Bore Sewerage Option 5.7
Septic Tank Option 75.8
Other Design Considerations
A two-compartment rectangular septic tank, as shown in Figure 5.1 is proposed for household wastewater treatment while a three-compartment rectangular septic tank is suggested for the treatment of wastewater from institutional and commercial areas. These multicompartment septic tanks can reduce flow short-circuiting and produce effluents which contain a low concentration of suspended solids. By installing multi-compartment septic tanks, the surrounding soil would not be easily clogged and the soakage pits would function effectively. For the Chonburi municipality, multi-compartment septic tanks are preferred to single or circular-compartment septic tanks.
To enhance the efficient sedimentation of solid matter, the size of the first compartment of a two-compartment septic tank is usually made to be twice the size of its second compartment. For a three-compartment septic tank, the size of the second and third compartments are both made equal to half of the size of the first compartment.
Because septic tanks must be watertight, structurally durable, and stable, a suitable construction material for these tanks is reinforced concrete. According to MARSHALL (1979), the life span of reinforced concrete septic tanks is 20 years.
Guidelines for the location of septic tank systems, as suggested by KALBERMATTEN et al., (1980), are tabulated in Table 5.3. These guidelines should be considered in siting septic tanks as much as possible.
79
Table 5.3 Minimum Distance Requirements for Septic Tanks and Soakage Pits in Common Well-Developed Soils
Item Septic tank Soakage pit (m) (m)
Buildings 1.5 3.0
Property boundaries 1.5 1.5
Wells 10.0 10.0
Streams 7.5 30.0
Cuts or embankments 7.5 30.0
Water pipes 3.0 3.0
Paths 1.5 1.5
Large trees 3.0 3.0
The selection of soakage pits for use in the disposal of septic tank effluent was based on the economy of its cost and space requirements. The types of soil in Chonburi are mainly sandy loam, loamy sand, and sandy. The average infiltration rate of 0.1 m3/(m2. d) was adopted with a reasonable safety factor as the design criteria of soakage pits. A circular tank built from open-joint bricks shall be used to allow for the maximum seepage of septic tank effluent into the surrounding rocks and soil.
5.1.4 Design of Septic Tank System
(a) Household Septic Tank System (Equations 5.1, 5.2, and 5.3)
A = Pnfs = 7 x 1 x 1.3 x 40 = 364 1
where, A = required sludge storage capacity, 1 P = 7 person/household f = 1.3 s = 40 l/(c.a) n = 1 year
B = Pqt = 120 x 7 x 1 = 840 1
where, B = required liquid retention capacity in 1 q = 120 l/(c.d) t = 1 d
C = A + B = 364 + 840 = 1204 1
where, C = required volume of septic tank, 1
80
Septic tank effluent to soakage pit= 120 x 7
= 840 1/d
Infiltration rate = 0 . 1 mJ/(m2.d)
Required area for soakage pit = 0.84/0.1 = 8.4 m2
- Use 1 septic tank: 0.65 x 2.00 x 1.30 m (width x length x depth)
capacity = 1230 1 (Figure 5.5)
- Use 1 soakage pit: 1.50 x 1.80 m (diameter x depth),
surface area of pit (side wall and bottom) = 10.3 m2 (Figure 5.5)
The cost estimates for the household septic tank and soakage pit are given in Tables 5.4 and 5.5, respectively. The total cost includes material and labour cost with about 10% allowance for cost fluctuation. Cost estimation was based mostly on CONTRACTORS ASSOCIATION OF THAILAND, (1987).
Total unit cost of a household septic tank/soakage pit (from Tabs. 5.4 and 5.5) therefore:
6,200 + 5,600 = 11,800 Baht
(b) Institutional Septic Tank System
. A standard septic tank unit was designed to treat wastewater from commercial and institutional establishments. The treatment capacity of this standard unit is 0.1 1/s (8.64 m3/d) .
From (Equation 5.4)
C = 1,125 + 0.75 Q = 1,125 + 0.75 x 2283 = 2,837 gal (10.74 m3)
net volume of septic tank, gal 2283 gal/d (8.64 m3/d)
The required area of soakage pit •= 8.64/0.1 = 86.4 m2
- Use 1 septic tank : 1.4x5.7x1.7m (width x length x depth)
capacity = 10.78 m3 (Figure 5.6 a,c,d)
- Use 4 soakage pits, each with the dimension of 3.0x2.0 m (diameter x depth)
surface area of 4 soakage pits (side wall and bottom) = 90.6 m2 (Figure 5.6b)
where, C = Q =
81
Table 5.4 Cost Estimation of the Household Septic Tank
Item
Excavation
Compacted sand
Reinforced concrete work
Plastering
Piping work
Total Allowance Unit cost
Quantity
6.5 m'
0.6 m3
1.4 m3
10.2 m2
1 set
Material (Baht)
= 5650 Baht = 10 % = 6,200 Baht/tank
-
60
3000
60
290
cost Labor cost (Baht)
330
60
1400
250
200
Table 5.5 Cost Estimation of the Household Soakage Pit
Item Quantity Material cost Labor cost (Baht) (Baht)
Excavation
Brick work
Compacted sand, rock fill,cover
Reinforced concrete work
Piping work
Total Allowance Unit cost
soil
13.0 mJ
8.5 m2
7.9 m3
0.5 m3
1 set
= 5,050 = 10 % = 5,600
Baht
Baht /pit
-
960
1000
1050
120
650
430
240
500
100
100
ft- 1300 CO 600 100
M "" 11 3000-5000
Inlet Asbestos Cement
Pipe 6 100 mm
•M
Vent Golvonized Steel Pipe 025mm 100
100
(a ) Plan
0150 , 0500 A i 0400 ,
-r T^T \ +
Access Openntng
IE
Outlet Asbestos Cement Pipe 0100 mm
Vent
Ground Level
f*W 400
Compacted Sand
(b ) Cross Section
Rock Fill (20 -30
Brick Wall (Open Joints)
Figure 5.5 Household Septic Tank - Soakage Pit (All units in mm)
83
o
Inlet Pipe 0150 mm
Septic Tank
6000
H . . Asbestos Cement U / / Pipe 0 150 mm
0 3500 7000
( o) Plan of System
Distribution Box
Soakage Pit
Ground Level
f-
-Opening
\ * « 0 0 , / *
\ /
Sookoge Pit
0 3000
0 2200
wsmfe&^^'*m8mm®m Compacted Sand
Cover Soil 400
Rock Fill rd (20-30 mm 01
Brick Wall
(Open Joints)
( b) Cross Section of Sookage Pit
Figure 5.6 I n s t i t u t i o n a l Septic Tank with Four Soakage P i t s (All un i t s in mm)
150. rr 2700 100 1400 100
Outlet Asbestos Cement Pipe
1400 l 5 °
Inlet Asbestos Cement Pipe 0 150 mm
sr or 200
m>.
8
±=,7 iio 8
Cc) Plan of Septic Tank
0600 z. • *
Access Opening
, 0 600
100
Sefic Tank
Compacted Sond
(d) Cross Section Figure 5.6 (Cont'd)
Vent Galvanized Steel Pipe 025 mm
•!• "400 y ~ Vent
1 K
JJ50.
2
00
85
The cost estimates for the institutional septic tank and soakage pit are given in Tables 5.6 and 5.7, respectively. The total cost includes material and labor costs, with about 10% allowance for cost fluctuation. Cost estimation was based mostly on CONTRACTORS ASSOCIATION OF THAILAND, (1987).
Table 5.6 Cost Estimation of Institutional Septic Tank
Item
Excavation
Compacted sand
Reinforced concrete work
Plastering
Piping work
Total Allowance Unit cost
Quantity
35.7 m3
1.5 m3
4.0 m3
23.6 m2
1 set
= 15,670 = 10% = 17,200
Material cost (Baht)
Baht
Baht/tank
-
140
8,400
130
340
Labor cost (Baht)
1,790
80
4,000
590
200
Table 5.7 Cost Estimation of Institutional Soakage Pit
Item Quantity Material cost Labor cost (Baht) (Baht)
Excavation
Brick wall
Compacted sand, rock fill,cover soil
36.4 m3
18.9 m2
13.5 m3
Reinforced concrete 1.8 m3
work
Piping work 1 set
2,090
1,440
3,780
120
1,820
940
410
1,800
100
Total For 4 soakage pits Connecting pipe, distribution box Total cost Allowance Unit cost Total unit cost of institutional septic tank/4 soakage pits (from Tabs. 5.6 and 5.7) therefore: 17,200 + 56,100
The typical existing cesspool system in -Chonburi consists of two soakage pits as shown in Figure 5.2. A detailed cost estimate is given in Table 5.8. The total cost includes material and labor costs, with about 10% allowance for cost fluctuation.
Table 5.8 Cost Estimation of Cesspool System
Item
Excavation
Broken brick
Concrete ring 0.8x0.4 m (diameter x depth)
Reinforced concrete work
Piping work
Quantity
3.0 m3
0.15 m3 '
8 rings
0.13 m3
1 set
Material cost (Baht) .
'. - ••
50
480
280
120
Labor cost (Baht)
150
50
150
130
100
Total
Allowance Unit cost of cesspool
1510 Baht (excluding toilet and super structure) 10% 1,700 Baht
5.1.5 Construction Costs of Septic Tank System
In this case study, it was assumed that all the existing cesspool units would be improved and converted to septic tank units. It is assured that the 25% increase in basic unit cost is added for construction works, i.e. tax, profit, construction supervision, and other related expenses. Since the septic tank construction will be separately distributed to many small local contractors and the work period is relatively short, this .allowance is quite reasonable. The construction unit cost of the household septic tank system and the. institutional septic tank system are therefore 14,750 and 91,625 Baht, respectively. The construction cost of septic tanks/soakage pits for the four wastewater treatment options considered are given in Table 5.9.
87
Table 5.9 Construction Costs of Septic Tanks/Soakage Pits
Domestic sources
Option Population No. of Total household cost septic tanks
Small Bore 16,900 2,414 35,606,000 5.7 Sewerage Option
Septic 105,770 105,770/7 222,872,000 75.8 Tank =15,110 Option
57
57
5,223,000
741 67,894,000
5,223,000
758 69,452,000
5.2 Septage Collection
5.2.1 Septage Quantity and Collection Fee
The frequency of desludging for all septic tanks shall be once a year. The septage accumulation rate from domestic sources was taken as 40 l/(c.a). The quantity of septage from institutional sources was taken in proportion to the flow rate. For an institutional septic tank receiving a flow rate of 8.64 mVd, the septage produced is therefore equal to (8,640/120) x 40 = 2,880 1/a. The septage quantities for the four wastewater treatment options are summarized in Table 5.10.
The septage collection rates adopted throughout Thailand, according to the PUBLIC HEALTH ACT (1985), are as follows:
Normal rate Less than 0.5 m3
More than 0.5m3 but less than 1.0m5
- 250 Baht/m3
- 150 Baht
- 250 Baht
According to the above rates, the septage collection fee for each household septic tank ( 0.28 m3, collected once per year) is 150 Baht while the septage collection fee for each institutional septic tank (2.88 m3, collected once per year) is 750 Baht.
The fee for Small Bore Sewerage Option is assumed to be equal to that for Septic Tank Option. The total collection fees of septage for the four options are summarized in Table 5.11.
88
Table 5.10 Septage Quantity . . .
From household From institutional Total Option septic tank septic tank m3/a
(m3/a) (mVa) (mVd)
Maximum 16,900 x 40 Sewerage =676 57 x 2.88 = 164 840 (2.3) Option 1,000
Minimum 67,770 x 40 Sewerage = 2,711 741 x 2.88 = 2,134 4,845 (13.3) Option 1,000
Septic 105,770 x 40 Tank = 4,231 758 x 2.88 = 2,183 6,414(17.6) Option 1,000
Remark * For the small bore sewer system, wastewater will be discharged
into interceptor tanks prior to flowing into the sewer. The septage will accumulate in these tanks which would need periodic emptying. The sludge characteristic as well as the accumulation rate are similar to those of septic tanks. The septage collected from household interceptor tanks (population served 88,870) is (88,870 x 40/1,000 = 3,555 ra'/a.
Table 5.11 Collection Fee of Septage
Option Household Septic Tank Institutional Septic Tank
No. of Fee No. of Fee Tanks (Baht/a) Tanks (Baht/a)
Small Bore Sewerage 2,414+ 2,266,000 57+ 568,000 Option Interceptor Interceptor
tanks tanks Septic Tank 15,110 2,266,000 758 568,000 Option
89
5.2.2 Operating Cost of Septage Collection
The desludging facilities proposed in this project are vacuum trucks. The 3 m capacity truck equipped with a 100-Hp diesel engine was selected, since it can easily travel through the narrow roads of Chonburi. The collection team shall include one driver who shall also be responsible for issuing the fee document after completing the septage collection task. There are two laborers who shall perform desludging tasks such as connecting and disconnecting the suction hose and cleaning. The average collection time taken is 40 minutes per household including travel to the next house. On a one-shift working period (8 h/d), about ten household septic tanks can be emptied in a day, with one trip to the septage treatment plant. For institutional septic tanks, more than one trip to the septage treatment plant is possible since the collection time is greatly reduced. The fuel consumption during an average trip includes a 2-hour driving mode (consumption 10 1/h) and a 5-hour idling mode (consumption 3 1/h). The diesel price considered is 6.8 Baht/1 and the diesel consumption for an average trip of a vacuum truck is taken to be about 24 0 baht. The fuel costs of septage collection for the four wastewater treatment options considered are summarized in Table 5.12.
Table 5.12 Fuel <
Septage from
Option household septic tank (m5/a)
~osts of
No. of trip per year
Septage Collection
Septage from institutional septic tank (m'/a)
No. of trip per year
Total No. of trip per year
Fuel cost (Baht/a)
No. of truck
Maximum Sewerage 67 6 242 Option
164 57 299 72,000 1
Minimum Sewerage 2,711 969 Option
2,134 741 1,710 410,000 5
Small Bore Sewerage 4,231** 1,511 Option
2,183** 758 2,269 545,000 7
Septic Tank 4,231 1,511 Option
2,183 758 2,269 545,000 7
Remark * Estimated quantity of septage from ten household septic tanks and one institutional septic tank are 2.8 and 2.88 m3/a, respectively.
** Including septage from interceptor tanks
The cost of a fully-equipped vacuum truck is 420,000 Baht, while the yearly maintenance shall be 5% of the initial cost or 21,000 Baht. The salaries for the driver and laborer shall be 3,000 and 2,000 Baht/month, respectively.
90
1. CONTRACTORS ASSOCIATION OF THAILAND (1987), Material and Equipment Construction Price List Book 1987, Bangkok, (in Thai)
2. FEACHEM, R.G., BRADLEY, D.J., GARELICK, H. and MARA, D.D. (1983), Sanitation and Disease - Health Aspect of Excreta and Wastewater Management, John Wiley, Chichester.
3. KALBERMATTEN, J.M., JULIUS, D.S., MARA, D.D. and GUNNERSON, C.G. (1980), Appropriate Technology for Water Supply and Sanitation - A Planner's Guide, World Bank, Washington, D.C.
4. MARSHALL, P. (1979), Septic Tank Practices, A Guide to Conservation and Reuse of Household Wastewater, Anchor Press, New York.
5. PICKFORD, J. (1980), The Design of Septic Tanks and Aqua- privies, Overseas Building Notes, Information of Housing and Construction in Tropical and Sub-tropical Countries, No. 187, Overseas Division, Dept. of Environment, London.
6. POLPRASERT, > C. and RAJPUT, V.S. (1982), Septic Tanks and Septic Systems, ENSIC Review No. 7/8, Environmental Sanitation Information Center, Asian Institute of Technology, Bangkok.
7. PUBLIC HEALTH ACT (1985), Collection Fee of Refuse and Septage, in Report on Environmental Quality of Thailand-1985, National Environment Board, Bangkok, (in Thai)
8. SEATEC (1983), Report on Urban Sewerage and Excreta Disposal Planning for Chonburi, Thailand, SEATEC International Consultants, Bangkok.
9. U.S. DEPARTMENT OF HEALTH, EDUCATION AND WELFARE (1959), Manual of Septic Tank Practice, Public Health Service Publication No.526, U.S. Department of Health, Education, and - Welfare, Washington, D.C.
91
6. CENTRAL WASTEWATER TREATMENT
6.1 Septage Treatment
6.1.1 Introduction
Septage is generally defined as the liquid and solid materials which are pumped from septic tanks or cesspools. It contains high organic matters, solids as well as pathogens. In areas served by septic tank systems, septage treatment facilities must be provided. There are various septage treatment processes. Anaerobic digestion and pond systems offer two of the most promising technologies for septage treatment. During anaerobic digestion, the degradation of organic materials in the absence of oxygen produces combustible methane gas or "biogas". Two alternatives are suggested for the anaerobic digestion of septage in Chonburi, i.e. through anaerobic digesters and anaerobic ponds. The anaerobic digester maintains biochemical reactions in an enclosed concrete tank having provision for gas storage at the upper part of the digester. Biogas can either be utilized in the treatment plant or nearby community. The anaerobic ponds provide sufficient retention time for anaerobic digestion to occur while the gas produced is directly released into the atmosphere. The effluent' from both digestion processes (via anaerobic digesters and anaerobic ponds) is further treated in facultative ponds prior to discharging. The dry sludge cake produced from the digestion process is rich in nutrients and is suitable for use as a soil conditioner. This "<8-Q.il conditioner shall be freely distributed to the nearby farmers. The flow diagram of septage treatment plants applying the two mentioned alternatives is shown in Figure 6.1.
Septage characteristics in this case study are assumed to be similar to those of Bangkok septage as given in Table 6.1 (LIU, 1986):
Septage shall be unloaded from vacuum trucks, passed through a coarse screen, and stored in the sump. It shall then be pumped to anaerobic digesters where organic matters shall be oxidized into methane and other end products. The anaerobic process shall be enhanced by slurry mixing with a circulation pump. The supernatant from the digester, withdrawn during the no-mixing interval, would still contain high organic content and shall be treated further in a facultative pond before its disposal into a receiving water body. The digested sludge shall be discharged into sludge drying beds. Seven drying beds shall be provided, with one bed being used per day. The dry sludge cake shall be removed daily.
Figure 6.1 Schematic Diagram of a Septic Treatment Plant
Table 6.1 Septage Characteristics
93
Parameter Unit Range Design value
PH
BOD5 mg/1
COD mg/1
Suspended solids (SS)mg/l
Volatile suspended solids (VSS) mg/1
Total solids (TS) mg/1
Total volatile solids (TVS)
Total coliforms
Fecal coliforms
mg/1
MPN/100 ml
MPN/100 ml
6.9-8.2
802-4,040
4,981-32,149
3,720-24,132
3,040-18,020
5,122-25,400
-
1,700
15,200
12,500
8,700
13,800
3,296-19,300
7.9 x 10' -1.7 x 10"
2.0 x 10⁵ -4.9 x 10⁷
9,500
Design Criteria
The following design criteria, based mostly on BROWN PRAKASAM (1985), were adopted :
Anaerobic digester liquid retention time
Gas storage at the upper part of digester (fixed cover)
Gas generation rate
Maximum quantity of sludge discharging to drying bed
Maximum quantity of dry sludge cake (25% solids)
BOD5 removal in digester
Inflow to facultative pond
Surface organic loading rate to facultative pond
Construction Material
= 40 d
30 % of daily yield
= 0.2 m7(kg TVS.d)
= 40 % of septage quantity
= 5 % of septage quantity
= 90 %
= 70% of septage quantity
= 70 kg BOD5/ (ha.d)
and
Reinforced concrete shall be used for the construction of sump and anaerobic digesters. Brick walls shall be used for sludge drying beds. Facultative pond shall be earthen without bottom and wall lining.
94
Sizing of Septage Treatment Plant
The size of septage treatment units (Alternative 1) and their associated costs are summarized in Table 6.2. The total estimated cost includes material and labor cost, with about 10% allowance for cost fluctuation.
Table 6.2 Sizing of Septage Treatment Units and their Associated Costs (Alternative 1.)
Drying bed area required (0.2 m sludge depth) m2/d
Use 7 beds
100
650
65,000 Bant/tank x 1 tank
0.9
4.5
270
650
175,500 Baht/tank x 2 tanks
5.3
26.5
240
650
156,000 Baht/tank x 3 tanks
7.0
35
with total area
Drying bed unit cost*
Drying bed cost
m2
Baht/m2
Baht
Estimated dry sludge cake (25% solids) m3/d
Inflow to facultative pond
BOD5 load (influent BOD5 = 170 mg/1)
Required pond area
Use - pond volume (1.5m depth)
m3/d
kg/d
m2
m3
35 mVset x 1 set (1-phase construction)
550
19,250 Baht/set x 1 set
0.1
1.6
0.27
39
60m3/pond x 1 pond (1-phase construction
100 m2/set x 2 sets (2-phase construction)
550
55,000 Baht/set x 2 sets
0.7
9.3
1.58
226
180 mVpond x 2 ponds (2-phase construction
90 mVset x 3 sets (3-phase construction)
550
49,500 Baht/set x 3 sets
0.9
12.3
2.09
299
160 mVpond x 3 ponds (3-phase construction
Pond unit cost Baht/m3 50 50 50
96
Table 6.2 (Cont'd)
Maximum Minimum Small' Bore Sewerage Sewerage Sewerage
Item Unit Option Option Option/ Septic Tank Option
Pond cost Baht 3,000/pond 9,000/pond 8,000/pond x 1 pond x 2 ponds x 3 ponds
Estimated cost Baht 1,000/phase 2,000/phase 2,000/phase of piping work x 1 phase x 2 phases x 3 phases
Estimated cost of pump - I n l e t • • •
- Mixing
Total Construction cost (including 10% allowance)
Land requirement
Land unit cost
Land cost
Total Cost of Sep-tage Treatment Plant*"
Baht
Baht
Baht
ha
Phase Phase Phase
Baht/ha ..
Baht
Baht Phase Phase Phase
5,000/set x 2 sets
5,000/set x 2 sets /digester x 1 digester
1-126,000 II III -
0.02
937,500
19,000
1-176,000 II III
5,000/set x 2 sets
5,000/set x 2 sets /digester x 2 digesters
301,000 277,000
-
0.08
937,500
75,000
451,000 346,000 ' -
5,000/set x 2 sets
•5,000/set x 2 sets /digester x 3 digesters
279,000 248,000 248,000
0.14
937,500
131,000
480,000 310,000 310,000
Remark * Unit cost excerpted from ENGINEERING CONSULTANCY SERVICES CENTER (1986).
**Biogas contains about 60 % methane and has density of 1.22 kg/m3. Energy value ratio of methane and butane (representing LPG) is approximately 0.31. Unit cost of LPG is 6 Baht/kg. The unit cost of biogas is about 1.4 Baht/m3.
***The 25% increase in total construction cost is added for construction works, i.e. tax, profit, construction supervision and other related expenses
97
Operating Cost
The operating cost of the septage treatment plant (Alternative 1) is given in Table 6.3.
Table 6.3 Operating Cost (Alternative 1)
Item Unit
Maximum Sewerage Option
(Baht/a)
Minimum Sewerage Option
(Baht/a)
Small Bore Sewerage Option/Septic Tank Option (Baht/a)
Technician 3,000 Baht/month 36,000
Labourer 2,000 Baht/month 24,000
15,000 Water quality analysis
Treatment plant maintenance
Total Operating Cost
10,000
85,000
36,000
48,000
15,000
20,000
119,000
36,000
48,000
15,000
24,000
123,000
Location of Septage Treatment Plant
The septage treatment plant shall be located in the same site of the municipal wastewater treatment plant.
BOD, and Fecal Coliforma Removal
LIU (1986) found that the BOD5 removal in an anaerobic pond (retention time = 10 d) is approximately 90%. The anaerobic digester in this study has a retention time of 40 days. Hence the efficiency of BOD5 removal should be better in the anaerobic digester than in the anaerobic pond. For design purposes, a BOD5 reduction of 90% was selected. The calculation example for Maximum Sewerage Option is presented as follows:
Septage flow rate
BOD5 of septage
BOD5 removal in anaerobic
= 2.3 m3/d
= 1,700 mg/1
= 90% digester
BOD5 of supernatant effluent and filtrate from sludge drying beds= 170 mg/1
Inflow to facultative pond = 70% of septage flow rate (assumption)
1.6 m3/d
98
170 x 1.6 BOD5 load to facultative pond = 0.27 kg/d
(In tropical climates, the surface organic loading rate ranging from 200 to 300 kg/(ha.d) is generally applicable. Due to high fluctuation in septage characteristics, the lower value, i.e. 70 kg/(ha.d), was chosen, which includes about 3 to 4 times of the safety factor.)
0.27 x 10,000 Pond area required = = 38.6 m2
70
Use - pond volume = 60 m3
pond depth = 1.5 m
pond surface area = 40 m2
retention time = 60/2.3 =26.1 d BODb removal in facultative pond
= 0.725 x (surface organic loading rate) + 10.75 (McGARRY and PESCOD, 1970)
0.725 x 70 + 10.75 ..
61.5 kg/(ha.d)
61.5 x 100 BOD5 removal efficency = = 87.9%
70
BOD5 in effluent of facultative pond = 170 x 0.121 =20.6 mg/1
Maximum fecal coliforms in septage = 4.9 x 10⁷ MPN/100 ml Fecal coliforms removal is assumed to follow first-order.kinetics with a removal rate (k) of 4.0 d"1.
Fecal coliforms in effluent of anaerobic digester, N„ = 1 + kt
where: Nt = influent concentration, 4.9 x 10⁷ MPN/100 ml
N„ = effluent concentration, MPN/100 ml
k = 4 d"1
t = 40 d
4.9 x 10' N. = — = 3.04 x 10s MPN/100 ml
1 + 4 x 40
99
Fecal coliforms in effluent of facultative pond, N„ =
1 + Jet
where: N, = influent concentration, 3.04 x 10⁵ MPN/100 ml
N« = effluent concentration, MPN/100 ml
t = 26.1 d
3.04 x 10 N« = = 2,884 MPN/100 ml
1 + 4 x 26.1 The fecal coliforms concentration is within the acceptable level
(5,000 MPN/100 ml) as suggested by MARA (1976). 6.1.3 Septage Treatment - Alternative 2
(Anaerobic pond, facultative pond)
As shown in Figure 6.1, there are three parallel anaerobic ponds which shall be operated in sequence. The hydraulic retention time (HRT) of each anaerobic pond is taken to be 10 days. Septage shall be pumped daily from the sump into only one anaerobic pond for about one month. At the HRT of 10 days, it was found that a one-month sludge accumulation occupies approximately 35% of the pond volume (LIU, 1986). After one month of septage feeding, the pond shall be subject to sludge drying, while the incoming septage will be loaded into the next anaerobic pond. After about one to two months, the pond mud should be dewatered and sun-dried to some extent. The sludge cake shall be transferred manually to the pond dike for further drying and later collected by the nearby farmers. The anaerobic pond effluent shall be treated further in the facultative pond.
Design Criteria (Based mostly on MARA, 1976 and LIU, 1986)
Anaerobic pond retention time = 10 d
BOD5 removal in anaerobic pond = 90%
Surface organic loading rate to facultative pond = 70 kg BOD5 /(ha.d)
Fecal coliforms removal in anaerobic and facultative ponds follows first-order kinetics with a removal rate (k) of 4.0 d"1.
Construction Material
All ponds shall be earthen without bottom lining. There shall be one-phased construction in all 4 sewerage treatment options considered.
Sizing of Septage Treatment Plant
The sizing of septage treatment units (Alternative 2) and their associated costs are summarized in Table 6.4. The total estimated cost includes material and labor cost with about 10% allowance for cost fluctuation.
100
Table 6.4 Sizing of Septage Treatment Units, and Associated Costs (Alternative 2)
Item Unit
Maximum Minimum Sewerage Sewerage Option Option
Small Bore Sewerage Option/Septic Tank Option
Septage quantity
Size of sump
Sump cost (including screening)
m3/a
m3/d
m3
Bant
840
2.3
3
6,000
4,845
13.3'
6
12,000
6,414
17.6
9
18,000
Anaerobic pond volume required m
Use-anaerobic m3 pond volume
Pond unit cost Baht/m3
23
25
50
133
140
50
Anaerobic pond cost Baht
BODj load to faculta-BOD~ = T70mg7i") kg/d
Facultative pond area required for BOD5 removal m2
Use-facultative pond volume
1,250/pond 7,000/pond x 3 ponds x 3 ponds
0.39
56
2.26
323
176
180
50
9,000/pond x .3 ponds
2.99
427
(1.5 m depth)
Retention time of facultative pond
Facultative pond cost
Estimated cost of piping work
Estimated cost of pumps
Total construction cost (including 10% allowance)
Land requirement
Land cost
Total Cost of Septage Treatment Plant
m3
d
Baht
Baht
Baht
Baht
ha
Baht
Baht
150
65.2
7,500
1,000
5,000/set x 2 sets
31,000
0.03
28,000
67,000
850
63.9
42,500
2,000
5,000/set x 2 sets
96,000
0.15
141,000
261,000
1,130
64.2
56,500
3,000
5,000/set x 2 sets
126,000
0.19
178,000
336,000
Remark: *The 25% increase in total construction cost is added for construction works, i.e. tax, profit, construction supervision and other related expenses.
101
Operating Cost
The operating cost of septage treatment plant (Alternative 2) is given in Table 6.5.
Table 6.5 Operating Cost (Alternative 2)
Item Unit
Maximum Sewerage Option
(Baht/a)
Minimum Sewerage Option
(Baht/a)
Small Bore Sewerage Option/Septic Tank Option (Baht/a)
Technician 3,000 Baht/month 36,000
Labourer 2,000 Baht/month
Water quality analysis
Treatment plant maintenance
Total operating Cost
15,000
36,000
24,000
15,000
36,000
24,000
15,000
3,000
4,000
8,000
83,000
10,000
85,000
BOD, and Fecal Coliforma Removal
The calculation example for Maximum Sewerage Option is presented as follows:
Septage flow rate = 2.3 m3/d
BOD5 of septage = 1,700 mg/1
BOD5 removal in anaerobic pond= 90% (LIU,1986)
BOD5 in effluent of
anaerobic pond = 1,700 x 0.1 = 170 mg/1
Inflow to facultative pond = 2.3 m5 /d
BOD5 load to facultative pond = 0.39 kg/(ha.d)
Surface organic loading rate = 7 0 kg/(ha.d)
Pond area required = 55.7 m2
BOD5 removal in facultative pond
BODt in effluent of facultative
87.9% (referred to Alternative 1)
pond = 2 0.6 mg/1
102
Fecal coliforms in effluent of anaerobic pond, -.....-•
Nt ' N. "
1 + kt where: Nt = 4.9 x 10⁷ MPN/100 ml
k = 4 d"1
t = 10 d
4.9 xlO' N. = — = 1.2 x 10' MPN/100 ml
1 + 4 x 10 Fecal coliforms requirement in effluent of facultative pond is at
most equal to 5,000 MPN/100 ml. Hence,
1.2 x 10s
5,000
1 + 4t
where: t = retention time of facultative pond, d
= 59.8 d Use - pond volume = 150 m3
- pond depth = 1.5 m - pond surface area - 100 m2
- retention time (t) = 150/2.3 = 65.2 d
6.1.4 Cost Evaluation of Alternatives
Alternative 2 (anaerobic pond, facultative pond) has lower construction and operating costs, hence this alternative is selected for all options.
6.2 Economic Analysis of Fish Culture in Waste Stabilization Ponds for the Selected System Options of Waste Treatment
6.2.1 Introduction
The primary objective of this section is the financial analysis of septage and sewage reuse in Chonburi as a case study to determine their financial viability. The technical feasibility of septage reuse has been assessed by means of a pilot demonstration project at the Asian Institute of Technology (AIT). In fact, much of the data in this section was based on actual experimental data obtained during the demonstration project, the text of which has been published by AIT. (EDWARDS et al., 1987)
The concept of septage or sewage reuse is one whereby human waste (excreta) is recycled by fish which are bred for animal feed or for direct human consumption. Septage or sewage reuse combines the waste stabilization pond method of sewage/septage treatment, which in its conventional form consists of anaerobic, facultative, and maturation ponds, with the traditional Asian system of using excreta as a fish pond fertilizer. Septage and sewage reuse exploit the fact that algae produced in stabilization ponds are a potential source of high-protein food for herbivorous fish such as tilapia which can be cultivated in these ponds.
103
6.2.2 Waste Treatment Alternatives
Five possible alternatives involving waste stabilization ponds for septage/sewage treatment of which four alternatives are with fish (tilapia) cultivation and one for septage/sewage treatment without fish cultivation, were considered in this study. Schematic pond layouts for the five alternatives using a septage loading of 20 m3/d are given in Figure 6.2. The five alternatives are as follows :
Alternative 1
Anaerobic pond, facultative pond, and maturation pond, designed solely for septage/sewage treatment without fish culture.
Alternative 2
Anaerobic pond, facultative pond, and maturation pond, designed primarily for septage/sewage treatment but with fish culture in the maturation pond.
Alternative 3
Anaerobic pond and facultative pond, as in Alternatives 1 and 2, with the maturation ponds designed without effluent to optimize fish culture in the maturation ponds.
Alternative 4
Anaerobic and maturation ponds only, designed without effluent to optimize fish culture in the maturation ponds.
Alternative 5
Maturation ponds only, designed without effluent to optimize fish culture.
For septage-loaded (from septic tanks) waste stabilization ponds, Alternative 1 has been found to be the most economical (for Bangkok, using a 20 mVd septage loading) and therefore shall be used as the proposed system for septage-loaded ponds. Comparing Alternative 1 with Alternatives 2, 3, 4, and 5, it is generally found that operating revenues earned through tilapia culture are worth less than the additional capital and operating costs borne due to the use of maturation ponds for tilapia culture (EDWARDS et al.,1987). The main factors contributing to this situation are the low market prices of tilapia for use as animal feed and the high cost of labor.
For sewage-loaded ponds, Alternative 2 shall be considered (although no actual research has been conducted on sewage reuse). The reasons are that, firstly, the design of waste stabilization ponds is based on Alternatives 1 and 2 only and, secondly, preliminary calculations indicate that this alternative is viable because of the large total production of tilapia from such large maturation ponds.
6.2.3 Design Assumptions
The following assumptions were used in the financial analysis of the various sanitation options (Maximum Sewerage Option , Minimum Sewerage Option, Septic Tank Option, and Small Bore Sewerage Option), as proposed in chapter 3.
Figure 6.2 Schematic flow diagrams of the various systems of septage treatment and treatment/reuse considered in the study
(a) Maturation fish pond system (b) Anaerobic, facultative and maturation ponds designed, solely for septage
treatment (c) As for (b) but with fish culture in the maturation pond (d) Anaerobic and facultative ponds design ,as in (b) and (c) but the maturation
. ponds designed without an effluent to optimize fish culture (e) As for (d) but without a facultative pond
A = anaerobic pond, F = facultative pond, M = maturation pond. Muturation fish pond system (a) based on experimental data but alternative septage stabilization pond systems 1-4 (b-3) are hypothetical. Drawn to scale.
105
For septage-loaded ponds, the design and costs of the stabilization ponds (based on Alternative 1) used for septage treatment have been covered in Chapter 6.1.2. Fish culture is not economically feasible for septage-loaded ponds for reasons stated above. Furthermore, the stabilization pond system proposed does not include maturation ponds, the only type of stabilization pond in which fish culture is feasible.
For sewage-loaded ponds, only the cost and revenues associated with fish (tilapia culture) in maturation ponds were considered, i.e. for costs, purchase of tilapia fingerlings and hire of labor; and for revenues, sale of tilapia as animal feed and for human consumption. Other costs and revenues associated with the waste ponds, such as pond excavation, piping, and land rent/cost, can be found in Chapter 6.1.
The project organization to manage and operate the waste ponds is the Chonburi municipality. Wage rates for hired manual labor were thus fixed at public sector rates.
Prices and rates quoted on fingerlings, labor, and tilapia were extracted from EDWARDS et al.(1987) .
In sewage-loaded ponds, fish (tilapia) shall be cultivated only in maturation ponds. The yield, in the absence of data, is assumed to be the same as in the AIT pilot project on septage reuse, i.e. at 7,000 kg/(ha.a). Harvesting of tilapia shall be done monthly by buyers who use their own labor and harvesting equipment. Stocking shall be done once every five years and the stocking density shall be 1 fingerling/ m2 of pond area.
There would be negligible sludge accumulation in the maturation ponds and thus there would be no need to drain the ponds for sludge removal. However, for practical purposes, it was assumed that draining shall be done once every five years for general cleaning and restocking of tilapia.
For sewage-loaded ponds, the sizes of maturation ponds are very large (see Table 6.6). In practice, if such sizes were to be used for fish culture, they should ideally be divided into a number of smaller ponds of about 2,000 m2. This would involve the redesign of the layout of the entire waste stabilization pond system and would also mean the recalculation of extra land and construction costs. But for the sake of simplicity, the need for redesign and recosting was not considered in this report.
The harvested tilapia can be sold as animal feed, for example, pelleted or meal feed for feeding carnivorous fish. Experimental results obtained during the pilot project on septage reuse at AIT indicated that tilapia fed on septage had relatively low concentrations of aerobic bacteria in their fish muscle and no fecal coliforms. For waste ponds based on Alternative 2, tilapia were not raised directly in sewage fed ponds but in maturation ponds which received the effluent from sewage-fed anaerobic and facultative ponds. Although no experimental research has been conducted on sewage fed waste ponds, concentrations of bacteria and coliforms would probably be similar to those in septage-loaded ponds. Thus, the tilapia raised in maturation ponds of Alternative 2 may be sold for direct human consumption based on public health considerations. But in Thailand, there is a social acceptability problem so this option of direct consumption by humans is best left as an academic possibility in this report.
Table 6.6 Population Served, Sewage/Septage Loading, and Maturation Pond Sizes of Sanitation Options under Consideration
Santitation option
Sewage/ Population septage served load(mVd)
Waste stabilization pond system proposed
Fish culture Maturation pond Type of system (Yes/No) size (m2)
Maximum Sewerage Option
Sewer Septic Tank
88,870 16,900
20,663 2.3
Alternative 2 Alternative 1
Yes No
68,900
Minimum Sewerage Option
Sewer Septic Tank
38,000 67,770
5,651 13.3
Alternative 2 Alternative .1
Yes No
18,800
Septic Tank Option
Sewer Septic Tank 105,770 17.6 Alternative 1 No
Small Bore Sewerage Option
Sewer Septic Tank
88,870 16,900
20,663 17.6
Alternative 2 Alternative 1
Yes No
68,900
107
6.2.4 Results
The results obtained from Table 6.7 indicate that an annual operating profit (amount is 116,556 Baht/a for the Maximum Sewerage Option, 14,352 Baht/a for the Minimum Sewerage Option and 116,556 Baht/a for the Small Bore Sewerage Option) in the range of about 0.8 Baht/m3 to 1.7 Baht/m3 of pond area and 0.01 Baht/m3 to 0.02 Baht/m3 of sewage can be made from tilapia culture in sewage-loaded ponds, even if tilapia were only sold as animal feed at 3 Baht/kg. If sold for human consumption, the annual operating profit would rise to about 9 Baht/m2 to 10 Baht/m2 of pond area and 0.08 Baht/m3 to 0.09 Baht/m3 of sewage.
Assuming that tilapia can only be sold as animal feed in Chonburi, it can be concluded that fish (tilapia) culture in sewage-loaded maturation ponds would be profitable. Fish (tilapia) culture in septage-loaded ponds would not be profitable based on the Thai situation and should not be undertaken. For fish culture in sewage-fed ponds, only minimal additional capital and operating costs would be necessary. In terms of amount of profit made from fish culture alone, the Maximum Sewerage Option and the Small Bore Sewerage Option would be the best options for tilapia culture. However, this conclusion is confined to fish (tilapia) culture as a unit of analysis by itself. As to which of the stabilization pond systems proposed among the sewerage treatment options fares best- as a system by itself, costs and revenues must be analyzed in their totality.
6.3 Conventional Wastewater Treatment
6.3.1 Design Criteria for Wastewater Treatment Facilities
6.3.1.1 General Considerations
Three different treatment processes namely the activated sludge process, aerated lagoon system (aerated lagoon followed by maturation ponds), and stabilization pond system (anaerobic pond followed by facultative and maturation ponds) were considered. The three selected processes respectively represent a technical, a half-technical, and a natural process, which are each substantially different with respect to their requirements for land, electro-mechanical equipment, and operation. The design of these treatment systems was based on the following assumptions:
Wastewater flow rate according to section 4.1.1.6
Infiltration/inflow = 20%
Per capita BOD5 contribution = 50 g/(c.d)
Influent bacterial concentration = 107 FC/100 ml
Minimum mean monthly temperature = 25° C
Effluent standards for disposal to sea:
BOD5 < 30 mg/1 FC/100 ml < 4000
The per capita BOD5 contribution of 50 g/(c.d) includes an allowance for industrial and commercial activities.
o 00
Table 6.7 Determination of Annual Costs and Revenues of Tilapia Culture in Maturation Ponds
Sanitation Haste stabil. Unit Total • Unit Total Unit Total Unit Total Amount By By Amount Pond Loading option pond system cost Q'ty cost cost Q'ty Cost price Q'ty revenue price Q'ty revenue Area Loading Area
(Bant/ (Baht/ (Baht/ (kg) (Bant/ (Baht/ (Baht/ (Kg/ (Bant/ (Bant/ (kg/ (Baht/ (Baht) (Baht/ (Baht/ (Baht) (Baht/ (Baht/ month) a) leg a) a) kg) a) a) kg) a) a) m") m') m*) m')
5-a)
Maximum Sewerage Option
Sewer Alternative 2 2000 Septic tank Alternative 1
Minimum Sewerage Option
Sewer Alternative 2 2000 Septic tank Alternative 1
Septic Tank Option
Sewer Septic tank Alternative 1
Small Bore Sewerage Option
Sewer Alternative 2 2000 Septic Tank Alternative 1
It is assumed that harvesting nets and labour for harvesting are not necessary because buyers engage their own workmen and harvesting equipment during harvesting. The labour hire rate is 2000 Baht/month, i.e. 24000 Baht/a. It is assumed that each pond system require 1 labourer for general maintenance such as monitoring water quality and removing dead or diseased fish. Tilapia yield is 7000 kg/(ha.a); farm-gate price (as animal feed) is 3 Baht/kg or 15 Baht/kg (for human consumption). Stocking of tilapia done once every 5 years at density 1 flsh/m1 of pond area. Price per tilapia fingerling is 0.3 Baht.
109
6.3.1.2 Site of Treatment Facilities
A study of the topography, rivers, road network, land use, and sewer network layout along with consideration of availibility of the land at reasonable prices in the study area determined the location of the treatment facilities. The site selected is shown in Figure 4.2. According to TISTR (1986), the land price at the chosen site is estimated to average about 150,000 Baht/rai for the whole area. The costs of treatment plants were estimated using this value as one case and a land price of 350,000 Baht/rai as another case. A comparison of costs shows the impact of an eventual increase of land prices, this frequently resulting from heightened development activities.
6.3.1.3 Design Criteria and Assumptions for Fond and Lagoon Systems
The main treatment processes occuring in waste stabilization ponds are sedimentation and aerobic/anaerobic bacterial decomposition. Detention time, temperature, algae concentration, and solar radiation have been identified as significant factors in the operation of pond systems (MARA, 1976; METCALF and EDDY, 1979; ARTHUR, 1983) . Design procedures are derived mostly on the basis of either detention time, temperature, or solar radiation and from experience with the operation of a wide variety of individual ponds and pond systems. From among the numerous methods proposed in literature, the design guidelines suggested by ARTHUR (1983) for waste stabilization ponds and aerated lagoon systems were selected for use in this study. ARTHUR recommended the use of temperature-based methods in hot climates, although the relationship between ambient temperature and the reversion of the pond to anaerobic conditions and the subsequent reduction in effluent quality is still not clearly determined. It should be noted that the areal loading rates (kg BODs/(ha.d)) in facultative ponds resulting from the design criteria suggested by ARTHUR are considerably higher than those typically suggested by other authors (e.g. METCALF and EDDY, 1979). Also, experience with the operation of pond systems at AIT, Bangkok, suggests that the organic loading rates for facultative ponds, as determined by using the design equations of ARTHUR, are rather critical. However, the design procedures by ARTHUR are widely published and offer, therefore, a preferable basis for comparative studies.
The design criteria used are summarized below:
Anaerobic Ponds
A volumetric organic loading rate of 0.3 kg BODs/(m'.d) was used. A pond depth of 4 m was considered, this being about optimal from the point of view of treatment efficiency in anaerobic ponds.
Facultative Ponds
The design equation suggested by ARTHUR (1983) relates the areal loading rate, expressed in kg BOD5/(ha.d), with the average minimum monthly temperature:
T. = 20 T - 60 (6.2)
where T, is the areal loading rate in kg BOD5/(ha.d) and T is the average minimum mean monthly temperature. This equation, according to ARTHUR, provides a safety factor of 1.5 before complete failure. With a minimum mean monthly temperature of 25° C, this equation yields an areal loading rate of 440 kg BOD5/(ha.d). A pond depth of 2 m was considered.
110
Maturation Ponds
Maturation-ponds were designed with a detention time of 5 days for fecal coliform removal. First order kinetic reaction was assumed for fecal coliform removal and, for simplicity, the rate constant was assumed to be the same in all ponds. The respective, equations are as follows :
Bi Be = — — . (6.3)
1 + Kb(T) x t
and Kb(T) = 2.6 x 1.19T"" (6.4)
= 6.2 1/d
where Be and Bi are the effluent and influent bacterial concentrations in No.FC/100 ml, Kb is the removal rate constant in d"1, T is the temperature in °C, and t is detention time in d. The pond depth was set at 1.5 m.
Aerated Lagoon System
Two partially mixed aerated lagoons in a parallel arrangement followed by short detention period settling ponds which require frequent desludging was considered in the study. A four-day detention time was assumed for the partially mixed aerated lagoon. Power requirements for the aerators were taken as 4 W/m3. A lagoon depth of 3 m was considered. Three settling ponds with half the total required area each shall be provided in order to facilitate pond desludging. The detention period in the settling ponds, following detention in the aerated lagoon, was assumed to be 2 days. The depth of settling ponds was considered to be 2 m.
6.3.1.4 Design of the Activated Sludge Process
The area requirement for the activated sludge process was taken as 0.3 m2 per person. No further design criteria were required, since cost evaluation was based on cost statistics from activated sludge plants in Thailand. The related cost functions made use of the daily flow rate and BOD-load as input parameters.
The design criteria of treatment facilities are summarized in Table 6.8.
Table 6.8 Summary of Design Criteria for Wastewater Treatment Facilities
Parameter Unit Anaerobic Facultative Maturation Aerated Settling Activated ponds ponds ponds lagoon pond sludge process
BOD5-loading
- volumetric kg/(m'.d) 0.3
- aereal kg/(ha.d) 440
Detention time d 5 4 2
FC-removal rate 1/d 6.2
Depth m 4 2 1.5 3 2
Power required W/m3 4
Area required mVperson 0.3
112
6.3.2 Design of Conventional Treatment Facilities
Because cost functions depending on the flow rate and BOD load were used for the cost estimate of the activated sludge process, the main factors influencing the cost of pond systems were evaluated. These main factors are the required area, the pond volume as measures of the required excavation volume, and the aerators for the aerated lagoon system. The required pond area, the volume, and the number of ponds allow, furthermore, the evaluation of the length of roads and embankments.
The stabilization pond system consists of an anaerobic pond for pre-treatment, a facultative pond, and a maturation pond. The aerated lagoon system consists of parallel aerated lagoons and settling ponds, the latter designed for a short detention time yet more frequent sludge removal. For all systems, two parallel treatment streets were considered. Exceptions were made in the - case of the settling ponds of the aerated lagoon system. Three parallel settling ponds, each with half of the total required capacity, shall be located after two aerated lagoons. The provision of one settling pond more than the required number of aerated lagoons was intended to facilitate the desludging of settling ponds.
The dimensions of the pond systems for the stabilization pond and aerated lagoon system, based on the above assumptions and the design criteria discussed in Chapter 4 are given in Tables 6.9 and 6.10 respectively.
6.3.3 Cost Evaluation
The cost equations for the activated sludge treatment system were obtained from L0OSEREEWANICH (1983). In this report regression equations of capital as well as operation and maintainance costs of several treatment processes were developed after an analysis of 44 activated sludge plants located in the Greater Bangkok area. These cost equations are given as a function of design wastewater flow rate and BOD loading. The cost equations, adjusted so that results reflect 1986 price levels, are as follows:
Cc = exp (9.97 + 0.86 lnXx ) (6.5)
C„ = 47,980 + 144.1 X6 (6.6)
where Cc = Capital cost in Baht
C0 = Operation & maintenance costs in Baht/month
Xj = Design flow rate in m3/d
X, = BOD loading in kg/d
The capital cost derived by equation (6.5) represents the total construction cost. The operation and maintenance cost includes labor costs, costs incurred for energy consumed, and the repair and maintenance costs of the structures and mechanical equipments of the treatment unit.
113
Table 6.9 Main Dimensions of the Stabilization Pond System
Unit Maximum Minimum Small Bore Sewerage Sewerage Sewerage Option Option Option
ha
1 Flow rate
2 BOD-Load
Anaerobic ponds
3 Volume (0.3 kg BOD/(m3.d)
4 Detention time
5 Area (Depth = 4 m)
Facultative ponds
6 Area (440 kg BOD/(ha.d))
(removal in A) : 60%)
7 Volume (Depth = 2 m)
8 Detention time
Maturation ponds 9 Be (Kb(T)=6.2 1/d,
t=5 d)
10 Volume
11 Area (Depth = 1.5 m)
Total system
12 Pond area
13 Site area (1/0.75 x (12)) ha
14 Effluent BOD (92% removal) mg/1
mVd
k g / d
m5
d
ha
2 0 , 6 6 3
4 , 4 4 4
1 4 , 8 1 4
0 . 7 2
0 . 3 8
5 , 6 5 1
1 , 9 0 0
6 , 3 3 4
1 . 1 2
0 . 1 6
2 0 , 6 6 3
1 , 7 7 7
-
-
-
4.04 1.73 4.04
m3
d
8 0 , 8 0 0
3 . 9 1
3 4 , 6 0 0
6 . 1 2
8 0 , 8 0 0
3 . 9 1
FC/100 ml
m3
ha
ha
) ha
i l ) m g / 1
2 , 2 7 0
1 0 3 , 3 1 5
6 . 8 9
1 1 . 3 1
1 5 . 0 7
17
1 , 0 1 0
2 8 , 2 5 5
1 . 8 8
3 . 7 7
5 . 0 3
27
1 , 2 4 0
1 0 3 , 3 1 5
6 . 8 9
1 0 . 9 3
1 4 . 5 7
17
101
Note : Be = n (1 + Kb(T) t.) x=A
where t, '= detention time of anaerobic, facultative, and maturation ponds
114
Table 6.10 Main Dimensions of the Aerated Lagoon System
Unit Maximum Minimum Small Bore Sewerage Sewerage Sewerage Option Option Option
1 Flow rate m3/d 20,663 5,651 20,663
2 BOD-load kg/d 4,444 1,900 1,777
Aerated lagoon
3 Area (t = 4d, depth = 3 m) ha 2.75 0.75 2.75
4 Power required (4 W/m3) kW 330 90.4 330
5 Aerators No. x kW 10 x 33.6 4 x 22.4 10 x 33.6
Settling pond
6 Area (t = 2d, depth = 2 ID) ha 2.06 0.565 2.06 r
7 Provided area (1.5 x (6) ) ha 3.1 0.85 3.1
Total system
8 Pond area ha 5.85 1.60 5.85
9 Site area (1/0.75 x (9) ) ha 7.80 2.13 7.80
10 Effluent BOD (93% removal) mg/1 15 24 6
The cost of the construction and operation of activated sludge plants according to equations (6.5) and (6.6) respectively are given in Table 6.11. In the case of the Samll Bore Sewerage Option, the cost were reduced by 25% in order to account for the organic matter retained in the interceptor tanks. For the economic evaluation in Chapter 7, it was furthermore assumed that 40% of the construction cost are to be for electro-mechanical equipment. The presented cost estimates exclude land cost.
The construction costs of the stabilization pond and aerated lagoon systems were based on the main dimensions and on the same unit cost rates as for the proposed sewerage systems. The cost of aerators was again obtained from manufacturers.
The cost of the inlet pumping station, for all options and systems, was not included in the cost of treatment plants but was included already in the cost of the sewerage system. The inlet level of the treatment plants was assumed to be 1.2 m above ground level.. This should allow gravity flow in the pond systems and would entail pond construction requiring only limited soil transportation to and from the plant site.
115
Table 6.11 Construction and Operation Costs of the Activated Sludge Plants (Without land cost)
Item Unit Maximum Sewerage Options
Minimum Sewerage Option
Small Bore Sewerage Option
BOD kg/d 4,444
Flow rate m3/d 20,663
Construction cost Baht 109,639,100
Annual operation cost
Required area (0.3 m2/c)
Baht/a 8,260,300
ha 2.67
1,900
5,651
35,952,300
3,861,200
1.14
82,229,300
6,195,200
2.40
The construction and operation costs, minus land cost, of the various pond systems and sanitation options are given in Tables 6.12 to 6.16. Cost estimates including land cost for pond systems and sanitation options are given in Tables 6.17 and 6.18. Construction costs are given on the basis of two different rates for land cost. The higher rate of 350,000 Baht/rai was considered to determine the effect of an increase in land cost which may result from heightened development activities in the study area.
In all wastewater treatment options the aerated lagoon system exhibits an investment cost equal to or slightly lower than that of the stabilization pond system. However, including the annual operation cost which is 8 to 19 times higher for the aerated lagoon system, stabilization ponds are clearly the more economical solution. When the land cost was increased to 350,000 Baht/rai, the investment cost of the stabilization pond system became considerably higher than that of the aerated lagoon system. The resulting differences in investment cost between stabilization ponds and aerated lagoons are 9.8, 5.2, and 7.8 million Baht for the Maximum Sewerage, the Minimum Sewerage, and the Small Bore Sewer Options respectively. However, taking into account the resulting differences in annual operation cost which are 5.2, 1.4, and 5.2 million Baht respectively, stabilization ponds remain the more economical system. Additionally, the land to be occupied by the stabilization pond treatment system would necessarily be owned by the municipality. Any incremental increase, therefore, in the land value of the pond site would accrue to the municipality. The potential income from the resale of land in the future would be highest for the stabilization pond system since they occupy the largest land area. The stabilization pond system is, therefore, considered for further evaluation.
The investment costs of the stabilization pond system for the Maximum Sewerage, the Minimum Sewerage, and the Small Bore Sewerage Options are 275, 245, and 260 Baht per person respectively. Annual operation costs are 3.8, 4.9, and 3.2 Baht per person per annum respectively.
Table 6.12 Cost of Stabilization Pond System for the Maximum Sewerage Option
No. Description Unit' Q'ty Unit Cost Cost (Baht) (Bant)
Construction cost
1. Plant site office, laboratory, and pump control room - - . lump sum 500,000
2. Laterite road (4m wide) m 750 96 72,000
3. Excavation of ponds, compacted embankment, and disposal of . surplus material m3 99,270 55 5,459,850
4. Earth fill over embankment area and well ram with water
and consolidate-selected excavated material (0.3 m thick) m5 5,972 60 358,320
5. Interpond pipework, slice gate, etc. - - lump sum 500,000
6. Mechanical and electrical works - lump sum 500,000
Sum 7,390,170
Total construction cost (With 40% mark up allowance) 10,346,200
2. Repair and maintenance of pond structures (2% of total construction cost) 207,000
Total 335,000
Table 6.13 Cost of Aerated Lagoon System for the Maximum Sewerage and the Small Bore Sewerage Option
No. Description Unit Q'ty Unit Cost (Baht)
Cost (Baht)
Construction cost
1. Plant site office, laboratory, and pump control room
2. Laterite road (4 m wide)
3. Excavation of ponds, compacted embankment, and disposal of surplus material
4. Earth fill over embankment area and well ram with water and consolidate-selected excavated material (0.3m thick)
5. Interpond pipework, slice gate, etc.
6. Mechanical and electrical works
7. Surface aerators with electrical motor and accessories No
-
750
89,100
3,950
-
-
10
lump
lump
lump
500,
sum
96
55
60
sum
sum
000
500,000
72,000
4,900,500
237,000
500,000
500,000
5,000,000
11,709,500
16,393,300
Sum
Total construction cost (with 40% mark up allowance)
Operation and maintenance costs per annum
1. Labor : 5 operators (average salary of 32,000 Baht/a)
2. Repair and maintenance of lagoon structures (2% of total construction cost)
3. Energy consumption of surface aerators (@ 1.55 Baht/kWh)
4. Repair and maintenance of aerators (10% of energy cost)
160,000
327,900
4,562,200
456,200
Total 5,506,300
Table 6.14 Cost of Stabilization Pond System for the Minimum Sewerage Option
CO
No. Description Unit .Q'ty Unit Cost (Baht)
Cost (Baht)
Construction cost
1. Plant site office, laboratory, and pump control room
2. Laterite road (4 m wide)
3. Excavation of ponds, compacted embankment, and disposal of surplus material
4. Earth fill over embankment area and well ram with water and consolidate-selected excavated material (0.3 m thick)
5. Interpond pipework, slice gate, etc.
6. Mechanical and electrical works
lump sum
500 96
35,000
m
55
3,536 60
lump sum
lump sum
500,000
48,000
1,925,000
212,200
300,000
300,000
Sum
Total construction cost (with 40% mark up allowance)
3,285,200
4,599,300
Operation and maintenance costs per annum
1. Labour: 3 operators (average salary of 32,000 Baht/a)
2. Repair and maintenance of pond structures (2% of total construction cost)
96,000
92,000
Total 188,000
Table 6.15 Cost of Aerated Lagoon System for the Minimum Sewerage Option
No. Description Unit Q'ty Unit Cost (Bant)
Cost (Baht)
Construction coat
1. Plant site office, laboratory, and pump control room
2. Laterite road (4 m wide) m
3. Excavation of ponds, compacted backfill, and disposal of surplus material m
4. Earth fill over backfill and well ram with water and consolidate-selected excavated material (0.3 m thick) m
5. Interpond pipework, slice gate, etc.
6. Mechanical and electrical works
7. Surface aerators with electrical motor and accessories No
600
24,350
2,170
lump sum
96
55
60
lump sum
lump sum
400,000
500,000
57,600
1,339,250
130,200
200,000
300,000
1,600,000
Sum
Total construction cost (with 40% mark up allowance)
4,127,050
5,777,900
Operation and maintenance costs per annum
1. Labour: 4 operators (average salary of 32,000 Baht/a)
2. Repair and maintenance of lagoon structures (2% of total construction cost)
3. Energy consumption of surface aerators (@ 1.55 Baht/kWh)
4. Repair and maintenance of aerators (10% of energy cost)
128,000
115,600
1,216,600
121,700
Total 1,581,900
Table 6.16 Cost of Stabilization Pond System for the Small Bore Sewerage Option
No. Description Unit Q'ty Unit Cost (Bant)
Cost (Baht)
Construction cost
1. Plant site office, laboratory and pump control room
2. Laterite road (4 m wide)
3. Excavation of ponds, compacted backfill, and disposal of surplus material
4. Earth fill over backfill and wellram with water
and consolidate selected excavated material (0.3m thick)
5. Inter pond pipework, slice gate, etc.
6. Mechanical and electrical works
- lump sum
700 96
88,630
5,028
55
60
lump sum
lump sum
500,000
67,200
4,874,650-.
301,680'
500,000.
500,000
Sum
Total construction cost (with 40% mark-up allowance)
6,743,530
9,440,900
Operation and maintenance coats per annum
1. Labour: 3 operators (average salary of 32,000 Baht/a)
2. Repair and maintenance of pond structures (2% of total construction cost)
96,000
188,800
Total 284,800
121
Table 6.17 Investment Cost of Treatment Facilities
Maximum Minimum Small Bore Sewerage Sewerage Sewerage Option Option Option
Stabilization Pond System
Area (ha) 15.07 5.03 14.57
Land cost A (350,000 Baht/rai) 32,965,600 11,003,100 31,871,900
Land cost B (150,000 Baht/rai) 14,128,100 4,715,600 13,659,400
Construction cost (Baht) 10,346,200 4,599,300 9,440,900
Total treatment A (Baht) 43,311,800 15,602,400 41,312,800
Total treatment B (Baht) 24,474,300 9,314,900 23,100,300
Aerated Lagoon System
Area (ha) 7.80 2.13 7.80
Land cost A (350,000 Baht/rai) 17,062,500 4,659,400 17,062,500
Land cost B (150,000 Baht/rai) 7,312,500 1,996,900 7,312,500
Construction cost (Baht) 16,393,300 5,777,900 16,393,300
Total treatment A (Baht) 33,455,800 10,437,300 33,455,800
Total treatment B (Baht) 23,705,800 7,774,800 23,705,800
Activated Sludge Process
Area (ha) 2.67 1.14 2.40
Land cost A (350,000 Baht/rai) 5,840,600 2,493,800 5,250,000
Land cost B (150,000 Baht/rai) 12,503,100 1,068,800 2,250,000
Construction cost (Baht) 109,639,100 35,952,300 82,229,300
Total treatment A (Baht) 115,479,700 38,446,100 87,479,300
Total treatment B (Baht) 112,142,200 37,021,100 84,479,300
Table 6.18 Annual Operation Cost of Treatment Facilities in Baht per Person per Annum
Maximum Sewe rage Option
Minimum Sewerage Option
Small Bore Sewerage Option
Stabilization pond system 335,000 188,000 284,800
Aerated lagoon system 5,506,300 1,581,900 5,506,300
Activated sludge process 8,260,300 3,861,200 6,195,200
122
REFERENCES
1. BROWN, N.L. and PRAKASAM, T.B.S. (1985), Biomethanation, ENSIC Review No. 17/18, Environmental Sanitation Information Center, Asian Institute of Technology, Bangkok.
2. CONTRACTORS ASSOCIATION OF THAILAND (1987), Material and Equipment Construction Price List Book 1987, Bangkok, (in Thai)
3. ENGINEERING CONSULTANCY SERVICES CENTER (1986), Feasibility Study of Sewerage and Treatment Systems for Chonbun Regional City, Thailand Institute of Scientific and Technological Research, Bangkok.
4. FEACHEM, R.G., BRADLEY, D.J., GARELICK, H. and MARA, D.D. (1983), Sanitation and Disease - Health Aspect of Excreta and Wastewater Management, John Wiley, Chichester.
5. KALBERMATTEN, J.M., JULIUS, D.S., MARA, D.D. and GUNNERSON, C.G. (1980), Appropriate Technology for Water Supply and Sanitation - A Planner' s Guide, World Bank, Washington, D.C.
6. LIU, C.L. (1986), Anaerobic Lagoon Treatment of Septage, Master Thesis, No. EV-86-15, Asian Institute of Technology, Bangkok.
7. MARA, D.D. (1976), Sewage Treatment in Hot Climates, John Wiley, Chichester.
8. MARSHALL, P. (197 9), Septic Tank Practices, A Guide to Conservation and Reuse of Household Wastewater, Anchor Press, New York.
9. PICKFORD, J. (1980), The Design of Septic Tanks and Aqua-privies, Overseas Building Notes, Information of Housing and Construction in Tropical and Sub-tropical Countries, No. 187, Overseas Division, Dept. of Environment, London.
10. POLPRASERT, C. and RAJPUT, V.S. (1982), Septic Tanks and Septic Systems, ENSIC Review No. 7/8, Environmental Sanitation Information Center, Asian Institute of Technology, Bangkok.
11. PUBLIC HEALTH ACT (1985), Collection Fee of Refuse and Septage, in Report on Environmental Quality of Thailand 1985, National Environment Board, Bangkok, (in Thai)
12. SEATEC (1983), Report on Urban Sewerage and Excreta Disposal Planning for Chonbun, Thailand, SEATEC International Consultants, Bangkok.
13. U.S. DEPARTMENT OF HEALTH, EDUCATION AND WELFARE (1959), Manual of Septic Tank Practice, Public Health Service Publication No.526, U.S. Department of Health, Education, and Welfare, Washington, D.C.
1 2 3
7 . FINANCIAL ANALYSIS
7.1 Introduction
The objective of this chapter is to review the financial implications of each of the alternative sewerage systems under consideration. There are two main aspects to this review; firstly, to examine the cost implications for households covered by the systems; secondly, to identify the funding implications in terms of the required inputs from central government, local government and private individuals. Clearly the two aspects are interrelated in that the charges levied on households will depend on the structure and extent of government contributions to funding. The approach, which is outlined below, was intended to reflect this.
The approach to examining funding consisted of the following stages:
(a) determine the total capital and operating costs of each system;
(b) calculate the total revenue and the levels of charges levied on user-households required to fully cover all costs identified in (a), in the absence of government subsidies;
(c) by considering other charges currently levied on households assess whether users would be able to afford the charges calculated in (b); and
(d) based on the results of (c) and stated government policy on supporting infrastructure projects, determine the likely structure of funding of the project, the degree of government contribution, if any, and the levels of user charges implied by the funding structure.
Each of these stages is discussed in greater detail below.
7.2 Capital Investment and Operating Cost
Capital investment and operating costs are provided for the four alternative systems under consideration, namely:
(i) Maximum Sewerage Option - A conventional mains sewerage system using large bore sewers connected to treatment plants covering all but the areas with the lowest density of housing. Those households not connected to the mains systems will have their own septic tank.
(ii) Minimum Sewerage Option - Similar to the first option but with the coverage of the mains system restricted to the highest density areas. Thus a greater number of households will have their own septic tank.
(iii) Small Bore Sewerage Option - A system based on small bore sewers. Local separator tanks will separate liquid waste, which will flow through the sewers, from solid waste which is collected and removed periodically. The coverage of the main sewerage system is the same as under the Maximum Sewerage Option. Again each household not covered will have an individual septic tank.
124
(iv) Septic Tank Option - Under this system each household would have an individual septic tank installed.
Basic information on investment and operating costs has been extracted from Chapter 5 of this report. The analysis covers a 30 year period and uses 1986 constant prices. The systems are planned to be implemented over a seven year period to minimize disruption to the town's inhabitants. Results of the analysis are summarized in Table 7.1 and details are presented in Appendix 7.1 to 7.4.
Table 7.1 Capital Investment and Operating Costs
Maximum Minimum Small Bore Septic Tank Sewerage Sewerage Sewerage Option Option Option Option
Capital Investment (million Baht) - Central system - Individual septic tank
Operating Cost (million Baht per annum) - Central system - Septic tank
338
88% 12%
4.0
94% 6%
322
33% 67%
2.4
58% 42%
300
83% 17%
4.1
67% 33%
301
. 3% 97%
1.4
9% 91%
Each system will have two main components, a central sewerage system for areas of high housing density and a septic tank system for those households not covered by the central system. The extent of coverage of the central system depends upon the alternative selected. For example under the Maximum Sewerage Option, investment in the central system accounts for 88% of total expenditure and investment in individual septic tanks accounts for only 12%. Under the Septic Tank Option the central part of the system accounts for only 3% of investment. This will become of significance when the structure of funding of the investment is considered. This is because the central system couid be funded by the public sector, whereas individual septic tanks will probably be required to be funded by private individuals.
7.3 Required Revenue and User Charges
The initial method of calculating user charges has been to assume that the project is entirely self financing. That is the total annual revenue was calculated which will be required to fund all the estimated costs of the project over its assumed thirty year life. This is as if an agency were established to implement the project. This agency would be responsible for all expenditures and would be able to levy charges on all users. Under the full cost recovery concept the operating agency must collect revenue from households within the service area to cover investment, operating, maintenance and replacement costs of the system. There is the simplifying assumption in this initial analysis of not including the financing cost of funding the excess of expenditure over income in the early years of the projects.
125
Table 7.2 shows the required annual revenue necessary to cover all project costs of each option. It analyzes the required revenue into that required to cover the cost of the central system and that required to pay for individual septic tanks.
Table 7.2 Required Revenue
Maximum Minimum Small Bore Septic Tank Sewerage Sewerage Sewerage Option Option Option Option
Revenue 17 15 16 13 (million Baht per annum)
Revenue from - Sewer system 88% 41% 72% 0% - Septic tanks 12% 59% 28% 100%
This will be collected from households as an annual service charge. Under each system the charge will differ for two different groups:
households served by the central sewerage system households using individual septic tanks.
Households are allocated to each group according to the density of buildings in the area in which they are situated. The charge per household is calculated from the total cost of each part of the overall system divided by the number of households covered by that part of the system. The required service charges are set out in Table 7.3. This analyzes the service charge into two parts, one related to the operating costs and one necessary to cover capital expenditure.
Table 7.3 Service Charge per Household per Annum
Service charge per Maximum Minimum Small Bore Septic Tank household (Baht per Sewerage Sewerage Sewerage Option annum) for: Option Option Option
Households connected to central system - Operating cost 274 - Capital cost 911
Total annual service charge 1,185 1,
Households with septic tank Operating cost 150
- Capital cost 639
Total annual service charge 789
338 254 766 791
1,103 1,045
150 150 150 639 639 639
789 789 789
126
It can be seen that the service charges required to cover all costs of the proposed systems vary from around 800 Baht annually for households with septic tanks to around 1,200 Baht annually for households connected to the main sewers in the maximum sewerage system. Of this between 70% and 80% of the service charge is required to fund capital expenditure. The lowest cost system is the septic tank system which requires a service charge which is 67% of the service charge associated with the most expensive system.
7.4 Affordability of the Proposed Systems
To assess the affordability of the analysed systems the required full cost recovery service charges are compared with the average expenditure on other utilities. According to statistics relating to the Chonburi region, the average expenditure on electricity was 2,130 Baht per household in"1987 and the average expenditure oh water was 1,320 Baht. The full cost recovery service charge for the sewerage system would therefore be equivalent to between 37% and 55% of electricity : expenses and between 60% and 90% of water expenses, depending on the sewerage system selected. The introduction of the new system would therefore increase household utilities expense by between 23% and 34%, from 3,450 Baht to between 4,239 Baht and 4,635 Baht.
Local government current charges for the collection and disposal of garbage is 120 Baht per annum per household. The necessary service charge for the new sewerage system on a full cost recovery basis is therefore about seven to ten times the current charge for garbage disposal.
The implication of these calculations is that to introduce the proposed systems and set user charges to recover all costs would cause an intolerably high increase in the level of household expenditure on utilities. Considerable community resistance would be likely, particularly since the service charge would be a complete' innovation rather than an increase in an existing charge.
7.5 Capital Funding
Based on such considerations, it seems that the implementation of the proposed system on a full cost recovery basis is not affordable by the community. For the implementation to be successful there will therefore need to be financial support from central government, local government and/or aid agencies. The purpose of this section is to estimate the extent of available public sector funding and its impact on the required user charges.
In the 6th National Development Plan, central government set a policy to limit its contribution to local development projects to a maximum of 60% of the investment cost. The balance must be financed locally. Of the local funding the nature of this project implies that some private investment would be required. For example in private areas, lateral sewer connection to households and septic tanks should be paid for privately. It- is not practical for public sector to invest in this type of infrastructure.
127
Therefore it is now assumed that the projects would utilize central government sources of funds as far as possible within the maximum range set by government policy. Private individuals will be responsible for the investment occuring on their property and the balance of capital investment would be funded by local government. Table 7.4 shows the structure of project capital funding which would occur if individuals paid for appropriate investment on their property and the maximum government subsidy were received. The maximum conventional sewerage system could receive a maximum subsidy from central government of 203 million Baht, 60% of project investment cost and a further 33 million Baht, 10% of investment cost, from local government. The remaining 102 million Baht, would be supported by the private sector. The septic tank system will be dominated by investment by the private sector, which must fund 292 million Baht or 97% of total investment, the remaining 9 million Baht coming from the public sector.
Table 7.4 Structure of Capital Funding
Maximum Minimum Small Bore Septic Tank Sewerage Sewerage Sewerage Option Option Option Option
It is assumed therefore that the total capital cost of each option is fully covered by a combination of central government, local government and support from private sector investment. The annual service charge will therefore be needed only to cover operating expenses. However each household will also be required to make a one off capital payment to make up the private sector contribution to funding. The annual service charge and the contribution to capital required for each household are shown in Table 7.5.
Table 7.5 Annual Service Charge and Contribution to Capital per Household
Maximum Minimum Small Bore Septic Tank Sewerage Sewerage Sewerage Option Option Option Option
Households connected to central system (Baht) - Annual service charge 274 338 254 - One-off capital cost 4,815 3,885 6,189
Households with septic tank (Baht) - Annual service charge 150 150 150 150 - One-off capital cost 14,750 14,750 14,750 14,750
128
Thus when central government funding is introduced, the service charge for the septic system continues to be the lowest of the four options. However the actual total expenditure by private individuals is highest in the case of the septic tank system because almost all capital expenditure must be funded by private individuals. In the case of the Maximum Sewerage Option almost all capital expenditure is funded by the public sector. Even if the full capital cost of the project is subsidized, the required charge to cover the operating cost of a conventional sewerage service is double the current rate of charge for garbage collection and the required service charge for emptying the septic tank is 25% more.
12 9
8. INSTITUTIONAL ASPECTS
8.1 Introduction
The purpose of this chapter is to discuss the institutional factors to be taken into consideration during the construction or enhancement of a sewerage system. In particular the circumstances at the city of Chonburi are discussed, leading to recommendations on the implementation plan for the proposed project in that city. The chapter has been divided into four sections. Firstly, the existing regulations are reviewed, relating to both central and local government, to determine the adequacy of the legal framework to provide authority to implement the recommended system. Secondly, the structure of central and local government and other government agencies are described, including the communication linkages between them as they relate to the current project. Thirdly the steps necessary for the implementation of the system are set out and finally, the main obstacles that may delay that implementation are discussed.
8.2 Regulatory Background
Central government has introduced many laws to protect the environment, including laws to control:
Pollution of residential, industrial and agricultural areas; The discharge of waste into public places; and Pollution in canals and other waterways.
The most important laws which have a bearing on public health are:
- National Constitution of 1978, Section 65, National Environment Policy Act,
- City Planning Act, - Cleanliness and Orderliness of the Country Act,
The Maintenance of Canals Act, Navigation in Thai Waters Act.
The principal powers of local government derive from the Public Health Act which was enacted in 1941 for the prevention of diseases and the provision of health care. In section 6, the Act gives authority to local government to issue regulations to:
provide rubbish and waste collection in public and private places set up collection systems set collection fees prohibit the disposal of rubbish in public places that may reduce health and cleanliness undertake any other activities needed for the purposes of proper sanitation.
Municipalities may commission third parties to carry out any of the above activities under municipality supervision.
In Section 16 of the Act, local governments are authorized to give recommendations to land owners *to install, enhance or change sewerage systems. The owner must follow these recommendations within 30 days of receiving the notice.
130
Thus the existing' network, of laws, and in particular the Public Health Act gives adequate authority to local government to change or improve the sewerage system in Chonburi. No further amendment of regulations is required for the implementation of the recommended system. However, the implementation of the new sewerage system will require the support of the municipality council and this in turn will require that the local community accepts the need for the new scheme.
8.3 Institutional Factors
The proposed sewerage system covers Chonburi Municipality, Bang Sai Sanitary . Authority and Ban Suan Sanitary Authority. It is unlikely that local government could take full responsibility for the investment and operation of the sewerage system, raising all the necessary funds by itself from revenues and borrowings. . The implementation of this project seems to exceed local government's investment capacity since: .
the project requires capital investment of around 300 million Baht; revenue generated by local government is around 50 million Baht per annum; 10 million Baht per annum is available for allocation to development projects; and local government currently has reserves of 30 million Baht.
On the other hand, it is equally unlikely that central government would take responsibility for all investment and allow local government to operate the system. Central government has established a policy to increase the role of local government in urban development both in project identification and financing and in encouraging the introduction of user charges. This policy would be at variance with central government playing a leading role in the implementation of new infrastructure projects. Therefore the implementation of the proposed sewerage system is likely to be financed by a joint investment requiring the cooperation of both central and local government. This would require the project to be initiated by local government and to receive a subsidy from central government to provide part of the investment. Local government would be responsible for the operation of the system.
Local government may not have sufficient resources and expertise at present to undertake project design and management. Local government's main experience is currently in building construction, roads and drainage systems and they also have a capability in construction supervision. Hence technical assistance from central government or from foreign aid agencies would be required to carry out the system design for .this project. The municipality currently has three staff who are responsible for the door to door collection of the service charge for household garbage disposal. The systems currently in use could be enhanced to include collecting revenue for the new sewerage systems.
8.4 Roles of Agencies Involved
As discussed above the proposed new system will require the involvement of both central and local govenment to prepare and finance the project. There will therefore need to be cooperation between several central government agencies as well as the three local government agencies covered. The agencies likely to be concerned will be:
* Central Government Agencies
Office of the National Environmental Board (NEB) " Office of National Economic and Social Development (NESDB) Ministry of the Interior (MOI) Office for Urban Development (OUD)
* Local Government Agencies
Province (Changwat) Administration - Municipality
Sanitary Authorities.
Figure 8.1 presents the communication linkage between central and local government agencies. The main functions of these various agencies as related to the implementation of the proposed sewerage system are discussed below.
The office of the National Environmental Board (NEB) would play a major role in educating local government and the community as to the necessity of the new system; giving technical assistance in evaluating technical specification of treatment plants and drafting new regulations covering implementation. The office would also monitor the operation of the new sewerage system.
The office of National Economic and Social Development Board (NESDB) would coordinate the project feasibility study and would appraise the project for both financial and economic viability. They would consider the project in the context of national development policy based on the national resources and the priority of the project. If appropriate the office will give a recommendation to the Cabinet to support the project.
Ministry of the Interior (MOI) is responsible for the overall administration of the country in accordance with government policy and the provision of law. The governor of each province (Changwat) is appointed by MOI and coordinates between central government and the local governments within the province boundary.
MOI established the Office for Urban Development (OUD) in response to central government's policy of accelerating urban development. As part of this policy, The Regional Cities Development Programme (RCDP) was designed to accelerate growth in urban areas outside Bangkok. In support of this policy, OUD gives guidelines and technical assistance to local government, and serves as a coordinator between central and local government through the governor of each province. The office also administers project feasibility studies, economic and financing studies, arranges financial sources to fund projects and liases with NESDB to obtain approval for the implementation of projects. Since Chonburi is classified as a regional city under RCDP, OUD will play a major role in the implementation of the new sewerage system.
Each Municipality is a form of local government. The municipality council is elected every five years to administer and govern the municipality, give policy guidelines and allocate the budget. The council will appoint senior officers and assistants to supervise and undertake daily administration work. The municipality has authority to issue regulations subject to the approval of the governor.
Office of the Prime Ministry
Ministry of Interior Ministry of Science, Technology & Energy
Office of the National Economic and Social
Development Permanent Secretary Permanent Secretary
o_—s~.i&e
Formal Linkage
Communication Linkage
Organization Line
Supervision & Control
Policy & Planning
a—:tu* -\N W-A Office of the National
Environment Board
Local Administration Department
Office of Urban Development
Changwat Government
Governor
D i s t r i c t s man II U II
"L-ji^— f l -a..
Loca l Government /
fill
• i i n
i:
Changwat Administr i^. t ion Organizations
Munic ipa l i t ies
Sanitary D i s t r i c t s
Tambon Administra-t ion Organizations
Figure 8.1 Communication Between Government and Changwat Government
133
A Sanitary Authority is similar to a small municipality. Its functions are similar to those of a municipality. The Sanitary Committee are elected to govern the Authority area. The Sanitary Authority must report to central government through its Amphur (District) authority (a sub-division of the province) and the Provincial Governor.
It can be said that the existing government institutions and regulations are suitable for the proposed project. There is no need to create new agencies or regulations. However a resolution is required to be passed by the local government bodies to allow them to operate the new system and to implement a service charge in accordance with section 16 of the Public Health Act. The resources available to the local government may have to be enhanced before it could take full responsibility for the implementation and running of the new system. In the mean time technical assistance will be required from central government bodies.
8.5 Project Implementation
The major steps in project implementation showing the roles of the various agencies discussed above and how they interact are presented diagramatically in Figure 8.2.
Step 1: The local government development plan for the long and medium terms and the annual plan have been reviewed. These include plans to improve the drainage system but nothing concerning sewerage. A principal early task therefore is to gain the support of local government for the project so that it is included in development planning. NEB must therefore introduce to central and local government the idea of the project and educate them to its direct and indirect benefits. NEB could undertake this step with cooperation from the Department of Health. NEB commitment and support is very important to gain the backing of local government for the project.
Step 2: After local government has accepted the concept of the project, Policy and Planning Division must prepare a brief project description for the local government council to approve the project and integrate it into the long and medium term development plans.
Step 3: Local government can directly apply for funding from central government. The project will be implemented by local government which would apply for a specific subsidy from central government. However in the case of Chonburi, which is a Regional City, an approach through the Office of Urban Development (OUD) would be an easier way to obtain a subsidy from central government. Local government officers would discuss the project with OUD so that it can be included in the Regional City Development Programme (RCDP). OUD will then seek foreign aided technical assistance in conducting a feasibility study of the project covering the technical, economic and financial aspects.
134
Step ONEB
Educate
Local Government Approve Development
Plan
OUD
Feasibility Study
OUD/NESDB
Project Appraisal
Cabinet Approval
I OUD
Detail Design
Local Government, ONEB Promotion, Annual Regulations
Central Government Local Government
Annual Budget Approval
Local Government
Construction Bidding
Contractor
Commence Construction
10 Local Government
Operation
Figure 8.2 Implementation of Sewerage System
135
Step 4: All projects are subject to project appraisal by NESDB. NESDB will consider individual projects, evaluating their direct and indirect benefits, financial return and economic return. Each project will be assigned priority according to the benefits which it offers. NESDB will then give recommendations to Cabinet to approve the implementation of selected projects, according to the resources available.
Step 5: In response to these recommendations Cabinet will give approval for the implementation of projects. This approval will specify the maximum budget for the project, the proportion of funding to be contributed by central government and local government and sources of financing including for example revenues, reserves, commercial loans and loans from the Municipality Development Fund (MDF).
Step 6: With foreign technical assistance, OUD will undertake the detailed design of the proposed system and obtain a cost estimate for inclusion in the annual budget. At the same time local government can prepare an amendment to its regulations to allow a change to the sewerage system and to enforce community use of the new system after implemention. A promotion programme should be planned to educate the community as to the advantages of the new system and its cost to them. The programme should take account of possible resistance from the community and should identify ways of overcoming that resistance.
Step 7: An annual financial plan, showing sources of financing for the project, will be prepared by both local and central government. OUD must coordinate, through the provincial governor, the annual budget preparation to ensure consistency between central and local government.
Step 8: Local government will carry out a bidding process involving developers interested in project construction. This will involve; preparing a detailed technical specifications of the project; timescale and budget; issuing an invitation to submit bids and evaluating those bids.
Step 9: Selected contractor commences construction under local government supervision according to the agreed specifications.
Step 10: Local government recruit and/or train staff and establish an administrative structure for the operation of the system. This should cover system operations, system maintenance, revenue collection and monitoring of the system. Local government may utilize its garbage disposal revenue collection system to collect service charges for the new sewerage system.
An action plan which lists out all major tasks, responsible agencies, indicative time required and timing of implementation is illustrated in Figure 8.3.
I P lanning
1. I n i t i a t e P r o j e c t
2 . Approve Developmenc P r o j e c t
3 . F e a a l b i l l t y
A. P r o j e c t A p p r a i s a l
5 . P r o j e c t Approval
I I Implementat ion
6. Amend R e g u l a t i o n ! , Promotion
D e t a i l Dealgn
7 . Approval o f Annual Budget
6 . S e l e c t C o n t r a c t o r
9 . Commence C o n a t r u c t l o n
I I I ' O p e r a t i o n
10 . Maintenance and c o n t r o l
1 1 . Re*•nut C o l l t c t l o n
Note : L.G. " Loca l Government
C.G. * C e n t r a l Government
AGENCIES
NEB
L.C.
OUD
NESDB
C a b i n e t
- , G . , NEB
OUD
-,G ,C.G.
L.G.
Contractoi
L.C.
L.G.
EStlMAt^D IIHE
REQUIRED YPAR
O.S
0 . 5
1 . 0
1 . 0
O.S
0 . 5
0 . 5
--
'•°.
--
Year
1
a—aa
2
• • •
• • • a -
'
3 t,
ne-J
5 6 7 a
-
9 10 11 12
Figure 8.3 Action Plan of Sewage System Implementation
137
8.6 Major Obstacles to the Implementation of the Proposed System
Four major factors have been identified which will raise obstacles to the progress of the proposed system and which must be addressed if it is to be successfully implemented:
(i) Financial resources in Thailand, as in all countries, are limited. Thailand has identified that it has a particular need for substantial infrastructure investment and therefore has a considerable number of potential projects competing for resources. Any project must therefore be expected to yield outstanding returns when compared with other infrastructure and revenue generating projects before it will obtain approval for implementation.
(ii) This project is quite innovative in the context of Thailand. It will require considerable education of several groups including local government, the community, NESDB and Cabinet to communicate the potential benefits of the project. The project is unlikely to be successful if its direct and indirect benefits are not visible.
(iii) Chonburi is a large and established city. The changing of the whole sewerage system is likely to cause substantial disruption and to involve a long time span. Local government would face considerable disruption to the city and in particular major traffic congestion.
(iv) Local government may face major resistance from the community because the project may require the community to pay a substantial amount towards the cost of the system. Currently no charge is levied on services except for garbage collection and the clearing of septic tanks. However financial analysis has indicated that a considerable annual charge would be necessary if the full cost of the system were to be recovered. Even if there were capital contributions from central and local government, a further capital contribution would be required from each household and a significant annual charge would be levied. It may be expected that local government will therefore be reluctant to implement the system since direct benefits will not be clearly seen but direct costs could cause a negative reaction from the community.
138
9. CONCLUSIONS
9. l Summary of Results
The most important facts and figures resulting from the system comparison are shown in Table 9.1. It is to be noted that the Septic Tank Option was not designed as a technically satisfactory solution because the use of on-site facilities alone would be inappropriate in high-density areas with unfavourable soil conditions. However,' it was thought to be interesting to compare the economic and institutional consequences of such a theoretical option with those implied in the technically adequate options.
9.2 Conclusions and Suggestions
1. The existing methods of on-site wastewater treatment by cesspool system and direct sullage disposal being practiced in Chonburi municipality are not technically and hygienically effective, resulting in pollution problems to the surrounding soils, ground, water and storm drains. This is due to several reasons such as: the surrounding soil around the cesspool becomes clogged easily; many cesspools have effluent pipes connecting directly to nearby storm drains or canals; and the septage in the cesspool is not regularly removed.
2. The lack on information on the cost of sewerage and wastewater treatment facilities turned out to be an impediment for the planning of sanitation systems. Even cost data from executed projects are a rather unreliable source. Cost differences in the ratio of up to 1:5 were found for the same facilities. Although differences in the local price level are one reason for cost differences, the extreme cost differences originated rather from sub-standard workmanship resulting in very low cost in some instances. Cost information, even when taken from executed projects, can only . be used after a careful assessment of the project situation and the quality of construction.
3.. On-site wastewater treatment appeared to be more economical than a sewer system with centralized treatment, even in high density areas. The costs of the studied alternative options increase with an increasing part of the area to be sewered (Table 9.1). However, the technical constraints of on-site facilities are to be considered. In areas with a high population density or with limited infiltration capacity of the subsoil, on-site facilities result in surface runoff of wastewater and, thus, constitute a health hazard rather than an improvement of the sanitation conditions.
4. The minimum sewerage option shows 5% lower capital investment and 40% lower annual operating cost than the maximum sewerage option. Thus, there is not one appropriate sanitation technology for the entire town area. Most appropriate is a mix of a sewer system and on- site sanitation, with the sewer system to be built only in those parts of the town where on-site sanitation is infeasible.
Table 9.1 Summary of Costs For Construction And Operation/Maintenance (1,000 Bait )
! Description
!CONSTRUCTION COST 11. Household septic tank 1 Institutional septic tank ! Vaccua truck 1 Septage treataent ! Sub total
12. Main sever systea 1 Lateral sewer systea ! Puaps and puaping stations ! Sewage treataent 1 Sub total
! TOTAL
1 OPERATION AND MAINTENANCE COST ! PER ANNUM 11. Vacuus truck ! Septage treataent I Sub total
!2. Sewerage systea 1 Sewage treataent j Sub total
13. Aquaculture
! TOTAL !
! Total service charge 1 ! (Babt/household/annua) ! 1 - Operating cost I I (Babt/household/annua) 1 ! - Capital contribution ! i (Baht/bousehold/annum) !
! Hajcinua Sewerage Option 1
1 Treataent alternatives ! 1 1
35,611 1 5,223
420 1 67 ! 41,321
2S,580 226,881 5,668 24,474
285,603
326,924
177 54 231
3,379 335
3,714
28
3,973
Sewer
1,186
274
912
2 3 1
177 - I
23,706 112.142 1
85 - !
5,506 8,260 I
Septic tank !
789 !
iso :
639 1
Minimum Sewerage Option
Treataent alternatives 1 2 3
142,801 67,894 2.100
261 213.056
17,279 72,818 1,818 9,315
101,230
314,286
798
7,775 37,021
935 83
1,018
1,176 188
1.364
25
2,407
Sewer
1,101
338
763
119
1,582
Septic tank
789
ISO
639
3,861
Small Bore Sewerage Option
Notes: Septage treataent
Alternative 1 Alternative 2
Sewage treataent Alternative 1 Alternative 2 Alternative 3
Stabilization pond systea Aerated lagoon systea Activated sludge process
Treataent alternatives 1 2 3
35 5 2
44
24 169 3 23
219,
,611 223 ,940 336 110
265 100 216 100 681
263,791
1,280 85
1,365
2.480 '285 2,765
28
4,158
Sewer
1,045
254
791
1.100
23,706 84,479
123
5,506 6,195
Septic tank
789
ISO
639
, 1
Septic Tank Option I
-I Trt. alternatives
1 2
222 ,873 69 ,452
2 , 9 4 0 336
295 ,601 1 ,100
295 ,601
1 ,280 85
1.365 123 I
1 ,365 Bnw»m»i-«aTTT¥Ti i i u t i u » » I
Sewer Septic tank!
I 789 !
I ISO !
I 639 I
1
To improve the existing sanitation conditions in the study area of Chonburi municipality, a sensible option is the use of two-compartment septic tanks and soakage pits to treat some ' of the household wastewaters on-site, while three-compartment septic tanks and soakage pits should be used for treatment of some of the wastewaters generated from institutional and commercial areas. The remaining wastewaters are collected by the sewerage system and treated at a central wastewater treatment plant. The proposed septic tanks and soakage pit system is expected to provide a satisfactory level of wastewater treatment with respect to pollution control and public health protection.
Comparing the cost of a conventional sewer system versus a small bore sewer system, considerable cost savings are possible by the application of a small bore sewer system. The construction cost of the small bore sewer system were about 15% lower than those for a conventional sewer system. This figure applies to the assumption that a completely new system is to be built. When existing on-site facilities were used as interceptor tanks for small bore sewers, the cost savings in this case increased to about 25%. In the assessment of these savings, it is to be taken into account, that they are derived for an entire town area and not for a small catchment area only. Since only limited experience is available yet for large areas, the design criteria for the small bore sewer system were rather restrictive-and—on-the safe side.
Small bore sewer systems are particularly advantageous in areas with a very low population density and in flat areas. The cost savings compared to a conventional sewer system increased in the area with a population density of only 16 persons per hectare to about 29%. Due to the lower slopes required for small bore sewers, less pumping stations were needed resulting in cost savings of about 43% for the construction of pumping stations. Similarly, the annual energy cost of the pumping stations of the small bore sewer systems amounted to only about 2/3 of the annual energy cost of the conventional sewer system.
The AIT sewer design program proved a valuable tool for this study. Without the design program, the preliminary design for conventional sewerage, small bore sewerage and different alternatives amoung these systems had not been possible. Since workable design programs are available today, .the development of alternative systems and system layouts on a preliminary design level should be considered as an essential requirement of project planning. As a freely available program package, the "Microcomputer Programs for Improved Planning and Design of Water Supply and Waste Disposal Systems" which were jointly issued by the United Nations Development Program and the World Bank should be mentioned.
141
Manhole costs constitute about a quarter of the total cost of the sewer system. This relatively high share of the manhole cost originates mainly from two factors: prefabricated manholes are not available and all manholes are constructed on site resulting in relatively high unit cost. Secondly, modern cleaning and maintenance equipment is generally not available, thus, limiting the feasible manhole distance and increasing the number of required manholes.
Sewer systems are a technology which is not yet fully adopted by the local industry, resulting in economic losses and unreliable operation. This is to be taken into account when deciding for a certain technology in a specific project situation. Where sewer systems turn out to be the most appropriate solution, a gradual implementation should be envisaged which allows the local industry to built up sufficient experience and to adopt this technology in all its components.
The cost of the sewer system per person or per household differ at a ratio of up to 1:10 depending on the population density. Two conclusions may be drawn from this dependence of the sewerage cost on the population density: first, data on sewerage cost without stating the population density, as frequently found in the literature, are incomplete. Particularly comparisons between sewer systems and other sanitation technologies are rather meaningless if the population density of the area of the sewer system is not given. Secondly, if a sewer system is financed by a system which imposes the same contribution on all users, as frequent in developing countries, then, actually, the population of high density areas is subsidizing the population in low density areas.
Because' the collected septage still contains high organic matters, solid as well as pathogenic contents, it was proposed to be treated further by two alternatives: alternative 1 involves anaerobic digester, facultative pond and sludge drying bed; and alternative 2 involves anaerobic pond and facultative pond in series. It is apparent from an economic view that alternative 2 would result in cheaper investment and operating costs.
For central wastewaster treatment, pond systems were considerably more economical than technical treatment processes. This was even the case, when the land cost were more than doubled compared to the present price level. Considering furthermore the operational advantages of ponds, a thorough investigation of the feasibility of a pond system should be an essential part of any project planning.
No information is available yet on the influence of a small bore sewer system on the design of a central treatment plant. Easily settleable material is retained in the interceptor tanks at each house prior to discharge to the public system. Although the fraction of the organic material retained in the sedimentation chambers may roughly be estimated, the characteristics of the remaining part, its treatability and eventual effects on the design of treatment plants are rather unknown. Studies analyzing this aspect are recommended.
Fish ponds, although technically feasible, offered only negligible cost advantages compared to ponds without fish. Considering the possibility of increased organisational requirements, fish ponds may not appear to be economically attractive. However, it is to be noted that in the project scenario of this study, the market value of fish raised in wastewater treatment ponds is very low because it can only be sold as animal feed due to anticipated social acceptance problems of direct consumption for human food. The economics of septage fed aquaculture should be much more economically attractive in other countries with lower labour costs and higher market prices for sewage raised fish, particularly if such fish are accepted for direct human consumption.
The transition from on-site sanitation to centralized systems naturally involves a shift of the cost from private users to the public authorities. For example, under the maximum conventional sewerage option, investment in the central system accounts for 88% of total expenditure and investment in individual septic tanks accounts for only 12%. Under the septic tank option the central part of the system accounts for only 3% of the total investment. Similarly the annual operation cost for the central system of the two options account for 94% and 9% respectively. Under this aspect, also the small bore sewer system is advantageous compared to the conventional sewer system. As compared to the 88%- and 94% for the-capital-investment—and-the-operat-ing cost, respectively, for the central system of the maximum sewerage option, the central system of the small bore sewerage option accounts for 83% and 67% of the cost respectively.
The lowest cost system overall would be the septic tank system with a required annual charge over the life of the project of 789 Baht, excluding financing charges. The introduction of such a charge would increase household utility expenditure by around 20% and would be likely to meet very strong resistance from consumers. The alternative systems, with even higher service charge would clearly meet even higher resistance.
Assuming that public sector funding was possible and that all capital expenditure was paid for separately from the service charge the septic tank system would again have the lowest service charge. However because of the actual nature of the expenditure it would require the highest private sector contribution to capital investment of around 14,750 Baht per household which again would be likely to meet considerable resistance. The maximum conventional sewerage system would have the highest public sector contribution and the lowest overall private sector contribution but would still require a substantial service charge of 27 4 Baht per year.
Even with a public sector contribution there are still likely to be difficulties because of the introduction of significant charges, and because a significant capital payment would be required from households. Under all alternatives some households, which are not connected to a central sewerage system, would have to make a capital contribution of nearly 15,000 Baht as well as paying a service charge. Those households which are connected to the
143
central system would also face a significant capital contribution, as well as having to pay a service charge.
A sanitation system consisting of a mix of septic tanks and a sewerage system in high density areas seems to be affordable, although the required charges will most likely meet strong resistance by the users. The crucial question of affordability would thus be determined by the users' willingness, rather than their ability to pay the required charges. Under these circumstances, three future scenarios appear to be possible, as demonstrated by the flow diagrams in Figures 9.1 and 9.2.
(i) With increasing willingness to pay, a sewerage system combined with septic tanks (in the lower density areas) will become feasible
(ii) If the users are not ready to meet the required charges, a vault system would be the logical consequence. However, such a solution would be socially unacceptable as well as organizationally questionable
(iii) The present system is continued, resulting in further deterioration of hygienic and environmental conditions.
The existing institutional framework is adequate to permit the implementation of the scheme with only minor amendments to the regulations at the local authority level. The project itself will require the cooperation of several agencies and will need to be promoted vigourously by OUD as the lead agency. The success of the project will require that a number of obstacles are overcome. Most particularly it will be necessary to educate several groups as to the potential long term benefits to be gained from the scheme.
144
Mart ALGORITHM 1
Are there water taps in the houses to be served"
No Is the wastewater flow greater than 50 liters per capita daily?
'es
Are there strong social or environ- ' mental reasons that preclude the use of conventional sewerage'
Yes Is there a strong social preference to reuse excreta?
NO
Yes
No
Is tne soil sufficiently
.permeable _ . . . . - . j ^ 0 ' for on-site disposal of seotic tank effluent?
Are sewered pour-flush toilets affordable ">
*!IU—
Go to second-stage algorithm and make suitable arrangements for sullage disposal
If willingness to pay lacking, go to Algorithm 2
H T pour.llusnl
Are the plot sizes large enough for septic tanks and soakaways?
Can water consumption be reduced so that on-site disoosal of septic tank effluent is possible7
Yes Yes
S'an ALGORITHM 2
Are seotic ranks with soakaways cheaper tnan. conventional sewerage'
Are seyuc tanks affordable'
Seotic tanks and soakaways
JC Is there an assumed use for compost or stabilized humus by household or others?
No
Go to third-stage algorithm
Source: KALBERMATTEN et al. (1980)
Figure 9.1 S e l e c t i o n of S a n i t a t i o n Technology Scenar io 1: Wi l l ingness t o Pay - Sewerage A l t e r n a t i v e : Sewered PF T o i l e t s
Start ALGORITHM 3
A r e plot sizes large
e n o u g h lor t w o
al ternat ing pit sues*
Yes
N o
Is there suff ic ient
space for a pe rmanent
double-p i t system
wi th a m i n i m u m
of 1 yeor storage
per vault?
Yes
U there ei ther a
mun ic ipa l or pri
vate system tor
e m p t y i n g latrines?
Is w a t e r t a b l e
m o r e t h a n 1
m e t e r b e l o w
g r o u n d surface ?
No
Can l a t r ine level
be raised?
Is s u f f i c i e n t w a t e r
avai lable for pour-
flush t o i l e t s '
Yes Is soil suf f ic ient ly
permeab le?
Are local anal
cleansing materials
suitable lor use
w i t h pour- f lush
toi lets?
N o
Are pour- f lush
toi lets a f fordable?
N o N o
Are R e e d Odorless
Ear th C l o s e t s ( R O E C s )
pre fer red over ven
t i la ted i m p r o v e d
pit l a t r ines '
A r e R O E C s
af fordable?
Are vent i la ted
i m p r o v e d p i t
latr ines a f f o r d a b l e 7
Y B S
<• N o
N o
A r e v e n t i l a t e d
i m p r o v e d doub le -
pit la t r ines
a f f o r d a b l e ^
A r e valul t
toi lets a f f o r d a b l e :
Source: KALBERMATTEN et al. (1980
Pour- flush
toi lets
- * - R O E C s
V e n t i l a t e d
i m p r o v e d
pit latr ines
• C o m m u n a l
sanitat ion
facilities
V e n t i l a t e d
improved
double-p i t
latrines
C o m m u n a l
sani tat ion
faci l i t ies
Figure 9.2 S e l e c t i o n of S a n i t a t i o n Technology Scenar io 2: Unwil l ingness t o Pay - Vault System ( s o c i a l l y and o r g a n i z a t i o n a l l y
/ /
APPENDIX TO CHAPTER 2
iNT^^ATiCJvA-. RFF^Rh^CE CENTRE ;"0'? CC.v-'-MTfY V.'AfEK SUPPLY AKD SA,o!TA1!CM '.RCT,
149
APPENDIX 2.1 RELEVANT BACKGROUND STUDIES ON CHONBURI
(a) Regional Development:
(i) COOPERS & LYBRAND Associates et al./NESDB, Eastern Seaboard
Study, Final Report, 3 vols.
Bangkok, October 1982
(ii) , Eastern Seaboard Study,
Project Reports 1 and 2,
Bangkok, September 1982
(iii) , Eastern Seaboard Study, Sector Studies,
- Vol. 3 (Industry, Tourism, Other Basic Activities,
Employment)
- Vol. 5 (Transport, Water and Utilities)
- Vol. 6 (Urban Development)
- Vol. 7 (Implementation, Finance)
Bangkok, September 1982
(b) Urban Land Use Development:
(i) Town and Country Planning Department, General Plan for
Chonburi 1988
Bangkok, 1966 (in Thai)
(ii) , General Plan for Chonburi 1998,
Bangkok, 1978 (in Thai)
(iii) , Draft General Plan for Chonburi,
Bangkok, 1983 (in Thai)
150
(iv) ROBERT R. NATHAN Associates/NESDB/USAID, Land Use
Programming for Chonburi, Siracha and Phanat Nikom,
Thailand,
Final Report, 2 vols.
Washington B.C., 1980
(c) Sewerage and Excreta Disposal:
SEATEC International/WHO/Department of Public Works', Urban
Sewerage and Excreta Disposal Plan, 2 vols.
Bangkok, April 1983
(d) Drainage and Flood Control:
ENGINEERING CONSULTANCY Services Center/Institute of Scientific
and Technological _ Research (TISTR), Feasibility Study and
Detailed Design for Drainage and Flood Control of Chonburi
Regional City, 2 vols.
Bangkok, June 1985
(e) Water Supply:
KOCKS Consult GmbH/THAI PROFESSIONAL Engineering Consultants
Co.Ltd./Provincial Waterworks Authority, Chonburi Water Supply
Project,
- Phase I (Immediate Improvements)
- Phase II (Masterplan)
- Phase III (Feasibility Study)
Bangkok, 1984/1985
151
APPENDIX 2.2 THE THAI CESSPOOL
Source: UNITED NATIONS Centre for Human Settlements (HABITAT)
(1986), Community Participation in Low-Cost Sanitation,
Training Module, Nairobi, Kenya, pp. 62-63
Background The cesspool as it is now found in the slum areas of
Bangkok, Thailand, is a much simplified version of the
double-pit latrine which was introduced by the Ministry
of Health in the early seventies. It consists of a
single pit made out of a set of rings forming a shaft
down into the ground. It has a squatting plate with a
water seal. The tank sometimes barely enters into the
soil; it rises through the surrounding water up to the
floor of the house, which is usually built on stilts.
Several factors have facilitated the rapid acceptance
of this type of latrine in the slums of Bangkok.
Sanitation is not a controversial subject in Thailand.
Most of the taboos surrounding the subject existing in
other countries are unknown here. The effective water
seal of the cesspool prevents unpleasant smells;
therefore, the vicinity of toilet in these densely
populated areas no longer provokes any strong negative
reactions from neighbours. However, as most of the slum
areas of Bangkok are regularly flooded, the pollution
caused by these pits is considerable. The untreated
fluids from the pit leach directly into the surrounding
surface water.
152
Community The construction of the latrine is very simple. The
participation entire latrine is available in prefabricated parts from
a multitude of suppliers at a very low cost. Almost
all hardware shops in Bangkok have a small workshop in
their backyards where components are produced from
steel moulds.
All a client has to do is to decide to buy one and call
a contractor. The cesspool can be easily assembled. A
complete unit can be installed by a mason in a few
hours time. The system is so cheap that many households
build a second latrine instead of emptying the original
one Author! ties-do-not-need-to-gener at e-partic-i-pat-ion
in order to promote the use of the system.
Implemen- Users often complain about the problems created by the
tation latrines of their neighbours rather than by their own
latrines. The main complaint.concerns the pollution
caused by the careless emptying of the tank, especially
the de-sludging, done by breaking the tank and spilling
its content on the surrounding land.
Since the existing method is satisfactory to the user,
improved systems are likely to meet with considerable
resistance. Within the Government, little concern has
been shown for the special problems in sanitation.
Roads, water supply and garbage disposal are seen as
far more urgent infrastructural needs.
153
Conclusions A purely commercial implementation system has succeeded
in covering almost the entire slum population of
Bangkok without any noticeable governmental
involvement.
Although the system is in fact unsuitable for areas
with a high watertable and causes severe pollution, all
surveys show considerable satisfaction with the system.
People feel that sanitation is adequate as it is.
Public health and environmental considerations are not
considered issues within their control, and therefore
fail to draw their attention. The absence of smells
gives the people a false sense of security.
APPENDIX TO CHAPTER 4
APPENDIX 4.1
Design Criteria, Sewer Network Data and Sewer Design for Maximum Sewerage Option X
159
Des ign C r i t e r i a f o r Maximum Sewerage Opt ion I
MIN. SLOPE FOR CONSTRUCTION = 0 . 0 0 1 MINIMUM COVERING = 2 . 0 0 m MAX. EXCAVATION = 5 . 0 0 ni MANNING ' n ' = 0 . 0 1 3 MINIMUM VELOCITY = 0. 5 0 m / s MAXIMUM VELOCITY = 3 . 0 0 m / s WASTE HATER PEAK FACTOR = 1 . 7 5 * * RAINFALL CONSTANT K2 = 3 2 . 0 0
NO. OF AVAILABLE P I P E S = 8 AVAILABLE PIPE DIAMETER ARE:
0 . 4 0 0 m 0 . 7 0 0 m 1 . 0 0 0 m 0 . 5 0 0 m 0 . 8 0 0 m 1 . 2 0 0 m 0. 6 0 0 m 0. 9 0 0 m
** - C o m p o s i t e p e a k f a c t o r c o n s i d e r i n g P e a k F l o w and I n f i l t r a t i o n b a s e d on 2 Q.
160
Sewer Network Data f o r Maximum Sewerage Option I From Manholes 1A1 i 1A4 t o Manhole 28B1
* * * * * * SEWER NETWORK DATA * * * * * *
( U - UPSTREAM , D - DOWNSTREAM , Q ( ELE i n m, LENGTH i n m, Q i n 1 / s )
EXECUTION TIME (EXCLUDE THE TINE FOR FINAL RESULT PRINT OUT) ='00:04:18 i 258 SECONDS )
Manhole Cost = 24 x 10,000'+ 43 x 12,500 = 7 7 7 , 5 0 0 . -
Sewer Design for Maximum Sewerage Option Z From Manholes 1A3 C 1A6 t o Manhole 3J3
DATA PIPE SECTIOJ S 8 0 P K E L B . i l ) PIPE DIAK INVEST ELE. d l SLOPE LENGTH VELOCITY ACC. COST P.ec.Nc U.Node D.Node UPscre . DCHNstr. in) U P s t r e . DOKNstr. tm/ka} (it! i n / s e c ! !Baht)
4 5 6 1
8 a
10 1: 12 13 14 15 15 * m
13 15 23 21 1* Li.
23 24 - * 2c - •-
1A3 it;
3B3 433 5B3 633 733 353 9B3 1033 1133 1253 i^s*
14B3 1552 1653 17B3 18B3 1A6 236 335 436 536 v U -
Manhole Cost = 9 x 10,000 + 29 x 12,500 = 452,500.--
00
en
Sewer Design for Maximum Sewerage Option II From Manhole 1A5 to Manhole 10B5
DATA PIPE SECTION fiffOUMO ELE. (a ) PIPE DIAH INVERT ELE. d ) SLOPE LENGTH VELOCITY ACC. COST R9c.N0 U.Node D.Node U P s t r e . OQWNstr. (•) U P s t r e . DQyNstr. (i/ki) (i) (i/sec) (Baht'l
11 m 41P1 «u . . . ;-,;•• • ' ' ! "-,7S U 4 5 80-00 ° - 7 8 5 7 5 > 1 2 § . , v u l 41bl i l 4 4 !-W U.7UU -0.73 -0.87 1.045 80 00 0 ?s m "v
- 4181 4281 1.94 1.87 0.700 -fll87 - M ^ ~"o ^ 5 " 0 " 42B1 43B1 i-«7 1.M 0.700 -0 4 - U l U St ^ ' 1 '" 4W1 4 j u l J " - ! - d y - ^ -i.«? -1.16 1.045 70.00 0.78 1,013,990
TAL PIPE LENGTH OF THE NETWORK = 872 •
twumH i m (EXCIM JHE IM. m FINAL RESC/LT PRIKT OUT)
Manhole Cos t = 29 x 12 ,500 = 3 6 2 , 5 0 0 . -
l i W l , H I
Sewer Design for Maximum Sewerage Option I I From Manhole 2J3 t o Manhole 7OBI
DATA PIPE SECTION GROUND ELE. ( i ) PIPE DIAH INVERT E L E . d ) SLOPE LENGTH VELOCITY • ACC. COST Rec.No U.Node D.Node UPstre, DOMNstr. d ) UPstre. DOHh'str, d / i c i ) i l l ( i / s e c ) (Baiit)
TOTAL PIPE LENGTH OF THE NETWORK = 2697 i EXECUTION TIME (EXCLUDE THE TINE FOR FINAL RESULT PRINT OUT) = 00:06:08 ( 368 SECONDS )
Manhole Cost = 90 x 12,500 = 1 ,125,000. -
1
APPENDIX 4.3
Design Criteria, Sewer Network Data and Sewer Design for Minimum Sewerage Option
1
191
D e s i g n C r i t e r i a f o r Minimum Sewerage Opt ion
MIN. SLOPE FOR CONSTRUCTION = 0. 001 MINIMUM COVERING MAX.EXCAVATION MANNING * n ' MINIMUM VELOCITY MAXIMUM VELOCITY HASTE HATER PEAK RAINFALL CONSTANT
FACTOR K2
= = = = = = =
2. 5. 0. 0. 3. 1 .
32.
00 m 00 m 013 50 m/s 00 m/s 7 5** 00
NO.OF AVAILABLE PIPES = 8 AVAILABLE PIPE DIAMETER ARE:
0.400 m 0.700 m 1.000 m 0.500 m 0.800 m 1.200 m 0. 600 m 0. 900 m
** - Composite peak factor considering Peak Flow and Infiltration based on 2 Q.
192
Sewer Network Data f o r Minimum Sewerage Opt ion From Manholes 1A1 & 1A4 t o Manhole 48B1
* * * * * * SEWER NETWORK DATA * * * * * *
( U - UPSTREAM , D - DOWNSTREAM , Q - AVERAGE FLOW) ( ELE i n m, LENGTH i n m, Q i n 1 / s )
TOTAL PIPE LENSTfi OF THE N E T S = 2038 a EXECUTION TIHE (EXCLUDE THE TIHE FOR FINAL RESULT PRINT OUT; = 00:01:44 i 104 SECONDS 1 Manhole Cost = 82 x 10,000 = 820 ,000 . -
Sewer Design for Minimum Sewerage Option From Manhole 48B1 to Manhole 73B1
1PPIIDII 7.1 M l i m SIIIUCI OPIIOI Cashfloi projection
19S( Constant Price Quit : Thonsind Bant
Total 10 11 12 13 14 15
CtPITIL IITISTUR EonseboH septic tank Institutional septic tank Facial t r o d Septage treatient lain serers s j s t e i Lateral seiers svste i Pup and pniping station Stabil isation pond iqnacnltnre
Total investient cost
0PIHTII6 COST Tacgii track Septage treatient Seiers aid pniping stations Energy cost laintenance and repair of pnips Stabil isation pond Iqoacalture
Total operating cost
TOTIL CiSJ OOTPLOI
0PH17IK IICOII Septic tank IgnacalUre Service charge - septage treatient Service charge - seier sys te i
1PPHDII 7.2 i IIIIMI SEK11C-I OPTIOI Cashfloi projection
C1PITU imSTIEIT Household septic t int Iast i tot ionj l septic tank Tacnni trick Septage treatient Iain severs syste i Lateral seiers Pnip aid pniping station Stabilisation pond Ignacnltnre
Total inrest ie i t cost
OPEllTIIG COST Tacnni trnck Sept age treatient Seiers and pupi ig stations Energy cost laintenance and repair of piups Stabilisation pond Iquaculture
Total
142.S01 (1,1)4
(,300 281
11,279 72,118
4,(18 9,915
0
321,906
24,171 2,407
24,676 (,181
(21 5,2(4
704
1
20,400 9,(99
0 2(1
4,205 0 0
4,716 0
39,211
2
20,400 9,(99
420 0
3,485 31,349
1,111 4,599
0
71,770
117 13
3
10,400 9,(99
420 0
3,018 8,(95
0 0 0
42,233
374 83
409 100 10
118 25
4
20,400 9,699
420 0
2,157 20,899
0 0 0
54,275
5(1 8)
52( 128 13
188 25
5
20,400 9,(99
0 0
3,714 11,875
0 0 0
45,(88
5(1 83
7(3 136 20
188 25
«
20,400 9,(99
420 0 0 0 0 0 0
30,519
741 13
919 234 23
188 25
7
20,400 9,(99
420 0 0 0 0 0 0
30,519
935 13
919 234 23
HI 25
1
0 0
0 0 0
0
935 U
919 234 23
HI 25
9
0 0
0 0 0
0
935 83
919 234 23
181 25
10
0 0
0 0 0
0
935 S3
919 234 23
188 25
11
0 10
0 0 0
10
935 83
919 234 23
188 25
12
420 0
1,400 300
0
2,120
935 13
919 234 23
It! 25
13
420 0
0 0 0
420
935 13
919 234 23
188 25
14
420 0
0 0 0
420
935 83
919 234 23
188 25
15
0 0
0 0 0
0
9)5 8!
919 2)4 21
188 25
Total operating cost
T0T1L CIS! OOTFL0!
(4,8)1 0 270
316,737 39,211 72,040
1,189
43,422
1,524
55,199
1,836
47,523
2,221
32,740
2,408
32,927
2,408
2,408
2,401
2,408
2,408
2,401
2,(01
2,418
2,408
4,52!
2,408
2,828
2,408
2,82!
2,408
2,408
0SUTIIC IIC01E Septic tank 52,2(0 Iquacnltore 1,105 Sernce cbarge-septaje treatient 173,112 Service charge-seier systei 160,260
IPPEIDII 1.2 iKIKIHITH SEfSRIGB OPTIOI XIII smu in mmi •. COBTMCTIW COST
Froi To
HIS SEISES U 1 , U 4 4SB1 48B1 7381 113 3J3
Total t a i l se iers
11II0LE 114,111 42B1 4881 73B1 113 3J3
Total u s h o l e
C1UD T0T1L
Total
5,216 4,44) 1,870
11,536
3,021 1,575 1.14S
5,744
17,279
1
0 3,106
0
3,106
0 1,100
0 1,100
4,205
2
1,055 1,343
0
2,398
611 475
0 1,087
3,485
3
0 0
1,870
1,870
0 0
1,148 1,148
3,018
Tear 4
1,809 0 0
1,809
1,048 0 0
1,048
2,857
1986 Constant Price doit : Thonsand Bait
5
0
2,352
1,362 0 0
1,362
3,714
6 7
0 0 0 0 0 0
0 0
0 0 0 0 0 0
0 0
0 0
H I I SEVERS 1ID IUB0LE : COISTMCTIOI P1.1I Data leasored froi f i p r e 4.4
Froi To Total 1 2 3
Fear 4
Unit : C e i t i i e t r e
5 6 7
111,114 48B1 113
48B1 73B1 3J3
17.3 10.6 8.7
7.4 3.5 3.2
6.0 7.8
8.7
Total 36.6 7.4 6.7 8.7 6.0 7.8 0.0 0.0
APPESDIX 1.2 :IIIIItn SEIES1GE OPTIOI BASIC COST Of LITERAL SEIEE SYSTEM W D IUIBEE OF HODSEHOLD
CELL LAflD USE flffILT-CP 1RE1 AEEA COSSIDEiED AEEA COKSIDEEED A7EEAGE COST PER 81 TOTAL COST Of P0PUL1TI05 TOTAL HUIBEE OF CATEGOET OF PLAMIHG OF BUILT-UP BUILT-UP HOUSE SEIE! HOUSE SEIER IUIBEE POPULATIOI HOUSEHOLD
CELL fioi m smsiGE FOR ssmici COHSECTIOI STSTEI COIIKTIM m m m HA BASE DATA
HA t HA B/HA B/BA BAHT : BAHT (1) (2) (3) (4) (5)=(3)x(4) (6) (?) (8):(6)x(5)xl.4 (9)=(7)x(5)xl.4 (10) (11H5)M10)(12) = (11)/1
Total year 5 36.0 69 25.0 137,733 474,981 3,443,335 .11,814,520 250 6,250 893
Tear 6
Tear 1
Total
Total year 6
Total year 7
0.0
0.0
605.0
0
0
25
0.0
0.0
152.0
0
0
138,143
0
0
479,065
0
0
21,089,011
0
0
72,817,881 .
0
0
250
0
0
38,000
0
0
5,429
1PPI1DII7.) :SUU 101! S m i l C I 0F7I0I Cashfloi projection
CiPITU i n t S T U H Household septic t i l l Institutional septic tank Ileum trnct Septage tceatieit Interceptor t ints l i i n seiers systei Lateral seiers Poip and ptiping station Stabil isat ioi pond Iqnicnltore
Total miest ient cost
0PEUTII0 COST racial trnct Septige t r e i t i e i t Seiers md pgiping st i t ions Energy cost lamtenance and repair of pups Stabilisation pond ignacnltare
I of people use septic tak Eoasebola septic talk - I of Jilt
- cm. nit - 1 cu. of I household - unit cost
Inst, septic tank -I of itit - cm. unit - unit cost
Tacuui Truck- I of trick - cot. wit - I of driier - cu. unit - i of labourer - C M . unit - unit cost - uinteiiice -fiel - driier - labourers - household retenue 2,2' inst. reienue
Septige treatient- const, plan - land - plant construction - lainteiance - technician - labourers - later analysis - equipieatliO jr. lifetiie)