Page 1
AKFEN REAL ESTATE INVESTMENT TRUST INC.
CITY OF ISTANBUL – DISTRICT OF TUZLA
TUZLA IBIS HOTEL APPRAISAL REPORT
Report No: 2016-020-GYO-001
Date of Appraisal: 30.12.2016
Date of Report: 06.01.2017
REAL ESTATE CONSULTANCY AND APPRAISAL INC.
Page 2
ii Rapor No: 2016-020-GYO-001
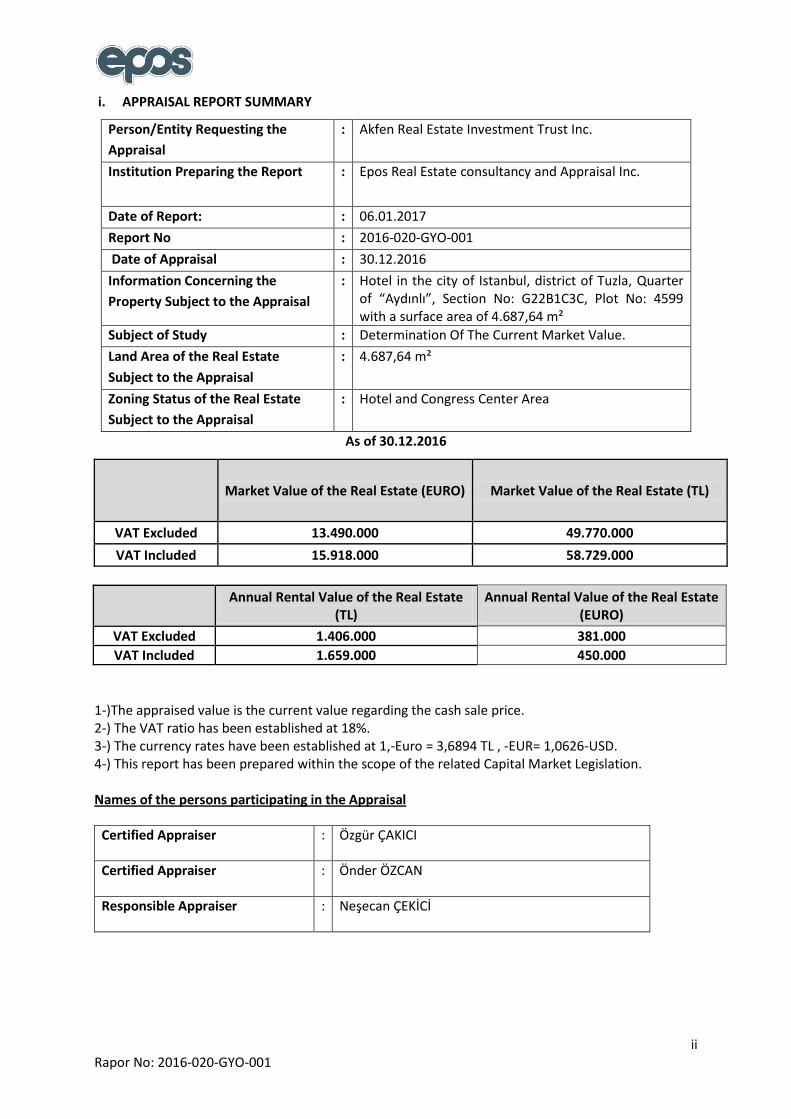
i. APPRAISAL REPORT SUMMARY
Person/Entity Requesting the
Appraisal
: Akfen Real Estate Investment Trust Inc.
Institution Preparing the Report : Epos Real Estate consultancy and Appraisal Inc.
Date of Report: : 06.01.2017
Report No : 2016-020-GYO-001
Date of Appraisal : 30.12.2016
Information Concerning the
Property Subject to the Appraisal
: Hotel in the city of Istanbul, district of Tuzla, Quarter of “Aydınlı”, Section No: G22B1C3C, Plot No: 4599 with a surface area of 4.687,64 m²
Subject of Study : Determination Of The Current Market Value.
Land Area of the Real Estate
Subject to the Appraisal
: 4.687,64 m²
Zoning Status of the Real Estate
Subject to the Appraisal
: Hotel and Congress Center Area
As of 30.12.2016
Market Value of the Real Estate (EURO) Market Value of the Real Estate (TL)
VAT Excluded 13.490.000 49.770.000
VAT Included 15.918.000 58.729.000
Annual Rental Value of the Real Estate
(TL) Annual Rental Value of the Real Estate
(EURO)
VAT Excluded 1.406.000 381.000
VAT Included 1.659.000 450.000
1-)The appraised value is the current value regarding the cash sale price. 2-) The VAT ratio has been established at 18%. 3-) The currency rates have been established at 1,-Euro = 3,6894 TL , -EUR= 1,0626-USD. 4-) This report has been prepared within the scope of the related Capital Market Legislation. Names of the persons participating in the Appraisal
Certified Appraiser : Özgür ÇAKICI
Certified Appraiser : Önder ÖZCAN
Responsible Appraiser : Neşecan ÇEKİCİ
Page 3
iii Rapor No: 2016-020-GYO-001
Declaration of Conformity
The findings hereby presented in this report are correct, within the scope of the information
that the Appraisers had at their disposal.
The analysis and their respective results are limited only according to the specified
assumptions and conditions.
The appraisers have no connection whatsoever to the property subject to the appraisal nor
will they ever have.
The appraisers are not biased in relation to the real estate and the related parties.
The appraisal cost does not depend on any single part, analysis opinion or the results of the
report.
The appraisers have carried out the appraisal pursuant to the moral principles and
performance standards.
The appraisers meet the necessary professional education terms and possess the sufficient
experience.
The analysis, opinions and resulting values have been prepared in accordance with the
International Valuation Standards (IVS - UDES).
Assumptions
The value stated within this report is the value specified on the date of its preparation. The
appraisers cannot be held responsible for the economic and/or physical changes that might
affect the value herein stated, occurring after the date of this report.
No comments in this report (even though the matters in question are discussed in the
continuation of the report) have been made with the purpose of clarifying legal affairs,
matters that might require special research and specialty or other issues that are beyond the
scope of the area of expertise of the appraisers.
No changes have been made to the information pertaining to the property. The authorities
that provide the information related to the property and legal descriptions are generally
accepted to be trustworthy. However, no guarantees are given with regard to their
truthfulness.
Documents and corresponding related information are found in the report as they have been
procured from public institutions.
The photographs, maps, images and diagrams have been used for illustrative purposes only,
in the interest of further comprehending the matters mentioned in the report; thus, they
cannot be used as a reliable reference for any other purpose.
Page 4
iv Rapor No: 2016-020-GYO-001
The projections subject to this appraisal have been performed in order to help the appraisal
process by taking into account a stable economic process, in the case of a demand during the
current market conditions. The projections depend on the variable market conditions, which
the appraisers cannot accurately discern; moreover, it is possible that the value might be
affected from these variable conditions.
The appraisers do not possess the necessary qualifications to determine the dangerous or
health threatening materials found within or in the proximity of the property. Throughout
the value appraisal, it is assumed that such materials that might decrease the value are
considered to be inexistent. No responsibility is accepted concerning this matter.
Predictions and projections or business estimates included in this appraisal report depend on
the current market conditions and short term supply, together with demand factors and a
stable economy. Consequently, these may present changes to plausible future conditions.
No responsibility is accepted in the event that the opinions and results presented in the
report are affected due to economic changes that might occur after its herein date.
Unless stated otherwise, underground resources have not been taken into consideration.
It is not possible for the appraisers to carry out a soil contamination investigation, in the
matter of the property in question. For this reason, to the extent that it can be seen, it has
been determined that there is no cause for concern in regard to soil contamination.
On account of the area in question being an established earthquake zone, the subject of
ground stability cannot be clarified without the performance of detailed geological surveys.
For this reason, in behalf of the appraisal studies, it has been assumed that there are no
negative issues presently concerning the ground.
Soil investigation and soil contamination studies in real estate fall within the scope of the
“Environmental Geophysics” field. Our company does not employ such a specialization, thus
did not perform a detailed investigation regarding the aforementioned matter. However, in
accordance with the observations carried at the locale, it has been established that the real
estate poses no threat to the environment. For this reason, this appraisal has been carried
out taking into consideration that there have not been any negative effects against the
environment.
Page 5
v Rapor No: 2016-020-GYO-001
ii. TABLE OF CONTENTS
1 REPORT INFORMATION ............................................................................................................... 1
1.1 The Date, Number and Type of the Appraisal Report ............................................................. 1
1.2 Information Regarding the Responsible Appraiser that Prepared the Appraisal Report ....... 1
1.3 Date of Appraisal ..................................................................................................................... 1
1.4 Reference Agreement ............................................................................................................. 1
1.5 Statement Whether the Report Has Been Prepared Within the Scope of the Board
Arrangements for the Purpose of the Appraisal ................................................................................. 1
2 INTRODUCTORY INFORMATION CONCERNING THE COMPANY AND THE CLIENT: ..................... 2
2.1 Introductory Information Concerning the Appraisal Company .............................................. 2
2.2 Introductory Information Concerning the Client .................................................................... 2
2.3 The Scope of the Client’s Demand and the Applied Limitations, If Any .................................. 2
3 VALUE DEFINITIONS, DESCRIPTION OF APPRAISAL METHODS ................................................... 3
3.1 Exemplary Comparison Approach (Market Value Approach) ................................................. 3
3.2 Cost Approach ......................................................................................................................... 4
3.3 Revenue Discount Approach ................................................................................................... 4
4 ECONOMIC CONDITIONS, DATA OF REAL ESTATE INDUSTRY AND ANALYSIS OF THE AREA
WHERE THE REAL ESTATE IS LOCATED .................................................................................................... 5
4.1 General and Socio-Economic Data .......................................................................................... 5
4.2 Global Economic Overview ...................................................................................................... 7
4.3 Turkey Economic Outlook ..................................................................................................... 13
4.4 Overview of Real Estate Industry .......................................................................................... 15
4.5 Information Regarding the Tourism Industry ........................................................................ 17
4.6 Analysis Of The Area Of The Real Property ........................................................................... 19
4.6.1 Analysis of the Region Where the Real Estate is Situated ................................................ 19
4.6.2 District of Tuzla ................................................................................................................. 20
4.6.3 Information Regarding the Real Estate Industry in Tuzla and the Hotel Market ............. 21
5 INFORMATION IN REGARD TO THE REAL ESTATE SUBJECT TO THE APPRAISAL ....................... 23
Page 6
vi Rapor No: 2016-020-GYO-001
5.1 Information in Regard to the Location, Site and Environment of the Real Estate ................ 23
5.2 Information with Regard to the Land Registry of the Real Estate......................................... 25
5.2.1 Investigation of the Land Registry of the Real Estate ....................................................... 25
5.2.2 Changes Occurred in the Land Registry of the Real Estate within Last Three Years ........ 26
5.2.3 Opinion Whether There Is an Obstacle In Including the Investment Trust Portfolio in
Terms of Land Title Records to the Real Estate Within the Scope of the Capital Market Legislation .. 27
5.3 Inspection of the Zoning Information of the Real Estate ...................................................... 28
5.3.1 Plan, License, Diagram and Similar Documents with Regard to the Real Estate .............. 28
5.3.2 Building Inspection Institution and Maintenance ............................................................ 28
5.3.3 Changes that Have Occurred in the Legal Status (Changes in the Zoning Plan,
Nationalization, etc.) of the Real Estate within the Last Three Years ................................................... 28
5.3.4 Opinion Whether the Necessary Permit and Documents Pursuant to the Legislation are
Accurate and Complete ......................................................................................................................... 29
5.3.5 Opinion Whether There Is an Obstacle in Including the Investment Trust Portfolio in
Terms of Zoning Information to the Real Estate within the Scope of the Capital Market Legislation . 29
5.3.6 Statement that the Detailed Information, along with the Value in Question Regarding
the Project, are Completely in Connection with the Project and that, in the case of Executing a
Different Project, the Resulting Value Might Vary ................................................................................ 29
5.4 Physical Characteristics of the Real Estate ............................................................................ 30
5.4.1 Inspections Performed Within the Premises of the Real Estate ....................................... 31
6 FACTORS AFFECTING AND DETERMINING THE VALUE OF THE REAL ESTATE ........................... 33
6.1 Factors that Limit or Negatively Affect the Appraisal Process .............................................. 33
6.2 Swot Analysis ......................................................................................................................... 33
6.3 Exemplary Share Rate in the Projects that Will Be Performed According to the Revenue
Sharing and Flat for Land Methods ................................................................................................... 34
6.4 Methods and Eligibility Motives Employed in the Appraisal of the Real Estate ................... 34
6.4.1 Exemplary Approach ......................................................................................................... 34
6.4.1.1 Definitions and Sale Value of the Similar Sales Examples that Has Been Based Upon
During the Appraisal and the Reasons Why They Have Been Employed .................................. 34
Page 7
vii Rapor No: 2016-020-GYO-001
6.4.2 Cost Approach ................................................................................................................... 36
6.4.3 Revenue Discount Approach / Development Approach ................................................... 37
6.4.4 Value of the Real Estate According to the Rent Income ................................................... 39
6.4.5 Lease Value Analysis and the Data Employed .................................................................. 41
6.4.6 Empty Land and Project Values of the Terrain Where the Project is Being Developed ... 41
6.4.7 Most Effective and Most Productive Use Analysis ........................................................... 41
6.4.8 Appraisal Analysis of Common or Divided Parts ............................................................... 41
7 EVALUATION OF ANALYSIS RESULTS ......................................................................................... 42
7.1.1 Alignment of Different Appraisal Methods and Analysis Results, together with the
Explanation of the Method and the Reasons Used for this Purpose .................................................... 42
On the grounds that the real estate subject to this appraisal study consists of a property operating
as a revenue bringing hotel, the Revenue Approach and Cost Approach Methods have been
employed. ......................................................................................................................................... 42
7.2 Explanation of the Motives Pursuant to the Minimum Information for Not Including Certain
Aspects in the Report ........................................................................................................................ 43
7.3 Information Concerning the Last Three Appraisal of the Real Estate Carried Out by the
Company ........................................................................................................................................... 43
7.4 Opinion Whether There is Any Obstacle in Including the Real Estate, the Real Estate Project
and the Rights and Benefits With Regard to the Real Estate in the Real Estate Investment Trusts
Portfolio within the Scope of the Capital Market Legislation ........................................................... 43
8 OUTCOME .................................................................................................................................. 44
8.1 The Concluding Sentence of the Appraiser ........................................................................... 44
8.2 Final Appraisal ....................................................................................................................... 44
9 APPENDIX .................................................................................................................................. 45
Page 8
1 Report No: 2016-020-GYO-001
1 REPORT INFORMATION
1.1 The Date, Number and Type of the Appraisal Report
Date of Report :06.01.2017
Report Number :2016-020-GYO-001
Type of Report :Appraisal report relative to the hotel project constructing in the city of
Istanbul, district of Tuzla, Quarter of Aydınlı, Plot no. 4599, for the purpose of determining the
current market value in Turkish Lira currency.
1.2 Information Regarding the Responsible Appraiser that Prepared the Appraisal Report
Report Issued by :Certified Appraiser Özgür ÇAKICI
Report Controlled by :Certified Appraiser Önder ÖZCAN
Responsible Appraiser :Responsible Appraiser Neşecan ÇEKİCİ
Capital Market Board Coverage :Yes
*The hereby appraisal has been prepared in accordance with the scope of the Capital Market
Legislations.
1.3 Date of Appraisal
On the date of 10.10.2016, the necessary procedures have been initiated for this appraisal report.
Subsequently, the report has been concluded on the date of 06.01.2017.
1.4 Reference Agreement
Appraisal Report has been prepared pursuant to the provisions of the Reference Agreement
executed between our company and Akfen Real Estate Investment Trust Inc. on the date of
06.09.2016.
1.5 Statement Whether the Report Has Been Prepared Within the Scope of the Board
Arrangements for the Purpose of the Appraisal
The current Report has been prepared within the scope of the Capital Market Board arrangements.
Page 9
2 Report No: 2016-020-GYO-001
2 INTRODUCTORY INFORMATION CONCERNING THE COMPANY AND THE CLIENT:
2.1 Introductory Information Concerning the Appraisal Company
Company Title : EPOS Real Estate Consultancy and Appraisal Inc.
Company Address : Kore Şehitleri Cad. Yüzbaşı Kaya Aldoğan Sok. Engin İş Merkezi No: 20 Kat:2
Zincirlikuyu / ISTANBUL
2.2 Introductory Information Concerning the Client
Client Title : Akfen Real Estate Investment Trust Inc.
Client Address : Büyükdere Caddesi, No: 201, C Blok, Kat: 8 Levent / ISTANBUL
2.3 The Scope of the Client’s Demand and the Applied Limitations, If Any
The Appraisal report relative to the hotel Project planned situated in the city of Istanbul, district of
Tuzla, Quarter of Aydınlı, Plot no. 4599, has been prepared for the purpose of determining its curent
market value in Turkish Liras currency.
There are no restrictive constraints in force exercised by the client.
Page 10
3 Report No: 2016-020-GYO-001
3 VALUE DEFINITIONS, DESCRIPTION OF APPRAISAL METHODS
There are three different appraisal methods available in our country: “Exemplary Comparison
Approach (Market Approach)”, “Cost Approach” and “Revenue Discount Approach”.
3.1 Exemplary Comparison Approach (Market Value Approach)
With regard to the real estate that will be appraised; this method follows particular procedures, such
as the comparison of the real estate with other real estates that have similar characteristics in the
market and those that have been recently sold, the application of appropriate comparison processes
and making various modifications in the comparable sale values.
The appraisal analysis are carried out by means of comparing the examples found within specific
criteria such as location, visibility, functional use, size, zoning status and its comparable. The market
value approach is the most preferred method when there are widespread and comparable examples
present.
The most trustworthy and realistic approach in real estate appraisal is the market value approach. In
this appraisal method, comparable examples that share common characteristics with the real estate
that has been submitted for the appraisal in the area are evaluated.
The Market Value Approach depends on the following assumptions:
The existence of an available market, in relation to the type of the real estate in analysis, is
acknowledged beforehand.
It has been verified that the buyers and sellers in this market possess excellent knowledge on the
subject of real estate and that, for this reason, time is not a critical factor.
It has been established that the real estate has stayed on the market for an appropriate amount of
time and for a reasonable price.
It has been determined that the chosen comparable examples possess common characteristics with
the real estate in question.
It has been noted that the changes made in the prices given for the chosen comparable examples are
subject to today’s socioeconomic conditions.
Page 11
4 Report No: 2016-020-GYO-001
3.2 Cost Approach
In this method, the appraisal of the real estate is based on the cost of the reconstruction of the real
estate, in accordance with today’s socio-economic conditions.
Pursuant to this approach, it has been established that the value of the real estate consists of two
different facts, namely land and buildings. In addition, it is acknowledged that the real estate has a
significant remaining economic life span. Therefore, for this reason, it is taken into account that the
value of the real estate will decrease in time due to physical wear and become out of date in terms of
functionality and economic status. In other words, this method concedes that the current value of a
real estate can never be more than the cost of its reconstruction.
The appraisal process is calculated by the addition of the interest or gain that the current building
possesses, if any, to the present reconstruction or reinstallation cost of the real estate in question,
followed by the subtraction of the wear and tear ratio from the total cost and, finally, the addition of
the land value.
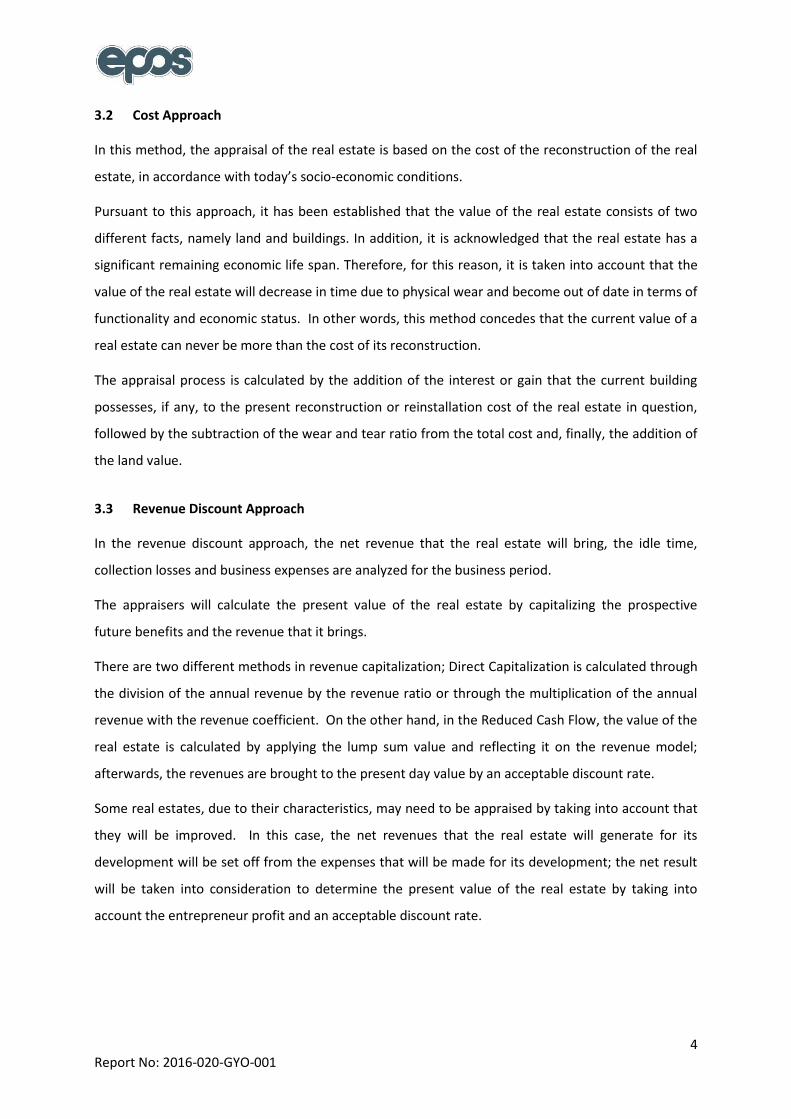
3.3 Revenue Discount Approach
In the revenue discount approach, the net revenue that the real estate will bring, the idle time,
collection losses and business expenses are analyzed for the business period.
The appraisers will calculate the present value of the real estate by capitalizing the prospective
future benefits and the revenue that it brings.
There are two different methods in revenue capitalization; Direct Capitalization is calculated through
the division of the annual revenue by the revenue ratio or through the multiplication of the annual
revenue with the revenue coefficient. On the other hand, in the Reduced Cash Flow, the value of the
real estate is calculated by applying the lump sum value and reflecting it on the revenue model;
afterwards, the revenues are brought to the present day value by an acceptable discount rate.
Some real estates, due to their characteristics, may need to be appraised by taking into account that
they will be improved. In this case, the net revenues that the real estate will generate for its
development will be set off from the expenses that will be made for its development; the net result
will be taken into consideration to determine the present value of the real estate by taking into
account the entrepreneur profit and an acceptable discount rate.
Page 12
5 Report No: 2016-020-GYO-001
4 ECONOMIC CONDITIONS, DATA OF REAL ESTATE INDUSTRY AND ANALYSIS OF THE AREA
WHERE THE REAL ESTATE IS LOCATED
4.1 General and Socio-Economic Data
According to the 2015 results of the Address-Based Population Registration System (ADNKS), Turkey
has a population of 78.741.053 people. In this population, 50,2% (39,511,191 people) are male, and
49,8% (39,229,862 people) are female.
One of the most important aspects of the population of Turkey is its youth. The population aged
between 0 and 14 comprises 24,3% of the total population. However, this ratio has been constantly
decreasing since 1965, and the Turkish society is gradually getting older. While the age group 0-14
comprised 41,9% of the population in 1965, it has fallen to 24,3% in 2015. The annual population
growth in Turkey is 13,4 per thousand. 92,10% of the population live in the central parts of cities and
provinces. The median age in Turkey is 31. The table demonstrates the population data for all of
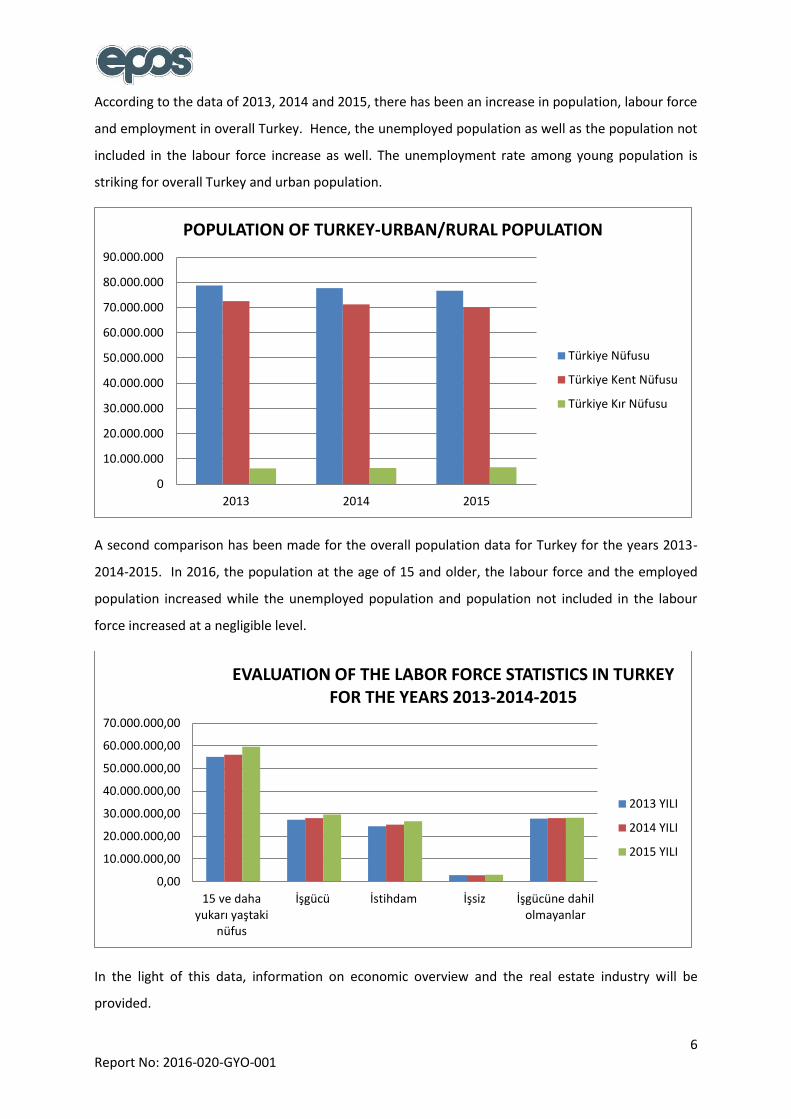
Turkey. It gives a comparison of the data from 2013, 2014 and 2015.
TURKEY
Rows 2013 2014 2015
Rural Population in Turkey 6,633,451.00 6,409,722.00 6,217,919.00
Urban Population in Turkey 70,034,413.00 71,286,182.00 72,523,134.00
Population in Turkey 76,667,864.00 77,695,904.00 78,741,053.00
Population at the age of 15 and older 55,169,000.00 56,084,000.00 59,584,833.00
Labour Force 27,323,000.00 28,036,000.00 29,678,000.00
Employment 24,433,000.00 25,194,000.00 26,621,000.00
Unemployed 2,890,000.00 2,841,000.00 3,057,000.00
Not Included in the Labour Force 27,846,000.00 28,048,000.00 28,176,000.00
Labour Force Activity 49.50 50.00 51.30
Employment Rate (%) 44.30 44.90 46.00
Unemployment Rate (% ) 10.60 10.10 10.30
Non-agricultural Unemployment Rate (%) 12.90 12.30 12.60
Unemployment in young population (ages 15-24)
(% ) 20.70 19.00 19.30
Population Data of 2013, 2014 and 2015 (Source: Turkish Statistical Institute)
Page 13
6 Report No: 2016-020-GYO-001
According to the data of 2013, 2014 and 2015, there has been an increase in population, labour force
and employment in overall Turkey. Hence, the unemployed population as well as the population not
included in the labour force increase as well. The unemployment rate among young population is
striking for overall Turkey and urban population.
A second comparison has been made for the overall population data for Turkey for the years 2013-
2014-2015. In 2016, the population at the age of 15 and older, the labour force and the employed
population increased while the unemployed population and population not included in the labour
force increased at a negligible level.
In the light of this data, information on economic overview and the real estate industry will be
provided.
0
10.000.000
20.000.000
30.000.000
40.000.000
50.000.000
60.000.000
70.000.000
80.000.000
90.000.000
2013 2014 2015
POPULATION OF TURKEY-URBAN/RURAL POPULATION
Türkiye Nüfusu
Türkiye Kent Nüfusu
Türkiye Kır Nüfusu
0,00
10.000.000,00
20.000.000,00
30.000.000,00
40.000.000,00
50.000.000,00
60.000.000,00
70.000.000,00
15 ve dahayukarı yaştaki
nüfus
İşgücü İstihdam İşsiz İşgücüne dahilolmayanlar
EVALUATION OF THE LABOR FORCE STATISTICS IN TURKEY FOR THE YEARS 2013-2014-2015
2013 YILI
2014 YILI
2015 YILI
Page 14
7 Report No: 2016-020-GYO-001
4.2 Global Economic Overview
Following all developments became necessary as a result of globalism and increasing economic links
of countries.
Primary problem in global economic crisis is deflationist (decrease of general price level) process and
correspondingly recession (stability-negative growth). For developing countries, on the other hand,
there are inflationist (general increase in prices) problems and low growth. Related situations have
different characteristics and reasons for every country; therefore, there is no standard prescription
for solution.
After global crisis, most important implementers of economy politics were central banks. Decisions
taken by big and efficient central banks in the world were crucial for not only their own country but
also became a guide for international fund mobility. Developing countries were influenced most by
its both positive and negative effects.
Right after the crisis, USA central bank Fed immediately started to use tools of ‘expansionary l
monetary policy’. For this purpose, many methods were implemented like interest discount, bond
intake, property intake and funding of financial system, and activating credit mechanisms. Through
this kind of monetary policy, financial stabilization, and by stimulating consumption and investment,
growth was aimed as a final goal to get rid of crisis.
Policies followed by Fed to get rid of crisis were extraordinary and with its differences in
implementation it revealed necessary pathway for other world banks. Fed, who immediately
responded to crisis and performed decision-making mechanisms, was followed by ECB (European
Central Bank) even if it was late. In the Far East, Japan central bank followed similar policies to get rid
of deflation and recession, which are primary problems of its economy. In parallel with relative
recovering of USA economy, Fed decreased bond retrieval amount on the date of December 2013 in
order to withdraw monetary expansion policy. Process initiated ahead of time expected in
developing countries (like Turkey, Brazil, Argentina, Indonesia, India) and this caused decrease in
local currencies and then partly outgoing of funds, which are short-term investment oriented. On
October 2014, USA central bank finished ‘cash flow by taking bonds’. However, transition to
increasing ‘interest’ phase, which will end actual monetary expansion, expected by the end of 2015.
In Fed meeting on September 2015, it was stated that (except for one member) concerns regarding
China and other developing countries increased value of dollar and decreased value commodities,
and by taking into consideration economic outlook, labor force market, inflation and risks about
them, there is no need to interest rate hike, although USA economy is strengthening and unutilized
capacity in labor force is decreasing.
Page 15
8 Report No: 2016-020-GYO-001
Following inferences were deduced according to “World Economic Outlook” issue of October 2015
report, which is prepared by IMF twice a year:
Global growth rate in 2015 was expected as 3,10 %. This rate fell 0,30 % of year 2014. It is
also 0,20 % under of rate 3,30 %, which was stated in World Economic Outlook (WEO) report
January 2015. Expectancy of decrease was revised compare to previous report.
Expectancies of main countries and regions stayed indeterminate and unbalanced.
Recovering of developed countries compare to recent years, and for developing economics
and markets recession is foreseen again like previous 5 years. Some increasing market
economies and growth of countries exported petrol represent weak hopes.
Decreasing commodity price, reduced share capital increase negative risks of developing
economies, pressure on market and financial market instability, and therefore Fed tightens
financial conditions regarding developing countries considering expected increasing interest
and worsening global economic outlook.
Developed and developing countries have an important role as middle or long term alliances
one of which has decrease in growth rate and one of which has modest recovering.
Crisis leaved high rate of private and public deficit, financial sector weakness, low rate of
investments for some developed countries having low growth rate. For developing countries,
on the other hand, demographic transitions, investment explosions, revised growth in China,
decrease in commodity price and reregulation of the market is required.
Volatility was related with Greece dept meetings of Chinese authorities on June-July, sharp
drop of Chinese stock market and policy incentives.
Increasing policy interests of USA and worsening global outlook tightened more financial
situation of developing countries since last spring. Dollar, bond and long-term local currency
bond interests increased nearly 50-60 basis point and stock prices decreased, exchange rate
devalorized or pressured.
As a result of nuclear agreement with Iran and low global demand, petrol prices decreased.
Falling production activity in China, investment explosion in mining sector decreased metal
prices.
Countries implemented flexible exchange regime and exported commodities lost large
amount of money.
Developing economies experienced more sharp loss. Major developed economy currencies
experienced modest mobility.
This global factors and country specific developments indicate relatively weaker revival
compare to predicted amounts for 2015 and 2016 modest increase in growth expected for
Page 16
9 Report No: 2016-020-GYO-001
developed economies increase chance of loss for the next year. Developments of this year
reflect a modest recovering of euro and returning of Japan to a positive growth, and
additionally falling in petrol prices and devaluation of money for some conditions.
Developments in developed economies, exporters –especially Norway and Canada- and in
Asia excluding Japan (especially Korea and Taiwan region of China) unemployment decreases
related to degrowth. However, growth in productivity is still weak even in USA where
recovering is stronger.
In 2016, some level of growth is expected in especially North America, however; expectations
are still low considering falling investments, negative demography and weak productivity
growth. Recently, decrease in petrol and other commodity prices must support demand of
developed economies, which are exporters of net commodities. On the other hand, slowness
in rising markets will indicate weaker importations.
Revised fall in commodity prices will pressure inflation in developed economies in next
months, and while revival is happening, expected development in core inflation will delay.
Although core inflation stayed more stable, it is still under targeted amount of central bank.
It is seen that inflation will be low towards falling unemployment and medium term weak
growth.
Growth expectancies are very different depending on regions and countries but outlook
became weak generally considering consecutive 5 years that decrease was foreseen. This
reflects a combination of factors.
For the most developing market economies external conditions became harder. While
money devaluation helps net exportation, depending on weak recoverings and medium level
expectancies for medium level growth, it is expected that future drawl of developed
economies will be more modest than prospected.
Capital flows slowed down in rising markets in last quarters and rising USA currency politics
from zero lower limit related with tightness of external financial conditions.
Decelaration of growth in China is parallel to expectancies until now, however reflections in
cross border are bigger than prospected. This reflected as lower imports to China and lower
prices of commodities (especially metal). Devaluation of Greece by China, volatilities related
to weakness in currencies of developing economies and increasing global risks caused sharp
decreases in property prices throughout world.
Rebound is expected for growth of rising markets and developing economies 2016.
This reflects lower recession and relative normalization in 2015 for countries having
economic trouble (Brazil, Russia, some countries in Latin America and in Middle East), and
Page 17
10 Report No: 2016-020-GYO-001
spill-over effect depending on stronger recovering in economic activities of developed
economies and facilitating of sanctions for Islamic Republic of Iran.
Decreasing growth is expected for China even if it is gradually. Weakness in commodity
prices, slower global growth than expected and possibility of tighter global financial
conditions become a burden to low-income countries. While Chinese authorities implement
reforms towards decreasing financial infirmity strengthening role of market powers in
economy, they confront tradeoffs in their projection of transition to growth depending on
consumption without deceleration of activity.
Some countries, especially the ones with rich sources, have wide current account deficit due
to foreign direct investment. Correspondingly they are more vulnerable towards foreign
financial shock.
Risk balance is still downward. Low level of petrol and other commodities can constitute an
upward demand for commodity importers in some level. However, this complicates the
demand for commodity importers so some of them already confront with nervous initiation
conditions.
Vulnerability of rising markets in terms of continuing fall in commodity prices and sharp rise
in American Dollar is still proceeding and this may force balance sheet of companies in some
countries further.
The Fed meeting in September 2015 stated that the concerns for China and other developing
countries has led to valuation of US dollars as well as a devaluation of commodities, and all
members, excluding one member, stated that an interest rate hike is not necessary considering the
economic overview, labour market, inflation and related risks, although the US economy was
strengthened and the idle capacity in the labour market decreased.
December 2015 saw a quarter point hike in the interest rate after a decade, and the interest rate
went up to 0,25-0,50 percent.
However, the transition to an ‘interest rate hike’ that would essentially mark the end of monetary
easing happened in late 2015.
In 2016, Fed kept the interest rate intact at its meetings in January, March and April. In the meetings
of June 2016 and September 2016, the US Federal Reserve Banks (Fed) announced that the interest
rates would not be changed.
Maintaining its regular behaviour in the recent period, Fed wants to see an economic improvement
that would allow gradual hikes in interest rates. It is observed that the Fed intends to increase the
interest rates before the end of 2016.
Page 18
11 Report No: 2016-020-GYO-001
The global growth rate for 2016 is estimated to be 3,10%. This rate is 0,10% less than the rate in
2015. It is also 0,10% less than the estimates in the April 2017 World Economic Overview (WEO)
report. It is estimated the global economy will grow by 3,40% in 2017, and by 3,80% in 2021.
YearsWord Growth Rate
(%)
USD
Growth
Rate (%)
Euro Region
Growth
Rate (%)
Japon
Growth
Rate (%)
Other Advanced
Economies
Growth Rate (%)
Emerging
Markets and
Economies Asia
Growth Rate (%)
Emerging
Markets and
Economies Europe
Growth Rate (%)
Turkey
Growth
Rate (%)
1998-2007 4,20 2,80 2,40 1,00 3,60 7,60 4,20 4,00
2.008 3,00 0,10 0,40 -1,00 1,00 7,20 3,10 0,70
2.009 -0,10 -3,40 -4,50 -5,50 -2,00 7,50 -3,00 -4,80
2.010 5,40 3,10 2,10 4,70 4,60 9,60 4,70 9,20
2.011 4,20 1,70 1,50 -0,50 2,90 7,90 5,40 8,80
2.012 3,50 1,20 -0,90 1,70 1,90 7,00 1,20 2,10
2.013 3,30 1,20 -0,30 1,40 2,20 7,00 2,80 4,20
2.014 3,40 1,90 1,10 0,00 2,80 6,80 2,80 3,00
2.015 3,20 2,10 2,00 0,50 1,90 6,60 3,60 4,00
2.016 3,10 1,60 1,70 0,50 1,90 6,60 3,30 3,30
2.017 3,40 1,80 1,50 0,60 1,90 6,50 3,10 3,00
2.021 3,80 1,70 1,50 0,60 2,30 6,30 3,20 3,50
Source: The data has been extracted from the “World Economic Overview Report” in October 2016.
Source: The data has been extracted from the “World Economic Overview Report” in October 2016.
The US economy, with the 3,40% recession after the crisis of 2009, has grown by approximately
3,10% in 2010. Growth rates were between 1 and 2% across the years.
The Euro zone, after -4,50% recession with the crisis in 2009, grew by 2,10% in 2010, and by 1,50% in
2011. The regional economy, shrinking for two consecutive years in 2012 and 2013, reached the
growth rates between 1,00 and 2,00% after this year.
Japan, after -5,50% recession with the crisis in 2009, grew by 4,70% in 2010. The regional economy,
which had a falling trend again in 20011, constantly achieved small growth rates except for the
standstill in 2014.
GROWTH RATE %
Page 19
12 Report No: 2016-020-GYO-001
The other developed economies grew by 1 and 3% percent for other years than the 2,00% recession
in 2009.
In developing economies of Asia, the economic growth was approximately 6,30 to 9,60% every year.
The growth rates (%) in Developing Markets and Economies of Europe were 1,20 to 5,40% on the
average for all years except for the -3,00% recession in 2009. (Turkey has also been classified in the
area of developing markets and economies.)
The “World Economic Overview Report” of October 2016, which is issued by the IMF twice a year,
has made the following deductions:
The main unexpected development in the recent months has been the vote in the Great Britain
in favour of leaving the EU. The markets have reacted in an ensuring way to the surprise rejection
of Brexit Vote in the referendum. However, the future of the institutional and commercial
agreements between the UK and the EU is ambiguous, and its ultimate impact is unclear.
With the expectations of low interest rates, lessening concerns for expectations following pro-
growth policies and stabilization of some commodity prices in developed economies, the
accurate financial market sensitivity has been improved in developing economies.
Expectations sharply vary among countries. While robust growth rates were achieved in
developing Asia and India, a sharp slowdown is observed in Saharan Africa.
The uncertainty in developed economies and a curbed overview that is subject to downside risks
may further ignite political dissatisfaction.
Many developing markets face the challenge of policies that force them to comply with weaker
commodity prices.
These concerning expectations make it necessary to produce a political response that will
improve growth and shall stand on a wide basis in managing weaknesses.
The complexity of current expectations, long-term trends, new shocks and ongoing revisions
continues.
These factors entail too much uncertainty for future economic expectation as well as a
suppressed basis for overall growth.
Major ongoing rearrangements/alignments (which is particularly important for developing
countries) include a rebalance of China, long-term fall of commodity exporter, macro-economic
programs and structural compliance.
The basic economic scenario estimates a global growth at the rate of 3,10%. It is estimated that
the rate might go up to 3,40% next year.
This estimate reflects a weaker US economic activity than expected and a significant negative risk
arising from the Brexit vote.
Page 20
13 Report No: 2016-020-GYO-001
It is estimated that the growth in developing markets and economies will slightly improve in 2016
to reach 4,20%, following a recession for 5 consecutive years. The overview of these markets is
irregular and weaker than the past.
As financing conditions are facilitated by expectations of low interest rates in developing
countries, the other factors suppress the activity. This includes the recession in China, and a new
negative economic scattering is taking place.
There is less confidence in resource-intense investments and imports, and a constant alignment
of commodity exporters with lower incomes leads to negative scattering of persisting weak
demand in developed economies, internal conflicts, political disputes and geopolitical tensions.
An improvement is expected in 2017 with better expectations in developing markets and
economies and a slight revitalization in their economies. An improvement in investments is
expected, as well as a decrease in stocks.
Facilitating monetary policy rates has helped to bridle inflation. Malaysia and Indonesia, as well
as Russia and Turkey implemented this policy simultaneously.
4.3 Turkey Economic Outlook
Discipline constructed after 2001 crisis in Turkey economy succeed in issues like public dept, banking
rates, budget balance and until 2008 growth rate continuously increased. Economies developed in
between 2008-2012 influenced by global crisis at least. In this process, increase in yearly growth rate
relieved world economy. Countries like Turkey had brilliant performance after crisis. Recovering
abilities of developing countries are more rapid than developed economies. However, the main
problem of these economies is that they cannot keep gaining and stability. Turkey has problems like
lack of savings, unemployment, problems regarding general level of prices, added values of import
and export items, balance of exchange, middle-income trick, current deficit, demand failure,
technology deficiency, political and geographical risks. Average growth rate of Turkey is 4,8% for 92
years period. Briefly, potential growth rate in full employment level is 6-7%.
IMF argued that political uncertainty will decrease domestic demand and revised growth
expectancies downwardly in its evaluation regarding Turkey economy in World Economic Outlook
Report.
According to this, growth expectancy is 3% for this year and 2,9% for the next year for Turkey. These
rates were stated as 3.1% and 3.6% in previous report.
Inflation expectation of IMF for Turkey increased from 6,6% to 7.40% for 2015 and 6,50% to 7.00%
for 2016.
Page 21
14 Report No: 2016-020-GYO-001
YEARS 1998-2007 2008 2009 2010 2011 2012 2013 2014 2015 2016 2017 2021
TURKEY GROWTH RATE % 4,00 0,70 -4,80 9,20 8,80 2,10 4,20 3,00 4,00 3,30 3,00 3,50
Source: Word Economic 2016 October World Overview Report
The “World Economic Overview Report” of October 2016, which is issued by the IMF twice a year,
has made the following deductions for Turkey:
The feelings towards developing economies have improved. The reason is pressure of the
expansions in economic recovery, and the improvement in long-term real interest rates and net
asset values.
However, in supporting economic activity with the loosening in macro-economies, the
uncertainties following the recent terrorist attacks and the failed attempt of coup may affect the
growth rates in 2016-2017.
It will sustain its current expenses and monetary expenses in parallel to “Medium-term program
of 2016-2018 on the basis of financial projections, current trends and policies.”
The estimates for broad money and broad long money are based on IMF projections. It is
estimated to develop with a fixed spreading rate against US instruments interest rate that is
similar to the short-term deposit rate.
In its assessment of the Turkish economy, IMG claims that political uncertainty will lead to a
decrease in domestic demand, and has revised its growth expectations to downward.
According to the World Economic Outlook Report, the GDP growth rate, which was 4,00% in
2015, will be 3,30% in 2016, 3,00% in 2017, and 3,50% in 2021.
Wholesale price index (WPI) was 8,80% in 2015. It is estimated that the index will be 9,10% in
2016, and will continue to rise in 2017 to 9,10%, and to 6,20% in 2021.
The current account balance will be -4,50% in 2015. It is estimated that the balance will be -
4,40% in 2016, -5,60% in 2016, and increase to -5,60% in 2021.
Moody’s, an international credit rating institution, has revised Turkey’s credit score from “Baa3”
to “Ba1”, and defined its rating overview as “static.”
-10,00
-5,00
0,00
5,00
10,00
19
98
-20
07
2.0
08
2.0
09
2.0
10
2.0
11
2.0
12
2.0
13
2.0
14
2.0
15
Beklen
ti 20
16
Beklen
ti 20
17
Beklen
ti 20
21
GDP GROWTH RATES IN TURKEY ACROSS YEARS (%)
TürkiyeBüyüme Oranları (%)
Page 22
15 Report No: 2016-020-GYO-001
4.4 Overview of Real Estate Industry
Real estate sector became a growing sector contrary to service, industry and rural sector recently.
Although insufficient capital source makes hard to invest to rural and industry sector, small scale
capital stock may be sufficient to invest in real estate sector. For this reason, real estate sector of
Turkey depends relatively on national capital. It is defined as leading sector since it mobilize other
sectors and as sponge sector since it may absorb unqualified workers. Almost all production of real
estate sector counts as investment good. Real estate sector in Turkey develops through these
investments.
Construction sector, which was initiated with public investments, large scaled infrastructure projects
in early republic period, has influences of private sector through liberal economy effects in 1950s
especially in public expenditures. After the year of 1950, construction sector developed through
barrage, hydroelectric power stations, highways and housing investments. After 1980 in neo-liberal
period, on the other hand, housing investments became prominent as a result of increasing
migration. In liberal period after 2002, shopping mall, residence and housing investments gained
importance through influence of TOKİ.
In sectoral distribution of long-term external debt in period of 2002-2014, construction-real estate
sector has impressive intensity.
Recently, it is seen that legal regulations concentrated in real estate sector. Moreover, sales of the
lands legally actualized in 2012 within the scope of the law “sale of the agricultural estate belonging
to Treasury, support for development of forest villagers and assessment of outside of the forest
borders on behalf of Treasury”, which is known in public opinion as “2B law”. However, these sales
became less than expected and did not influence building sector sufficiently. Advantages of urban
renewal law increased growth of real estate sector in 2013.
Decision directed to removal of restrictions over possessing real estate of foreigners through the law
“Law Organizing Property Sale to Foreigners” provided rising attractions of investors in especially
Russia, Middle East, and Asia. Purchasing real estate of foreigners started to increase gradually.
Additionally, following reasons have influence on development of real estate sector:
Attraction of investors from different countries for Istanbul as a brand city, and laying the
foundations of Istanbul to be a financial center,
Infrastructure projects that attract attentions (3rd bosphorus bridge, all tunnel projects in
bosphorus, 3rd airport, metro projects in metropolitans etc.)
Page 23
16 Report No: 2016-020-GYO-001
Increasing transportation opportunities, widening metropolitan borders and growing living
spaces,
Urban renewal and related regulations,
Continuing rural to urban migration,
Effect of natural demand as a result of having young population,
Changing nuclear family concept,
Precautions for housing purchase and saving incentives to keep sector alive,
Tendency of procrastination of demand for housing and automotive, which is generally seen before
elections, was not influenced this year, on the contrary, these two sectors was quite alive. This may
be thought as a kind of protection method of customers related to expectation of increasing
demand.
It is evaluated that stabile development of real estate sector in Turkey in 2016 depends on political
and economic stability, interest of foreign investor and growth rate of economy. It is expected that
residence sale to foreigners will be stable because of stagnancy in other developing countries.
It is estimated that in 2016 a stable rise in the real estate industry in Turkey will rely on political and
economic stability, the interest of foreign investors in Turkey and high growth rates of Turkish
economy. Housing sales to foreigners is expected to be static due to the stagnation in other
developing countries. The reasons for the increase in asset prices include expanding monetary policy,
positive course of economic growth, abundance of liquidity, new inventions, financial liberalization,
financial innovations, facilitation of borrowing capabilities and a significant rise in loans, changes in
portfolio structure and government policies.
As a result of economic decisions of the central government, the sales in construction industry, which
is the main pillar of economy, as well as real estate sales are expected to increase.
The introduction of new directions of Banking Regulation and Supervision Agency (BDDK) which
brings changes to loaning transactions and to debit and credit cards aims to regulate the number of
installments on credit cards, increase the maturity limit in consumer loans from 36 months to 48
months, bring new regulations on personal loans across the industry and to vitalize economy.
Moving the limit of the ratio of the mortgage loan to the value of the housing which is taken as a
collateral from 75% to 80%, the campaigns launched by Emlak Konut GYO and GYODER after the
coup attempt of July 15th, decreasing the VAT to 8% for houses larger than 150 square meters aim at
accelerating the construction industry, which is the main pillar of economy, and pushing the sales of
real estate.
Page 24
17 Report No: 2016-020-GYO-001
Although here have been economic contractions in a global scale, these decisions along with the
young population structure of Turkey, continued migration to urban areas, and large-scale project
with ongoing investment lead to an expectation that real estate sales will maintain its trend in 2017
as it happened in 2016, and will continue to increase.
4.5 Information Regarding the Tourism Industry
Tourism maintains its characteristics of being an ever-growing industry in Turkey just as all around
the world.When the data of the Ministry of Tourism is examined, it has been seen to which point
Turkey has come at the last quarter century in tourism.While the number of people visiting the
country for touristic purposes was 4.4 million in the 1990s, the beginning of the tourism industry, this
figure exceeded 10 million in the 2000s. When it comes to the 2010s, it now has an important place
in the world market and has exceeded 30 million.At the last point, Turkey ranked number five in the
world ranking under the category of the most preferred countries of the tourists as destination in
2015.
Based on TUIK data, the tourism expenditure of 2015 has been seen to reach 5 billion 698 million 423
thousand dollars by increasing 4.2% compared to the previous year.It has been stated that 4 billion
768 million 443 thousand dollar are personal tour and 929 million 980 thousand dollar are package
tour expenditures.The number of citizens visiting the abroad in the relevant year has been seen to
become 8 million 750 thousand 851 by increasing 9.6% compared to the previous year.Their average
expense per capita was 651 dollars and 11.9 days were spent for accommodation.
According to the September 2016 report of T.R. Ministry of Culture and Tourism, the number of
foreign people visiting our country in January-September in 2016 has been seen to decrease 31.96%
as compared with the same period of the last year. It has been realized in the ranking of the
countries sending the visitors to our country at the most in January-September in 2016 that Germany
ranked first with 15.51% (3.139.308); Georgia ranked number two with 8.34% (1.689.543) and
England was the third country with 7.32% (1.481.200). When the change in the numbers of tourists
visiting our country between 2015-2016 are examined in terms of the countries where they come
from, it has been noticed that people coming from the Russian Federation decreased 83.55%, but
those coming from Ukraine increased 54.29%.
It has been seen that Turkish hospitality industry has left behind the most 'empty' summer of its
history due to the negative impacts of the successive terrorist incidents and coup attempt.The
authorities have announced that hotels in Turkey have experienced a partial occupancy increase with
the domestic tourists in the coastal regions and Arab tourists in the cities during the Feast of
Sacrifice, but the summer season called as the peak season is not enough to save the season.When
the October 2016 Country Performance Report prepared by STR Global, one of the Leading Data and
Page 25
18 Report No: 2016-020-GYO-001
Analysis Companies of the World, was examined, hotel occupancy in October 2016 in Turkey was
recorded as 52.2% with a decrease of 14% compared to the same period of 2015.(TR October 2015:
60.7%).(TR October 2014: 63.8%) Israel experienced the highest decrease rate (15.3%) in October
among European countries.Turkey (14 %) became the third countries following Israel (15.3 %) and
Estonia (15.2 %) in terms of decrease rate.
However, Turkey had the lowest occupancy rate among European countries with an occupancy rate
of 52.2% in terms of occupancy rate.Croatia had the highest increase rate with 43.2%.(October 2016 :
62.7%)Malta had the highest occupancy rate in October 2016 with 89.5%. When we examine the
first-ten month period of 2016, Turkey became the country with the highest decrease rate in Europe
with 20.8% decrease in the occupancy rate and the lowest occupancy rate with 50.4% occupancy
rate. (the first ten months of 2015 63.7%, the first ten months of 2014 62.7%)
However, hotel investments have increasingly continued in spite of all kinds of difficulties.According
to the date of Tophotelprojects, a German-based hotel investment research institute, there are 57
hotel projects for three-, four-, five-star hotels at investment, project and planning phases in Turkey.
The majority of 57 projects are located in Istanbul.
Page 26
19 Report No: 2016-020-GYO-001
4.6 Analysis Of The Area Of The Real Property
4.6.1 Analysis of the Region Where the Real Estate is Situated
Istanbul is the Turkey's most populous, economically leading city, the cultural and financial center
and with 14.2 million populations is the largest city that is 1st in Europe and 5th in the world ranking
according to the population.
It consists of Catalca Peninsula in the West and Kocaeli Peninsula in the East. The city consists of
Black Sea in the North, Marmara Sea in the South and Bosporus in the middle, and it is the Neighbor
of Districts Saray from Tekirdag in the northwest, Cerkezkoy, Corlu from Tekirdag in the west,
Marmara Ereglisi from Tekirdag in the southwest, Kandıra from Kocaeli in the northeast, Korfez from
Kocaeli in the east and Gebze from Kocaeli in the southeast.
Istanbul City Map
Studies have revealed that the city's history dates back to the year B.C 6500. Istanbul is a
transcontinental city and while its part in Europe was called the European side or Rumeli Side, its part
in Asia was called the Anatolian Side. Istanbul Walls constituted the western boundary of Istanbul,
located on a peninsula formed by Marmara Sea at three sides, the Bosphorus and the Golden Horn in
the history as the first. The city, expanded 4 times by construction of the walls moved to westward
further at every time during the development and the growth process, has 40 districts.
Total Population of Istanbul is 14.657.434 people according to the Population Census Results of the
Address Based Population Registration System (ABPRS) for the year 2015 which were prepared by
Turkey Statistical Institute (TSI).
Istanbul has become the center of economic life in Turkey as it is a crossroads of land and sea trade
routes and its strategic location. The city is also the largest industrial center.
Page 27
20 Report No: 2016-020-GYO-001
The city meets an important part of industrial employment in Turkey. It has approximately 38% of an
industrial area. Today, Istanbul has more than half of the Turkey's production and 45% of trade
volume. In addition, Istanbul is one of the popular tourism centers due to its redundancy of historical
monuments and works and having the Bosphorus.
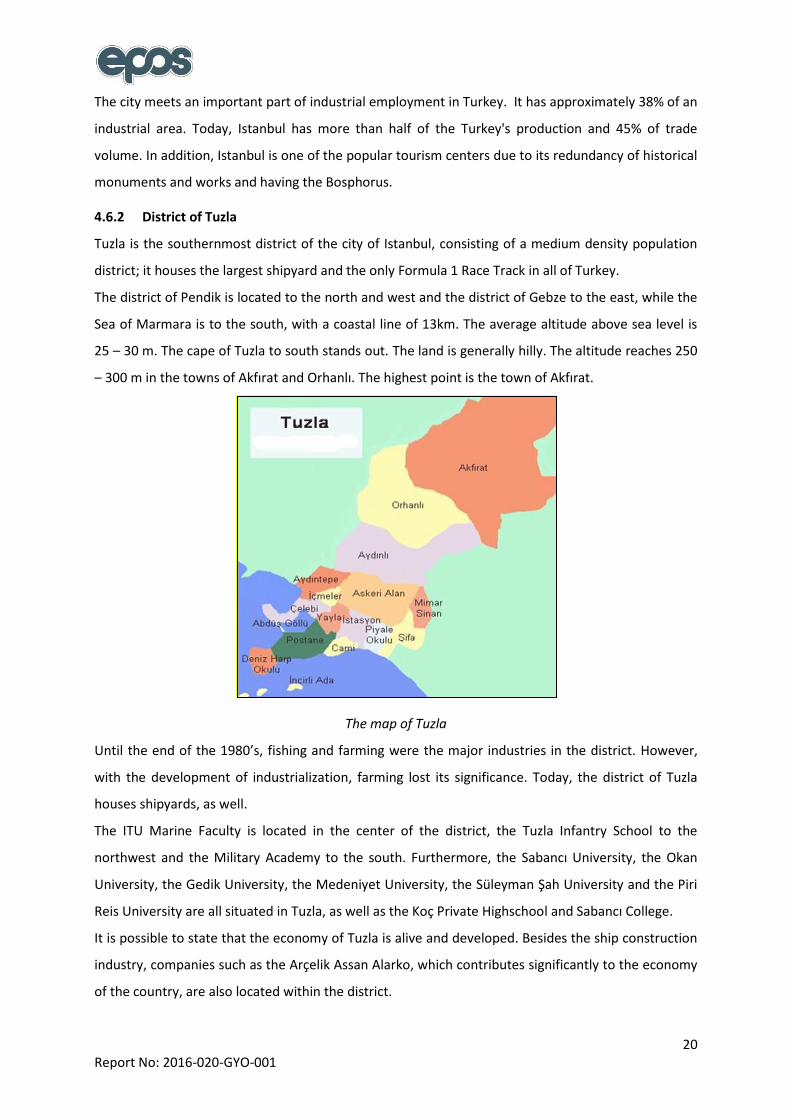
4.6.2 District of Tuzla
Tuzla is the southernmost district of the city of Istanbul, consisting of a medium density population
district; it houses the largest shipyard and the only Formula 1 Race Track in all of Turkey.
The district of Pendik is located to the north and west and the district of Gebze to the east, while the
Sea of Marmara is to the south, with a coastal line of 13km. The average altitude above sea level is
25 – 30 m. The cape of Tuzla to south stands out. The land is generally hilly. The altitude reaches 250
– 300 m in the towns of Akfırat and Orhanlı. The highest point is the town of Akfırat.
The map of Tuzla
Until the end of the 1980’s, fishing and farming were the major industries in the district. However,
with the development of industrialization, farming lost its significance. Today, the district of Tuzla
houses shipyards, as well.
The ITU Marine Faculty is located in the center of the district, the Tuzla Infantry School to the
northwest and the Military Academy to the south. Furthermore, the Sabancı University, the Okan
University, the Gedik University, the Medeniyet University, the Süleyman Şah University and the Piri
Reis University are all situated in Tuzla, as well as the Koç Private Highschool and Sabancı College.
It is possible to state that the economy of Tuzla is alive and developed. Besides the ship construction
industry, companies such as the Arçelik Assan Alarko, which contributes significantly to the economy
of the country, are also located within the district.
Page 28
21 Report No: 2016-020-GYO-001
Many industry and commercial businesses, together with substantial ateliers and subsidiary
companies, provide employment to the district residents.
An area of 1.283.608 m² is used for ship construction industry in Tuzla since the year of 1978.
The Tuzla Organized Industry Area, the Tuzla Organized Leather Industry and Independent Area, the
Tuzla Organized Chemists Industry Area, the Tuzla Organized Varnish Paint Industry and the Tuzla
Organized Marble-Cutter Industry contribute greatly to the economy of the country and provide
employment to many citizens.
According to the Address Based Population Registry System (ADNKS) prepared by the Turkish
Statistical Institute (TUIK) for the year of 2015, the population of Tuzla is 234.372.
4.6.3 Information Regarding the Real Estate Industry in Tuzla and the Hotel Market
With regard to the real estate industry in Tuzla, aside from the residential and boutique hotels, the
Tuzla Shipyard and the İçmeler Thermal Springs affect the markets; furthermore, the market is
predominantly residential.As a result of the detailed surveys performed in the district of Tuzla, it has
been concluded that there are “business hotel” concept hotels recently operating under an
international brand name and some of them are still under construction. This situation shows Tuzla
shipyard and thermal spring region has a tourism potential. However, number of the hotels situated
in the region is still insufficient; furthermore, hotels nearby are mostly boutique hotels and usually
provide services to passengers, personnel and captains from the ships that arrive to the shipyard for
repairs or maintenance.
NAME OF THE HOTEL NUMBER OF STARS TOTAL NUMBER OF ROOMS
Chatto Residence BOUTİQUE 29
Radisson Blu Tuzla 5 STARS 249
Double Tree By Hilton 3 STARS 84
Tuzla Town Hotel BOUTIQUE 23
Lounge İstanbul BOUTIQUE 20
Elexia
Mix Used Type Project which has a Hotel Project. It is still under Construction
108
The Special Company prices in these hotels per room vary between 40- 68 Euro, breakfast included.
Another important factor that affects the region is the İçmeler/Tuzla thermal springs, which
has been attracting visitors to the area for many years. For instance, the Thermal Istanbul
Project constructions are underway by the Ak İnşaat construction company. The Project in
question is under thermal hotel concept with a different target audience than the current
Page 29
22 Report No: 2016-020-GYO-001
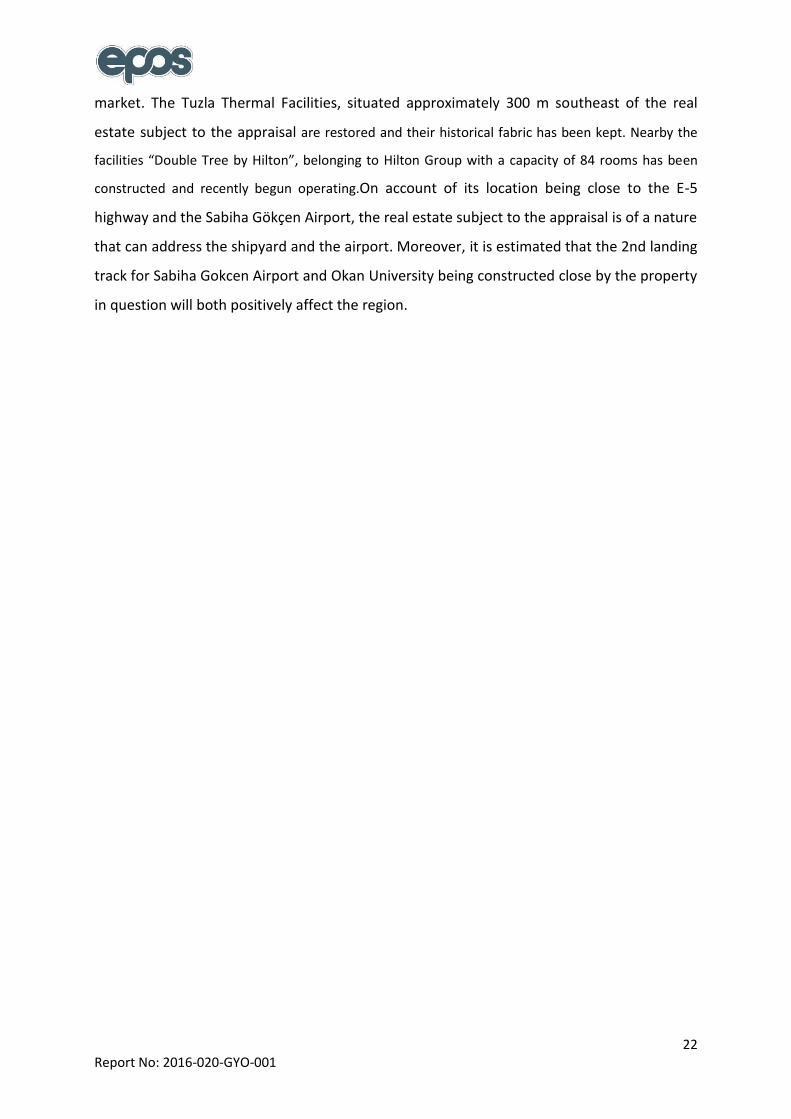
market. The Tuzla Thermal Facilities, situated approximately 300 m southeast of the real
estate subject to the appraisal are restored and their historical fabric has been kept. Nearby the
facilities “Double Tree by Hilton”, belonging to Hilton Group with a capacity of 84 rooms has been
constructed and recently begun operating.On account of its location being close to the E-5
highway and the Sabiha Gökçen Airport, the real estate subject to the appraisal is of a nature
that can address the shipyard and the airport. Moreover, it is estimated that the 2nd landing
track for Sabiha Gokcen Airport and Okan University being constructed close by the property
in question will both positively affect the region.
Page 30
23 Report No: 2016-020-GYO-001
5 INFORMATION IN REGARD TO THE REAL ESTATE SUBJECT TO THE APPRAISAL
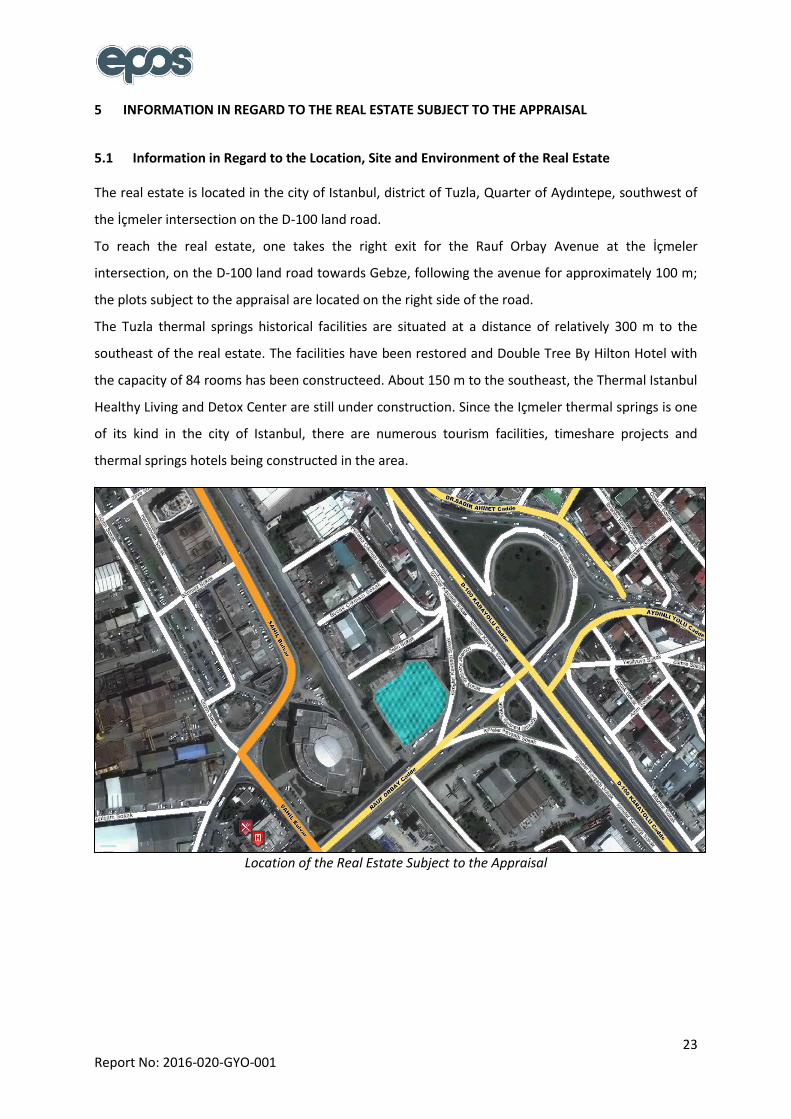
5.1 Information in Regard to the Location, Site and Environment of the Real Estate
The real estate is located in the city of Istanbul, district of Tuzla, Quarter of Aydıntepe, southwest of
the İçmeler intersection on the D-100 land road.
To reach the real estate, one takes the right exit for the Rauf Orbay Avenue at the İçmeler
intersection, on the D-100 land road towards Gebze, following the avenue for approximately 100 m;
the plots subject to the appraisal are located on the right side of the road.
The Tuzla thermal springs historical facilities are situated at a distance of relatively 300 m to the
southeast of the real estate. The facilities have been restored and Double Tree By Hilton Hotel with
the capacity of 84 rooms has been constructeed. About 150 m to the southeast, the Thermal Istanbul
Healthy Living and Detox Center are still under construction. Since the Içmeler thermal springs is one
of its kind in the city of Istanbul, there are numerous tourism facilities, timeshare projects and
thermal springs hotels being constructed in the area.
Location of the Real Estate Subject to the Appraisal
Page 31
24 Report No: 2016-020-GYO-001
Vicinity of the Real Estate Subject to the Appraisal and the Current Satellite Image of the Area
The plot subject to the appraisal is located considerably close to the Tuzla shipyards, at a distance of
roughly 800 m to the Tersaneler Avenue. The real estate is at a distance of 3 km to the Neomarin and
Pendorya Shopping Malls, located at the Tuzla Tersane intersection, 6,5 km to the Pendik Marina, 12
km to the Courthouse of the Anatolian side and 13 km to the Sabiha Gökçen Airport.
The Tuzla Gisbir Hospital and the Tuzla Shipyards, along with the Thermal Istanbul and Innovia Suites
projects are found in the vicinity of the real estate in question.
İçmeler Kaplıcaları
(Double Tree By Hilton)
Page 32
25 Report No: 2016-020-GYO-001
5.2 Information with Regard to the Land Registry of the Real Estate
City : Istanbul
District : Tuzla
Quarter : Aydınlı
Town : -
Locality : -
Section No : 18
Block No : -
Plot No : 4599
Surface Area : 4.687,64 m²
Owner : Akfen Real Estate Investment Trust Inc.
Type : Land
Title Deed Date : 16/07/2013
Roll No : 10896
Volume No : 239
Page No : 23588
5.2.1 Investigation of the Land Registry of the Real Estate
Pursuant to the 02.11.2016 dated title deed sample, obtained from the TAKBIS portal of the Land
Registry Cadastral Office General Directorate, the following restrictions have been observed on the
share owned by AKFEN GYO INC. with regard to the real estate subject to the appraisal.
Statements Section
09.07.1976 dated Accessory annotation with the Roll no. 5543
Annotations Section
Contract annotation on behalf of TEDAŞ for a term of 99 years, with an amount of 1 TL, Dated
29.01.2004 and Roll no. 1503
Pledge Rights Section of the Real Estate
1 st degree mortgage with an amount of 173.052.185 Euro on behalf of Credit Europe Bank
N.V., Dated 26.02.2015 and roll no 2965
Page 33
26 Report No: 2016-020-GYO-001
5.2.2 Changes Occurred in the Land Registry of the Real Estate within Last Three Years
While 425990/468764 share of the plot of the real estate subject to appraisal was belonged
to Akfen GYO INC and, 21387/234382 of it was registered to the Treasury, the share owned
by the Treasury had been bought by Akfen GYO INC for 1.924.830 TL on 07.01.2015 and
Akfen GYO INC has become the only owner of the plot.
With regard to the real estate subject to the appraisal; after the abandonment of the plot
3558 with an area of 142,67 m², plot 3590 with an area of 159,3 2 and plot 3624 with an area
of 125,77 m², belonging to the Treasury, for the purpose of road and green spaces, they have
been unified with the Section 18, Plot 3623 with an area of 4.259,9 m², belonging to AKFEN
GYO INC.; thus making up the Section no. G22B1C2C Plot 4599 with an area of 4.687,64 m²,
of which the Treasury and AKFEN GYO INC. are the shareholders. (Registry Date: 26.06.2014
with the Roll no. 9695)
It has been observed that, before the unification process, the plot 3623, owned by Akfen
GYO INC., had been in the ownership of Seyfettin Polat Steel Plate Ind. and Trade. Co. Ltd.,
which had been sold and later registered under the name of Akfen Real Estate Investment
Trust Inc. on the date of 16.07.2013 with the Roll no. 10896.
It has been observed that, before the unification process, the plot 3623, owned by Akfen
GYO INC., used to have a surface area of 6.375,00 m², which was subjected to a Development
Readjustment Share (DOP) of abandoning 1.597,08 m² to the road, 343.07 m² to park areas
and 204,95 m² to park areas, constituting a total surface area of 2.115,51 m²; therefore, it
has been noted that, after the abandonment, the plot in question has been registered with a
total surface area of 4.259,90 m², on the date of 16.07.2013, Roll no. 10896.
It has been observed that, before the unification process, the plot 3623, owned by Akfen
GYO INC., was classified as “Hascan Flour and Semolina Factory 7 Story Stone Building with a
Garden” and it has been noted that, on the date of 09.07.2013, it has been reclassified and
registered as “Land” with the Roll no. 10543.
Page 34
27 Report No: 2016-020-GYO-001
5.2.3 Opinion Whether There Is an Obstacle In Including the Investment Trust Portfolio in Terms
of Land Title Records to the Real Estate Within the Scope of the Capital Market Legislation
The accessory annotation on the statements section has been allocated for the old Sinangil Flour
Factory and with the demolition of the factory, the aforementioned annotation became void;
however, it still has not been canceled from the land registry book.
The contract annotation on behalf of TEDAŞ has been made due to the cables passing below or
above the plot; on that account, it is symbolic in nature and does not pose any real restrictions.
With regard to the mortgage stated on the pledges section of the real estate; the mortgage,
according to 07.12.2015 dated letter from the Credit Europe Bank N.V and pursuant to the
agreement between Akfen Real Estate Investment Trust Inc. and Accor Group, corresponds to the
warrant of the project Financial Sendication Credit provided in the year of 2015 with the aim of
providing the investment credit that will be used to finance 8 hotels under the brand names of “IBIS”
and “NOVOTEL” operated by ACCOR Group and 1 other hotel that will be operated under the name
of “IBIS” after the complement of its ongoing construction. The letter of Credit Bank Europe in
question has been enclosed herewith.
Pursuant to the 1st clause of the Article number 30 of the Communiqué Regarding the Real Estate
Investment Trusts Principles, published in the 28.05.2013 dated official gazette of the Capital Market
Board, Real Estate Investment Trusts can only institute mortgage, hypothecate or other limited rights
on the assets in the portfolio throughout the purchase of real estates, real estate projects and rights
with regard to a real estate, for the purpose of referring to the financing of these actions or of
providing credit for investments.
Pursuant to the related article of the Communiqué in question, the mortgages on the real estate do
not constitute an obstacle for the real estate to be included in the real estate investment trust
portfolio, within the scope of the Capital Market regulations.
Pursuant to the Communiqué in question and within the scope of the capital market regulations,
there are no obstacles that prevent the real estate from being included in the real estate investment
trusts portfolio.
Page 35
28 Report No: 2016-020-GYO-001
5.3 Inspection of the Zoning Information of the Real Estate
According to the zoning status letter dated 28.12.2016 obtained from Tuzla Municipality Zoning and
Urbanism Directorate; current zoning status of the real estate is included in the “Hotel and Congress
Area” on plot no: 4599 with the approval date of 03.01.2003- 21.006.2011 with a scale of 1/1000
within the scope of “In between Tuzla E-5 Highway and Railway Industry Lane Transition
Implementary Development Plan” under the structuring conditions of TAKS:0,40 KAKS:2,25
Hmax:Free.
The zoning status letter obtained from Tuzla Municipality Zoning and Urbanism Directorate has been
enclosed herewith.
Area included in the prevent allowed in accordance with the zoning status of the plot is 10.546,785
m² and 4.639,05 m² of the area included in the prevent used in the hotel Project. The rest of the area
included in the prevent which is 5.908,14 m² has been left as the reserve hotel, Office and
commercial area.
5.3.1 Plan, License, Diagram and Similar Documents with Regard to the Real Estate
Pursuant to the surveys performed on the proceedings file in the Tuzla Municipality Zoning and
Urbanism Directorate archives, architecture project numbered 1350 and 20.02.2015 dated and
building licence numbered 110/15 with the date of 02.03.2015 and occupancy permit 31.08.2016
dated and 251/16 numbered belonged to hotel have been found.
5.3.2 Building Inspection Institution and Maintenance
Building Inspection of the hotel is conducted by the Etik Yapı Denetim INC. Operating in the address
of Talatpasa Avenue Duru Street no:2 floor:5 Gultepe/ Kagithane/ Istanbul.
5.3.3 Changes that Have Occurred in the Legal Status (Changes in the Zoning Plan,
Nationalization, etc.) of the Real Estate within the Last Three Years
With regard to the plot no. 3623 that was in the ownership of AKFEN GYO INC. before the
unification process, alteration to the comprehensive zoning plan with a scale of 1/5000 has
been suspended with the 25.11.2011 dated court order docket no: 2010/2370.
Afterwards, on the grounds that it has been concluded that the claimants do not have the
necessary capacity to object to the decision of the court, in regards to the alterations to the
comprehensive zoning plan with a scale of 1/5000, the non-suit has been decreed with the
date of 24.02.2012 and decree no: 2012/293; the court decision in relation to the
comprehensive zoning plan with a scale of 1/5000 remains effective.
With regard to the real estate subject to the appraisal; after the abandonment of the plot
3558 with an area of 142,67 m², plot 3590 with an area of 159,3 2 and plot 3624 with an area
Page 36
29 Report No: 2016-020-GYO-001
of 125,77 m², belonging to the Treasury, for the purpose of road and green spaces, they have
been unified with the Section 18, Plot 3623 with an area of 4.259,9 m², belonging to AKFEN
Real Estate Investment Trust INC.; thus making up the Section no. G22B1C2C Plot 4599 with
an area of 4.687,64 m², of which the Treasury and AKFEN Real Estate Investment Trust INC.
are the shareholders. (Registry Date: 26.06.2014 with the Roll no. 9695)
While 425990/468764 share of the plot of the real estate subject to appraisal was belonged
to Akfen GYO INC and, 21387/234382 of it was registered to the Treasury, the share owned
by the Treasury had been bought by Akfen GYO INC for 1.924.830 TL on 07.01.2015 and
Akfen GYO INC has become the only owner of the plot.
5.3.4 Opinion Whether the Necessary Permit and Documents Pursuant to the Legislation are
Accurate and Complete
Considering the approval of the architecture Project and building license of the hotel Project subject
to appraisal, all of the permits and documents neccessary according to the legislations are accurate
and complete.
5.3.5 Opinion Whether There Is an Obstacle in Including the Investment Trust Portfolio in Terms
of Zoning Information to the Real Estate within the Scope of the Capital Market Legislation
Pursuant to the subparagraph “a” of the Article number 22 of the Communiqué, with regard to the
real estate investment trusts principles of the Capital Market Board regulations, the Real Estate
Investment Trusts “can purchase, sell, lease, lease out and pledge to purchase or sell all sorts of real
estate, such as land, plot, building, office building, shopping mall, hotel, logistic centers, warehouse,
park and hospitals, for the purpose of achieving gross profit or lease revenue.” Therefore, there are
no obstacles that prevent the inclusion of the real estate subject to the appraisal as a land in the Real
Estate Investment Trusts portfolio.
5.3.6 Statement that the Detailed Information, along with the Value in Question Regarding the
Project, are Completely in Connection with the Project and that, in the case of Executing a
Different Project, the Resulting Value Might Vary
Detailed Information and plans are completely in connection to this project in question and in case of
executing a different project the resulting value might vary.
Page 37
30 Report No: 2016-020-GYO-001
5.4 Physical Characteristics of the Real Estate
Indoor construction charateristics of the hotel construction are as follows:
Ibis Hotel’s Structural and Indoor Construction Characteristics
Total Area 10.965,28 m²
Age Newly Completed
Structural Type Ferroconcrete
Disposition Detached Building
Number of the floors 16 floored (3 Basement+ Ground+ 11 normal floors+ Attic)
Electricity City grid
Heating System Fan Coil (its maontage is ongoing)
Water City grid
Sewer System City grid
Elevators 4 (3Customers, 1 Staff)
Besides; 1 Elevator between parking lot- lobby
Ventilation System Available
Fire Escape Available
Fire extinction system Available
Parking Area Closed Parking lot with a capacity of 11 cars
Generator Existing (640 KVA)
Ground Screed
Wall Gypsum plaster
Joinery Alumium profile
Illumination Flouresan
Page 38
31 Report No: 2016-020-GYO-001
5.4.1 Inspections Performed Within the Premises of the Real Estate
The real estate subject to appraisal is the 3 star Ibis Hotel located in the city of Istanbul, Tuzla
district.
The hotel has been constructed as 16 stroyered in total consisting of 2 basement+ ground+
11 normal floors+ attic floor.
Closed area of the hotel according to its project is 10.965,28 m² in total.
There are 200 rooms in total consisting of 147 standard rooms, 35 standard rooms with twin
beds, 16 combinable rooms and a disabled room in the hotel.
Besides, there are a cafe-bar, restaurant with the capacity of 100 persons, 1 big meeting
room (for 100 persons), 2 combinable meeting rooms (for 10 and 12 persons.)
According to the approved architecture project and site-evaluation building is structured as
follows;
Floor Construction
Area(m²) Volumes
3. Basement Floor 1.145,32 Parking lot for 11 cars, air conditioner operator room, toilet water tank, fuel tank, technical manager’s room, 2 stores, heating central, electricity room
2. Basement Floor 1.219,25 Sanctuary, network room, generator room, store, laundry room, staff changing rooms, WC, garbage room, cold store, staff cafeteria
1.Basement Floor 1.120,14 Restaurant, café-bar, lobby, office, reception, luggage room, men-women-disabled WC, kitchen, garbage room, scullery, store
Ground Floor 809,14 Meeting rooms, men-women- disabled WC, foyer, furniture store, management offices general manager’s room, service room
1.Floor 639,41 4 twin rooms, 10 standard rooms, 4 combinable twin rooms, 1 disabled room, electricity room
2. Floor 553,65 3 twin rooms, 12 standard rooms, 2 combinable standard rooms, 1 disabled room, laundry room, electricity room
3. Floor 546,00 3 twin rooms, 14 standard rooms, 2 combinable rooms, electricity room
4. Floor 541,54 3 twin rooms, 13 standard rooms, 2 combinable standard rooms, electricity room, ironing room
5. Floor 528,62 3 twin rooms, 13 standard rooms, 2 combinable standard rooms, electricity room, ironing room
6. Floor 528,62 3 twin rooms, 15 standard rooms, electricity room, laundry room
7.Floor 528,62 3 twin rooms, 15 standard rooms, electricity room, laundry room
8. Floor 528,62 3 twin rooms, 15 standard rooms, electricity room, laundry room
9.Floor 528,62 3 twin rooms, 15 standard rooms, electricity room, laundry room
10. Floor 528,62 3 twin rooms, 15 standard rooms, electricity room, laundry room
11.Floor 536,40 4 twin rooms, 4 combinable twin rooms, 10 standard rooms, electricity room, laundry room
Attic 564,84 Elevator operating room, elevator platform
Roof 117,87 -
TOTAL 10.965,28 200 Rooms
The construction of the hotel has been completed and furnished
Floor coverings are ceramic in wet areas, carpets in rooms and corridors, laminated parked in
some surfaces’ areas
Page 39
32 Report No: 2016-020-GYO-001
Mechanical and electrical installations, of hotel have been completed and hotel has 1 generator,
2 air handling units, 2 chiller groups.
Fire staircase and fire system (fire hose, fire detector and sprinkler system) have been completed
The furnishing is completed in the hotel interior
The exterior of the hotel is covered with stone.
The hotel has not opened yet, and as of the date of the appraisal, preparations for the opening of
the hotel have been continued.
Page 40
33 Report No: 2016-020-GYO-001
6 FACTORS AFFECTING AND DETERMINING THE VALUE OF THE REAL ESTATE
6.1 Factors that Limit or Negatively Affect the Appraisal Process
There are no limiting or negatively affecting factors hindering the appraisal studies in question.
6.2 Swot Analysis
Strengths
The plot is closely situated to the D-100 land road and has a facade to the Içmeler
intersection, thus having a high visibility.
The fact that it is located in the vicinity of the Tuzla shipyards increases the opportunities for
the plot to be used in a functional manner.
The area where the real estate is situated is easily accessible by private vehicle or public
transportation.
The infrastructure works in the area where the real estate is situated have been completed.
Weaknesses
The land is located far from the business centers of Istanbul.
Opportunities
The region has a development potential in connection to factors such as the increase of
passenger capacity at the Sabiha Gökçen Airport.
It is estimated that the new projects that will take place in the area will animate the area
where the plot is located.
Because İçmeler constitute the only thermal springs in the city of Istanbul, it is estimated that
development in this area will help to increase the touristic potential of the region.
Threats
International chain hotels newly operating and timeshare accommodations and hotel quality
projects under construction in the vicinity of the hotel Project subject to appraisal are
creating a serious rate of bed supply and pose a threat
If the stagnation in the markets and the rapid increase in the exchange rates continue, there
could be negative effects on the tourism sector.
Page 41
34 Report No: 2016-020-GYO-001
6.3 Exemplary Share Rate in the Projects that Will Be Performed According to the Revenue
Sharing and Flat for Land Methods
Revenue Sharing and Flat for Land Methods have not been employed throughout this appraisal
study.
6.4 Methods and Eligibility Motives Employed in the Appraisal of the Real Estate
On account of the fact that the type of the real estate subject to appraisal study is an ongoing hotel
construction on the land and there is a rental agreement signed between Akfen GYO INC. and ACCOR
Group, cost and income methods have been chosen.
6.4.1 Exemplary Approach
Information with regard to lands for sale in the vicinity of the property in question has been
examined.
6.4.1.1 Definitions and Sale Value of the Similar Sales Examples that Has Been Based Upon
During the Appraisal and the Reasons Why They Have Been Employed
LAND EXAMPLES
EXAMPLE Location Characteristics Area
(m²)
Price (USD) Unit
price per m² (USD)
Source
Emsal 1
Tuzla, it is located near to property second parsel to D-100 road (1055, 1509, 1060 parcel)
TAKS: 0,40, E: 1,60 Commercial area
1.400 7.350.000 TL (2.113.040 $)
5.250 TL Hasan Deveci 0 555 892 89 79
Emsal 2
Tuzla, it is located near to property in front of railway (6770 parcel)
Emsal: 1,60, housing area
7.464 14.928.000 $ 2.000 $ Murat Emir 0 532 236 01 59
Emsal 3 In Pendik, Güzelyalı, very near to Guzelyali coast (4275 parsel)
Emsal: 1,60, Comercial + Service Area
5.991 22.750.000 TL (6.540.363 $)
3.797 TL Metar İnş. A. Ş. 0 533 472 22 01
Emsal 4 Tuzla Aydıntepe D-100’roadsided (8744 ada 4 parcel)
Emsal: 1,75, Service transformation area
1.318 3.650.000 €
(3.878.434 $)
2.769 € Remax Box 0 533 474 72 45
Emsal 5 In Tuzla İçmeler Near to E-5
TAKS: 0,30 H: 9,50, Commercial area
400 2.250.000 TL (646.849 $)
5.625 TL Yüksel Emlak 0 506 389 03 19
Emsal 6
Tuzla İçmeler E-5 Roadside next to Paşabahçe and Assan (4058 parcel)
Emsal: 1,75 Commercial area
20.500 40.000.000 $ 1.951 $ Mustafa Karaman 0 532 424 54 80
Page 42
35 Report No: 2016-020-GYO-001
- Possible bargain rates, purchase sale expenses and real estate agent commissions on the sale
prices of the properties that are for sale have been taken into consideration.
- The abandonment processes of all the lands that are provided in the table above have been
done and net surface areas have been inquired.
- According to the interviews carried out onsite with the real estate agents, the unit price per
m² of the lands that have a facade to the D-100 land road vary between 1.800 USD /m² –
2.500 USD/m².
- USD buying rate of the Central Bank of Turkey on the date of 13.12.2016: 3,4721 TL
Professional Opinion of the Appraiser:
Taking into account the factors relative to the real estate subject to the appraisal, such as its location,
the area of the plot, zoning status with Hotel and Congress area, its proximity to the Içmeler thermal
springs and the example values gathered from the vicinity, the unit price value of the land has been
provided in the table below.
A Comparable Table with regard to the land subject to the appraisal is provided below:
LAND EXAMPLE APPRAISAL TABLE
Example 1 Example 2 Example 3 Example 4 Example 5 Example 6
Area (m²) 1400 m² 7464 m² 5991 m² 1318 m² 400 m² 20500 m²
Price Asked (USD) 2.113.040 $ 14.928.000 $ 6.540.363 $ 3.878.434 $ 646.849 $ 40.000.000 $
Room for Negotiation -20% -17% -20% -20% -15% -20%
Bargain Price (TL) 1.690.432 $ 12.390.240 $ 5.232.291 $ 3.102.747 $ 549.822 $ 32.000.000 $
Unit m² Sales Value ($/m²) 1.207 $/m² 1.660 $/m² 873 $/m² 2.354 $/m² 1.375 $/m² 1.561 $/m²
Location Correction (+-%) 10% 10% 10% 0% 10% 0%
Zoning Status Correction (+-%) 8% 12% 5% 8% 12% 8%
Surface Area Correction (+-%) -5% 0% 0% -5% -10% 5%
Total Correction Factor 13% 22% 15% 3% 12% 13%
Corrected Price per Unit (USD) 1.364 $/m² 2.025 $/m² 1.004 $/m² 2.425 $/m² 1.540 $/m² 1.764 $/m²
Average 1.687 $/m²
For the plot subject to the appraisal, exemplary approach has been employed and unit price of 1.687
USD/m² (~1.587 EURO /m²) has been calculated. (It has been accepted as 1EURO=1,10626 USD; 1
USD =0,94 EURO.)
The value of the real estate, employing the exemplary approach has been estimated at 1.587
EURO/m² X 4.687,64 m² = 7.439.285- EURO =~ 7.440.000 EURO.
Page 43
36 Report No: 2016-020-GYO-001
6.4.2 Cost Approach
The building cost values in this analysis, with the cost generation approach, the technical specifications of
the buildings, the material and labor quality that has been employed during the construction of the
buildings, the construction values of the buildings that have similar characteristics in the market, the
industry experience relative to similar hotel costs and the construction costs in relation to the real estate
subject to the appraisal submitted by AKFEN Real Estate Investment Trust Inc. have been taken into
consideration.
INDOOR PLACES UNIT COSTS (EURO)(*)
İBİS OTEL TOTAL CONSTRUCTION AREA (m²) UNIT COSTS
(EURO)(*) (€) TOTAL COSTS
(**)
3rd Basement Floor 1.145,32 430 492.488 2
ND Basement Floor 1.219,25 430 524.278
1st
Basement Floor 1.120,14 430 481.660
Ground Floor 809,14 1.000 809.140
1st
Regular Floor 639,41 1.000 639.410
2nd
Regular Floor 553,65 1.000 553.650
3rd
Regular Floor 546,00 1.000 546.000
4th
Regular Floor 541,54 1.000 541.540
5th
Regular Floor 528,62 1.000 528.620 6
th Regular Floor 528,62 1.000 528.620
7th
Regular Floor 528,62 1.000 528.620
8TH
Regular Floor 528,62 1.000 528.620 9
th Regular Floor 528,62 1.000 528.620
10th
Regular Floor 528,62 1.000 528.620 11
th Regular Floor 536,40 1.000 536.400
Loft 564,84 200 112.968 Roof 117,87 100 11.787 TOTAL CONSTRUCTION COST 10.965,28 8.421.040 External Miscellaneous Works (***) (€) 100.000 TOTAL STRUCTURE VALUE (€) 8.521.040 UNIT LAND VALUE (€) 1.587 LAND AREA (m²) 4.687,94 LAND VALUE(€) 7.439.761 TOTAL VALUE(€) 15.961.000 TOTAL VALUE(TL) 58.887.000 TL
(*) The total construction cost value has been calculated by scrutinizing the verified construction cost
information taken from Akfen Real Estate Investment Trust INC. together with our industry experience in
relation to the similar hotel costs.
(**) The date of completion of the construction of the real estate subject to the appraisal is 30.06.2010. The
appraisal has been conducted by taking into consideration the age and physical status of the real estate.
(***) Costs for the wire fences over the concrete wall, parking lot area landscaping etc, have been roughly
estimated.
Page 44
37 Report No: 2016-020-GYO-001
6.4.3 Revenue Discount Approach / Development Approach
CASHFLOW CALCULATION FOR THE HOTEL PROJECT
Assumptions:
Hotel Project subject to appraisal was projected as a 3 stars city hotel with 200 rooms and the Project
assumptions were evaluated in this scope in the appraisal study.
In the appraisal study;
It is accepted that hotel construction hotel will start to operate on 1th of February, 2017.
It is assumed that the price of the rooms will be in room-breakfast system. According to the
surveys done in tourism sector and the hotels in the region, it is assumed that the price of
the room will be 40 EURO in its first year in service and this price will increase to 45 EURO in
2018, to 50 EURO in 2019, and rate of the annual increase of the room prices will be 5% until
the year of 2022 and the rate will be 2,5% in the following years.
It is assumed that occupancy rate will be average of 50% in 2017 and will reach to 62% in
2020 and will increase 2% annually in the following years.
Since the hotel will be exempt from property tax until 2022 it is assumed that property tax
would not be paid until 2022; property tax would be 18.939 EURO in 2022 and will raise
annually 3 % in the following years.
It is assumed that 3,5% of the hotel incomes would be kept as the renewal reserve of the
furniture and fixtures.
In the appraisal study long-term Euro bond is taken as 7,21% - “risk free return rate”.
Discount rate is foreseen as 11,54%.
It is assumed that the whole payments would be in cash.
VAT and taxes have not been included in the studies.
Building insurance is accepted as 9.011 EURO according to the information taken from AKFEN
INC. For the year of 2017. It is assumed that the insurance value would be fixed in terms of
the years.
A more realistic net present value has been provided through taking the mid-year factor (0,5)
into account in net present value calculations.
Discount cashflow table prepared according to the above mentioned assumptions is shown below.
Page 45
38 Report No: 2016-020-GYO-001
Year 0 1 2 3 4 5 6 7 8 9 10
Date 31.12.2016 31.12.2017 31.12.2018 31.12.2019 31.12.2020 31.12.2021 31.12.2022 31.12.2023 31.12.2024 31.12.2025 31.12.2026
INCOMES
ROOM INCOMES
Annual Occupancy Rate, % 50% 55% 58% 62% 63% 65% 66% 67% 68% 70%
Avarage Room Price, EUR 40 45 50 53 55 58 59 61 62 64
Total Room Incomes 1.338.333 1.806.750 2.117.000 2.376.150 2.544.857 2.725.541 2.849.554 2.979.208 3.114.762 3.256.484
DEPARTMANT INCOMES
Total Department Incomes 283.889 357.022 388.325 419.321 416.702 427.847 444.728 464.963 486.119 508.237
TOTAL INCOMES 1.622.222 2.163.772 2.505.325 2.795.471 2.961.558 3.153.388 3.294.282 3.444.171 3.600.881 3.764.721
EXPENSES
DEPARTMANT EXPENSES
Total Department Expenses 750.683 943.838 997.621 1.037.469 976.645 1.035.706 1.081.595 1.130.808 1.182.259 1.236.052
Net Departmant Incomes 871.539 1.219.935 1.507.705 1.758.002 1.984.914 2.117.682 2.212.687 2.313.364 2.418.622 2.528.669
OPERATING EXPENSES
General Management Expenses 146.000 194.740 212.953 223.638 222.117 236.504 230.600 241.092 252.062 263.530
Marketing 24.333 32.457 37.580 41.932 44.423 47.301 49.414 51.663 54.013 56.471
Energy 137.889 183.921 200.426 209.660 207.309 220.737 197.657 206.650 216.053 225.883
Total Operating Expenses 308.222 411.117 450.959 475.230 473.849 504.542 477.671 499.405 522.128 545.885
GROSS BUSINESS PROFIT 563.317 808.818 1.056.746 1.282.772 1.511.064 1.613.140 1.735.016 1.813.959 1.896.494 1.982.785
FIXED COSTS
Propert Tax 0 18.939 19.508 20.093 20.696
Insurance 9.011 11.545 11.545 11.545 11.545 11.545 11.545 11.545 11.545 11.545
Renewal Fund 56.778 75.732 87.686 97.841 103.655 110.369 115.300 120.546 126.031 131.765
Total Fixed Costs 65.789 87.277 99.231 109.386 115.200 121.914 145.784 151.599 157.669 164.006
TOTAL EXPENSES 1.124.694 1.442.231 1.547.811 1.622.085 1.565.693 1.662.161 1.705.050 1.781.811 1.862.056 1.945.943
NET BUSINESS INCOME 497.528 721.541 957.515 1.173.385 1.395.865 1.491.227 1.589.232 1.662.360 1.738.825 1.818.779
End of the Period Value 20.713.869
NET CASHFLOW 497.528 721.541 957.515 1.173.385 1.395.865 1.491.227 1.589.232 1.662.360 1.738.825 22.532.648
CUMULATIVE CASHFLOW 497.528 1.219.069 2.176.584 3.349.969 4.745.834 6.237.061 7.826.292 9.488.652 11.227.478 33.760.126
AKFEN RENT OBTAINED
RENT OVER IBISOTEL INCOME 243.333 389.479 501.065 698.868 740.390 788.347 823.570 861.043 900.220 941.180
Share of the Operator 64.889 86.551 100.213 111.819 118.462 126.136 131.771 137.767 144.035 150.589
Reserve of the Furniture Fixures Renewal 16.222 43.275 75.160 111.819 118.462 126.136 131.771 137.767 144.035 150.589
NOVOTEL OTEL AGOP 409.875 577.143 749.167 900.264 1.083.019 1.156.739 1.250.752 1.307.661 1.367.160 1.429.366
USED RENTAL INCOME OF IBIS HOTEL 409.875 577.143 749.167 900.264 1.083.019 1.156.739 1.250.752 1.307.661 1.367.160 1.429.366
Property Tax 0 0 0 0 0 0 18.939 19.508 20.093 20.696
Insurance 9.011 11.545 11.545 11.545 11.545 11.545 11.545 11.545 11.545 11.545
Reserve of Furniture Fixture Renewal 5% 811 2.164 3.758 5.591 5.923 6.307 6.589 6.888 7.202 7.529
RENTAL CASHFLOW 400.053 563.434 733.864 883.128 1.065.551 1.138.887 1.213.679 1.269.721 1.328.321 1.389.596
INVESTMENT COST 0
Value of the end of the period 17.369.948
NET CASHFLOW 400.053 563.434 733.864 883.128 1.065.551 1.138.887 1.213.679 1.269.721 1.328.321 18.759.544
Page 46
39 Report No: 2016-020-GYO-001
Risk Free Revenue Rate 7,21% 7,21% 7,21%
Risk Premium 3,97% 4,33% 4,69%
Discount Rate 11,18% 11,54% 11,90%
NET CURRENT VALUE (Euro) 14.823.293 14.474.007 14.135.264
NET APPROXIMATE CURRENT VALUE (Euro) 14.820.000 14.470.000 14.140.000
NET APPROXIMATE CURRENT VALUE (TL) 54.677.000 53.386.000 52.168.000
According to those assumptions and operating model and with operating projection; project value
has been calculated as 14.470.000 EURO (53.386.000 TL)
6.4.4 Value of the Real Estate According to the Rent Income
On the land owned by Akfen INC. Ibis Hotel project had been developed with a capacity of 200 rooms
and rented by Accor Group after signing the rent agreement on 1th of May, 2014 and the duration of
the agreement is 25+/ -10 years. Cost of the rent according to the agreement is as follows:
In the opening year: It is that of the bigger one of the followings: 85% of the adjusted gross
business profit or 15% of the total net revenue (guaranteed minimum rent cost)
In the fiscal year following the opening year the annual rent will be the bigger one of the
followings: 18% of the of the total net revenue (guaranteed minimum rent cost), 85% of the
AGOP.
In the second fiscal year the annual rent will be the bigger one of the followings: 20% of the
of the total net revenue (guaranteed minimum rent cost), 85% of the AGOP.
Starting with the beginning of the third fiscal year the annual rent would be either 85% of the
adjusted gross business profit (AGOP) or 25% of the total net revenue (guaranteed minimum
rent cost).
Tenant will create a reserve fund towards the renovation of beginning FF&E items. Reserve in
question will correspond to below stated costs.
First fiscal year; 1% of the total net revenue;
Second fiscal year; 2% of the total net revenue;
Third fiscal year; 3% of the total net revenue;
From fourth fiscal year to 15th fiscal year: 4% of the total net revenue.
Starting with 16th fiscal year: 5% of the total net revenue
Page 47
40 Report No: 2016-020-GYO-001
AKFEN RENT OBTAINED
RENT OVER IBISOTEL INCOME 243.333 389.479 501.065 698.868 740.390 788.347 823.570 861.043 900.220 941.180
Share of the Operator 64.889 86.551 100.213 111.819 118.462 126.136 131.771 137.767 144.035 150.589
Reserve of the Furniture Fixures Renewal 16.222 43.275 75.160 111.819 118.462 126.136 131.771 137.767 144.035 150.589
NOVOTEL OTEL AGOP 409.875 577.143 749.167 900.264 1.083.019 1.156.739 1.250.752 1.307.661 1.367.160 1.429.366
USED RENTAL INCOME OF IBIS HOTEL 409.875 577.143 749.167 900.264 1.083.019 1.156.739 1.250.752 1.307.661 1.367.160 1.429.366
Property Tax 0 0 0 0 0 0 18.939 19.508 20.093 20.696
Insurance 9.011 11.545 11.545 11.545 11.545 11.545 11.545 11.545 11.545 11.545
Reserve of Furniture Fixture Renewal 5% 811 2.164 3.758 5.591 5.923 6.307 6.589 6.888 7.202 7.529
RENTAL CASHFLOW 400.053 563.434 733.864 883.128 1.065.551 1.138.887 1.213.679 1.269.721 1.328.321 1.389.596
INVESTMENT COST 0
Value of the end of the period 17.369.948
NET CASHFLOW 400.053 563.434 733.864 883.128 1.065.551 1.138.887 1.213.679 1.269.721 1.328.321 18.759.544
CUMULATIVE CASHFLOW 400.053 963.487 1.697.351 2.580.479 3.646.030 4.784.917 5.998.596 7.268.317 8.596.637 9.986.233
Risk Free Revenue Rate 7,21% 7,21% 7,21%
Risk Premium 2,88% 3,24% 3,61%
Discount Rate 10,09% 10,45% 10,82%
NET CURRENT VALUE (Euro) 12.816.903 12.505.196 12.203.082
NET APPROXIMATE CURRENT VALUE (Euro) 12.820.000 12.510.000 12.200.000
NET APPROXIMATE CURRENT VALUE (TL) 47.298.000 46.154.000 45.011.000
Page 48
41 Report No: 2016-020-GYO-001
6.4.5 Lease Value Analysis and the Data Employed
Considering that there are no structures on the land, no lease value analysis has been conducted.
6.4.6 Empty Land and Project Values of the Terrain Where the Project is Being Developed
Rental value of the real estate subject to appraisal has been calculated taking the average of net cash
flow values in its first year into consideration and according to revenue discount approach and rental
income. Through reducing the average value of annual cash flow of the year 2017 into the day of
appraisal; annual rental value of real estate has been found. According to this calculation annual
rental value of the hotel has been estimated as 381.000.- EURO (1.406.000 - TL).
31.12.2016 31.12.2017
Annual Rental Value 0 400.053
Net Present Value of Annual Rent (EURO) 381.000
Net Present Value of Annual Rent (TL) 1.406.000
6.4.7 Most Effective and Most Productive Use Analysis
When factors such as location, formation and conditions of its surroundings, along with the zoning
status, are taken into consideration, it is thought that the hotel Project being constructed on the plot
will provide the most effective and productive use.
6.4.8 Appraisal Analysis of Common or Divided Parts
There are no common or divided parts of the real estate subject to appraisal.
Page 49
42 Report No: 2016-020-GYO-001
7 EVALUATION OF ANALYSIS RESULTS
7.1.1 Alignment of Different Appraisal Methods and Analysis Results, together with the
Explanation of the Method and the Reasons Used for this Purpose
On the grounds that the real estate subject to this appraisal study consists of a property operating as
a revenue bringing hotel, the Revenue Approach and Cost Approach Methods have been employed.
The total value in the cost method, including the land, has been calculated as 15.961.000 EURO
(58.887.000 TL).
As a result of the discount of the potential revenue to be generated by the structure on the plot, in
accordance with the revenue discount approach, the net current value of the HOTEL has been
calculated as 14.470.000 EURO (53.386.000 TL).
The amount determined to be paid to the Akfen Real Estate Investment Trust Inc. by the Accor
Group, with the use of lease revenue discount method, is 12.510.000 EURO (46.154.000 TL).
The values obtained by use of the revenue discount approach and lease revenue discount method
comply with each other. There is nearly 15% difference between the values obtained by use Cost
analysis method and the other two methods. And, this is a tolerable difference. Values obtained by
use of 3 methods support each other. The real estate subject to the appraisal constitutes a revenue
generating property and, therefore, the values are calculated with the use of the revenue discount
approach and lease revenue discount method. The final value of the hotel is found as 13.490.000
EURO (49.770.000.-TL) which is the arithmetic mean of the values calculated by use of these two
methods.
The lease value of the real estate, since the date of 31.12.2015, has been calculated by taking into
consideration the average cash flow of the first year, in accordance with the revenue discount
approach and the lease revenue. The annual lease value of the real estate has been calculated by
reducing the annual average net cash flow to the day when the appraisal study is performed.
Pursuant to this calculation, the annual lease value has been determined to be 381.000.- EURO
(1.406.000-TL).
During the course of the appraisal study, the revenue discount approach and cost approach have
both been applied, in terms of revenue capitalization and lease revenues.
In the cost discount method, from the total revenue that the real estate will generate, the gross
operating revenue and net operating revenues have been calculated, respectively.
In the discount model pursuant to the lease revenue, the lease revenues have been evaluated and
the calculations have been made in accordance with the value obtained. Different discount rates
have been employed in both models. Since there is a guaranteed lease revenue in the lease revenue
analysis, the risk premium is lower.
Page 50
43 Report No: 2016-020-GYO-001
While the value of the real estate according to the revenue discount approach was being
determined, in the 1st model the revenue obtained by operating the real estate without a brand
name has been calculated and in the 2nd model the revenue obtained by operating by leasing it out
to a brand (Accor) has been calculated. Both models are methods that are exercised in the market
and, thusly, the final appraisal has been determined by calculating the average of their outcome.
7.2 Explanation of the Motives Pursuant to the Minimum Information for Not Including Certain
Aspects in the Report
There is no information that has not been included in the minimum information.
7.3 Information Concerning the Last Three Appraisal of the Real Estate Carried Out by the
Company
For the real estate subject to appraisal there is an appraisal studies numbered 2014-020-GYO-001 ;
and 2015-020-001.
7.4 Opinion Whether There is Any Obstacle in Including the Real Estate, the Real Estate Project
and the Rights and Benefits With Regard to the Real Estate in the Real Estate Investment
Trusts Portfolio within the Scope of the Capital Market Legislation
Within the capital market regulations, there are no obstacles preventing the inclusion of the real
estate subject to the appraisal in the portfolio as a building
Page 51
44 Report No: 2016-020-GYO-001
8 OUTCOME
8.1 The Concluding Sentence of the Appraiser
I hereby agree with the effective and productive use analysis of the appraiser, together with all of the
aspects mentioned in the report.
8.2 Final Appraisal
The totality of the characteristics that can affect the value of the real estate, such as the location, the
style of formation of its surroundings, the infrastructure and means of transportation, façades
looking over to the avenue and street, as well as the area and its position, have all been carefully
taken into account and a detailed market research has been conducted in the area. Correspondingly,
the value of the real estate subject to this appraisal report has been presented in the following chart.
As of 30.12.2016
Market Value of the Real Estate (EURO) Market Value of the Real Estate (TL)
VAT Excluded 13.490.000 49.770.000
VAT Included 15.918.000 58.729.000
Annual Rental Value of the Real Estate
(TL) Annual Rental Value of the Real Estate
(EURO)
VAT Excluded 1.406.000 381.000
VAT Included 1.659.000 450.000
1- ) The appraised value is the current value regarding the cash sale price.
2- ) The VAT ratio has been established at 18%.
3- ) The currency rates have been established at 1,-Euro = 3,6894 TL on 13.12.2016.
4- ) This report has been prepared within the scope of the related Capital Market Legislation. We respectfully submit our expert report representing the situation and our appraisal.
Özgür ÇAKICI Önder ÖZCAN Neşecan ÇEKİCİ
Certified Appraiser CML Certificate No:400335
Certified Appraiser CML Certificate No:402145
Responsible Appraiser CML Certificate No:400177
Page 52
45 Report No: 2016-020-GYO-001
9 APPENDIX
1. Title Deed Photocopies
2. Title Deed Registry Sample
3. Approved Zoning Status
4. Project Cover Page
5. Layout Plan Sample
6. Construction Permit Document
7. Written Document Given By Bank
8. Contract of Lease
9. Photographs
10. Curriculum Vitaes
11. SPK License Samples