CHAIRMAN’S REVIEW 2007 was yet another monumental year for the company in spite of turbulent political events in December 2007. The performance during the year exceeded all expectations and set new records in production, sales and profits. REVIEW OF OPERATIONS, FINANCIAL RESULTS During 2007 the company produced record 26,380 tractors compared with 26,076 produced in 2006. This was in spite of a total loss of production in the last week of December in the aftermath of the assassination of Mohtarma Benazir Bhutto. During the year 26,364 tractors were delivered compared with 26,250 in 2006. On sales revenue of Rs 9.08 billion, the company earned a pre-tax profit of Rs 1.914 billion compared with Rs 1.910 billion in 2006. The post-tax profit for the year 2007 recorded an increase of 3.1 % - up from Rs 1.229 billion in 2006 to Rs 1.267 billion in 2007, with Rs 647 million going to the tax authorities as income tax. Company’s reserves recorded an increase of 8.6 % - up from Rs 3.55 billion in 2006 to Rs 3.85 billion in 2007. With cash reserves of Rs 5.40 billion, the company’s balance sheet reflects very strong financial health. The Company continued to maintain lead over other automobile sector companies in Pakistan and its shares fetched the highest value of all listed stocks. The share value reached an all time high and recorded a peak of Rs 298 for its five rupee share, thus giving a market cap of Rs 12.795 billion to the company. Net Asset Value per share went up from Rs 82.68 to 89.70 – an increase of 8.5 % and earning per share was up from Rs 28.63 to Rs 29.52. During the year the company also succeeded in sourcing 92% of the purchases locally which was possible due to the efforts and co-operation of the vendor associates. This helped achieve foreign exchange savings of Rs 5.0 billion. Most importantly the company continued to contribute to the national economy by selling tractors at prices fixed in 1998 and did not raise them in spite of Government lifting embargo on frozen prices. DIVIDEND PAYOUT An interim cash dividend of 100% was paid by the company with the financial results of the half year ended June 30, 2007 followed by payment of another interim cash dividend of 100% in November 2007.
Transcript
CHAIRMAN’S REVIEW
2007 was yet another monumental year for the company in spite of turbulent political events in December 2007. The performance during the year exceeded all expectations and set new records in production, sales and profits. REVIEW OF OPERATIONS, FINANCIAL RESULTS During 2007 the company produced record 26,380 tractors compared with 26,076 produced in 2006. This was in spite of a total loss of production in the last week of December in the aftermath of the assassination of Mohtarma Benazir Bhutto. During the year 26,364 tractors were delivered compared with 26,250 in 2006. On sales revenue of Rs 9.08 billion, the company earned a pre-tax profit of Rs 1.914 billion compared with Rs 1.910 billion in 2006. The post-tax profit for the year 2007 recorded an increase of 3.1 % - up from Rs 1.229 billion in 2006 to Rs 1.267 billion in 2007, with Rs 647 million going to the tax authorities as income tax. Company’s reserves recorded an increase of 8.6 % - up from Rs 3.55 billion in 2006 to Rs 3.85 billion in 2007. With cash reserves of Rs 5.40 billion, the company’s balance sheet reflects very strong financial health. The Company continued to maintain lead over other automobile sector companies in Pakistan and its shares fetched the highest value of all listed stocks. The share value reached an all time high and recorded a peak of Rs 298 for its five rupee share, thus giving a market cap of Rs 12.795 billion to the company. Net Asset Value per share went up from Rs 82.68 to 89.70 – an increase of 8.5 % and earning per share was up from Rs 28.63 to Rs 29.52. During the year the company also succeeded in sourcing 92% of the purchases locally which was possible due to the efforts and co-operation of the vendor associates. This helped achieve foreign exchange savings of Rs 5.0 billion. Most importantly the company continued to contribute to the national economy by selling tractors at prices fixed in 1998 and did not raise them in spite of Government lifting embargo on frozen prices. DIVIDEND PAYOUT An interim cash dividend of 100% was paid by the company with the financial results of the half year ended June 30, 2007 followed by payment of another interim cash dividend of 100% in November 2007.
The Board of Directors is now pleased to recommend payment of another cash dividend of 150 %. The cash dividend for the year 2007 will thus total 350 % that is a payment of Rs 751.387 million. Company’s outstanding performance was recognized with the company once again winning the Top Company Award from the Karachi Stock Exchange. The company’s 2007 calendar won the Best Calendar of the year Award from the National Council of Culture and Arts. And the Management Association of Pakistan once again conferred the Award of the Best Corporate Performance – a tribute to corporate excellence, good corporate governance and superior capabilities in managing finance and marketing. CORPORATE GOVERNANCE It has always been the endeavor of the company to strive for good corporate governance practices and to bring them in line with international norms. We are glad to say that Company’s auditors have assessed these practices and have expressed their complete satisfaction. The leadership for good corporate governance at AGTL flows from the Board of Directors. Their commitment and foresight has shaped the overall corporate culture and that has percolated down to all levels throughout the company. This has helped to maintained excellent rapport and relations with investors, vendor associates, dealers, customers, employees and all other stake holders. Through various Board and Management committees the directors monitor management performance and compliance with statutory requirements. The Audit Committee in particular reviews internal controls and risk management systems. The charter of the Audit Committee is to oversee integrity of company’s financial statements, monitor corporate policies, taxation matters, legal cases / litigations and related party transactions. AGTL is the first company in the automobile sector in Pakistan to achieve ISO certification. The company has put in place a system of sound quality controls to meet ISO standards and CNH standard benchmarks. The ISO registration has been revalidated up to February 2010. The company acquired BaaN in 2002 to implement ERP to execute entire business cycle of the company as enterprise-wide integrated system. The MIS department keeps itself abreast of the new technological developments. The company has recently installed IBM X series servers for e-mail, proxy and domain controller and will switch to IBM RICS 6000 P series for its ERP. Other than the plant at D.G. Khan, the company’s marketing offices are being connected through WAN to the company’s data network thus enabling these locations to use ERP. NEED FOR STIMULUS PACKAGES FOR TRACTOR INDUSTRY Banks have grown disbursement of credit to the agricultural sector by 26% during the first half of the current fiscal; however the share of tractor financing has continued to
witness sharp decline. From an all time high of 77,261 units booked in the fiscal year 2005-2006, bookings fell to mere 39,386 units in the fiscal year 2006-2007 – a drop of 49%. Loaning from the agricultural development bank ZTBL in particular continues to fall. 9,871 tractors were booked through ZTBL in the fiscal 2005-06, which dropped to 6,650 tractors in 2006-07. According to reports, the State Bank of Pakistan has planned a strategy that aims to increase agriculture credit outreach level from 1.6 million to 3.3 million farmers in the next 3-4 years. However the State Bank report also states that a number of small farmers are unable to avail the facility mainly due to inappropriate documentation such as non-availability of pass books resulting in hindrance to these farmers. There is need to enact stimulus packages for increasing sale of tractors through the banks, to reduce mark-up (to around 7%) and to create special agricultural development fund for purchase of tractors. This would help to increase mechanization of farming activities in Pakistan, increase tractor manufacturing activities and in the event of fall in bookings it would help protect interest of our vendor associates who supply 92% local content to the company. It should be noted that the tractor manufacturers had responded positively to the spurt in 2005-06 and increased manufacturing capacity, therefore it is necessary to safeguard their interest. DISCRIMINATORY POLICIES – CONCERNS Although tractor manufacturers had put in exemplary efforts for over a decade to achieve 92% local content, the government allowed import of CBU tractors at zero tariffs to four select companies in 2005-06. In 2006-07 it went a step further to open wholesale imports at zero tariffs. The fly-by-night operators are now exploiting this benefit and trying to pirate components that have been painfully developed indigenously. The company is agitating the issue with Engineering Development Board, the apex body in this respect and trying to thwart the efforts of such rivals. It is for the Engineering Development Board to protect the bona fide manufacturers and to prevent misrepresentations to protect legitimate and world renowned products such as Fiat. They should verify the authenticity of the product which should be free of piracy. FUTURE OUTLOOK The company is very optimistic about the future outlook, however has also taken note of political crisis that has emerged towards end 2007. The latest State Bank Report too warns of an anticipated downturn. There have been conflicting signals about the health of economy from major indicators such as foreign exchange reserves, trade deficit, balance of payment, portfolio investment, violation of inflation benchmark to name a few. Though the dollar is languishing at a record low elsewhere, the rupee continues to
fall viz-a-viz the dollar. It has already depreciated from around Rs 60 to about Rs 63 in recent days. The country is in the grips of a vicious price spiral which is likely to worsen and will cause the economy to suffer. Acute energy crisis, power cuts and stoppage of gas supplies are further compounding the economic troubles and disrupting production. We hope the economic managers will take necessary steps to set this process in right direction and evolve a strategy to stimulate growth. We hope the banks will disburse huge funds that have been allocated for the agricultural sector to support purchase of tractors. The company is entering the silver jubilee year of its formation. It has a lot to be proud of and a lot to celebrate of its glorious achievements over the years. We would endeavor to maintain that same spirit and leap into the future. With a healthy order bank the year 2008 looks promising and we hope that there are no unforeseen disturbances of any nature that are beyond our control. ACKNOWLEDGEMENT During the year 2007, CNH directors Mr. Michael Stuart Edmondson and Mr. Alain Gold left the board of directors and were replaced by Mr. Franco Fusignani and Mr. Hadjas Youssef. The company acknowledges the invaluable services of Mr. Michael Stuart Edmondson and Mr. Alain Gold to the company and welcomes Mr. Franco Fusignani and Mr. Hadjas Youssef and looks forward to their support. The company also acknowledges the support of all its stake holders - the Government, the Banks, Supply Chain Associates, our principals CNH, the Dealers and the Customers. The company acknowledges with thanks the recognition conferred on the company with awards from KSE, MAP and NCCA. AGTL’s most valuable wealth is its team of employees. It is a team of many talents and they have been contributing to AGTL’s monumental success. They work with a mission to achieve the vision and the goals of the company. They are committed to making the silver jubilee year, a year of yet another leap forward to success.
Colin D.W. Leitch Chairman
Karachi February 13, 2008
AL-GHAZI TRACTORS LIMITED
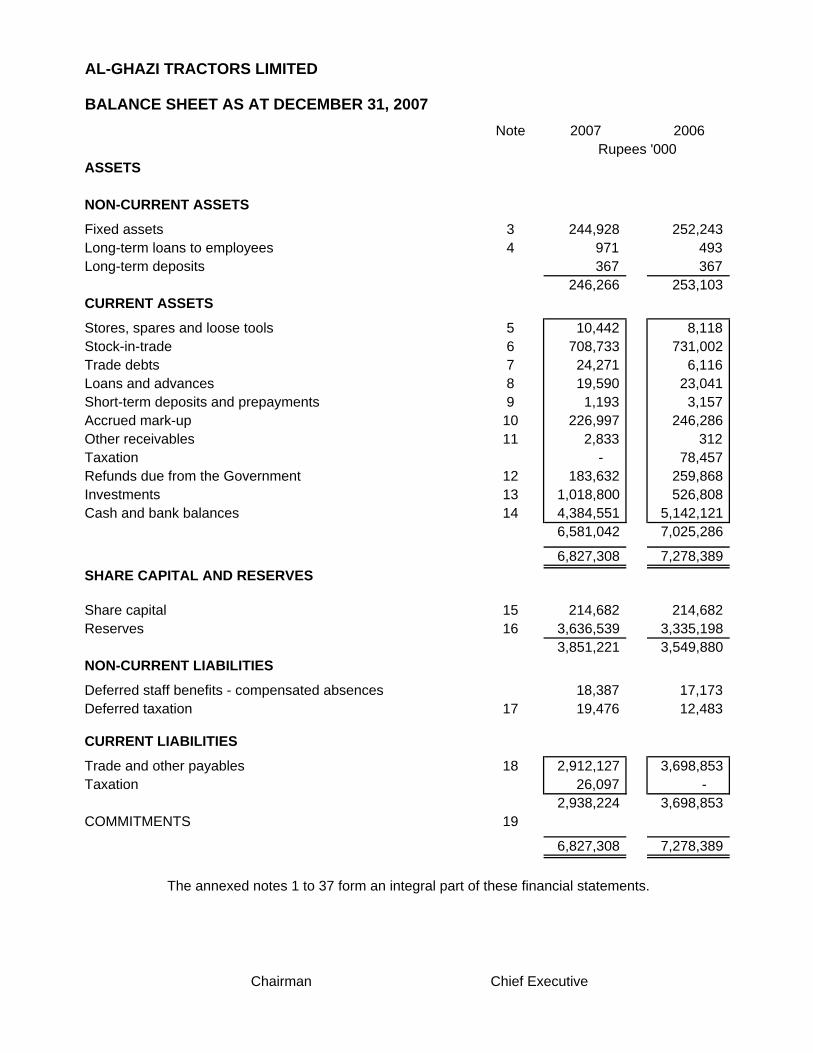
BALANCE SHEET AS AT DECEMBER 31, 2007Note 2007 2006
Trade and other payables 18 2,912,127 3,698,853 Taxation 26,097 -
2,938,224 3,698,853 COMMITMENTS 19
6,827,308 7,278,389
Chairman Chief Executive
The annexed notes 1 to 37 form an integral part of these financial statements.
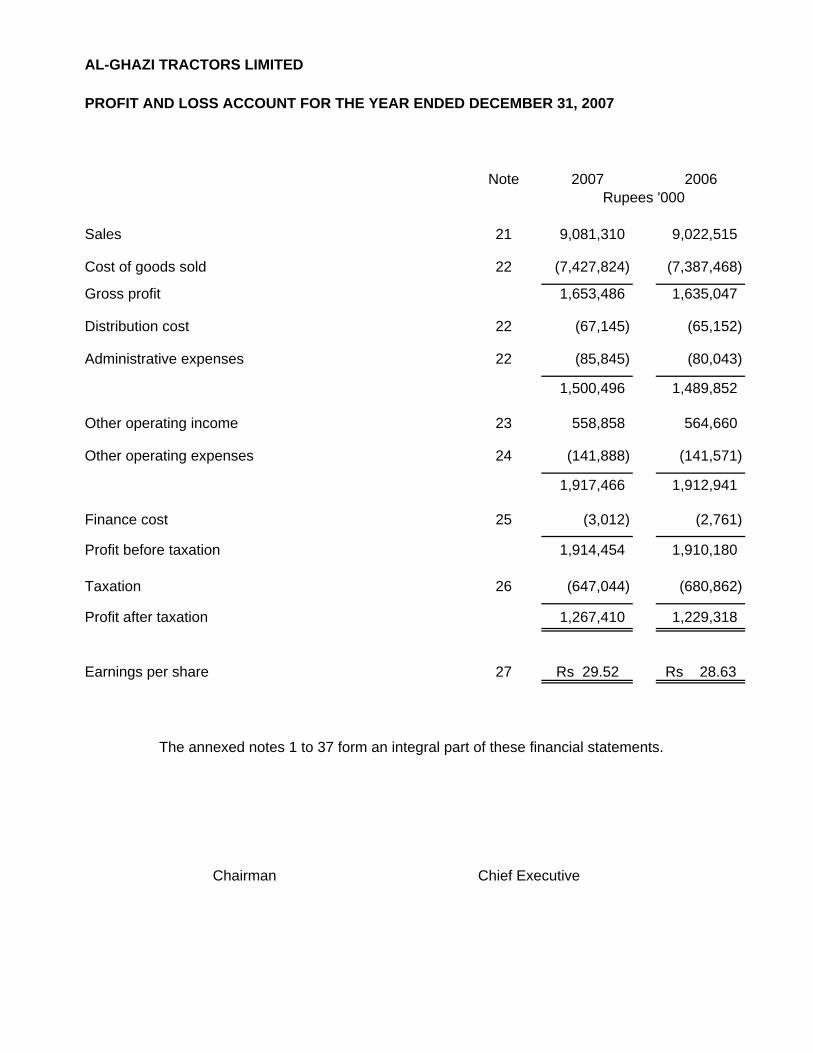
AL-GHAZI TRACTORS LIMITED
PROFIT AND LOSS ACCOUNT FOR THE YEAR ENDED DECEMBER 31, 2007
Note 2007 2006
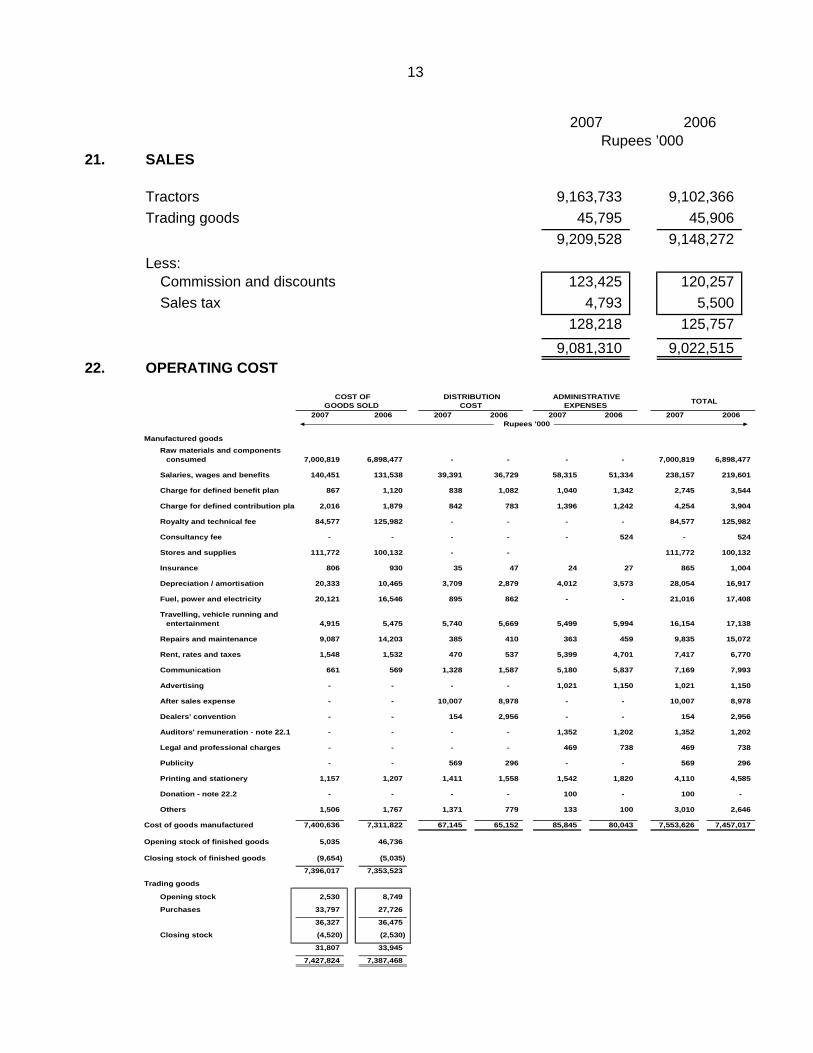
Sales 21 9,081,310 9,022,515
Cost of goods sold 22 (7,427,824) (7,387,468)
Gross profit 1,653,486 1,635,047
Distribution cost 22 (67,145) (65,152)
Administrative expenses 22 (85,845) (80,043)
1,500,496 1,489,852
Other operating income 23 558,858 564,660
Other operating expenses 24 (141,888) (141,571)
1,917,466 1,912,941
Finance cost 25 (3,012) (2,761)
Profit before taxation 1,914,454 1,910,180
Taxation 26 (647,044) (680,862)
Profit after taxation 1,267,410 1,229,318
Earnings per share 27 Rs 29.52 Rs 28.63
Chairman Chief Executive
Rupees '000
The annexed notes 1 to 37 form an integral part of these financial statements.
AL-GHAZI TRACTORS LIMITED
CASH FLOW STATEMENT FOR THE YEAR ENDED DECEMBER 31, 2007
Note 2007 2006
CASH FLOW FROM OPERATING ACTIVITIES
Cash generated from operations 28 475,567 1,192,395 Income taxes paid (535,497) (828,337) Increase in long-term deposits - (13) Decrease / (increase) in deferred staff
benefits - compensated absences 1,214 (1,065) Net cash from operating activities (58,716) 362,980
CASH FLOW FROM INVESTING ACTIVITIES
Fixed capital expenditure (20,988) (110,981) Proceeds from disposal of fixed assets 1,692 3,084 (Increase) / decrease in investments (475,000) 225,000 Return on bank deposits 482,883 345,032 Return on certificates of investments (COIs) 62,193 43,895 Increase in long-term loans (478) 6,570 Net cash from investing activities 50,302 512,600
CASH FLOW FROM FINANCING ACTIVITIES
Dividends paid (749,156) (750,766)
Net increase in cash and cash equivalents (757,570) 124,814
Cash and cash equivalents at the beginning of the year 5,142,121 5,017,307
Cash and cash equivalents at the end of the year 14 4,384,551 5,142,121
Chairman Chief Executive
Rupees '000
The annexed notes 1 to 37 form an integral part of these financial statements.
AL-GHAZI TRACTORS LIMITED
STATEMENT OF CHANGES IN EQUITY FOR THE YEAR ENDED DECEMBER 31, 2007
Share General Unappropriatedcapital reserve profit
Balance at January 1, 2006 214,682 1,000,000 1,857,267 3,071,949
Final dividend @ Rs. 12.5 per sharefor the year ended December 31, 2005 - - (536,705) (536,705)
Interim dividend @ Rs. 5 per share for the
year ended December 31, 2006 - - (214,682) (214,682)
Net profit after taxation for the year ended December 31, 2006 - - 1,229,318 1,229,318
Balance at December 31, 2006 214,682 1,000,000 2,335,198 3,549,880
Final dividend @ Rs. 12.5 per sharefor the year ended December 31, 2006 - - (536,705) (536,705)
First interim dividend @ Rs. 5 per share for the year ended December 31, 2007 - - (214,682) (214,682)
Second interim dividend @ Rs. 5 per sharefor the year ended December 31, 2007 - - (214,682) (214,682)
Net profit after taxation for the year ended December 31, 2007 - - 1,267,410 1,267,410
Balance at December 31, 2007 214,682 1,000,000 2,636,539 3,851,221
Chairman Chief Executive
The annexed notes 1 to 37 form an integral part of these financial statements.
Rupees '000 Total
AL-GHAZI TRACTORS LIMITED
1. THE COMPANY AND ITS OPERATIONS
2. SUMMARY OF SIGNIFICANT ACCOUNTING POLICIES
2.1 Basis of preparation
NOTES TO AND FORMING PART OF THE FINANCIAL STATEMENTS FOR THE YEAR ENDED DECEMBER 31, 2007
Estimates and judgments are continually evaluated and are based on historical experienceand other factors, including expectations of future events that are believed to bereasonable under the circumstances.
There have been no critical judgments made by the company's management in applyingthe accounting policies that would have significant effect on the amounts recognised in thefinancial statements.
The principal accounting policies applied in the preparation of these financial statementsare set out below.
The preparation of financial statements in conformity with approved accounting standardsrequires the use of certain critical accounting estimates. It also requires management toexercise its judgment in the process of applying the company's accounting policies. Thematter involving a higher degree of judgement or complexity, or area where assumptionsand estimates are significant to the financial statements is provision for staff retirementbenefits. Significant estimates relating to staff retirement benefits are disclosed innote 29.
The financial statements are presented in Pak Rupees, which is the company's functionaland presentation currency.
The company was incorporated in Pakistan under the Companies Act, 1913 (nowCompanies Ordinance, 1984) as a public limited company in June, 1983 and is quoted onKarachi and Lahore Stock Exchanges. The address of registered office of the company is'11th Floor, NIC Building, Abbasi Shaheed Road, Karachi'. The company is principallyengaged in the manufacture and sale of agricultural tractors, implements and spare parts.
These financial statements have been prepared in accordance with approved accountingstandards as applicable in Pakistan. Approved accounting standards comprise of suchInternational Financial Reporting Standards (IFRS) issued by the International AccountingStandards Board as are notified under the Companies Ordinance, 1984, provisions of anddirectives issued under the Companies Ordinance, 1984. In case requirements differ, theprovisions or directives of the Companies Ordinance, 1984 shall prevail.
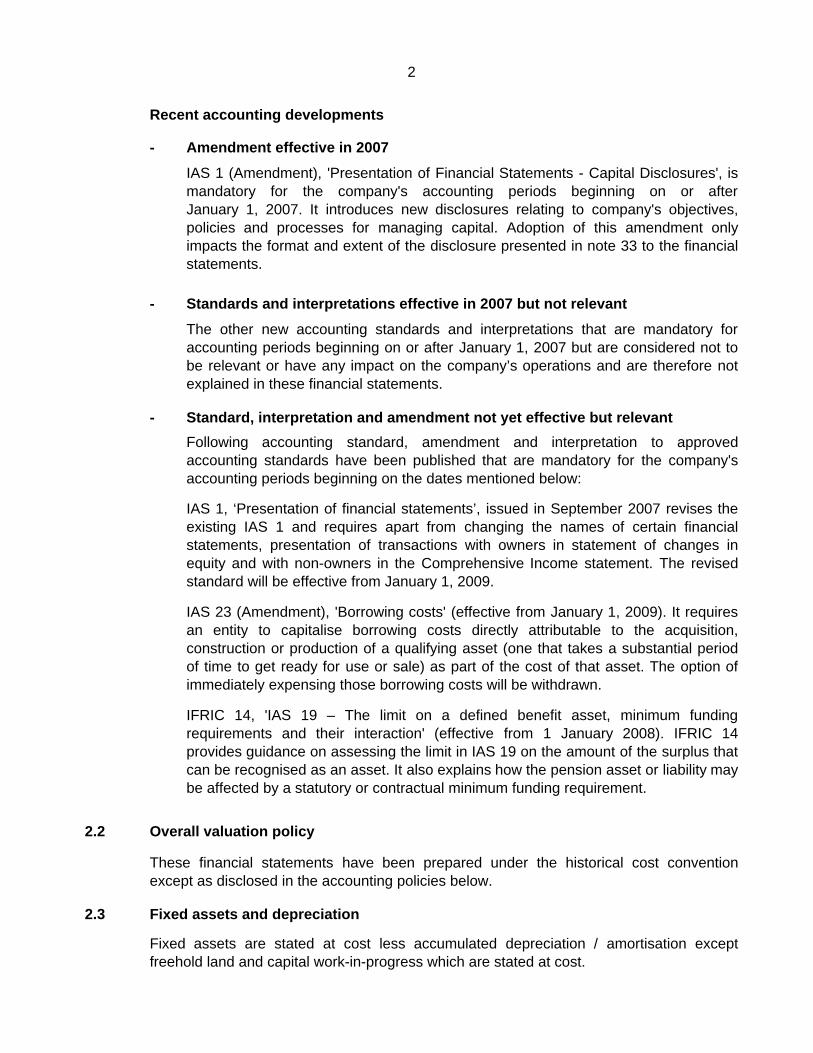
Recent accounting developments
-
- Standards and interpretations effective in 2007 but not relevant
-
2.2 Overall valuation policy
2.3 Fixed assets and depreciation
IFRIC 14, 'IAS 19 – The limit on a defined benefit asset, minimum fundingrequirements and their interaction' (effective from 1 January 2008). IFRIC 14provides guidance on assessing the limit in IAS 19 on the amount of the surplus thatcan be recognised as an asset. It also explains how the pension asset or liability maybe affected by a statutory or contractual minimum funding requirement.
Standard, interpretation and amendment not yet effective but relevantFollowing accounting standard, amendment and interpretation to approvedaccounting standards have been published that are mandatory for the company'saccounting periods beginning on the dates mentioned below:
2
Amendment effective in 2007
IAS 1 (Amendment), 'Presentation of Financial Statements - Capital Disclosures', ismandatory for the company's accounting periods beginning on or afterJanuary 1, 2007. It introduces new disclosures relating to company's objectives,policies and processes for managing capital. Adoption of this amendment onlyimpacts the format and extent of the disclosure presented in note 33 to the financialstatements.
The other new accounting standards and interpretations that are mandatory foraccounting periods beginning on or after January 1, 2007 but are considered not tobe relevant or have any impact on the company’s operations and are therefore notexplained in these financial statements.
IAS 1, ‘Presentation of financial statements’, issued in September 2007 revises theexisting IAS 1 and requires apart from changing the names of certain financialstatements, presentation of transactions with owners in statement of changes inequity and with non-owners in the Comprehensive Income statement. The revisedstandard will be effective from January 1, 2009.
IAS 23 (Amendment), 'Borrowing costs' (effective from January 1, 2009). It requiresan entity to capitalise borrowing costs directly attributable to the acquisition,construction or production of a qualifying asset (one that takes a substantial periodof time to get ready for use or sale) as part of the cost of that asset. The option ofimmediately expensing those borrowing costs will be withdrawn.
Fixed assets are stated at cost less accumulated depreciation / amortisation exceptfreehold land and capital work-in-progress which are stated at cost.
These financial statements have been prepared under the historical cost conventionexcept as disclosed in the accounting policies below.
--------
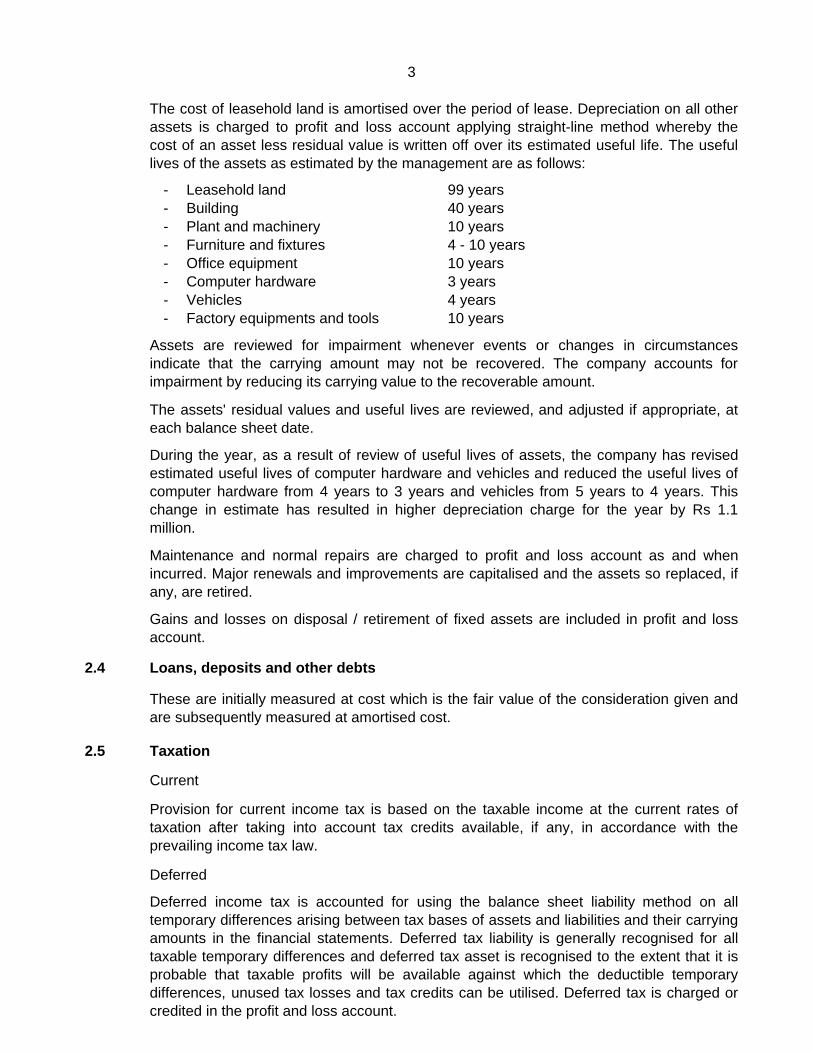
2.4 Loans, deposits and other debts
2.5 Taxation
Current
Deferred
Furniture and fixtures10 years3 years
Office equipment
Plant and machinery 10 yearsBuilding 40 years
The cost of leasehold land is amortised over the period of lease. Depreciation on all otherassets is charged to profit and loss account applying straight-line method whereby thecost of an asset less residual value is written off over its estimated useful life. The usefullives of the assets as estimated by the management are as follows:
3
99 yearsLeasehold land
Factory equipments and tools 10 years
Assets are reviewed for impairment whenever events or changes in circumstancesindicate that the carrying amount may not be recovered. The company accounts forimpairment by reducing its carrying value to the recoverable amount.
The assets' residual values and useful lives are reviewed, and adjusted if appropriate, ateach balance sheet date.
Gains and losses on disposal / retirement of fixed assets are included in profit and lossaccount.
During the year, as a result of review of useful lives of assets, the company has revisedestimated useful lives of computer hardware and vehicles and reduced the useful lives ofcomputer hardware from 4 years to 3 years and vehicles from 5 years to 4 years. Thischange in estimate has resulted in higher depreciation charge for the year by Rs 1.1million.
Maintenance and normal repairs are charged to profit and loss account as and whenincurred. Major renewals and improvements are capitalised and the assets so replaced, ifany, are retired.
Computer hardware
4 - 10 years
Vehicles
These are initially measured at cost which is the fair value of the consideration given andare subsequently measured at amortised cost.
4 years
Provision for current income tax is based on the taxable income at the current rates oftaxation after taking into account tax credits available, if any, in accordance with theprevailing income tax law.
Deferred income tax is accounted for using the balance sheet liability method on alltemporary differences arising between tax bases of assets and liabilities and their carryingamounts in the financial statements. Deferred tax liability is generally recognised for alltaxable temporary differences and deferred tax asset is recognised to the extent that it isprobable that taxable profits will be available against which the deductible temporarydifferences, unused tax losses and tax credits can be utilised. Deferred tax is charged orcredited in the profit and loss account.
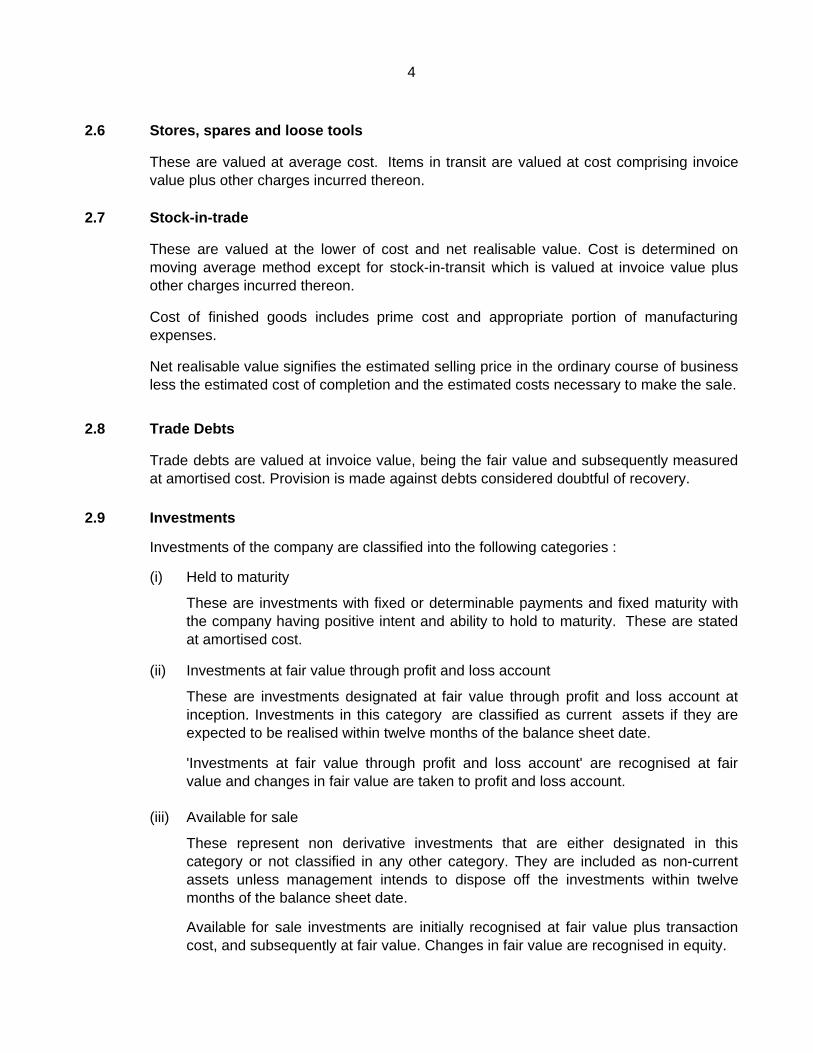
2.6 Stores, spares and loose tools
2.7 Stock-in-trade
2.8 Trade Debts
2.9 Investments
Investments of the company are classified into the following categories :
(i) Held to maturity
(ii) Investments at fair value through profit and loss account
(iii) Available for sale
These represent non derivative investments that are either designated in thiscategory or not classified in any other category. They are included as non-currentassets unless management intends to dispose off the investments within twelvemonths of the balance sheet date.
Net realisable value signifies the estimated selling price in the ordinary course of businessless the estimated cost of completion and the estimated costs necessary to make the sale.
Cost of finished goods includes prime cost and appropriate portion of manufacturingexpenses.
These are investments with fixed or determinable payments and fixed maturity withthe company having positive intent and ability to hold to maturity. These are statedat amortised cost.
Available for sale investments are initially recognised at fair value plus transactioncost, and subsequently at fair value. Changes in fair value are recognised in equity.
'Investments at fair value through profit and loss account' are recognised at fairvalue and changes in fair value are taken to profit and loss account.
These are valued at average cost. Items in transit are valued at cost comprising invoicevalue plus other charges incurred thereon.
These are valued at the lower of cost and net realisable value. Cost is determined onmoving average method except for stock-in-transit which is valued at invoice value plusother charges incurred thereon.
These are investments designated at fair value through profit and loss account atinception. Investments in this category are classified as current assets if they areexpected to be realised within twelve months of the balance sheet date.
Trade debts are valued at invoice value, being the fair value and subsequently measuredat amortised cost. Provision is made against debts considered doubtful of recovery.
4
2.10 Cash and cash equivalents
2.11 Staff retirement benefits
(i) Defined benefit plan
(ii) Defined contribution plan
The company also operates an approved contributory provident fund for itspermanent employees. Equal monthly contributions are made, both by the companyand the employees, to the fund at the rate of 10% of basic salary.
The company operates an approved funded gratuity scheme for all its permanentemployees. The scheme defines an amount of gratuity benefit that an employee willreceive on retirement subject to a minimum qualifying period of service under thescheme. The amount of gratuity is usually dependant on one or more factors suchas age, years of service and salary.
The liability recognised in respect of gratuity scheme is the present value of thecompany's gratuity obligation at the balance sheet date less the fair value of planassets, together with adjustments for unrecognised actuarial gain or losses.
The company assesses at each balance sheet date whether there is objective evidencethat an investment is impaired. Impairment loss on all investments is recognised in theprofit and loss account.
Actuarial gains and losses arising from experience adjustments and changes inactuarial assumptions in excess of the greater of 10% of the value of plan assets or10% of the gratuity obligation are charged or credited to profit and loss account overthe employees' expected average remaining working lives.
The gratuity obligation is calculated as at December 31, 2007 by independentactuary using projected unit credit method. The present value of the gratuityobligation is determined by discounting the estimated future cash outflows usinginterest rates of high quality government securities and that have terms to maturityapproximating to the terms of the related gratuity liability.
Cash and cash equivalents are carried in the balance sheet at cost. For the purposes ofcash flow statement, cash and cash equivalents comprise cash, cheques and demanddrafts in hand, balances with banks on current accounts and deposit accounts.
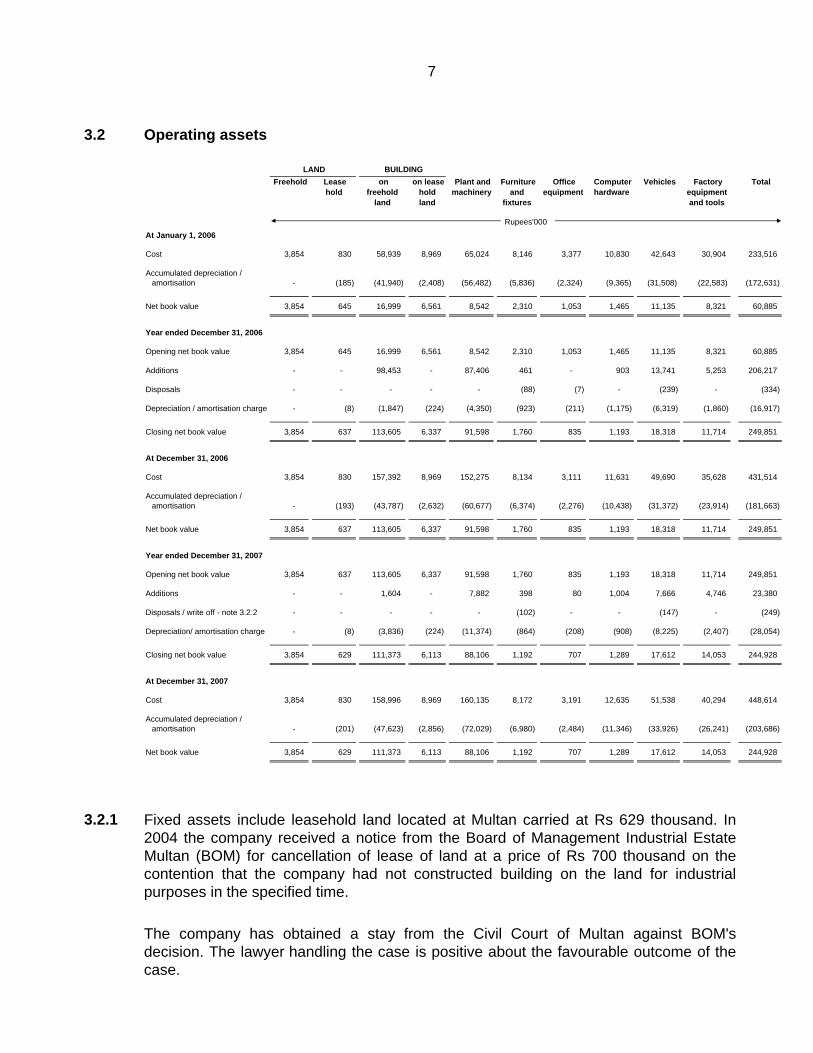
Operating assets 3.2 244,928 249,851 Capital work-in-progress - civil work - 2,392 Intangible assets 3.3 - -
244,928 252,243
Provisions are recognised when the company has a present legal or constructiveobligation as a result of past events, it is probable that an outflow of resources will berequired to settle the obligation and a reliable estimate of the amount can be made.
Dividend distribution to shareholders is recognised as liability in the financial statements inthe period in which the dividend is approved.
Dividend income on investments is recognised when the company's right to receivepayments is established.
Return on deposits and investments is recognised on accrual basis.
The company accounts for compensated absences of its employees on unavailed balanceof leave in the period in which the leave is earned. The liability recognised in respect ofcompensated absences is based on employees last drawn salary.
6
Rupees '000
Trade and other payables are initially measured at cost which is the fair value of theconsideration received. These are subsequently measured at amortised cost.
Assets and liabilities in foreign currencies are recorded using the rates of exchangeprevailing on the date of transaction. Monetary assets and liabilities in foreign currenciesare translated into Pak Rupee at the rates of exchange approximating to those applicableon the balance sheet date. Exchange gains and losses are taken to profit and lossaccount.
Net book value 3,854 629 111,373 6,113 88,106 1,192 707 1,289 17,612 14,053 244,928
3.2.1
7
LAND BUILDING
Rupees'000
Fixed assets include leasehold land located at Multan carried at Rs 629 thousand. In2004 the company received a notice from the Board of Management Industrial EstateMultan (BOM) for cancellation of lease of land at a price of Rs 700 thousand on thecontention that the company had not constructed building on the land for industrialpurposes in the specified time.
The company has obtained a stay from the Civil Court of Multan against BOM'sdecision. The lawyer handling the case is positive about the favourable outcome of thecase.
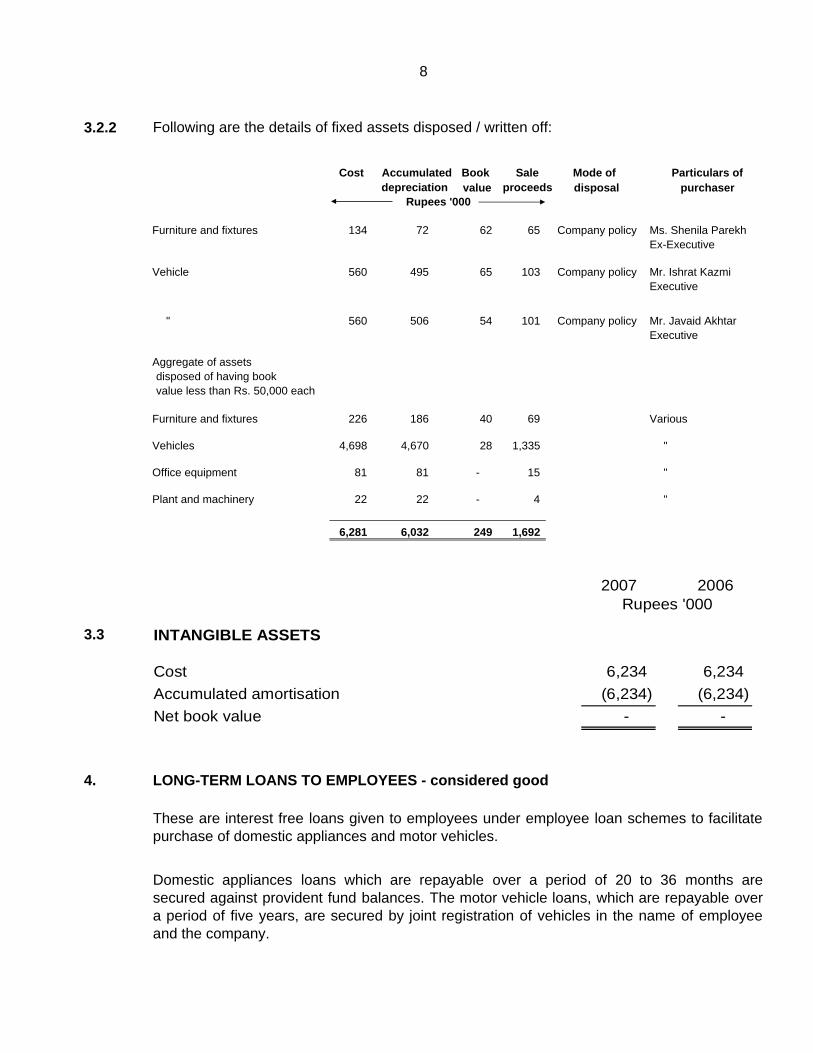
3.2.2 Following are the details of fixed assets disposed / written off:
Cost Book Mode of Particulars ofvalue disposal purchaser
Furniture and fixtures 134 72 62 65 Company policy Ms. Shenila ParekhEx-Executive
Vehicle 560 495 65 103 Company policy Mr. Ishrat KazmiExecutive
" 560 506 54 101 Company policy Mr. Javaid AkhtarExecutive
Aggregate of assets disposed of having book value less than Rs. 50,000 each
Furniture and fixtures 226 186 40 69 Various
Vehicles 4,698 4,670 28 1,335 "
Office equipment 81 81 - 15 "
Plant and machinery 22 22 - 4 "
6,281 6,032 249 1,692
3.3
4. LONG-TERM LOANS TO EMPLOYEES - considered good
These are interest free loans given to employees under employee loan schemes to facilitatepurchase of domestic appliances and motor vehicles.
Domestic appliances loans which are repayable over a period of 20 to 36 months aresecured against provident fund balances. The motor vehicle loans, which are repayable overa period of five years, are secured by joint registration of vehicles in the name of employeeand the company.
Rupees '000
8
Accumulateddepreciation
Saleproceeds
2007 2006
INTANGIBLE ASSETS
Cost 6,234 6,234 Accumulated amortisation (6,234) (6,234) Net book value - -
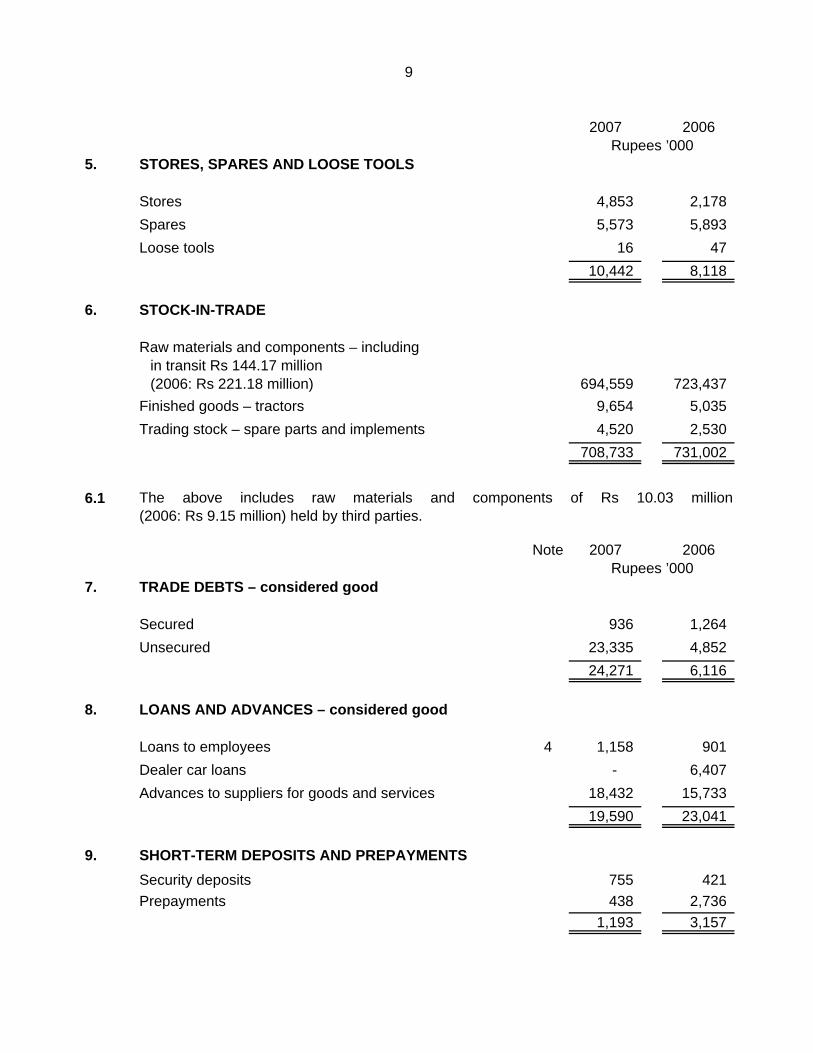
The above includes raw materials and components of Rs 10.03 million(2006: Rs 9.15 million) held by third parties.
Note 2007 2006
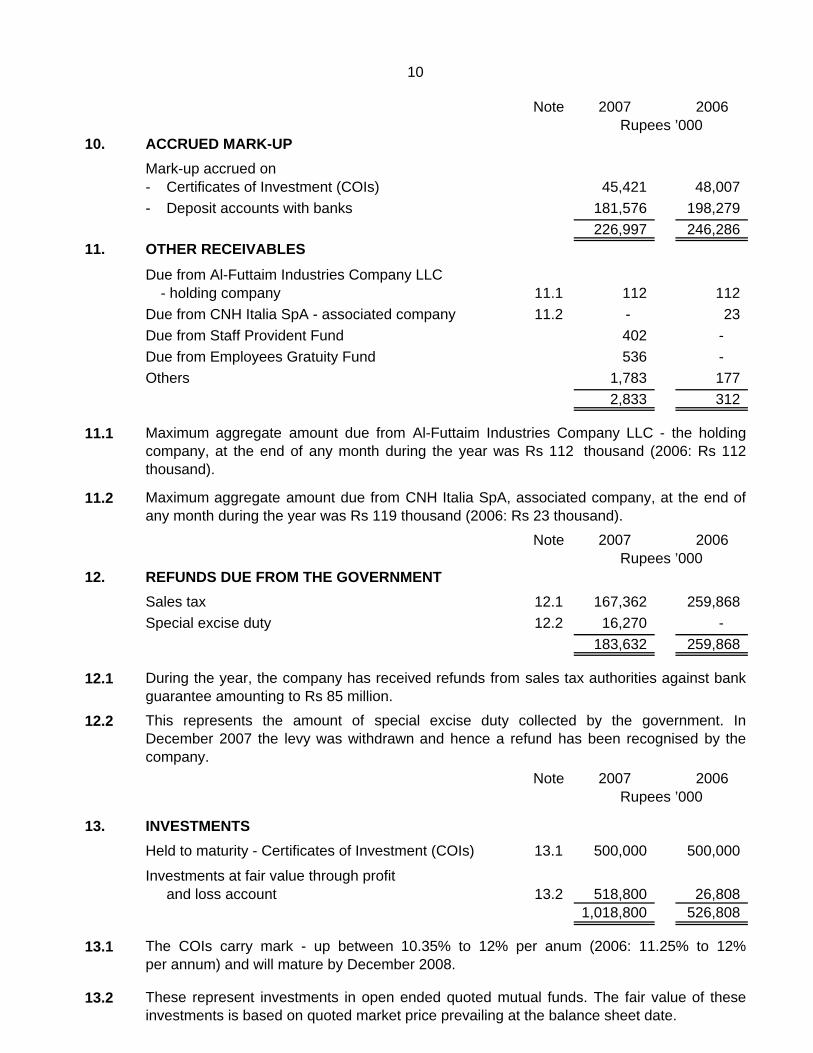
10. ACCRUED MARK-UPMark-up accrued on- Certificates of Investment (COIs) 45,421 48,007 - Deposit accounts with banks 181,576 198,279
226,997 246,286 11. OTHER RECEIVABLES
Due from Al-Futtaim Industries Company LLC - holding company 11.1 112 112
Due from CNH Italia SpA - associated company 11.2 - 23 Due from Staff Provident Fund 402 - Due from Employees Gratuity Fund 536 - Others 1,783 177
2,833 312
11.1
11.2
Note 2007 2006
12. REFUNDS DUE FROM THE GOVERNMENTSales tax 12.1 167,362 259,868 Special excise duty 12.2 16,270 -
183,632 259,868
12.1
12.2
Note 2007 2006
13. INVESTMENTSHeld to maturity - Certificates of Investment (COIs) 13.1 500,000 500,000
Investments at fair value through profit and loss account 13.2 518,800 26,808
1,018,800 526,808
13.1
13.2
The COIs carry mark - up between 10.35% to 12% per anum (2006: 11.25% to 12%per annum) and will mature by December 2008.
Maximum aggregate amount due from CNH Italia SpA, associated company, at the end ofany month during the year was Rs 119 thousand (2006: Rs 23 thousand).
10
Rupees ’000
These represent investments in open ended quoted mutual funds. The fair value of theseinvestments is based on quoted market price prevailing at the balance sheet date.
Maximum aggregate amount due from Al-Futtaim Industries Company LLC - the holdingcompany, at the end of any month during the year was Rs 112 thousand (2006: Rs 112thousand).
Rupees ’000
This represents the amount of special excise duty collected by the government. InDecember 2007 the levy was withdrawn and hence a refund has been recognised by thecompany.
Rupees ’000
During the year, the company has received refunds from sales tax authorities against bankguarantee amounting to Rs 85 million.
Note 2007 2006
14. CASH AND BANK BALANCESWith banks on
- Current accounts 904,998 538,339 - Deposit accounts 14.1 3,289,055 4,589,587 Cash in hand 190,498 14,195
4,384,551 5,142,121
14.1
2007 200615. SHARE CAPITAL15.1 Authorised Share Capital
60,000,000 ordinary shares of Rs. 5 each 300,000 300,000
15.2 Issued, subscribed and paid up capitalOrdinary shares of
Rs. 5 each2007 2006
4,500,000 4,500,000 Shares allotted forconsideration paid in cash 22,500 22,500
At December 31, 2007 the mark-up rates on PLS savings and term deposit accounts rangefrom 0.76% to 11.75% per annum (2006: 2.44% to 11.70% per annum). The term depositswill mature upto November 2008.
Rupees ’000
As at December 31, 2007 and 2006 Al-Futtaim Industries Company LLC, U.A.E., the holdingcompany and CNH Global N.V., Netherlands, an associated company held 21,476,078 and18,535,096 shares of Rs. 5 each respectively.
to statutory authority 4,906 4,329 Workers’ Profits Participation Fund 18.3 102,387 102,570 Workers’ Welfare Fund 40,993 38,900 Royalty payable to CNH Global N.V. - associated company 40,872 43,522 Others 1,912 2,148
2,912,127 3,698,853
18.1 These represent advances against sale of tractors which carry no mark-up.
18.2
Note 2007 2006
18.3 Workers’ Profits Participation Fund
At the beginning of the year 102,570 86,363 Allocation for the year 24 102,817 102,588
205,387 188,951 Interest on funds utilised in company’s business 25 - 333
205,387 189,284
Less: Amount paid to the trustees of the fund 6,540 2,790 Deposited with the Government 96,460 83,924
103,000 86,714 102,387 102,570
19. COMMITMENTS
20. UNFUNDED BANKING FACILITIES
This includes dividend payable to Al Futtaim Industries Company LLC, the holding companyand CNH Global N.V., associated company amounting to Rs 107.38 million (2006: Nil) andRs 92.68 million (2006: Nil) respectively.
Rupees '000
Commitments for capital expenditure outstanding as at December 31, 2007 amounted to Rs2.34 million (2006: Rs 4.59 million).
Rupees ’000
The above arrangements are secured by way of pari-passu charge against hypothecation ofcompany's stock-in-trade and book debts.
The facilities for opening letters of credit and guarantees as at December 31, 2007amounted to Rs 1,496 million (2006: Rs 1,705 million) of which unutilised balance at yearend amounted to Rs 1,126.81 million (2006: Rs 1,510.68 million).
Audit fee 605 550 Fee for limited review of half yearly financial
statements, certification for compliance with Codeof Corporate Governance and certifications forgovernment and other agencies 605 515
Out of pocket expenses 142 137 1,352 1,202
22.2 None of the directors or their spouses had any interest in the donee.
23. OTHER OPERATING INCOME
Income from financial assets
Return on deposit accounts 466,180 480,017 Return on COIs 59,607 70,201 Gain on investments at fair value
through profit and loss account 16,992 3,937 Exchange gain - net - 1 Others 214 583
542,993 554,739 Income from other assets
Scrap sales 11,568 5,663 Profit on disposal of fixed assets 1,443 2,750 Others 2,854 1,508
15,865 9,921 558,858 564,660
24. OTHER OPERATING EXPENSES
Workers’ Profits Participation Fund 102,817 102,588 Workers’ Welfare Fund 39,071 38,983
141,888 141,571 25. FINANCE COST
Interest on Workers’ Profits Participation Fund - 333 Bank charges and commission 2,863 2,265 Mark-up on security deposit 149 163
3,012 2,761 26. TAXATION
Current - for the year 662,951 645,000 - for prior years (22,901) - Deferred 6,994 35,862
647,044 680,862
14
Rupees ’000
2007 2006
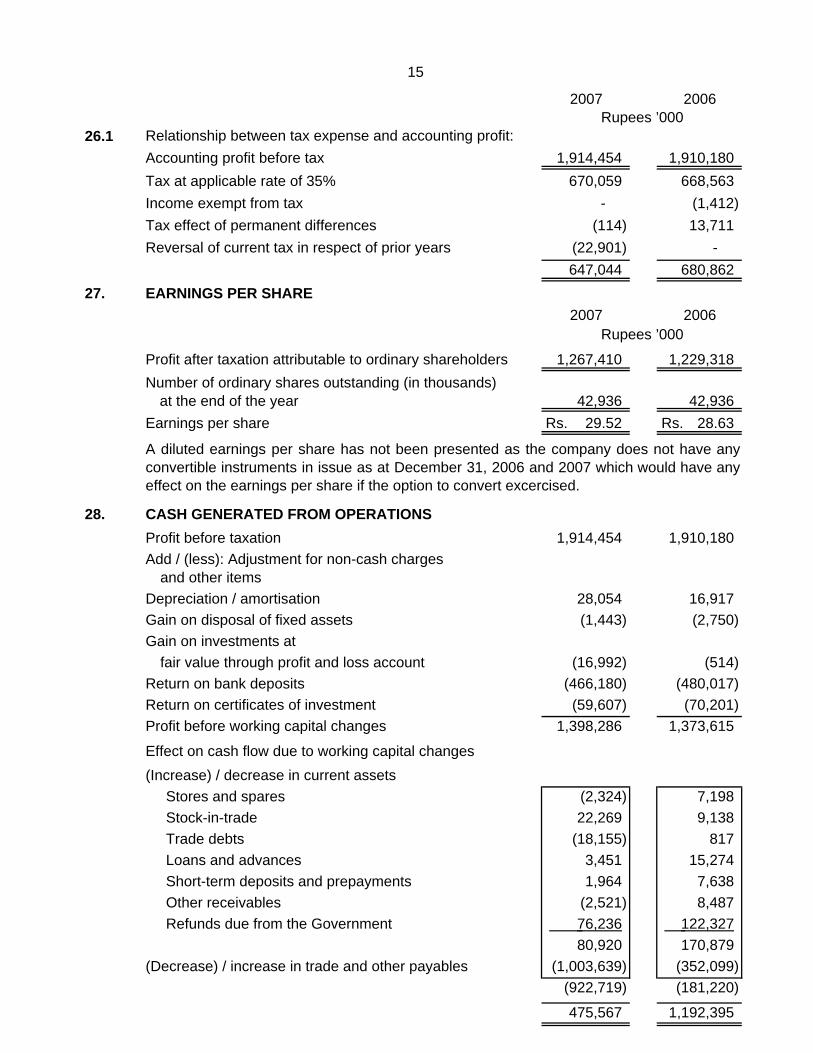
26.1Accounting profit before tax 1,914,454 1,910,180 Tax at applicable rate of 35% 670,059 668,563 Income exempt from tax - (1,412) Tax effect of permanent differences (114) 13,711 Reversal of current tax in respect of prior years (22,901) -
647,044 680,862 27. EARNINGS PER SHARE
2007 2006
Profit after taxation attributable to ordinary shareholders 1,267,410 1,229,318 Number of ordinary shares outstanding (in thousands) at the end of the year 42,936 42,936 Earnings per share 29.52Rs. 28.63Rs.
28. CASH GENERATED FROM OPERATIONSProfit before taxation 1,914,454 1,910,180 Add / (less): Adjustment for non-cash charges
and other itemsDepreciation / amortisation 28,054 16,917 Gain on disposal of fixed assets (1,443) (2,750) Gain on investments at
fair value through profit and loss account (16,992) (514) Return on bank deposits (466,180) (480,017) Return on certificates of investment (59,607) (70,201) Profit before working capital changes 1,398,286 1,373,615
Effect on cash flow due to working capital changes(Increase) / decrease in current assets Stores and spares (2,324) 7,198 Stock-in-trade 22,269 9,138 Trade debts (18,155) 817 Loans and advances 3,451 15,274 Short-term deposits and prepayments 1,964 7,638 Other receivables (2,521) 8,487 Refunds due from the Government 76,236 122,327
80,920 170,879 (Decrease) / increase in trade and other payables (1,003,639) (352,099)
(922,719) (181,220)
475,567 1,192,395
15
Relationship between tax expense and accounting profit:Rupees ’000
Rupees ’000
A diluted earnings per share has not been presented as the company does not have anyconvertible instruments in issue as at December 31, 2006 and 2007 which would have anyeffect on the earnings per share if the option to convert excercised.
Note 2007 200629. STAFF RETIREMENT BENEFIT
29.1 Movement in (asset) / liability Balance as at January 1 283 (381) Charge for the year 29.5 2,745 3,544 Employer contributions (3,564) (2,880) Balance as at December 31 (536) 283
29.2 Movement in the defined benefit obligationObligation as at January 1 66,835 61,980 Service cost 4,370 4,229 Interest cost 6,684 5,580 Actuarial gains (287) (2,409) Benefits paid (3,828) (2,545) Obligation as at December 31 73,774 66,835
29.3 Movement in the fair value of plan assetsFair value as at January 1 78,760 69,459 Expected return on plan assets 7,876 6,251 Actuarial (losses) / gains (873) 2,715 Employer contributions 3,564 2,880 Benefits paid (3,828) (2,545) Fair value as at December 31 85,499 78,760
29.4 Balance sheet reconciliation as at December 31, 2007
Present value of obligation 73,774 66,835 Fair value of plan assets (85,499) (78,760) Unrecognised actuarial gains 11,189 12,208
(536) 283 29.5 Charge for the year
Service cost 4,370 4,229 Interest cost 6,684 5,580 Expected return on plan assets (7,876) (6,251) Actuarial gains recognised during the year (433) (14)
2,745 3,544
29.6 Actual return on plan assets 7,003 7,875
29.7 Key actuarial assumptions used are as follows: 2007 2006
Expected rate of return on investments 10% 10%Expected rate of increase in salaries - Management staff 10% 10% - Non-management staff 8% 8%Discount factor used 10% 10%Retirement age (years) 60 60
Rupees ’000
16
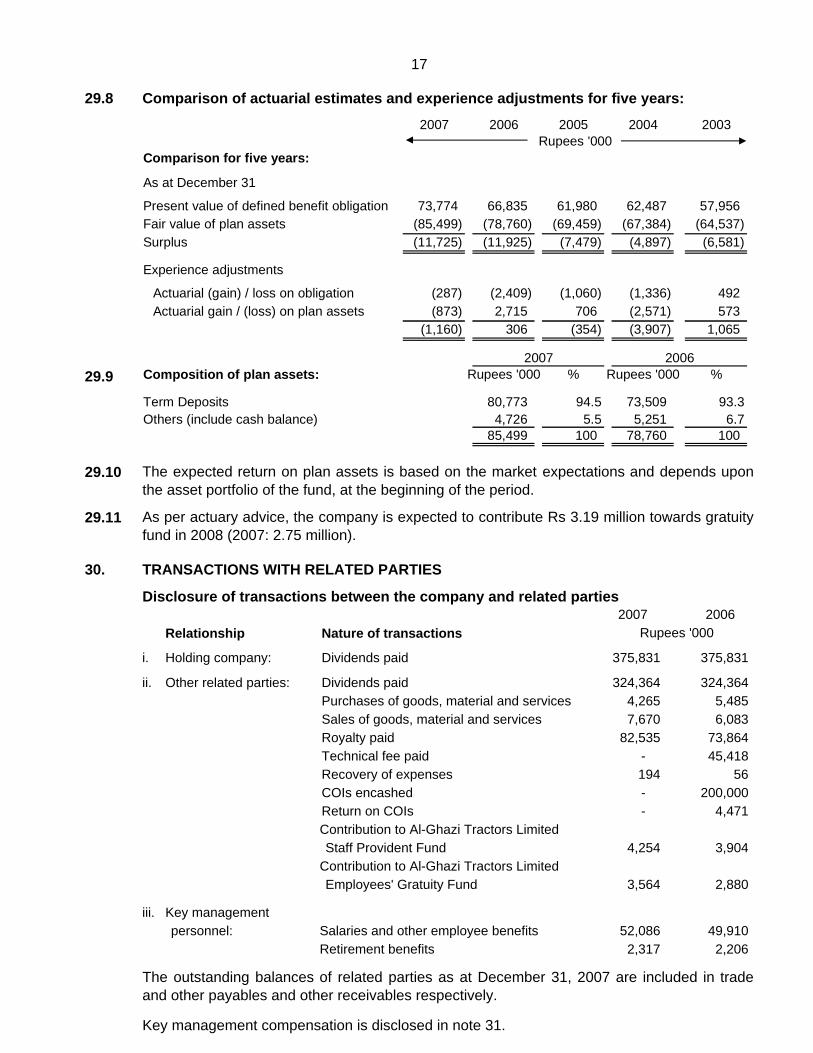
29.8 Comparison of actuarial estimates and experience adjustments for five years:
29.9
29.10
29.11
30. TRANSACTIONS WITH RELATED PARTIES
Disclosure of transactions between the company and related parties2007 2006
Relationship Nature of transactions
i. Holding company: Dividends paid 375,831 375,831
ii. Other related parties: Dividends paid 324,364 324,364 Purchases of goods, material and services 4,265 5,485 Sales of goods, material and services 7,670 6,083 Royalty paid 82,535 73,864 Technical fee paid - 45,418 Recovery of expenses 194 56 COIs encashed - 200,000 Return on COIs - 4,471
4,254 3,904 Contribution to Al-Ghazi Tractors LimitedEmployees' Gratuity Fund 3,564 2,880
iii. Key management personnel: Salaries and other employee benefits 52,086 49,910
Retirement benefits 2,317 2,206
17
The outstanding balances of related parties as at December 31, 2007 are included in tradeand other payables and other receivables respectively.
Key management compensation is disclosed in note 31.
The expected return on plan assets is based on the market expectations and depends uponthe asset portfolio of the fund, at the beginning of the period.
Rupees '000
As per actuary advice, the company is expected to contribute Rs 3.19 million towards gratuityfund in 2008 (2007: 2.75 million).
Contribution to Al-Ghazi Tractors LimitedStaff Provident Fund
2007 2006 2005 2004 2003
Comparison for five years:
As at December 31
Present value of defined benefit obligation 73,774 66,835 61,980 62,487 57,956 Fair value of plan assets (85,499) (78,760) (69,459) (67,384) (64,537) Surplus (11,725) (11,925) (7,479) (4,897) (6,581)
Experience adjustments
Actuarial (gain) / loss on obligation (287) (2,409) (1,060) (1,336) 492 Actuarial gain / (loss) on plan assets (873) 2,715 706 (2,571) 573
(1,160) 306 (354) (3,907) 1,065
Composition of plan assets: Rupees '000 % Rupees '000 %
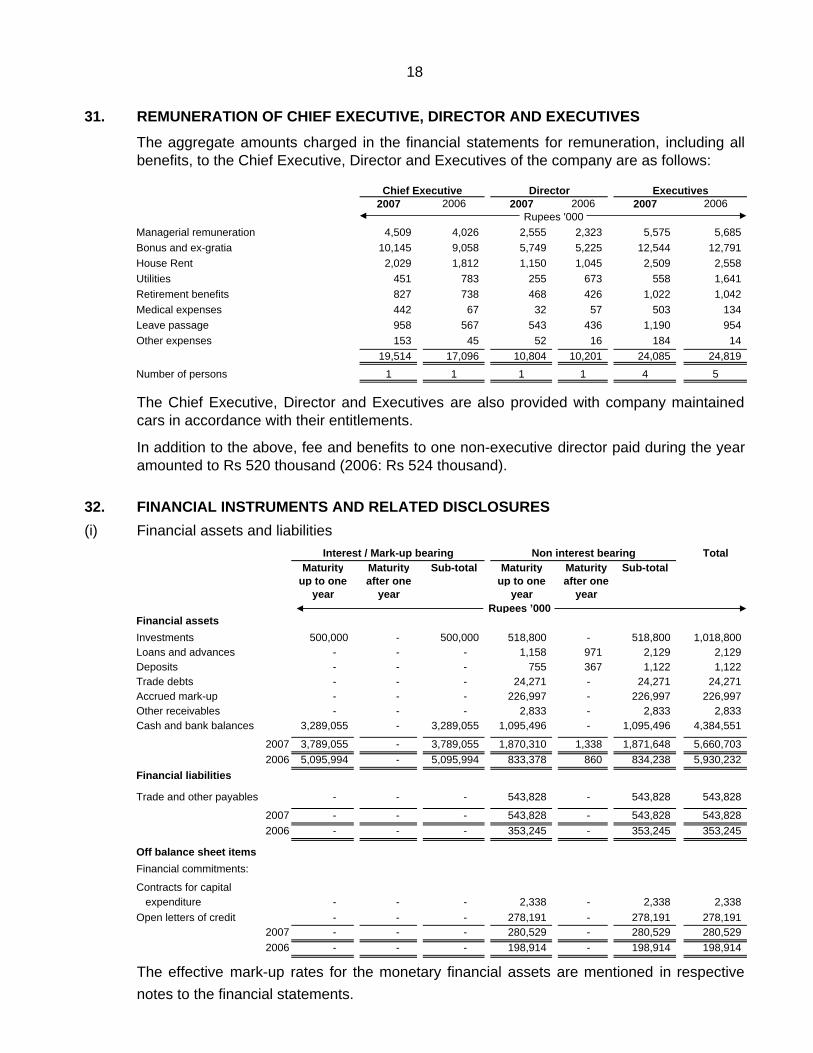
The aggregate amounts charged in the financial statements for remuneration, including allbenefits, to the Chief Executive, Director and Executives of the company are as follows:
MaturityNon interest bearing
Chief Executive
Rupees '000
18
Interest / Mark-up bearing
ExecutivesDirector
The Chief Executive, Director and Executives are also provided with company maintainedcars in accordance with their entitlements.
In addition to the above, fee and benefits to one non-executive director paid during the yearamounted to Rs 520 thousand (2006: Rs 524 thousand).
The effective mark-up rates for the monetary financial assets are mentioned in respectivenotes to the financial statements.
yearRupees ’000
after one
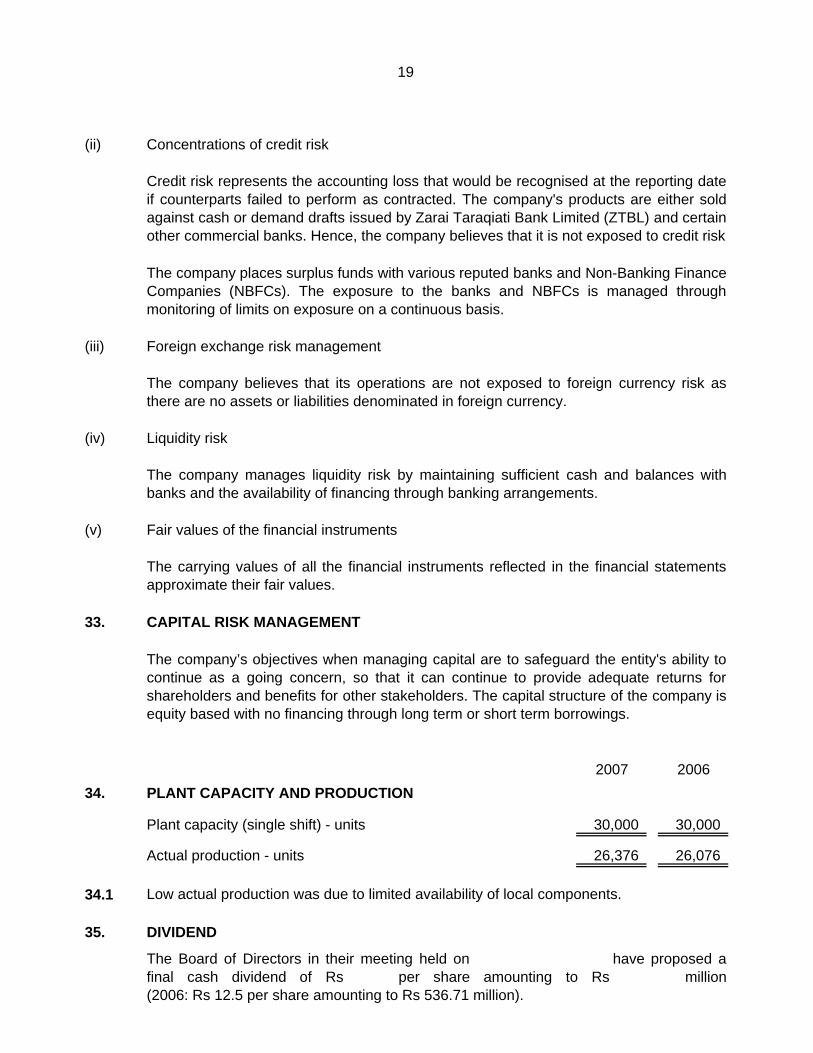
(ii) Concentrations of credit risk
(iii) Foreign exchange risk management
(iv) Liquidity risk
(v) Fair values of the financial instruments
33. CAPITAL RISK MANAGEMENT
2007 200634. PLANT CAPACITY AND PRODUCTION
Plant capacity (single shift) - units 30,000 30,000
Actual production - units 26,376 26,076
34.1 Low actual production was due to limited availability of local components.
35. DIVIDEND
The company’s objectives when managing capital are to safeguard the entity's ability tocontinue as a going concern, so that it can continue to provide adequate returns forshareholders and benefits for other stakeholders. The capital structure of the company isequity based with no financing through long term or short term borrowings.
19
The company believes that its operations are not exposed to foreign currency risk asthere are no assets or liabilities denominated in foreign currency.
The Board of Directors in their meeting held on have proposed afinal cash dividend of Rs per share amounting to Rs million(2006: Rs 12.5 per share amounting to Rs 536.71 million).
Credit risk represents the accounting loss that would be recognised at the reporting dateif counterparts failed to perform as contracted. The company's products are either soldagainst cash or demand drafts issued by Zarai Taraqiati Bank Limited (ZTBL) and certainother commercial banks. Hence, the company believes that it is not exposed to credit risk
The company places surplus funds with various reputed banks and Non-Banking FinanceCompanies (NBFCs). The exposure to the banks and NBFCs is managed throughmonitoring of limits on exposure on a continuous basis.
The company manages liquidity risk by maintaining sufficient cash and balances withbanks and the availability of financing through banking arrangements.
The carrying values of all the financial instruments reflected in the financial statementsapproximate their fair values.
36. CORRESPONDING FIGURES
37. DATE OF AUTHORISATION FOR ISSUE
Chairman Chief Executive
Corresponding figures have been rearranged, wherever necessary, for the purpose ofcomparison.
20
These financial statements were authorised for issue on February 13 , 2008 by theBoard of Directors.