1 AL Pictoris and FR Piscis: two regular Blazhko RR Lyrae stars Pierre de Ponthière 1 15 Rue Pré Mathy, Lesve – Profondeville 5170 – Belgium; address email correspondence to [email protected]Franz-Josef (Josch) Hambsch 1,2,3 12 Oude Bleken, Mol, 2400 - Belgium Kenneth Menzies 1 318A Potter Road, Framingham MA,01701 – USA Richard Sabo 1 2336 Trailcrest Drive, Bozeman MT, 59718 - USA 1 American Association of Variable Star Observers (AAVSO) 2 Bundesdeutsche Arbeitsgemeinschaft für Veränderliche Sterne e.V. (BAV), Germany 3Vereniging Voor Sterrenkunde (VVS), Belgium Abstract The results presented are a continuation of observing campaigns conducted by a small group of amateur astronomers interested in the Blazhko effect of RR Lyrae stars. The goal of these observations is to confirm the RR Lyrae Blazhko effect and to detect any additional Blazhko modulation which cannot be identified from all sky survey data- mining. The Blazhko effect of the two observed stars is confirmed, but no additional Blazhko modulations have been detected. The observation of the RR Lyrae star AL Pic during 169 nights was conducted from San Pedro de Atacama (Chile). From the observed light curve, 49 pulsation maxima have been measured. Fourier analyses of (O-C), magnitude at maximum light (M max ) and the complete light curve have provided a confirmation of published pulsation and Blazhko periods, 0.548622 and 34.07 days, respectively. The second multi-longitude observation campaign focused on the RR Lyrae star FR Psc was performed from Europe, United States and Chile. Fourier analyses of the light curve and of 59 measured brightness maxima have improved the accuracy of pulsation and Blazhko periods which are 0.45568 and 51.31 days, respectively. For both stars, no additional Blazhko modulations have been detected. 1. Introduction The data-mining of automated sky surveys like All Sky Automated Survey - ASAS (Wils and Sódor 2005) and Northern Sky Variability Survey - NSVS (Wils et al. 2006) is frequently used to discover new RR Lyrae stars and to measure their pulsation periods and for some of them to detect and measure Blazhko modulation. Automated sky surveys with their low sampling frequencies (at best one sample per night) generate sparse datasets. As a result, spectral analysis of the datasets is not always fully reliable. Some Blazhko modulation periods are published as uncertain and multiple Blazhko modulations are not always detected. To overcome those shortcomings, more observations of identified RR Lyrae stars are required. Detailed study of long time-series observations allows the identification of individual brightness maxima of the light curve and other light curve details. The spectral analysis of the rich time-series is able to characterize the Blazhko modulation(s) in detail. The results of observing campaigns presented herein are related to two RR Lyrae stars exhibiting the Blazhko effect, AL Pic and FR Psc, discovered respectively from ASAS and NSVS surveys (Wils and Sódor 2005 and Wils et al. 2006). The designation of AL Pic appeared in the General Catalogue of Variable Stars with the 79 th Name List of Variable Stars (Kazarovets et al. 2008), and previously this star was identified as GSC 8082-0469, NSV 1700 and ASAS J044131-5216.6. From the All Sky Automated Survey database, Wils and Sódor (2005) measured a pulsation period of 0.54861 day and also a Blazhko period of 34.0 days. The results presented herein are derived from data gathered during 169 nights between July 17, 2012 and February 1, 2013. A total of 17,416 magnitude measurements
Transcript
1
AL Pictoris and FR Piscis: two regular Blazhko RR Lyrae stars
Pierre de Ponthière 1
15 Rue Pré Mathy, Lesve – Profondeville 5170 – Belgium; address email correspondence to [email protected]
Franz-Josef (Josch) Hambsch 1,2,3
12 Oude Bleken, Mol, 2400 - Belgium
Kenneth Menzies 1
318A Potter Road, Framingham MA,01701 – USA
Richard Sabo 1
2336 Trailcrest Drive, Bozeman MT, 59718 - USA
1 American Association of Variable Star Observers (AAVSO)
2 Bundesdeutsche Arbeitsgemeinschaft für Veränderliche Sterne e.V. (BAV), Germany 3Vereniging Voor Sterrenkunde (VVS), Belgium
Abstract The results presented are a continuation of observing campaigns conducted by a small group of amateur astronomers
interested in the Blazhko effect of RR Lyrae stars. The goal of these observations is to confirm the RR Lyrae
Blazhko effect and to detect any additional Blazhko modulation which cannot be identified from all sky survey data-
mining. The Blazhko effect of the two observed stars is confirmed, but no additional Blazhko modulations have
been detected.
The observation of the RR Lyrae star AL Pic during 169 nights was conducted from San Pedro de Atacama (Chile).
From the observed light curve, 49 pulsation maxima have been measured. Fourier analyses of (O-C), magnitude at
maximum light (Mmax) and the complete light curve have provided a confirmation of published pulsation and
Blazhko periods, 0.548622 and 34.07 days, respectively. The second multi-longitude observation campaign focused
on the RR Lyrae star FR Psc was performed from Europe, United States and Chile. Fourier analyses of the light
curve and of 59 measured brightness maxima have improved the accuracy of pulsation and Blazhko periods which
are 0.45568 and 51.31 days, respectively. For both stars, no additional Blazhko modulations have been detected.
1. Introduction The data-mining of automated sky surveys like All Sky Automated Survey - ASAS (Wils and Sódor 2005) and
Northern Sky Variability Survey - NSVS (Wils et al. 2006) is frequently used to discover new RR Lyrae stars and to
measure their pulsation periods and for some of them to detect and measure Blazhko modulation. Automated sky
surveys with their low sampling frequencies (at best one sample per night) generate sparse datasets. As a result,
spectral analysis of the datasets is not always fully reliable. Some Blazhko modulation periods are published as
uncertain and multiple Blazhko modulations are not always detected. To overcome those shortcomings, more
observations of identified RR Lyrae stars are required. Detailed study of long time-series observations allows the
identification of individual brightness maxima of the light curve and other light curve details. The spectral analysis
of the rich time-series is able to characterize the Blazhko modulation(s) in detail.
The results of observing campaigns presented herein are related to two RR Lyrae stars exhibiting the Blazhko effect,
AL Pic and FR Psc, discovered respectively from ASAS and NSVS surveys (Wils and Sódor 2005 and Wils et al.
2006).
The designation of AL Pic appeared in the General Catalogue of Variable Stars with the 79th
Name List of Variable
Stars (Kazarovets et al. 2008), and previously this star was identified as GSC 8082-0469, NSV 1700 and
ASAS J044131-5216.6. From the All Sky Automated Survey database, Wils and Sódor (2005) measured a pulsation
period of 0.54861 day and also a Blazhko period of 34.0 days. The results presented herein are derived from data
gathered during 169 nights between July 17, 2012 and February 1, 2013. A total of 17,416 magnitude measurements
2
covering 5.8 Blazhko cycles were collected. All the observations were made by Franz-Josef Hambsch using
remotely a 40 cm f/6.8 telescope located in San Pedro de Atacama (Chile).
The designation of FR Psc appeared in the General Catalogue of Variable Stars with the first part of 80th
Name List
of Variable Stars (Kazarovets et al. 2011). This star was previously identified as GSC 0607-0591 and NSV
9149730. From the Northern Sky Variability Survey data (Wozniak et al. 2004), Wils et al. (2006) have measured a
pulsation period of 0.45570 days and an uncertain Blazhko period of 55 days. Our observations were made between
August 18, 2012 and December 30, 2013. During the 126 observation nights, a total of 12,653 observations have
been made by Franz-Josef Hambsch from Cloudcroft (NM) and from San Pedro de Atacama (Chile), by Richard
Sabo from Bozeman (Montana), Kenneth Menzies from Framingham (MA) and Pierre de Ponthière from Lesve
(Belgium). The numbers of observations for the different locations are 3597, 7272, 1106, 146 and 532, respectively.
For images of both stars, dark and flat field corrections were performed with MAXIMDL software (Diffraction Limited,
2004), and aperture photometry was performed using LESVEPHOTOMETRY (de Ponthière, 2010), a custom software
which also evaluates the SNR and estimates magnitude errors. The photometric observations of both stars are
available in the AAVSO International Database (AAVSO, 2014).
AL Pic observations were performed with only a V filter and are not transformed to the standard system. The
comparison stars are given in Table 1, their coordinates and magnitudes in B and V bands were obtained from the
AAVSO’s Variable Star Database (VSD). The observations have been reduced with C1 as a magnitude reference
and C2 as a check star.
The observations of FR Psc were also performed with a V filter and are not transformed to the standard system.
The comparison star coordinates and magnitudes in B and V bands were extracted from the AAVSO APASS survey
and are given in Table 8. All observations, except from Cloudcroft, were reduced with C1 as magnitude reference
and C2 as check star. Cloudcroft observations were reduced with C2 and C3 as reference and comparison stars. A
correction of 0.021 magnitude has been applied to Cloudcroft observations. This correction has been calculated from
the magnitude difference of C3 when measured with C1 and C2 as magnitude references.
2. Light curve maxima analyses The times of maxima of the light curves have been evaluated with custom software (de Ponthiere, 2010) fitting the
light curve with a smoothing spline function (Reinsch, 1967).
2.1 AL Pic
A total of 49 maxima have been observed for AL Pic. Table 2 provides the list of the observed maxima and Figure 1
shows the (O-C) and Mmax (Magnitude at Maximum) values. A linear regression of all available (O-C) values has
provided a pulsation period of 0.548549 d (1.822858 d-1
). The (O-C) values have been re-evaluated with this new
pulsation period and the pulsation ephemeris origin has been set to the highest recorded brightness maximum: HJD
2 456 154.7560. The new derived pulsation elements are:
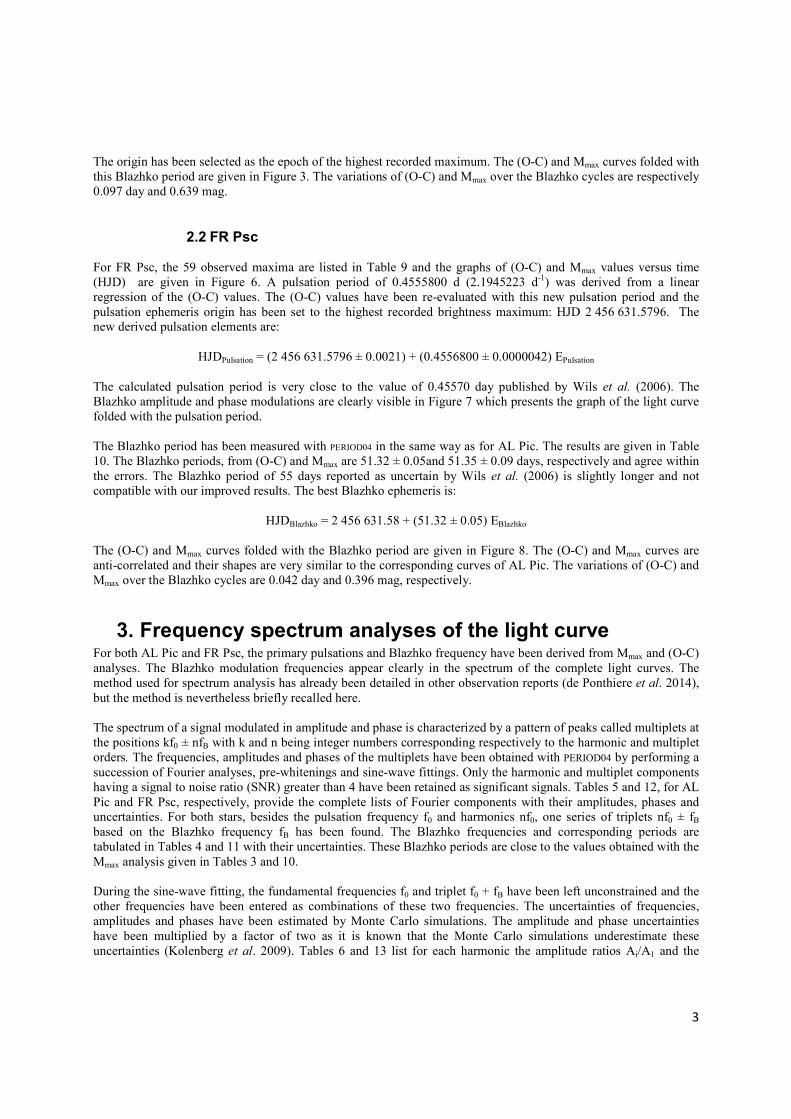
The (O-C) and Mmax curves folded with the Blazhko period are given in Figure 8. The (O-C) and Mmax curves are
anti-correlated and their shapes are very similar to the corresponding curves of AL Pic. The variations of (O-C) and
Mmax over the Blazhko cycles are 0.042 day and 0.396 mag, respectively.
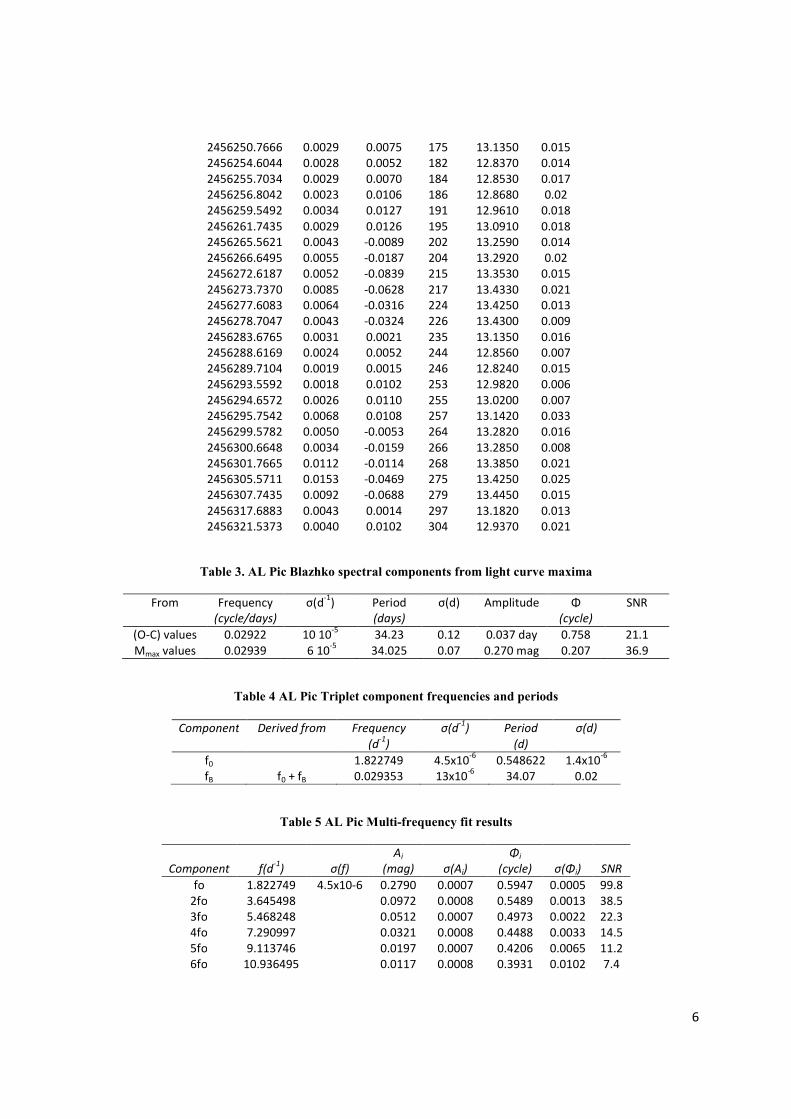
3. Frequency spectrum analyses of the light curve For both AL Pic and FR Psc, the primary pulsations and Blazhko frequency have been derived from Mmax and (O-C)
analyses. The Blazhko modulation frequencies appear clearly in the spectrum of the complete light curves. The
method used for spectrum analysis has already been detailed in other observation reports (de Ponthiere et al. 2014),
but the method is nevertheless briefly recalled here.
The spectrum of a signal modulated in amplitude and phase is characterized by a pattern of peaks called multiplets at
the positions kf0 ± nfB with k and n being integer numbers corresponding respectively to the harmonic and multiplet
orders. The frequencies, amplitudes and phases of the multiplets have been obtained with PERIOD04 by performing a
succession of Fourier analyses, pre-whitenings and sine-wave fittings. Only the harmonic and multiplet components
having a signal to noise ratio (SNR) greater than 4 have been retained as significant signals. Tables 5 and 12, for AL
Pic and FR Psc, respectively, provide the complete lists of Fourier components with their amplitudes, phases and
uncertainties. For both stars, besides the pulsation frequency f0 and harmonics nf0, one series of triplets nf0 ± fB
based on the Blazhko frequency fB has been found. The Blazhko frequencies and corresponding periods are
tabulated in Tables 4 and 11 with their uncertainties. These Blazhko periods are close to the values obtained with the
Mmax analysis given in Tables 3 and 10.
During the sine-wave fitting, the fundamental frequencies f0 and triplet f0 + fB have been left unconstrained and the
other frequencies have been entered as combinations of these two frequencies. The uncertainties of frequencies,
amplitudes and phases have been estimated by Monte Carlo simulations. The amplitude and phase uncertainties
have been multiplied by a factor of two as it is known that the Monte Carlo simulations underestimate these
uncertainties (Kolenberg et al. 2009). Tables 6 and 13 list for each harmonic the amplitude ratios Ai/A1 and the
4
ratios usually used to characterize the Blazhko effect, that is, Ai+/A1 ; Ai
-/A1 ; Ri = A
+i / A
-i and asymmetries Qi =
(A+
i - A-i) / (A
+i + A
-i). In the present cases the side lobe amplitudes A
-i and A
+i are similar which leads to small
values for the Qi asymmetry ratios. Except for some higher order triplets of AL Pic, the asymmetry ratios are
positive (A+
i > A-i). For the majority of Blazhko stars, the Qi asymmetry ratios are larger and generally lie between
0.1 and 0.5 but smaller and negative values are not unusual (Alcock et al. 2003). The fact that first triplet values
(A+
1 , A-1) are larger for AL Pic (0.39 and 0.36) than for FR Psc values (0.17 and 0.16) is due to the relative strength
of Blazhko modulations and is consistent with the corresponding variations of the magnitudes at maximum light
provided in the preceding section (0.639 and 0.396 mag).
4. Light curve variations over Blazhko cycle Subdividing the data set into temporal subsets is a classical method to visualize and analyze the light curve
variations over the Blazhko cycle. For both stars, ten temporal subsets corresponding to the different Blazhko phase
intervals Ψi (i = 0 , 9) have been created using the epochs of the highest recorded maxima as the origins of the first
subset. The folded light curves for the ten subsets are presented in Figures 4 and 9. For AL Pic, the data cover
around six successive Blazhko cycles and are relatively well distributed over the different temporal subsets and
Blazhko cycles. The population percentage of data points varies between 7.7% and 12% for the ten temporal subsets
and between 8.4% and 30% for the six Blazhko cycles. The first and second observation seasons of FR Psc cover
around 2.6 and 2.3 Blazhko cycles, respectively. The observation data are also well distributed over the temporal
subsets, the population varying between 6.4% and 16%.
From a visual inspection of Figures 4 and 9, it is clear that the light curves are only affected by a small scatter during
the successive Blazhko cycles. This fact is not surprising, indeed for both stars only one Blazhko modulation
frequency has been detected in the spectrum analysis. Fourier analyses and Least-Square fittings have been
performed on the different temporal subsets. For the fundamental frequency and the first four harmonics the
amplitudes Ai and the epoch-independent phase differences (Φk1 = Φk - kΦk1) are given in Tables 7 and 14 and
plotted in Figures 5 and 10. The differences between maximal and minimal values of A1 over the Blazhko cycle for
AL Pic and FR Psc are 0.235 and 0.106 mag, respectively. The larger Ai value for AL Pic is a confirmation that the
Blazhko modulation is stronger for AL Pic than for FR Psc.
5. Conclusions The two analysis methods, maximum brightness and light curve Fourier analyses, have provided similar results for
both stars. No multiple or irregular Blazhko modulations have been detected and for the two stars the light curves
repeat from one cycle to another. The FR Psc Blazhko period was previously published as uncertain. The new
measured period value of 51.31 ± 0.02 days removes the uncertainty. The period of 34.07 ± 0.02 days for AL Pic is
in agreement with the previously published value. The objective of this small group of amateur astronomers is to
observe and to analyze Blazhko RR Lyrae stars with the hope of finding stars affected by irregular or multiple
Blazhko modulations. These two coordinated multi-longitude campaigns have not revealed such multiple
modulations. However, observers should continue their regular and coordinated multi-longitude observations to
precisely characterize Blazhko modulations in other RR Lyrae stars.
Acknowledgements Dr A. Henden, Director of AAVSO and the AAVSO are acknowledged for the use of AAVSOnet telescopes at
Cloudcroft (New Mexico, USA). The AAVSO Charts and Sequence Team is thanked for preparing the comparison
star sequences. The authors thank the referee for the comments and encouragements. This work has made use of The
International Variable Star Index (VSX) maintained by the AAVSO and the SIMBAD astronomical database
(http://simbad.u-strasbg.fr).
5
References
AAVSO, 2014, AAVSO International Database (AID) (http://www.aavso.org/aavso-international-database)
Alcock, C., et al. 2003, Astrophys. J., 598, 597.
de Ponthière, P. 2010, LESVEPHOTOMETRY, automatic photometry software (http://www.dppobservatory.net).
de Ponthière, P., et al. 2014, J. Amer. Assoc. Var. Star Obs., 42, 53 Diffraction Limited. 2004, MAXIMDL image processing software (http://www.cyanogen.com).
Kazarovets, E.V., et al. 2008 IBVS No. 5863
Kazarovets, E.V., et al. 2011 IBVS No. 5969
Kolenberg, K., et al. 2009, Mon. Not. Roy. Astron. Soc., 396, 263.
Lenz, P., and Breger, M. 2005, Commun. Asteroseismology, 146, 53.