NOAA-TM-AFSC-259 – Volume 11 Community Profiles for North Pacific Fisheries – Alaska: Yakutat 1 Yakutat (YACK-uh-tat) People and Place Location 1 Yakutat is isolated among the lowlands along the Gulf of Alaska, 225 miles northwest of Juneau and 220 miles southeast of Cordova. It is at the mouth of Yakutat Bay, one of the few refuges for vessels along this stretch of coast. The Hubbard and Malaspina Glaciers are nearby. Its boundaries are the Canadian border to the north, Cape Suckling to the west, and Cape Fairweather to the east. Yakutat Borough is within and surrounded by the Tongass National Forests, Wrangell St-Elias National Park and Preserve, and Glacier Bay National Park and Preserve. The area encompasses 7,650.5 square miles of land and 1,808.8 square miles of water. Yakutat was incorporated as a city in 1948, but was dissolved and reorganized into its own borough in 1992. Demographic Profile 2 In 2010, there were 662 residents, ranking Yakutat 96 th of 352 Alaskan communities in terms of population size. Between 1990 and 2010, the population grew by 24.0%. Between 2000 and 2009, the population declined by 10.6% with an average annual growth rate of -0.98%, which was lower than the statewide average of 0.75% and indicative of variable population change. Information regarding population trends can be found in Table 1. In a survey conducted by the Alaska Fisheries Science Center (AFSC) in 2011, community leaders reported that there were 628 permanent residents living in Yakutat in 2010, according to an April 2010 comprehensive plan. In addition, there were an estimated 200 seasonal or transient workers living in the community that year. On average, seasonal workers live in Yakutat from mid-May through mid-September. The population of Yakutat reaches its annual peak between July and September and is mostly driven by employment in fisheries sectors. Yakutat’s racial and ethnic composition is a mix of White, Tlingit, and Athabascan influences. In 2010, 42.4% of residents identified themselves as White, compared to 41.5% in 2000; 35.8% identified themselves as American Indian or Alaska Native, compared to 47.1% in 2000; 15.4% identified themselves as two or more races, compared to 9.0% in 2000; 4.1% identified themselves as Asian, compared to 1.5% in 2000; and 1.8% identified themselves as Native Hawaiian or Other Pacific Islander, compared to 0.9% in 2000. Residents who identified themselves as Black, African American, or some other race each made up less than one-percent of the population in 2010. Finally, 2.6% residents identified themselves as Hispanic or Latino in 1 Alaska Dept. of Comm. and Rural Affairs. (n.d.). Community Database Online. Retrieved October 17, 2011 from http://www.commerce.state.ak.us/dca/commdb/CF_BLOCK.htm. 2 U.S. Census Bureau (n.d.). Profile of selected social, economic and housing characteristics of all places within Alaska. Datasets utilized include the 2000 (SF1 100% and SF3 sample data) and 2010 (Demographic Profile SF) Decennial Census and the 2010 American Community Survey 5-year estimates. Retrieved November 1, 2011 from http://factfinder2.census.gov/faces/nav/jsf/pages/index.xhtml.
Transcript
NOAA-TM-AFSC-259 – Volume 11
Community Profiles for North Pacific Fisheries – Alaska: Yakutat
1
Yakutat (YACK-uh-tat)
People and Place
Location 1
Yakutat is isolated among the lowlands along the Gulf of Alaska, 225 miles northwest of
Juneau and 220 miles southeast of Cordova. It is at the mouth of Yakutat Bay, one of the few
refuges for vessels along this stretch of coast. The Hubbard and Malaspina Glaciers are nearby.
Its boundaries are the Canadian border to the north, Cape Suckling to the west, and Cape
Fairweather to the east. Yakutat Borough is within and surrounded by the Tongass National
Forests, Wrangell St-Elias National Park and Preserve, and Glacier Bay National Park and
Preserve. The area encompasses 7,650.5 square miles of land and 1,808.8 square miles of
water. Yakutat was incorporated as a city in 1948, but was dissolved and reorganized into its
own borough in 1992.
Demographic Profile 2
In 2010, there were 662 residents, ranking Yakutat 96th
of 352 Alaskan communities in
terms of population size. Between 1990 and 2010, the population grew by 24.0%. Between 2000
and 2009, the population declined by 10.6% with an average annual growth rate of -0.98%,
which was lower than the statewide average of 0.75% and indicative of variable population
change. Information regarding population trends can be found in Table 1.
In a survey conducted by the Alaska Fisheries Science Center (AFSC) in 2011,
community leaders reported that there were 628 permanent residents living in Yakutat in 2010,
according to an April 2010 comprehensive plan. In addition, there were an estimated 200
seasonal or transient workers living in the community that year. On average, seasonal workers
live in Yakutat from mid-May through mid-September. The population of Yakutat reaches its
annual peak between July and September and is mostly driven by employment in fisheries
sectors.
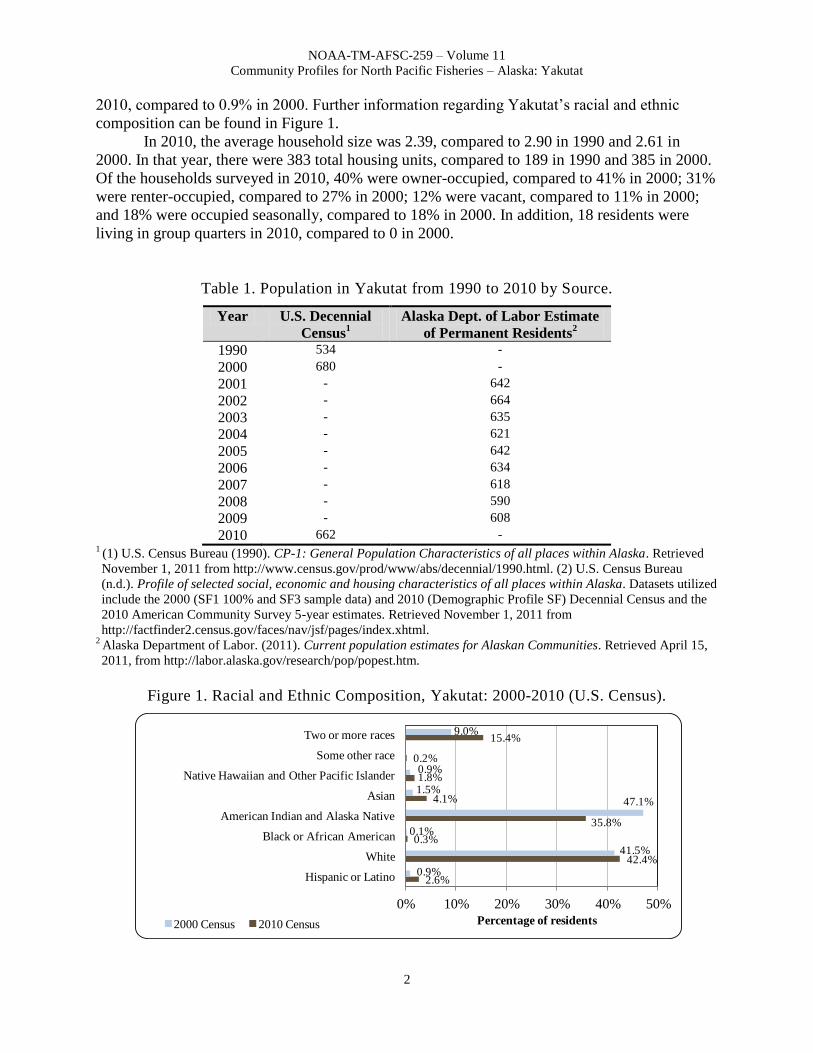
Yakutat’s racial and ethnic composition is a mix of White, Tlingit, and Athabascan
influences. In 2010, 42.4% of residents identified themselves as White, compared to 41.5% in
2000; 35.8% identified themselves as American Indian or Alaska Native, compared to 47.1% in
2000; 15.4% identified themselves as two or more races, compared to 9.0% in 2000; 4.1%
identified themselves as Asian, compared to 1.5% in 2000; and 1.8% identified themselves as
Native Hawaiian or Other Pacific Islander, compared to 0.9% in 2000. Residents who identified
themselves as Black, African American, or some other race each made up less than one-percent
of the population in 2010. Finally, 2.6% residents identified themselves as Hispanic or Latino in
1 Alaska Dept. of Comm. and Rural Affairs. (n.d.). Community Database Online. Retrieved October 17, 2011 from
http://www.commerce.state.ak.us/dca/commdb/CF_BLOCK.htm. 2 U.S. Census Bureau (n.d.). Profile of selected social, economic and housing characteristics of all places within
Alaska. Datasets utilized include the 2000 (SF1 100% and SF3 sample data) and 2010 (Demographic Profile SF)
Decennial Census and the 2010 American Community Survey 5-year estimates. Retrieved November 1, 2011 from
Community Profiles for North Pacific Fisheries – Alaska: Yakutat
2
2010, compared to 0.9% in 2000. Further information regarding Yakutat’s racial and ethnic
composition can be found in Figure 1.
In 2010, the average household size was 2.39, compared to 2.90 in 1990 and 2.61 in
2000. In that year, there were 383 total housing units, compared to 189 in 1990 and 385 in 2000.
Of the households surveyed in 2010, 40% were owner-occupied, compared to 41% in 2000; 31%
were renter-occupied, compared to 27% in 2000; 12% were vacant, compared to 11% in 2000;
and 18% were occupied seasonally, compared to 18% in 2000. In addition, 18 residents were
living in group quarters in 2010, compared to 0 in 2000.
Table 1. Population in Yakutat from 1990 to 2010 by Source.
Year U.S. Decennial
Census1
Alaska Dept. of Labor Estimate
of Permanent Residents2
1990 534 -
2000 680 -
2001 - 642
2002 - 664
2003 - 635
2004 - 621
2005 - 642
2006 - 634
2007 - 618
2008 - 590
2009 - 608
2010 662 - 1 (1) U.S. Census Bureau (1990). CP-1: General Population Characteristics of all places within Alaska. Retrieved
November 1, 2011 from http://www.census.gov/prod/www/abs/decennial/1990.html. (2) U.S. Census Bureau
(n.d.). Profile of selected social, economic and housing characteristics of all places within Alaska. Datasets utilized
include the 2000 (SF1 100% and SF3 sample data) and 2010 (Demographic Profile SF) Decennial Census and the
2010 American Community Survey 5-year estimates. Retrieved November 1, 2011 from
http://factfinder2.census.gov/faces/nav/jsf/pages/index.xhtml. 2 Alaska Department of Labor. (2011). Current population estimates for Alaskan Communities. Retrieved April 15,
2011, from http://labor.alaska.gov/research/pop/popest.htm.
Figure 1. Racial and Ethnic Composition, Yakutat: 2000-2010 (U.S. Census).
2.6%
42.4%
0.3%
35.8%
4.1%
1.8%
0.2%
15.4%
0.9%
41.5%
0.1%
47.1%1.5%
0.9%
9.0%
0% 10% 20% 30% 40% 50%
Hispanic or Latino
White
Black or African American
American Indian and Alaska Native
Asian
Native Hawaiian and Other Pacific Islander
Some other race
Two or more races
Percentage of residents2000 Census 2010 Census
NOAA-TM-AFSC-259 – Volume 11
Community Profiles for North Pacific Fisheries – Alaska: Yakutat
3
Figure 2. Population Age Structure in Yakutat Based on the 2000 and 2010 U.S. Decennial
Census.
Gender distribution in 2010 was somewhat skewed at 54.4% male and 45.6% female.
This was more skewed than the distribution statewide (52.0% male, 48.0% female) and similar to
the distribution in 2000 (54.0% male, 46.0% female). The median age that year was 39.7 years,
which was somewhat older than both the statewide median of 33.8 years and 2000 median of
35.2 years.
Compared with 2000, the population structure was more stationary in 2010. In addition,
cohorts showed age transitions consistent with a stable population, meaning that as many cohorts
retained their overall structure as they aged. In 2010, 26.6% of residents were under the age of
20, compared to 33.5% in 2000; 16.7% were over the age of 59, compared to 8.9% in 2000;
45.3% were between the ages of 30 and 59, compared to 49.0% in 2000; and 11.5% were
between the ages of 20 and 29, compared to 8.4% in 2000.
Gender distribution by age cohort was less even in 2010 than in 2000, showing male
biases along most age ranges. The greatest absolute gender difference occurred in the 50 to 59
range (10.7% male, 6.5% female), followed by the 40 to 49 (9.5% male, 6.2% female) and 80
and over range (1.6% female, 0.2% male). Of those three, the greatest relative difference
occurred in the 80 and over range. Further information regarding Yakutat’s population structure
can be found in Figure 2.
5.9%
7.1%
6.5%
6.8%
9.5%
10.7%
5.8%
2.0%
0.2%
6.5%
7.1%
5.0%
5.6%
6.2%
6.5%
4.7%
2.4%
1.6%
15% 10% 5% 0% 5% 10% 15%
0 to 9
10 to 19
20 to 29
30 to 39
40 to 49
50 to 59
60 to 69
70 to 79
80 and over
Percentage of community residents
Ag
e g
rou
p
2010 Population Structure
Female
Male
8.1%
9.7%
4.1%
9.1%
11.9%
6.2%
2.8%
1.9%
0.1%
7.8%
7.9%
4.3%
8.2%
8.5%
5.1%
2.5%
1.6%
15% 10% 5% 0% 5% 10% 15%
0 to 9
10 to 19
20 to 29
30 to 39
40 to 49
50 to 59
60 to 69
70 to 79
80 and over
Percentage of community residents
Age
gro
up
2000 Population Structure
Female
Male
NOAA-TM-AFSC-259 – Volume 11
Community Profiles for North Pacific Fisheries – Alaska: Yakutat
4
In terms of educational attainment, the U.S. Census’ 2006-2010 American Community
Survey (ACS)3 estimated that 92.4% of residents aged 25 and older held a high school diploma
or higher degree, compared to an estimated 90.7% of Alaskan residents overall. Also in that year,
an estimated 4.5% of residents had less than a 9th
grade education, compared to an estimated
3.5% of Alaskan residents overall; an estimated 3.1% had a 9th
to 12th
grade education but no
diploma, compared to an estimated 5.8% of Alaskan residents overall; an estimated 32.7% had
some college but no degree, compared to an estimated 28.3% of Alaskan residents overall; an
estimated 9.4% held an Associate’s degree, compared to an estimated 8.0% of Alaskan residents
overall; an estimated 13.6% held a Bachelor’s degree, compared to an estimated 17.4% of
Alaskan residents overall; and an estimated 4.7% held a graduate or professional degree,
compared to an estimated 9.6% of Alaskan residents overall.
History, Traditional Knowledge, and Culture4
Before European and Russian contact, the Alaska Native cultures in the area traded
copper, furs, tanned skins with the Ahtna and Tutchone Athabaskans for shells, slaves, Haida
canoes, and Tsimshian carvings. People in the Yakutat area later acted as middlemen, handling
goods from Russian posts around Prince William Sound (PWS) and Sitka. Trading was also
conducted with the Hudson’s Bay Company and other fur traders.
Traditionally, there was a mix of Alaska Native cultures and languages in the area,
including Athabaskan, Eyak, and inland and coastal Tlingit. It is not known when the first Native
peoples moved to the Yakutat area, although archaeological and oral histories show evidence of
a local group distinct from interior Athabaskans. Some of the earliest archeological sites at
Ground Hog Bay and Hidden Falls (both located south of the Malaspina Forelands), have been
assigned to the Paleomarine tradition, which dates from around 8,000 years ago. Early
settlements in the area were scattered along the Gulf of Alaska (GOA) between Yakutat Bay and
Dry Bay.
In the late 1700s Russian explorers first came to the area and recorded information about
the Native people they met. Then, there were two distinct divisions: the Dry Bay people and the
Yakutat Bay people. The Yakutat Bay people were a mix of Eyak and Atna Athabaskans from
the Copper River Valley. Groups in the area were connected through trading, conflict, potlatches,
and intermarriage.
According to oral histories, at least one contact between the people of Yakutat and
Europeans occurred before the first recorded Russian contact. However, the first recorded
contact occurred in 1783 when Potap Zaikov led a Russian exploring party into PWS and
Controller Bay, with several hundred Aleuts. In 1793, the Russians sent a party of Aleut otter
hunters to Yakutat and in 1796, the Russian Fort Nova Rossiysk was built between the Ankau
Lagoons and the GOA coast. In 1800, a second post was built around Monti Bay.
The Russian fort at Yakutat was never a success. During the first winter of occupation,
thirteen hunters and seven settlers (not including women and children) died of scurvy.
3 While American Community Survey (ACS) estimates can provide a good snapshot estimate for larger populations,
smaller populations can be misrepresented by ACS estimates if demographic information is not collected from a
representative sample of the population. This is especially problematic for Alaskan communities with small
populations that have a low probability of being adequately sampled. 4 City of Yakutat & Sheinberg Associates (2010). City and Borough of Yakutat Comprehensive Plan. Retrieved May
Alaska Department of Environmental Conservation. (n.d.). Contaminated Sites Program. Retrieved May 17, 2012
from http://dec.alaska.gov/spar/csp/list.htm#Southeast. 16
Unless otherwise noted, all monetary data are reported in nominal values. 17
See footnote 5.
NOAA-TM-AFSC-259 – Volume 11
Community Profiles for North Pacific Fisheries – Alaska: Yakutat
8
on fishing, sportfishing, and hunting. Top employers18
in 2010 included Yakutat Tlingit Tribe,
City and Borough of Yakutat, Yakutat School District, Yakutat Seafoods LLC, Mallott’s General
Store Inc., State of Alaska, AK Commercial Co., Glacier Bear Lodge Inc., Yakutat Tlingit Tribe
Non-profit, and Alaska Airlines Inc. Yakutat’s economy is less diversified than the state as a
whole. Strong employment sectors include government, manufacturing, commercial fishing, and
seafood processing. Yakutat has significantly fewer jobs in professional, education and health
service sectors than the statewide average. Employment remains largely seasonal in nature. In
2008, the number of jobs almost doubled in the summer.19
Tourism is important to Yakutat, and the Borough offers a wide variety of recreational
and tourism opportunities including rafting trips, sportfishing, surfing, and cruise trips. There are
many seasonally operated tourism support businesses in Yakutat including flying services,
restaurants, fuel sales, and retail stores. In 2010, there were 41 businesses within the Yakutat
Borough that provided lodging of some type. Of those businesses, 27 were located in the
community and 14 elsewhere in the Borough. Cruise ships travel along the coast and into
Yakutat and Disenchantment Bay and occasionally Icy Bay. However, the number of cruise
ships visiting the area dropped from 41 in 2008 to 16 in 2010.20
Large scale mineral and timber industries have had relatively little interest in Yakutat
because of depressed market conditions. However, these industries have the potential to become
more dominant if market conditions or technology improves. Various placer mineral deposits on
Yakutat beaches provide opportunities for small-scale prospecting. In addition, small-scale
timber harvesting has wide local support.21
According to the 2006-2010 ACS,22
the estimated per capita income was $28,782 and the
estimated median household income was $72,813, compared to $21,330 and $47,054 in 2000,
respectively. However, after adjusting for inflation by converting 2000 values to 2010 dollars,23
the real per capita income ($28,049) and real median household income ($61,875) indicate that
increases in both individual and household earnings. In 2010, Yakutat ranked 69th
of 305
communities from which per capita income was estimated, and 39th
of 299 communities from
which median household income was estimated.
However, Yakutat’s small population size may have prevented the ACS from accurately
portraying economic conditions.24
Another understanding of per capita income is obtained
through economic data compiled by the Alaska Local and Regional Information (ALARI)
database maintained by the Alaska Department of Labor and Workforce Development
(DOLWD). According to the ALARI database, there was $7.68 million in wages earned by
18
Alaska Department of Labor and Workforce Development (n.d.). Alaska Local and Regional Information
Database. Retrieved April 23, 2012 from http://live.laborstats.alaska.gov/alari/. 19
See footnote 11. 20
Ibid. 21
Ibid. 22
U.S. Census Bureau (n.d.). Profile of selected social, economic and housing characteristics of all places within
Alaska. Datasets utilized include the 2010 American Community Survey 5-year estimates. Retrieved November 1,
2011 from http://factfinder2.census.gov/faces/nav/jsf/pages/index.xhtml. 23
Inflation was calculated using the Anchorage Consumer Price Index for 2000 and 2010 (retrieved January 5, 2012
from the Alaska Department of Labor, http://labor.alaska.gove/research/cpi/inflationcalc.htm). 24
While American Community Survey (ACS) estimates can provide a good snapshot estimate for larger
populations, smaller populations can be misrepresented by ACS estimates if demographic information is not
collected from a representative sample of the population. This is especially problematic for Alaskan communities
with small populations that have a low probability of being adequately sampled.
NOAA-TM-AFSC-259 – Volume 11
Community Profiles for North Pacific Fisheries – Alaska: Yakutat
9
Yakutat residents in 2010,25
resulting in a per capita income of $11,598, when compared against
2010 Census population figures.26
Overall, comparative differences between ACS and ALARI
estimates indicate a significantly lower per capita income than was reported in both 2000 and
2010. In addition, it should be noted that Yakutat was not considered “distressed” by the Denali
Commission meaning that less than 30% of residents 16 years old and over earned less than
$16,120 in 2010.27
According to 2006-2010 ACS estimates,28
75.4% of residents aged 16 and older were
part of the civilian labor force. Between 2006 and 2010, unemployment was estimated at 2.8%,
compared to an estimated 5.9% statewide; and an estimated 4.3% of residents lived below the
poverty line, compared to an estimated 9.5% of Alaskan residents overall. Of those employed in
2010, an estimated 41.2% worked in the private sector, an estimated 47.4% worked in the public
sector, and an estimated 11.4% were self-employed.
By industry, most (27.8%) employed residents were estimated to work in public
administration sectors in 2010; followed by education services, health care, and social assistance
sectors (14.7%); and agriculture, forestry, fishing, hunting, and mining sectors (11.8%) (Figure
3). By occupation type, most (36.3%) employed residents were estimated to hold management or
professional positions; followed by sales or office positions (22.2%); service positions (16.7%);
natural resources, construction, or maintenance positions (14.7%); and production,
transportation, or material moving positions (10.1%) (Figure 4). Overall, there was a significant
drop in the proportion of residents estimated to be working in agriculture, forestry, fishing,
hunting, and mining sectors; while there was a significant increase in the proportion of residents
working in public administration sectors. This could be attributed to the closure of the Icy Bay
logging camp.
By comparison, the ALARI database estimated that in 2010, most (40.2%) employed
residents worked in local government sectors; followed by trade, transportation, and utilities
sectors (18.1%); and leisure and hospitality sectors (14.3%). In that year, only an estimated 0.3%
of residents worked in natural resources and mining sectors. However, this number may not
accurately portray conditions since self-employed residents or residents who reported other
professions as their principal employer may not have been represented in ALARI estimates. In
addition, the seasonality of many fisheries sectors may have prevented the ACS from accurately
representing the local fishing economy.
25
ALARI estimates based on wages reported for unemployment insurance purposes. Estimates do not include self-
employed or federally employed residents. 26
See footnote 18. 27
Denali Commission. (2011). Distressed Community Criteria 2011 Update. Retrieved April 16, 2012 from:
www.denali.gov. 28
See footnote 24.
NOAA-TM-AFSC-259 – Volume 11
Community Profiles for North Pacific Fisheries – Alaska: Yakutat
10
Figure 3. Local Employment by Industry in 2000-2010, Yakutat (U.S. Census).
Figure 4. Local Employment by Occupation in 2000-2010, Yakutat (U.S. Census).
Governance
Yakutat is a City located within its own borough. In addition, there is a BIA recognized
tribal council and Yak-Tat Kwaan Incorporated is the local ANCSA chartered Native village
corporation. Sealaska Inc. is the regional ANCSA chartered Native corporation. There is an
ADF&G office located in Yakutat. The closest National Marine Fisheries Service (NMFS) and
U.S. Bureau of Citizenship and Immigration Services offices are located in Juneau, 225 miles to
the southeast.
30.9%
7.3%
5.7%
4.8%
14.5%
1.1%
2.0%
14.1%
9.8%
3.0%
6.8%
11.8%
1.6%
3.6%
4.2%
8.5%
8.5%
0.7%
5.9%
3.9%
14.7%
6.9%
2.0%
27.8%
0% 10% 20% 30% 40%
Agricul./forestry/fishing/hunting/mining
Construction
Manufacturing
Wholesale trade
Retail trade
Transpor/warehousing/utilities
Information
Finance/insurance/real estate
Profess/scientific/mgmt/ admin/waste mgmt
Educ. services, health care, social assist.
Arts/entertain/recreation/accommod/food services
Other services, except public administration
Public administration
Percentage of residents
2006-10 American Community Survey 2000 Census
26.6%
12.5%
15.2%
33.2%
12.5%
36.3%
16.7%
22.2%
14.7%
10.1%
0% 10% 20% 30% 40%
Management/professional
Service
Sales/office
Natural resources/construction/maintenance
Production/transportation/ material moving
Percentage of residents2006-10 American Community Survey 2000 Census
NOAA-TM-AFSC-259 – Volume 11
Community Profiles for North Pacific Fisheries – Alaska: Yakutat
11
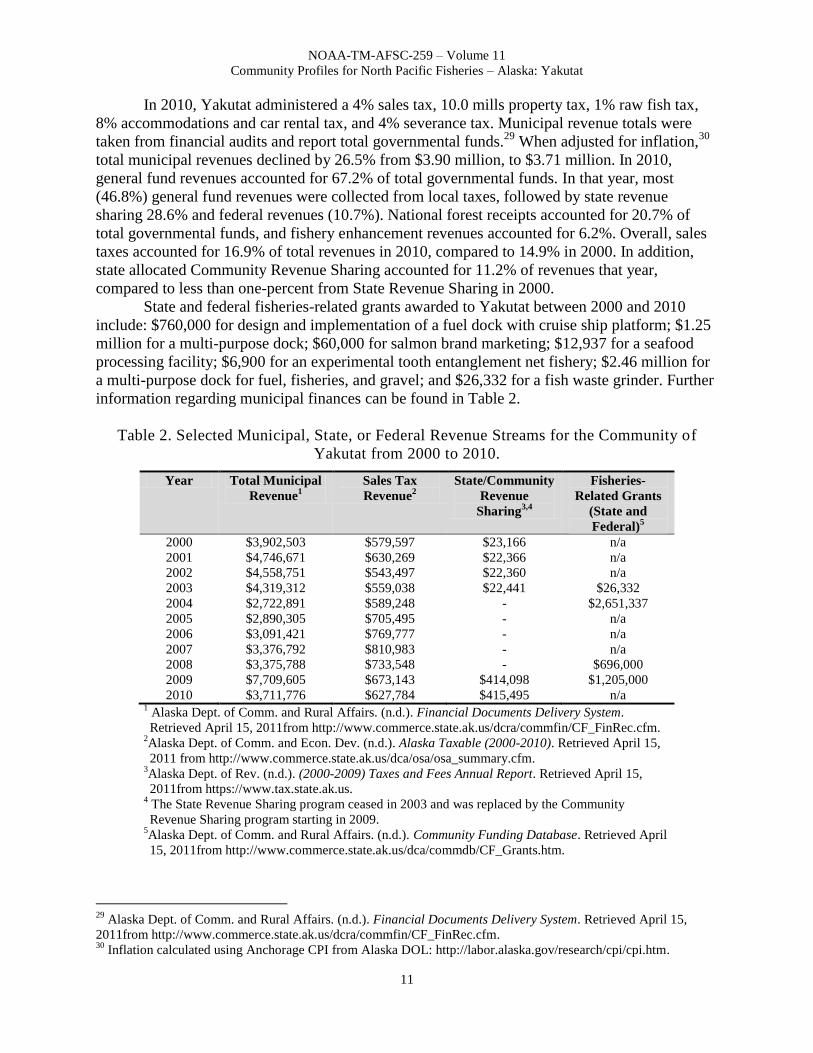
In 2010, Yakutat administered a 4% sales tax, 10.0 mills property tax, 1% raw fish tax,
8% accommodations and car rental tax, and 4% severance tax. Municipal revenue totals were
taken from financial audits and report total governmental funds.29
When adjusted for inflation,30
total municipal revenues declined by 26.5% from $3.90 million, to $3.71 million. In 2010,
general fund revenues accounted for 67.2% of total governmental funds. In that year, most
(46.8%) general fund revenues were collected from local taxes, followed by state revenue
sharing 28.6% and federal revenues (10.7%). National forest receipts accounted for 20.7% of
total governmental funds, and fishery enhancement revenues accounted for 6.2%. Overall, sales
taxes accounted for 16.9% of total revenues in 2010, compared to 14.9% in 2000. In addition,
state allocated Community Revenue Sharing accounted for 11.2% of revenues that year,
compared to less than one-percent from State Revenue Sharing in 2000.
State and federal fisheries-related grants awarded to Yakutat between 2000 and 2010
include: $760,000 for design and implementation of a fuel dock with cruise ship platform; $1.25
million for a multi-purpose dock; $60,000 for salmon brand marketing; $12,937 for a seafood
processing facility; $6,900 for an experimental tooth entanglement net fishery; $2.46 million for
a multi-purpose dock for fuel, fisheries, and gravel; and $26,332 for a fish waste grinder. Further
information regarding municipal finances can be found in Table 2.
Table 2. Selected Municipal, State, or Federal Revenue Streams for the Community of
Yakutat from 2000 to 2010.
Year Total Municipal
Revenue1
Sales Tax
Revenue2
State/Community
Revenue
Sharing3,4
Fisheries-
Related Grants
(State and
Federal)5
2000 $3,902,503 $579,597 $23,166 n/a
2001 $4,746,671 $630,269 $22,366 n/a
2002 $4,558,751 $543,497 $22,360 n/a
2003 $4,319,312 $559,038 $22,441 $26,332
2004 $2,722,891 $589,248 - $2,651,337
2005 $2,890,305 $705,495 - n/a
2006 $3,091,421 $769,777 - n/a
2007 $3,376,792 $810,983 - n/a
2008 $3,375,788 $733,548 - $696,000
2009 $7,709,605 $673,143 $414,098 $1,205,000
2010 $3,711,776 $627,784 $415,495 n/a 1 Alaska Dept. of Comm. and Rural Affairs. (n.d.). Financial Documents Delivery System.
Retrieved April 15, 2011from http://www.commerce.state.ak.us/dcra/commfin/CF_FinRec.cfm. 2Alaska Dept. of Comm. and Econ. Dev. (n.d.). Alaska Taxable (2000-2010). Retrieved April 15,
2011 from http://www.commerce.state.ak.us/dca/osa/osa_summary.cfm. 3Alaska Dept. of Rev. (n.d.). (2000-2009) Taxes and Fees Annual Report. Retrieved April 15,
2011from https://www.tax.state.ak.us. 4 The State Revenue Sharing program ceased in 2003 and was replaced by the Community
Revenue Sharing program starting in 2009. 5Alaska Dept. of Comm. and Rural Affairs. (n.d.). Community Funding Database. Retrieved April
Total fisheries-related revenue4 $451,615 $486,244 $450,606 $279,553 $240,848 $277,288 $3.01 M $262,898 $339,228 $314,969 $276,890
Total municipal revenue5 $3.90 M $4.75 M $4.56 M $4.32 M $2.72 M $2.89 M $3.10 M $3.38 M $3.38 M $7.71 M $3.71 M
Note: n/a indicates that no data were reported for that year. 1 Alaska Dept. of Comm. and Econ. Dev. (n.d.) Alaska Taxable (2000-2010). Retrieved April 15, 2011 from
http://www.commerce.state.ak.us/dca/osa/osa_summary.cfm. 2 Alaska Dept. of Comm. and Rural Affairs. (n.d.) Financial Documents Delivery System. Retrieved April 15, 2011 at
http://www.commerce.state.ak.us/dcra/commfin/CF_FinRec.cfm. 3 Reported by community leaders in a survey conducted by the AFSC in 2011.
4 Total fisheries related revenue represents a sum of all known revenue sources in the previous rows.
5 Total municipal revenue represents the total revenue that the city reports each year in its municipal budget. Alaska Dept. of Comm. and Rural Affairs. (n.d.)
Financial Documents Delivery System. Retrieved April 15, 2011 at http://www.commerce.state.ak.us/dcra/commfin/CF_FinRec.cfm.
NOAA-TM-AFSC-259 – Volume 11
Community Profiles for North Pacific Fisheries – Alaska: Yakutat
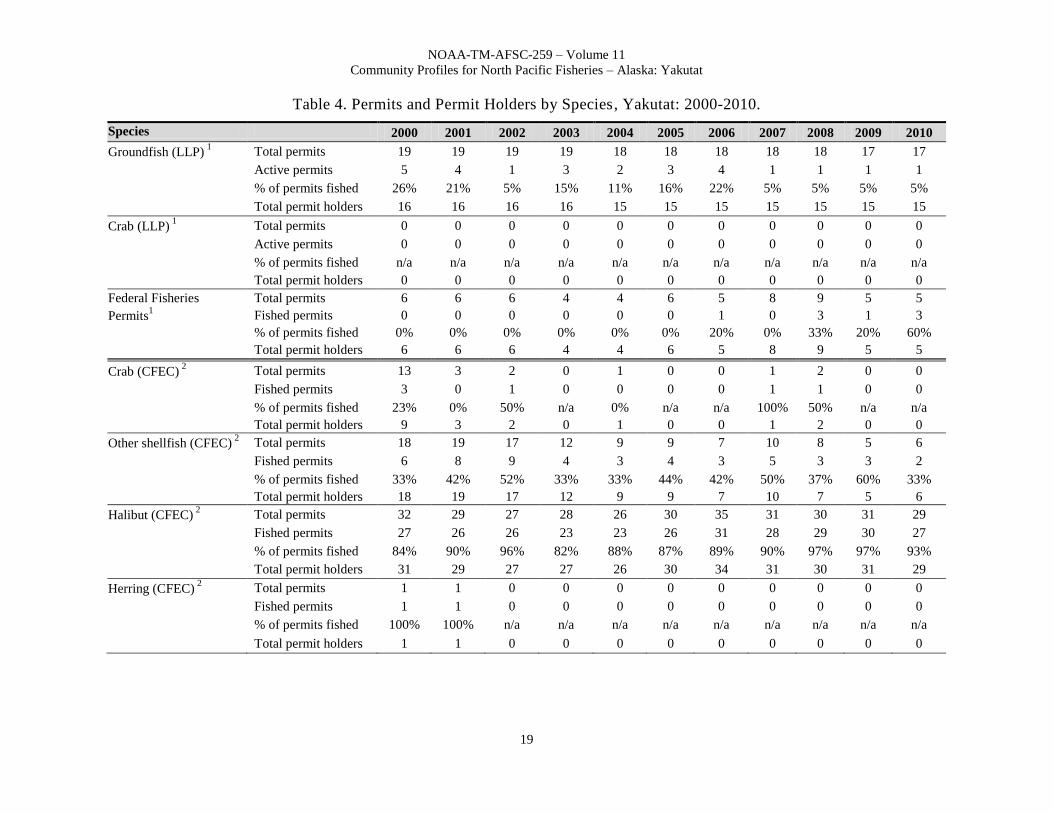
19
Table 4. Permits and Permit Holders by Species, Yakutat: 2000-2010.
Permit holders 201 203 187 202 191 196 192 200 198 189 192 1 National Marine Fisheries Service. 2011. Data on License Limitation Program, Alaska Federal Processor Permits (FPP), Federal Fisheries Permits (FFP), and
Permit holders. NMFS Alaska Regional Office. Data compiled by Alaska Fisheries Information Network for Alaska Fisheries Science Center, Seattle. [URL
not publicly available as some information is confidential.] 2 Alaska Commercial Fisheries Entry Commission. 2011. Alaska commercial fishing permits, permit holders, and vessel licenses, 2000 – 2010. Data compiled
by Alaska Fisheries Information Network for Alaska Fisheries Science Center, Seattle. [URL not publicly available as some information is confidential.]
NOAA-TM-AFSC-259 – Volume 11
Community Profiles for North Pacific Fisheries – Alaska: Yakutat
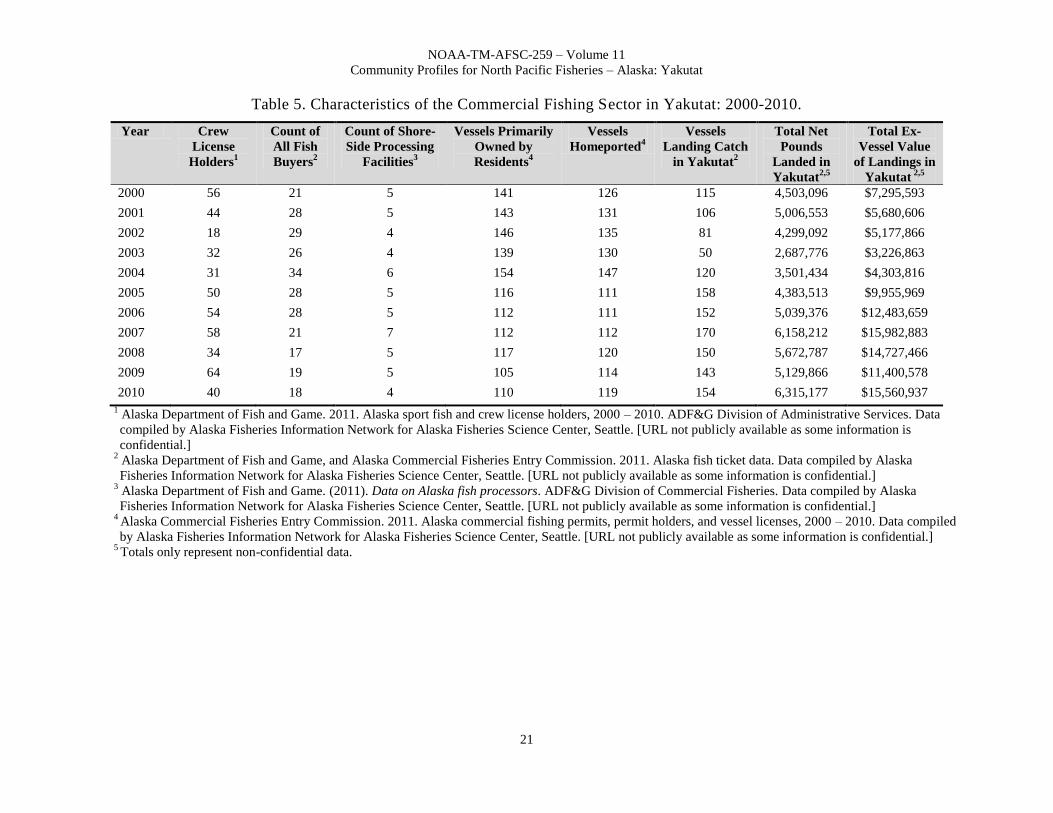
21
Table 5. Characteristics of the Commercial Fishing Sector in Yakutat: 2000-2010.
Year Crew
License
Holders1
Count of
All Fish
Buyers2
Count of Shore-
Side Processing
Facilities3
Vessels Primarily
Owned by
Residents4
Vessels
Homeported4
Vessels
Landing Catch
in Yakutat2
Total Net
Pounds
Landed in
Yakutat2,5
Total Ex-
Vessel Value
of Landings in
Yakutat 2,5
2000 56 21 5 141 126 115 4,503,096 $7,295,593
2001 44 28 5 143 131 106 5,006,553 $5,680,606
2002 18 29 4 146 135 81 4,299,092 $5,177,866
2003 32 26 4 139 130 50 2,687,776 $3,226,863
2004 31 34 6 154 147 120 3,501,434 $4,303,816
2005 50 28 5 116 111 158 4,383,513 $9,955,969
2006 54 28 5 112 111 152 5,039,376 $12,483,659
2007 58 21 7 112 112 170 6,158,212 $15,982,883
2008 34 17 5 117 120 150 5,672,787 $14,727,466
2009 64 19 5 105 114 143 5,129,866 $11,400,578
2010 40 18 4 110 119 154 6,315,177 $15,560,937
1 Alaska Department of Fish and Game. 2011. Alaska sport fish and crew license holders, 2000 – 2010. ADF&G Division of Administrative Services. Data
compiled by Alaska Fisheries Information Network for Alaska Fisheries Science Center, Seattle. [URL not publicly available as some information is
confidential.] 2 Alaska Department of Fish and Game, and Alaska Commercial Fisheries Entry Commission. 2011. Alaska fish ticket data. Data compiled by Alaska
Fisheries Information Network for Alaska Fisheries Science Center, Seattle. [URL not publicly available as some information is confidential.] 3 Alaska Department of Fish and Game. (2011). Data on Alaska fish processors. ADF&G Division of Commercial Fisheries. Data compiled by Alaska
Fisheries Information Network for Alaska Fisheries Science Center, Seattle. [URL not publicly available as some information is confidential.] 4 Alaska Commercial Fisheries Entry Commission. 2011. Alaska commercial fishing permits, permit holders, and vessel licenses, 2000 – 2010. Data compiled
by Alaska Fisheries Information Network for Alaska Fisheries Science Center, Seattle. [URL not publicly available as some information is confidential.] 5 Totals only represent non-confidential data.
NOAA-TM-AFSC-259 – Volume 11
Community Profiles for North Pacific Fisheries – Alaska: Yakutat
22
Table 6. Halibut Catch Share Program Participation by Residents of Yakutat: 2000-2010.
Note: Cells showing – indicate that the data are considered confidential.
Source: Alaska Department of Fish and Game, and Alaska Commercial Fisheries Entry Commission. 2011. Alaska fish ticket data. Data compiled by Alaska
Fisheries Information Network for Alaska Fisheries Science Center, Seattle. [URL not publicly available as some information is confidential.] 1 Net pounds refers to the landed weight recorded in fish tickets.
2 Totals only represent non-confidential data.
NOAA-TM-AFSC-259 – Volume 11
Community Profiles for North Pacific Fisheries – Alaska: Yakutat
24
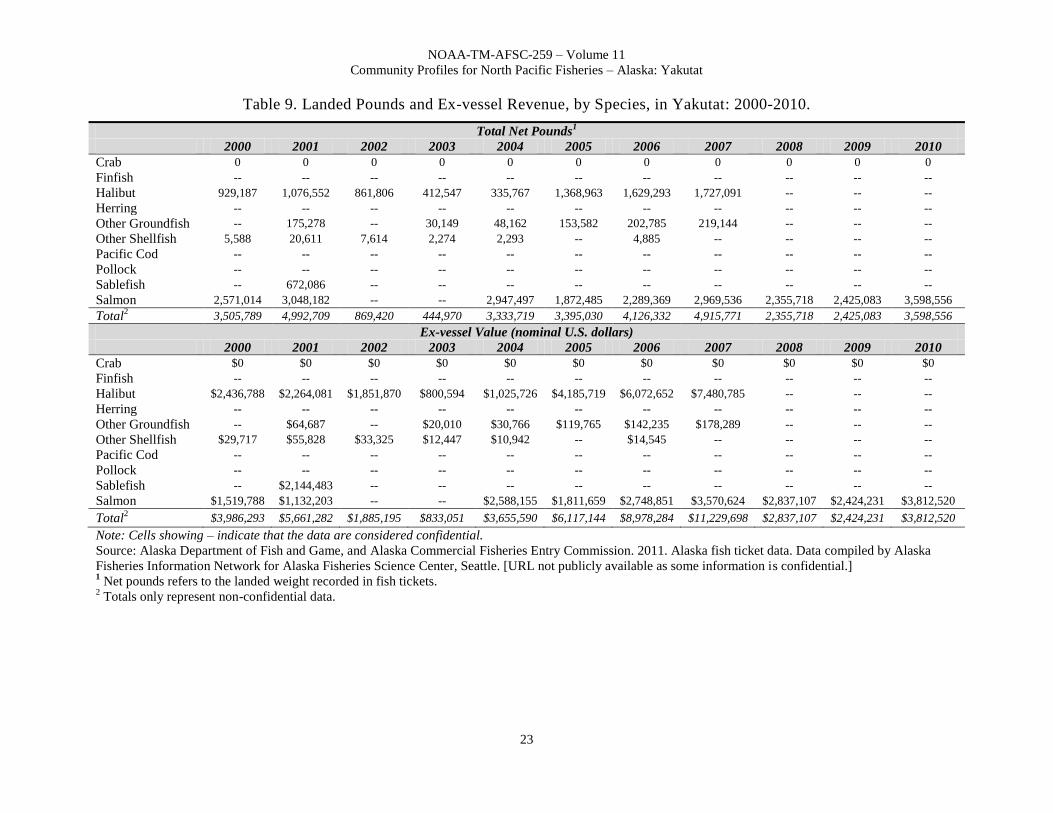
Table 10. Landed Pounds and Ex-vessel Revenue, by Species, by Yakutat Residents: 2000-2010.
Note: Cells showing – indicate that the data are considered confidential.
Source: Alaska Department of Fish and Game, and Alaska Commercial Fisheries Entry Commission. 2011. Alaska fish ticket data. Data compiled by Alaska
Fisheries Information Network for Alaska Fisheries Science Center, Seattle. [URL not publicly available as some information is confidential.] 1 Net pounds refers to the landed weight recorded in fish tickets.
2 Totals only represent non-confidential data.
NOAA-TM-AFSC-259 – Volume 11
Community Profiles for North Pacific Fisheries – Alaska: Yakutat
25
Recreational Fishing
Freshwater sportfishing in the Yakutat area provides a foundation for the local tourism
economy. In town there are several lodges that offer guided sportfishing trips. In addition, there
is a lodge located in Icy Bay and seven located around the Tsiu River area. Collectively these
businesses generate an estimated $1.5 million in annual revenue. Fishing activities are largely
focused on the Alsek, East, Akwe, Italio, Dangerous, Antlen, Ahrnklin, Situk, Tsiu, Tsivat,
Kaliakh, and Kiklukh River drainages, where rainbow (steelhead) trout and salmon fishing runs
occur from spring through fall.59
In a survey conducted by the AFSC in 2011, community leaders
reported that local private anglers target Chinook and coho salmon, rockfish, halibut, shrimp, and
clams.
In 2010, there were 7 registered sport fish guide businesses active and residents held 28
sport fish guide licenses, compared to 23 and 32 in 2000, respectively. Also in that year,
residents were sold 231 sportfishing licenses and 2,048 were sold in the community, compared to
326 and 2,557 in 2000, respectively.
Yakutat is located within the Yakutat ADF&G Harvest Survey Area which includes all
state waters, including drainages, from but no including, Cape Suckling to and including Cape
Fairweather. In 2010, there was a total of 9,015 saltwater and 25,550 freshwater angler days
fished, compared to 7,462 and 22,747 in 2000, respectively. In that year, non-Alaskan residents
accounted for 88.8% of saltwater and 83.2% of freshwater angler days fished, compared to
73.8% and 79.3% in 2000, respectively.
According to ADF&G Harvest Survey data,60
local private anglers target Chinook, coho,
sockeye, and pink salmon, rainbow and cutthroat trout, halibut, rockfish, lingcod, Dungeness
crab, hardshell clams, and shrimp. According to 2010 Charter Logbook records, charter vessels
Note: n/a indicates that no data were reported for that year. 1 Fall, J.A., C. Brown, N. Braem, J.J. Simon, W.E. Simeone, D.L. Holen, L. Naves, L. Hutchinson-Scarborough, T. Lemons, and
T.M. Krieg. 2011, revised. Alaska subsistence salmon fisheries 2008 annual report. Alaska Department of Fish and Game
Division of Subsistence, Technical Paper No. 359, Anchorage. Data compiled by Alaska Fisheries Information Network for
Alaska Fisheries Science Center, Seattle. 2 Alaska Department of Fish and Game. 2011. Community Subsistence Information System (CSIS). ADF&G Division of
Subsistence. Data compiled by Alaska Fisheries Information Network for Alaska Fisheries Science Center, Seattle.
http://www.adfg.alaska.gov/sb/CSIS/ (Accessed February 2011).
NOAA-TM-AFSC-259 – Volume 11
Community Profiles for North Pacific Fisheries – Alaska: Yakutat
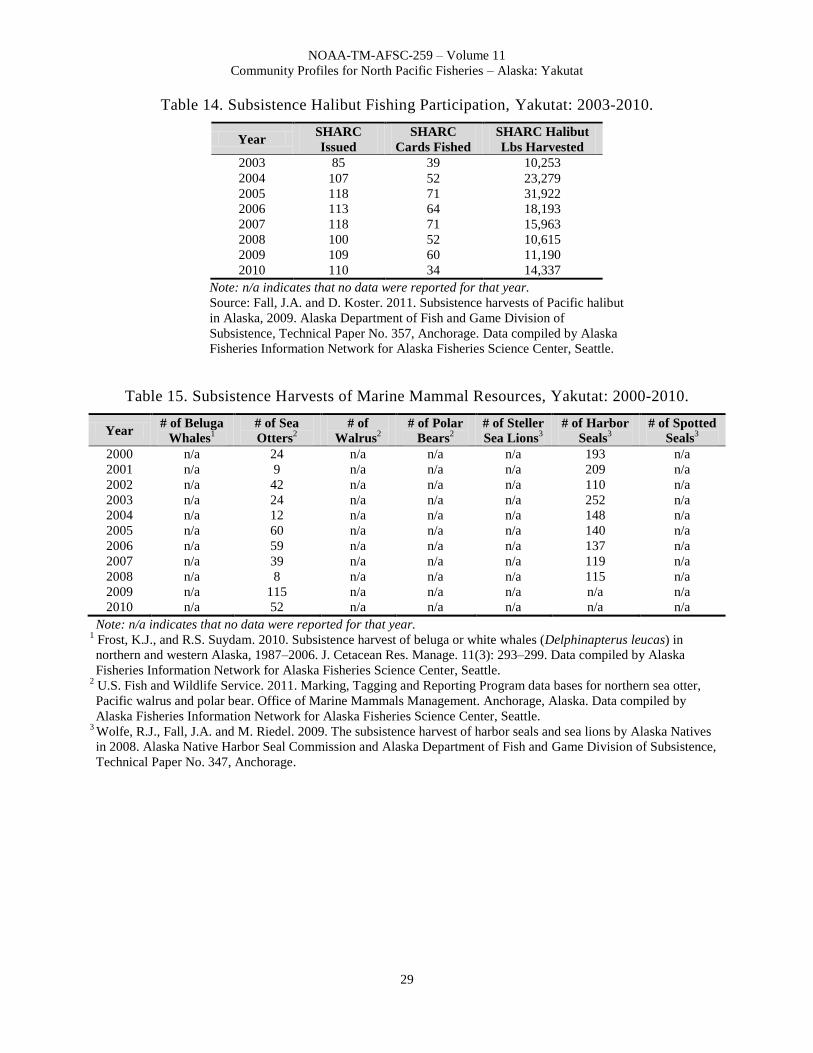
Note: n/a indicates that no data were reported for that year.
Source: Fall, J.A. and D. Koster. 2011. Subsistence harvests of Pacific halibut
in Alaska, 2009. Alaska Department of Fish and Game Division of
Subsistence, Technical Paper No. 357, Anchorage. Data compiled by Alaska
Fisheries Information Network for Alaska Fisheries Science Center, Seattle.
Table 15. Subsistence Harvests of Marine Mammal Resources, Yakutat: 2000-2010.
Year # of Beluga
Whales1
# of Sea
Otters2
# of
Walrus2
# of Polar
Bears2
# of Steller
Sea Lions3
# of Harbor
Seals3
# of Spotted
Seals3
2000 n/a 24 n/a n/a n/a 193 n/a
2001 n/a 9 n/a n/a n/a 209 n/a
2002 n/a 42 n/a n/a n/a 110 n/a
2003 n/a 24 n/a n/a n/a 252 n/a
2004 n/a 12 n/a n/a n/a 148 n/a
2005 n/a 60 n/a n/a n/a 140 n/a
2006 n/a 59 n/a n/a n/a 137 n/a
2007 n/a 39 n/a n/a n/a 119 n/a
2008 n/a 8 n/a n/a n/a 115 n/a
2009 n/a 115 n/a n/a n/a n/a n/a
2010 n/a 52 n/a n/a n/a n/a n/a
Note: n/a indicates that no data were reported for that year. 1 Frost, K.J., and R.S. Suydam. 2010. Subsistence harvest of beluga or white whales (Delphinapterus leucas) in
northern and western Alaska, 1987–2006. J. Cetacean Res. Manage. 11(3): 293–299. Data compiled by Alaska
Fisheries Information Network for Alaska Fisheries Science Center, Seattle. 2 U.S. Fish and Wildlife Service. 2011. Marking, Tagging and Reporting Program data bases for northern sea otter,
Pacific walrus and polar bear. Office of Marine Mammals Management. Anchorage, Alaska. Data compiled by
Alaska Fisheries Information Network for Alaska Fisheries Science Center, Seattle. 3 Wolfe, R.J., Fall, J.A. and M. Riedel. 2009. The subsistence harvest of harbor seals and sea lions by Alaska Natives
in 2008. Alaska Native Harbor Seal Commission and Alaska Department of Fish and Game Division of Subsistence,