1 Alaska Hydrate Project Overview Methane Hydrate Production from Alaska Permafrost NETL/DOE DE-PS26-01NT41331 Anadarko Petroleum Corporation Maurer Technology Inc. Noble Drilling Corporation Methane Hydrate R&D Conference Westminster, Colorado September 29-30, 2003 Tom Williams, Bill Liddell, & Richard Sigal Outline Project overview, status and highlights to date Overview of operations – Overview of Arctic platform Review future plans Reservoir characterization activities
BackgroundAnadarko Petroleum Corp (APC) Became Aware of DOE Hydrate RFP through Maurer Technology
– Created partnership between Anadarko, Maurer Technology and Noble in 2Q01
– Maurer has excellent contacts within DOE and has worked on numerous DOE contracts
– Noble has been working on novel advanced drilling technology
– APC has acreage and technical expertise
Received Phase I award in 4Q01
– Began assessment of hydrate potential on the North Slope of Alaska
– Began working on Core Lab and Arctic Platform designs
– Began developing well plan for Phase II activity
3
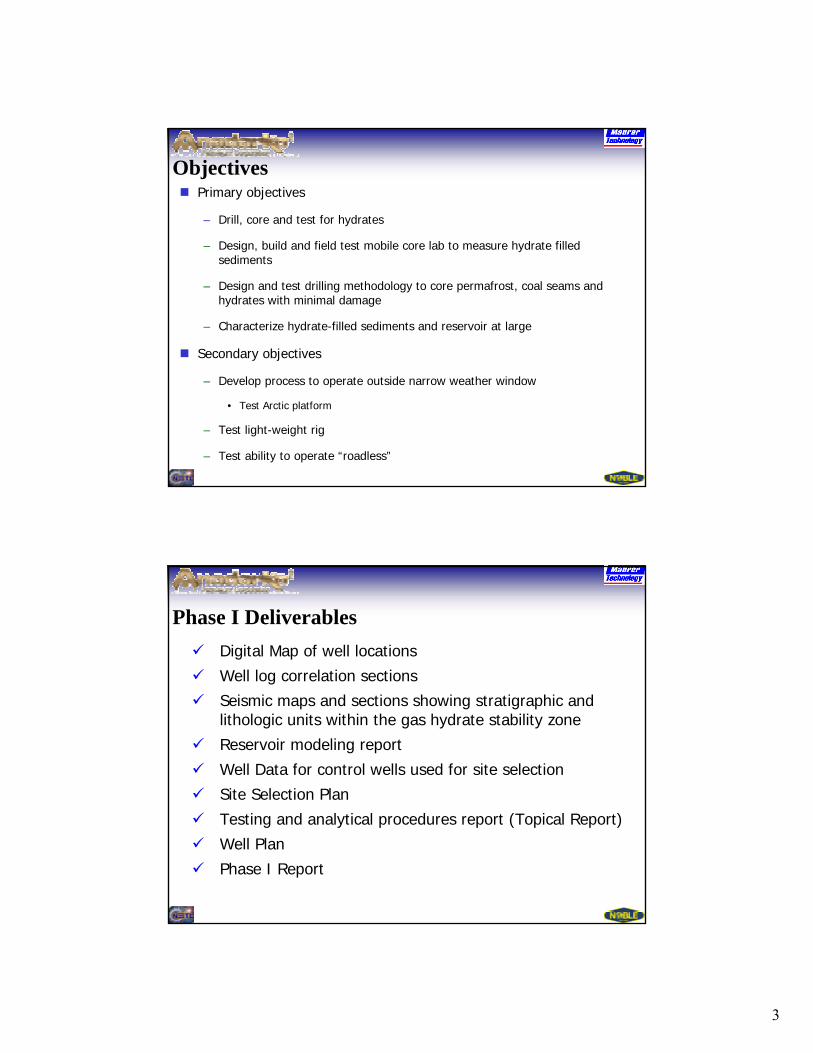
ObjectivesPrimary objectives
– Drill, core and test for hydrates
– Design, build and field test mobile core lab to measure hydrate filled sediments
– Design and test drilling methodology to core permafrost, coal seams and hydrates with minimal damage
– Characterize hydrate-filled sediments and reservoir at large
Secondary objectives
– Develop process to operate outside narrow weather window
• Test Arctic platform
– Test light-weight rig
– Test ability to operate “roadless”
Phase I DeliverablesDigital Map of well locations
Well log correlation sections
Seismic maps and sections showing stratigraphic and lithologic units within the gas hydrate stability zone
Reservoir modeling report
Well Data for control wells used for site selection
Site Selection Plan
Testing and analytical procedures report (Topical Report)
Well Plan
Phase I Report
4
Additional Phase I Achievements Beyond Phase I Contract Obligations
Topical Reports from University of Oklahoma and the Drilling Research Center on Core Apparatus and Testing
Three reports from the University of Alaska Anchorage Geologic Research of Well Records
Water Generated During Production of Gas Hydrates
Permafrost Foundations/Suitability as Tundra Platform Legs
Support of other DOE Hydrate projects including contribution to Westport’s Core Handling Manual
Hydrate Preservation in Cores, Report by George Moridis, LBNL
USGS (Kirby et al) Report on Dissociation of Hydrates at Elevated Pressures
Additional Phase I Achievements Beyond Phase I Contract Obligations
Arctic Platform Video
Numerous News Articles, Presentations and Participation and Publications at Hydrate Meetings and Workshops
Permafrost Data from Cores for Future Study
First Ever N. Slope Coal Cores provided to the USGS for Coalbed Methane Study
5
Phase II Participants
Maurer Technology Inc. – Project Coordination, Project Management, DRC Testing, and Engineering Support.
Anadarko Petroleum Corporation – Overall Project Management for the Design, Construction, and Operation of the Arctic Drilling Platform, the Mobile Core Lab, the Field Coring Operations, Permits, Leases, and Cost Share.
Noble Engineering and Development – Provided Personnel and Real-Time Data Collection and Transmitted Digital Data and Video to Project Participants Located Offsite and Wellsite Drilling Personnel.
Phase II ParticipantsUniversity of Alaska – Supports Studies on Geology, Tundra, and Produced Water Disposal.
Lawrence Berkley National Lab (LBNL) – Reservoir Modeling Used for Well Test Planning and Onsite Portable X-ray Scanner and Wellsite Operator (George Moridis and Barry Friefeld).
Sandia National Lab – Provided Downhole Mud Pressure and Temperature Recording Tool.
Pacific National Lab (PNL) – Provided Portable Infrared Scanner.
United States Geological Survey (USGS) – Provided Synthetic Core for Drilling Tests, Phase Behavior Model for Hydrates, Pressure Vessels for Hydrate Core Storage and Technical Advice. Modeling of Hydrate Preservation and Dissociation (Steve Kirby). Provided Personnel for Coal Core and Analysis.
Schlumberger Oilfield Services – Provided CMR Equipment Used in Mobile Core Lab and Two Onsite Analysts; and Well-Logging Services.
Paulsson Geophysical Services – Scheduled for Vertical Seismic Profiling.
Advisory Board – Craig Woolard, University of Alaska, Anchorage; Steve Bartz, Schlumberger; Steve Kirby, USGS; Tim Collette, USGS; Theresa Imm, Artic Slope Regional Commission; C. Sondergeld, University of Oklahoma; Richard Miller, University of Kansas; and David Young, Baker Hughes Inteq.
6
Phase II DeliverablesDrilling and Coring Report (Task 9.2)Well Logging Report (Task 10.0)Core and Fluid Analysis Report (Task 11.0)Well Completion Report (Task 13.0)Well Testing Report (Task 15.0)Hydrate Reservoir Characterization and Modeling Report (Tasks 17, 18, &19)Post Well Analysis (Task 21)─ Engineering report─ Lessons learned─ Costs vs planned budget─ Successes and failures of field program─ Potential of future hydrate wells on the North Slope─ UAA and UAF to study preserved core and provide summary results
Final Report and Technology Transfer/Website
Project Highlights to DateConcept of early access and early surface occupation has been successfully demonstrated (or, it will be by the end of the Hot Ice project)
Concept of low/minimal/virtually zero negative impact has been demonstrated (or, it will be by the end of the Hot Ice project)
Working concept of the Arctic Platform has been demonstrated. Opportunities for improvement have been noted on this beta version.
Leaving the temporary facility on location, loaded w/ equipment, has been demonstrated with minimum/no impact on surrounding wildlifeand flora (plan to follow-up with a survey next summer.
The facility was successfully operated as a “no discharge facility”
7
The ability to recover frozen core with minimal damage was demonstrated from the minimum footprint rig and platformThe ability to drill/auger the piling holes using a rolligon wassuccessfully demonstrated.
No access roads were required. Ice 'trails' and ice 'work areas' were used to eliminate repetitive low impact environmental stress from low impact vehicles/rolligons and tracked vehicles.
The ability to haul heavier loads by rolligons without negative impact was demonstrated.
The ability to characterize the whole core on site was demonstrated.
The ability to make Petrophysical measurements on core plugs at reservoir conditions was demonstrated.
Development and demonstration on on-site lab.
Live data from North slope to Houston and Washington D.C.
Project Highlights - Continued
Operational Overview
8
Permitted Locations
Hot Ice #1
Drilling ScopeUse Dynatec 1500 UDR slim hole rig
Obtain continuous 3.25” diameter core
Monitor the drilling effort via a live data feed
Control Fluid Temperature (-5 C)/Monitor DH Temperature– Utilize Sandia data logger to provide mud temperature, pressure and
inclination
9
Arctic Platform Overview
Why an Arctic Platform?
─ Flexibility for extended well test
─ Added environmental protection
─ Second well could be drilled quicker and cheaper
─ Extends testing window
Reward– The Alaska North Slope is one of the remaining
areas of North America where major oil and gas fields still can be found
Risk– How to commercially find and develop these
fields
Reward / Risk
10
Historic Response to Challenges
1964 - 1980Conventional Technologies
1980 - 1990
1990 - 2000
2003 - ?The New Challenge
Moving away from the Infra-Structure– Ice roads & pads– Alpine (Island type development)
Advanced Technologies– Gravel roads– Specially designed rigs– Drilling advances
How to expand the time window for exploration from effectively 3 -4 months to 9 months or more
Essentially, how to drill more exploration wells per year and still be cost effective (low finding & development costs, F & D)
How to reduce the evaluation of a discovery from 3 - 5 years to less than one year
How to reduce development costs and remediation costs
…Requires New Thinking and Innovation(A Game Changer)
The New Challenge…
11
Historical Tundra Travel WindowAlaska North Slope
Tundra Travel History
0
50
100
150
200
250
69/7
0
70/7
1
71/7
2
72/7
3
73/7
4
74/7
5
75/7
6
76/7
7
77/7
8
78/7
9
79/8
0
80/8
1
81/8
2
82/8
3
83/8
4
84/8
5
85/8
6
86/8
7
87/8
8
88/8
9
89/9
0
90/9
1
91/9
2
92/9
3
93/9
4
94/9
5
95/9
6
96/9
7
97/9
8
98/9
9
99/0
0
# Da
ys O
pen
0
50
100
150
200
250
Ave
rage
# D
ays
Ope
n
Days Open 10 Yr. Avg. 5 Yr. Avg.
Drilling Location Scouting – Fall 2002
12
Anadarko’s Arctic Platform -- Fast-track Test
June, 2002 through August, 2002 the initial design phase was done
August, 2002 to December, 2002 platform components were built and assembled
Started installing platform January 20th, 2003
Platform installed February 25th, 2003
Spud Hot Ice #1 was on March 31st, 2003
Suspended operations on April 21 due to weather. Plan to resumedrilling and testing operations late 4Q03 or early1Q04
Platform Construction
The movie has been removed as the file is too large.
13
Platform Operations
Setting Support Containers
14
Operations Deck
Communications
15
Operations Deck
Rigging Up
16
Rigging Up
Overhead View
17
Current Status and Jan ’04 Future PlansResume Drilling Operations
– Drill and core through the hydrate stability zone
■ Completion and testing plans
– Perform operations without any accidents or spills
– Prove hydrates can be produced via depressurization
– Obtain well data to calibrate reservoir simulator
Data gathering objectives
– Gather production rate data
– Collect BHP data
– Collect water and gas samples from hydrate zone
– Conduct VSP
85 day schedule from mob to demob
18
Gross Interval for a Hydrate Zone Test
4-½” Production Casing @ +/-2,600’ GL
Hydrate Zone
Permafrost ZoneSurface to
+/- 1,320’ GL
HOT ICE #1 HOT ICE #1 Gas Hydrate WellGas Hydrate Well
9 5/8” Casing @ 80’ GL
7” Casing @ Base of Permafrost
Drill with 5-7/8” Core Bit
Open Hole to 8-1/2” for 7” Casing
Drill with 5-7/8” Core Bit
Free Gas
Hydrate
Hydrates Production Mechanism
•Methane and water from hydrates re-pressurize reservoir
•Produce wells in free gas zone•Lower pressure at hydrate/gas interface•Hydrate dissociates
Hydrate
19
Sunny & -30ºF
Ground View - Healthy Tundra – Summer 03
20
Arctic Sunset – 2/14/2003
Reservoir Characterization
Hydrate Measurement Considerations
Cores are unstable, i.e. they decompose into methane, water and sand.
Core must be maintained at subzero temperatures during handling and measurement.
Cores must simultaneously be pressurized and cooled to in-situ conditions for measurements.
21
“Dissociation Rates of Methane HydrateAt Elevated Pressures
And of a Quartz Sand-Methane HydrateMixture at 0.1 MPa”
Report of the Menlo Park USGS Research in Support of the Maurer/Anadarko/DOE Methane Hydrate Joint Industry Project Under the National Methane Hydrate Research and Development Program National Energy
and Technology Program, Department of Energy
March 5, 2003
Stephen H. Kirby, Susan Circone, andLaura A. Stern
U.S. Geological Survey345 Middlefield Rd. MS 977
Menlo Park, CA 94025
Report Prepared by Susan Circone
Hydrate Specific Exploration Problems Addressed
Seismic velocities in hydrates for areal mapping and log evaluation
Resistivity for log evaluation
Hydrate saturation
Hydrate dissociation rates
Thermal conductivity for production modeling
22
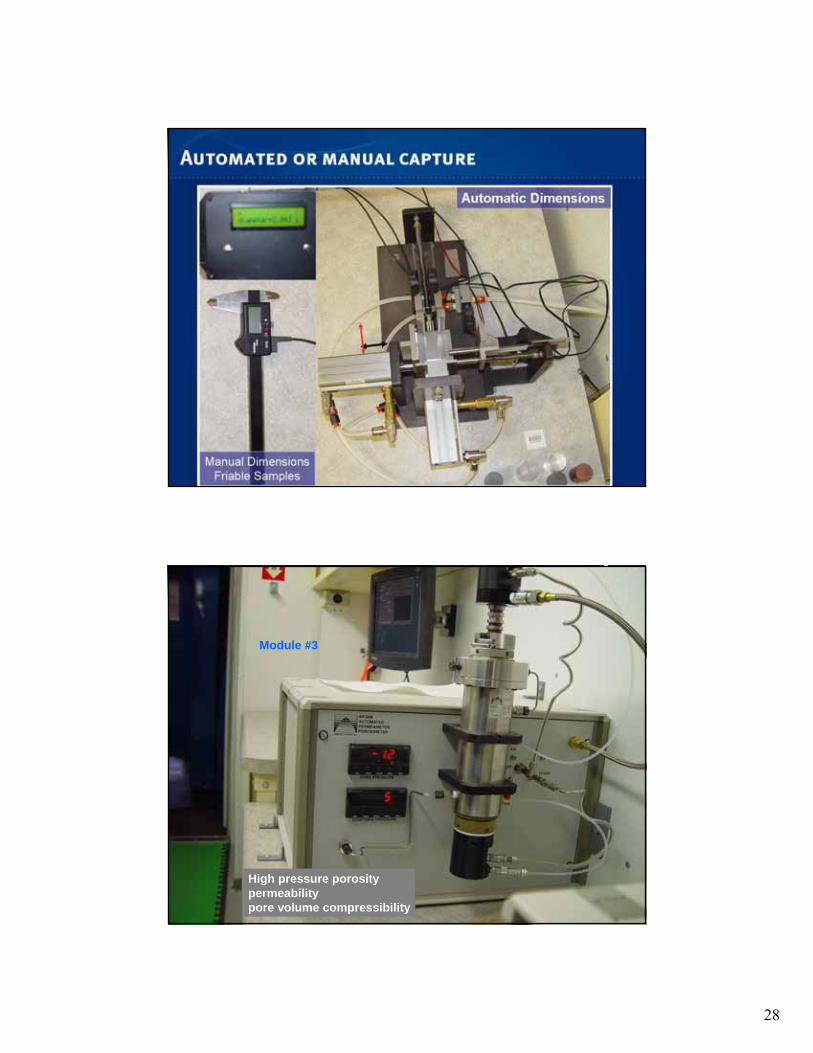
Mobile Lab Measurement CapacitiesPlug Testing Capabilities:
Pressure and Temperature:Compressional Velocity and Shear VelocityDynamic elastic moduliResistivity NMRDissociation S hydrate
Information from the Hot Ice well and an analysis of the local geothermal gradient provided a new estimate for the base of the hydrate stability zone (BHSZ).
This re-analysis places the BHSZ at 2210 ftbelow the surface at the Hot Ice location. This is 400 ft shallower than the estimate based on regional maps from Collett et al. (1988).


![Gulf of Mexico Gas Hydrate Joint Industry Project Leg II ...1].pdfseismic inversions of the data for quantitative gas-hydrate saturation measurements. Unlike the other sites, where](https://static.documents.pub/doc/80x56/5e274cdc3d0c363bdb3ecef5/gulf-of-mexico-gas-hydrate-joint-industry-project-leg-ii-1pdf-seismic-inversions.jpg)


