Alaska Risk MAP Data Acquisition, Analysis and Prioritization of Future Study Needs Alaska Mapping Business Plan Integrating Mapping, Assessment, and Mitigation Planning | 91 AđĆĘĐĆ RĎĘĐ MĆĕ DĆęĆ AĈĖĚĎĘĎęĎĔē,AēĆđĞĘĎĘ Ćēĉ PėĎĔėĎęĎğĆęĎĔē Ĕċ FĚęĚėĊ SęĚĉĞ NĊĊĉĘ I n order to better align the goals and vision of the State of Alaska’s Risk MAP Program with the goals and vision of FEMA’s Risk MAP Program, DCRA established the FY2010 task of acquiring relevant mapping data, analyzing that data, and prioritizing the State of Alaska’s future study needs. To accomplish this, state agencies and local communities were coordinated with to obtain information and data necessary for the prioritization of mapping needs. A consulting firm, URS, Inc., was hired to carry out this process. The process of data acquisition, analysis, and prioritization of future study needs is discussed in the sections that follow. ALASKA MAPPING DA T A The first step in the development of a tool to prioritize Alaska’s future study needs is the collection of the appropriate data. State, Federal, regional, local and private entities were contacted to obtain information and data necessary for the prioritization of mapping needs in Alaskan communities participating in the NFIP. The information collected includes previously unidentified needs, significant climatological changes, planned future development, available topographic data, and available digital data depicting the built environment that are necessary for flood risk assessments. Depending on the nature of the information, the collected information was catalogued within an Excel Workbook, A K-Data_Summary.xlxs, or an ESRI ArcGIS geodatabase. State and Local Data The Alaska Mapping Business Plan recognizes 163 incorporated municipalities of which only 32 participate in the NFIP. Since the current Risk MAP focus is to update flood maps, data collection, analysis and prioritization of mapping needs focuses on NFIP-participating communities. A variety of state and local sources were utilized to acquire needed data. Community Specific Data Collection This effort focused on fulfilling the Mapping Business Plan’s stated purpose and objectives identified in “Future DCRA Risk MAP Business Plan (MBP) Goals, Task 1B: Compile and update data on flood and other hazards Determine community specific previously unidentified needs Determine climatological changes and unidentified impacts Identify future planned development which could impact floodplains Identify the availability of newly acquired community specific topographic data Identify built environment dataset availability and quality Determine mitigation plan quality
Transcript
Alaska Risk MAP Data Acquisition, Analysis and Prioritization of Future Study Needs
Alaska Mapping Business Plan
Integrating Mapping, Assessment, and Mitigation Planning
| 91
A R M D A ,A P F S N
I n order to better align the goals and vision of the State of Alaska’s Risk MAP Program with the goals and vision of FEMA’s Risk MAP Program, DCRA established the FY2010 task of acquiring relevant mapping
data, analyzing that data, and prioritizing the State of Alaska’s future study needs.
To accomplish this, state agencies and local communities were coordinated with to obtain information and data necessary for the prioritization of mapping needs. A consulting firm, URS, Inc., was hired to carry out this process. The process of data acquisition, analysis, and prioritization of future study needs is discussed in the sections that follow.
ALASKA MAPPING DATA The first step in the development of a tool to prioritize Alaska’s future study needs is the collection of the appropriate data. State, Federal, regional, local and private entities were contacted to obtain information and data necessary for the prioritization of mapping needs in Alaskan communities participating in the NFIP. The information collected includes previously unidentified needs, significant climatological changes, planned future development, available topographic data, and available digital data depicting the built environment that are necessary for flood risk assessments. Depending on the nature of the information, the collected information was catalogued within an Excel Workbook, AK-Data_Summary.xlxs, or an ESRI ArcGIS geodatabase.
State and Local Data The Alaska Mapping Business Plan recognizes 163 incorporated municipalities of which only 32 participate in the NFIP. Since the current Risk MAP focus is to update flood maps, data collection, analysis and prioritization of mapping needs focuses on NFIP-participating communities. A variety of state and local sources were utilized to acquire needed data.
Community Specific Data Collection This effort focused on fulfilling the Mapping Business Plan’s stated purpose and objectives identified in “Future DCRA Risk MAP Business Plan (MBP) Goals, Task 1B:
Compile and update data on flood and other hazards
Determine community specific previously unidentified needs
Determine climatological changes and unidentified impacts
Identify future planned development which could impact floodplains
Identify the availability of newly acquired community specific topographic data
Identify built environment dataset availability and quality
Determine mitigation plan quality
Alaska Risk MAP Data Acquisition, Analysis and Prioritization of Future Study Needs
Alaska Mapping Business Plan
Integrating Mapping, Assessment, and Mitigation Planning
92 |
The data collection and analysis effort entailed contacting State, Federal and local governments participating in the NFIP along with private entities to gather required data to fill the MBP data gaps. For the most part, community representatives willingly and enthusiastically supplied needed information viewing their involvement as having a two-fold benefit – the opportunity to potentially receive funding while simultaneously improving their ability to fulfill their floodplain management responsibilities. The project included developing individual NFIP participant questionnaires to assess data gaps addressed in the first MBP Goal and its associated Task 1B. The completed questionnaires will provide essential data to support MBP updates and/or inclusion within the plan. A review of the questionnaire responses reveals that planning, zoning, geographic information systems (GIS), topographic data availability, and community resource capability or capacity is directly related to the community size, affected population, rural location, and hazard risk. The smaller, more rural communities have severely limited capacity to develop or regulate building construction. However, most all communities do guide land-use to ensure new construction does not occur within known hazard zones. The completed questionnaires demonstrate these building code or land-use regulation and enforcement inconsistencies. It is imperative to the majority of the participating communities that new flood hazard assessments be accomplished to obtain up-to-date flood hazard maps. Their maps are 20 to 60 years old, topography, development, and populations have changed along with associated infrastructure improvements. Consequently the current flood maps do not reflect current conditions and associated hazard risks. Most of these communities rely on historical flood impact knowledge to manage their floodplain because their paper maps no longer adequately identify impact areas. Digitized maps will not make a difference for rural communities with limited technological capabilities, because they cannot afford GIS, staff to manipulate the information, or in some cases the capability to contract this service out. Additionally, a need was identified for a mechanism to re-adjust ongoing flood map updates to incorporate newly available data that would in some cases drastically change the in-progress map’s impact areas, especially as the schedules for these flood map updates span multiple years. For example, the following is an excerpt from the Fairbanks North Star Borough questionnaire response:
“The current restudy effort was started in 2006 and is one of FEMAs last MAP Mod projects. Only a portion of the FIRM is being restudied and will be digital upon final adoption. FNSB successfully appealed certain elements of the revision upon review of the initial drafts first released in June of 2009. The successful appeal was possible in large part due to updated hydrology gathered by the Alaska Railroad in their Conditional Letter of Map Revision (CLOMR) application associated with their proposed new bridge crossing of the Tanana River.” The [Alaska Railroad] ARRC CLOMR process uncovered previous mapping shortfalls on the part
Alaska Risk MAP Data Acquisition, Analysis and Prioritization of Future Study Needs
Alaska Mapping Business Plan
Integrating Mapping, Assessment, and Mitigation Planning
| 93
of the FEMA mapping contractor which has delayed finalizing the FIRM updates. The CLOMR application essentially showed how the model used by FEMA in their mapping was flawed. As well, FEMA underwent a contractor change-over, which has further delayed release of the new DFIRMS. Additionally, FEMA headquarters made a “levee policy” change nationwide, which has also adversely affected the timely adoption of the DFIRMs.
In the meantime, [Fairbanks North Star Borough] FNSB has since acquired new LIDAR (very accurate with 2' contours which includes the Boroughs unnumbered "A Zones") from the Corps of Engineers. FEMA has stated that is simply not possible due to funding and time constraints. It is essential that this new LIDAR information be included in this current map revision. Risk MAP restudies for large areas of populated unnumbered A zone areas will take years to accomplish.”
The collected information and data is compiled and available and included in AK_data_summary.xlsx and supports the MBP’s future study needs assessment for the participating NFIP participating communities.
Federal and Regional Data Average Annualized Loss In 2009 FEMA initiated the Average Annualized Loss (AAL) Study to provide a Nationwide Loss Dataset. The analysis was performed using HAZUS-MH for every county in the contiguous United States. Annualized losses are maximum potential losses for a given year based on five return periods (10, 50, 100, 200, and 500yr). Unfortunately, the State of Alaska was not included in this analysis. Even though no AAL exists for the State of Alaska, it is mentioned and being considered as a potential future dataset as it is an important data gap in the current FEMA prioritization methodology.
Non-Average Annualized Loss This dataset was used to generate the flood risk deciles used in the Flood Map Modernization (Map Mod) program. The decile calculations included the use of several national datasets. This data is summarized on a HUC-8 watershed basis and is included in AK_data_summary.xlsx Census Data The most recent 2010 census data was collected as supporting information to the Community Boundaries and Information. Some of the parameters that will be used in the prioritization of future studies may be
2009 Population
Population Increase 1980-2009
Population Increase 2009-2019
2009 Housing Units
Single Claims
Policies
Number of Repetitive Losses
Number of Repetitive Loss Properties
Average County Fed Disasters (As Of 7/2009)
Total NHD Miles + Coastal W Inlets - Feder-al NHD Miles
Alaska Risk MAP Data Acquisition, Analysis and Prioritization of Future Study Needs
Alaska Mapping Business Plan
Integrating Mapping, Assessment, and Mitigation Planning
94 |
weighted by population in order to determine relative risk. This data is organized by census block and is presented in the AK_Sequencing.gdb. Community Boundaries and Information Community information from three separate sources (State Data, Census Data, and FEMA); was collected and compared. The State uses FIPS and CID numbers found in FEMA’s CIS database. However, many communities do not have a number because they are outside a designated borough but are located in Alaska’s “Unorganized Borough.” The databases also had misspellings, incomplete community names, and other inconsistencies exacerbating database search difficulties. NFIP participating municipalities located in the Unorganized Borough are listed by census area and contiguous boundaries have been developed by FEMA. These boundaries are located as the feature class AK_Communities_FEMA found within the AK_Sequencing.gdb geodatabase. These contiguous boundaries will be used in the prioritization of future studies. Data Comparison A comparison of the three data sources is shown in the table on the next page and the resolution to the inconsistencies is noted in the last column.
Coordinated Needs Management Strategy (CNMS) data CNMS is a FEMA initiative to update the way FEMA organizes, stores, and analyzes flood hazard mapping needs information for communities. It defines an approach and structure for the identification and management of flood hazard mapping needs that will provide support to data driven planning and the flood map update investment process in a geospatial environment. Every stream and coastal reach nationwide is currently being assessed to determine its status. For the State of Alaska, approximately 1,000 stream miles have been inventoried and analyzed to determine whether the stream or coastal miles meets its criteria of New, Validated or Updated Engineering (NVUE). The question CNMS will address is whether a stream (or coastal) segment is NVUE compliant. The dataset provided by FEMA shows all stream miles within Alaska as either being “Not Valid” or “Requires Assessment”. According to STARR, Production and Technical Services (PTS) contractor for FEMA Region X, it is important to note that for the current CNMS inventory for Alaska in general, only FEMA’s digital data was evaluated so if the area didn’t have a DFIRM then it was unlikely to make it into the evaluation process. This means that participating communities with paper maps only do not have their flooding sources reflected in the current CNMS database. Because the CNMS dataset is inherently a GIS database, it has been left in its original format – as a separate geodatabase. Available Topography FEMA tasked the Risk MAP Production and Technical Services (PTS) contractors to develop a Geospatial Data Inventory (GDI) of available high-quality elevation data across the Nation. The results of their efforts are
Alaska Risk MAP Data Acquisition, Analysis and Prioritization of Future Study Needs
Alaska Mapping Business Plan
Integrating Mapping, Assessment, and Mitigation Planning
| 95
Table 24: Comparison of Data Sources on Alaska Communities
Community FIPS from State Data Community List & FEMA’s Community Status Book
Community FIPS from 2010 Census Data
Community FIPS from FEMA Notes
Borough FIPS Borough FIPS Borough FIPS
Aleu an Islands 02010 FIPS 02010 covered by STCOFIPS 02013 and
Aleu ans East 02013 Aleu ans East 02013
Aleu ans West Census Area 02016 Aleu ans West 02016
Nome Division 02180 Nome Census Area 02180 Nome 02180
North Slope 02185 North Slope 02185 North Slope 02185
Northwest Arc c 02188 Northwest Arc c 02188 Northwest Arc c 02188
Prince of Wales Div. 02201 Prince of Wales-Outer Ketchikan
02201
Sitka Division 02220 Sitka City and Borough 02220 Sitka 02220
Skagway-Yakutat Division 2230 Skagway Municipality 02230 02230 Census Area covered by STCOFIPS 02232
Skagway-Hoonah-Angoon 02232
Alaska Risk MAP Data Acquisition, Analysis and Prioritization of Future Study Needs
Alaska Mapping Business Plan
Integrating Mapping, Assessment, and Mitigation Planning
96 |
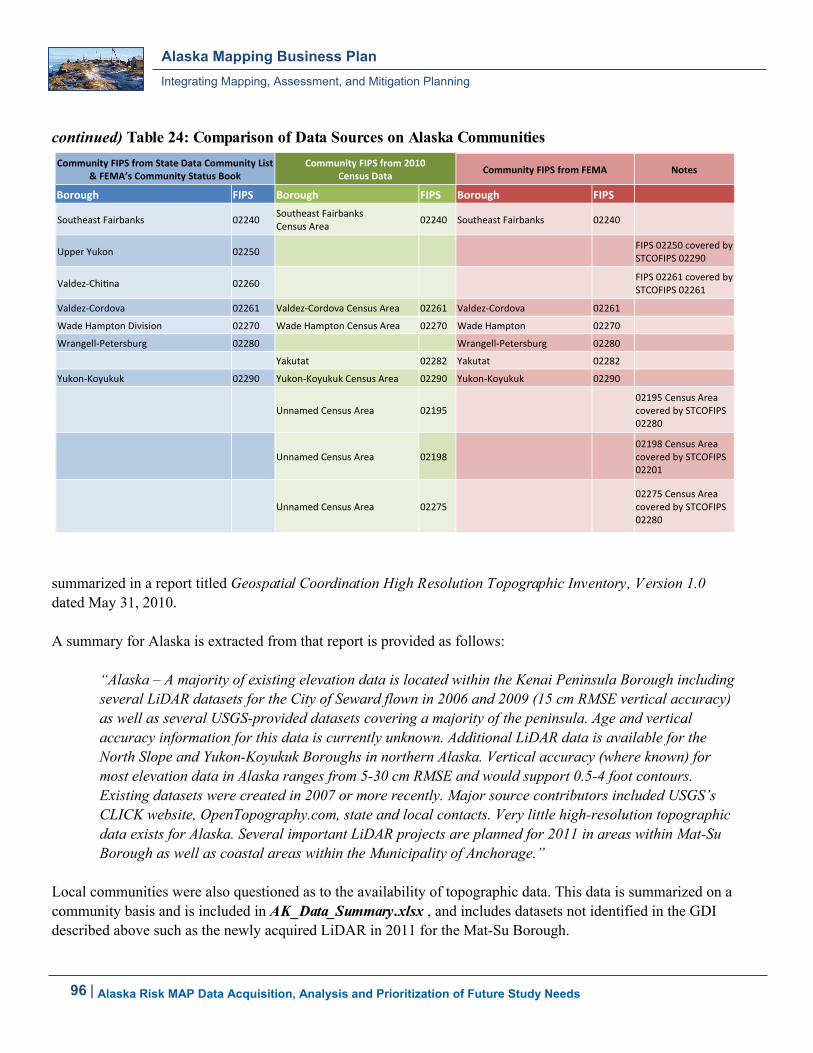
continued) Table 24: Comparison of Data Sources on Alaska Communities
summarized in a report titled Geospatial Coordination High Resolution Topographic Inventory, Version 1.0 dated May 31, 2010. A summary for Alaska is extracted from that report is provided as follows:
“Alaska – A majority of existing elevation data is located within the Kenai Peninsula Borough including several LiDAR datasets for the City of Seward flown in 2006 and 2009 (15 cm RMSE vertical accuracy) as well as several USGS-provided datasets covering a majority of the peninsula. Age and vertical accuracy information for this data is currently unknown. Additional LiDAR data is available for the North Slope and Yukon-Koyukuk Boroughs in northern Alaska. Vertical accuracy (where known) for most elevation data in Alaska ranges from 5-30 cm RMSE and would support 0.5-4 foot contours. Existing datasets were created in 2007 or more recently. Major source contributors included USGS’s CLICK website, OpenTopography.com, state and local contacts. Very little high-resolution topographic data exists for Alaska. Several important LiDAR projects are planned for 2011 in areas within Mat-Su Borough as well as coastal areas within the Municipality of Anchorage.”
Local communities were also questioned as to the availability of topographic data. This data is summarized on a community basis and is included in AK_Data_Summary.xlsx , and includes datasets not identified in the GDI described above such as the newly acquired LiDAR in 2011 for the Mat-Su Borough.
Community FIPS from State Data Community List & FEMA’s Community Status Book
Community FIPS from 2010 Census Data
Community FIPS from FEMA Notes
Borough FIPS Borough FIPS Borough FIPS
Southeast Fairbanks 02240 Southeast Fairbanks Census Area
02240 Southeast Fairbanks 02240
Upper Yukon 02250 FIPS 02250 covered by STCOFIPS 02290
Valdez-Chi na 02260 FIPS 02261 covered by STCOFIPS 02261
Valdez-Cordova 02261 Valdez-Cordova Census Area 02261 Valdez-Cordova 02261
Wade Hampton Division 02270 Wade Hampton Census Area 02270 Wade Hampton 02270
Yukon-Koyukuk 02290 Yukon-Koyukuk Census Area 02290 Yukon-Koyukuk 02290
Unnamed Census Area 02195 02195 Census Area covered by STCOFIPS 02280
Unnamed Census Area 02198 02198 Census Area covered by STCOFIPS 02201
Unnamed Census Area 02275 02275 Census Area covered by STCOFIPS 02280
Alaska Risk MAP Data Acquisition, Analysis and Prioritization of Future Study Needs
Alaska Mapping Business Plan
Integrating Mapping, Assessment, and Mitigation Planning
| 97
Letters of Map Change (LOMC) LOMCs, specifically Letters of Map Amendments (LOMAs), can be used as an indicator that a map may need revision. Letters of Map Revision (LOMR) have been excluded from this dataset because, by definition, approved LOMRs already address the mapping need and are the effective NFIP document for the area covered by the LOMR restudy. LOMAs can be summarized on a borough, community, or flooding source basis. This dataset is included in Tab 12, AK_Data_Summary.xlsx (see also Appendix 1, Table 8). Mitigation Plans The latest report to FEMA regarding the status of Mitigation Plans was dated June 24, 2011. The dataset includes FIPS, CID, and population information for jurisdictions added in May 2011 from the FEMA Community Layer. The presence of active mitigation plans indicates those communities are proactive in managing flood related risks. Therefore, those watersheds with a high percentage of their areas intersecting communities with mitigation plans in place are usually given a higher priority for future studies. Local communities were also questioned as to the availability of mitigation plans. This data is summarized on a community basis and is included in Tab 7, AK_Data_Summary.xlsx (see also Appendix 1, Table 7). Non-Compliance with the NFIP When attempts to resolve enforcement problems through community assistance or consultation have failed, the FEMA Regional Director may place a community on probation. The probationary period lasts at least until all program deficiencies have been corrected and violations have been remedied to the maximum extent possible, and it may be extended for up to one year after that. Probation has no effect on the continued availability of flood insurance. If the community fails to take remedial measures during the probationary period, the Regional Director may recommend suspension from the NFIP which would prevent residents from obtaining flood insurance. A community may also be reinstated on probationary status after having been suspended. This data is summarized on a community basis and is included in Tab 6, AK_Data_Summary.xlsx. Community Rating System (CRS) The CRS is a voluntary program for NFIP-participating communities. Information on the State of Alaska’s current listings of all CRS communities, their class, and insurance discount has been collected and are summarized on a community basis. It is included in Tab 4, AK_Data_Summary.xlsx. Disaster Declarations A Major Disaster could result from a hurricane, earthquake, flood, tornado, or major fire which the President determines warrants supplemental federal aid. To be considered for this aid the impacts of such an event must clearly exceed the capability of state or local governments’ resources or capability to manage the consequences alone. If declared, funding comes from the President's Disaster Relief Fund, which is managed by FEMA, and disaster aid programs of other participating federal agencies. Data for the State of Alaska was pulled from FEMA and is included in Tabs 9 and 10, AK_Data_Summary.xlsx (see also Appendix 1, Table 7).
Alaska Risk MAP Data Acquisition, Analysis and Prioritization of Future Study Needs
Alaska Mapping Business Plan
Integrating Mapping, Assessment, and Mitigation Planning
98 |
Federal Insurance Administration (FIA) Data Flood insurance information was collected from the FIA. It contains the number of single claims, the number of policies in effect, the number of repetitive losses, and the number of repetitive loss properties summarized at the borough level. The data for the State of Alaska is included in AK_Data_Summary.xlsx (see also Appendix 1, Table 4.) Hazard Mitigation Grant Program (HMGP) Participation in FEMA’s HMGP can give a good indication that a community is willing to mitigate the risks of flood hazards. Data for the communities within the State of Alaska participating in HMGP was pulled from FEMA and is included in Tab 5, AK_Data_Summary.xlsx (see also Appendix 1, Table 8).
ALASKA PRIORITIZATION AND FUTURE STUDIES SEQUENCING DECISION SUPPORT SYSTEM
Overview The Alaska Prioritization and Future Studies Sequencing Decision Support System is a ranking methodology intended to provide relative comparisons between watersheds based on a number of normalized factors in the State of Alaska. It provides an analysis of information gathered on a local, state, and nationwide basis to provide a prioritization list of Alaskan watersheds to be studied under FEMA’s Risk MAP Program. The term “county” used throughout this report is synonymous with the State of Alaska’s “borough” and “census area” classifications.
Building upon the concept of the Risk MAP ‘trifecta’ approach employed in the Fiscal Year 2011 (FY11) Algorithm, this solution incorporates several additional datasets, grouping them by type, and allowing users to assign customized weighting to each of the contributing factors. While the FY11 algorithm compares absolute values of one watershed to absolute values of another watershed for Flood Risk, Need and Topographic Coverage, this new approach leverages state and local considerations based on community input to develop a ranking of Hydrologic Unit Code (HUC) 8 watersheds within Alaska. It considers the local preferences for prioritization, such as climatological change, local hazard mitigation plans, planned future development, coastal exposure, etc. Special considerations are given to communities with plans in need of updating and with an expressed interest in plan improvement or development.
A total of 16 Indicators have been considered. Individual indicators have been grouped into one of the following three factors: Flood Risk, Needs, and Action Potential. The system is built in a robust and user-friendly environment that allows users to modify the contribution of each factor (or each indicator) based on local knowledge and preference. Instructions for viewing and modifying the weights for the various ranking factors are embedded in the spreadsheet tool, Alaska_Risk MAP_Prioritization.xlsx .
Acquired/Standardized Data Various datasets were identified, collected, assembled, and analyzed through the process. Data was obtained from different sources, such as federal, regional, and state agencies, as well as local communities.
Alaska Risk MAP Data Acquisition, Analysis and Prioritization of Future Study Needs
Alaska Mapping Business Plan
Integrating Mapping, Assessment, and Mitigation Planning
| 99
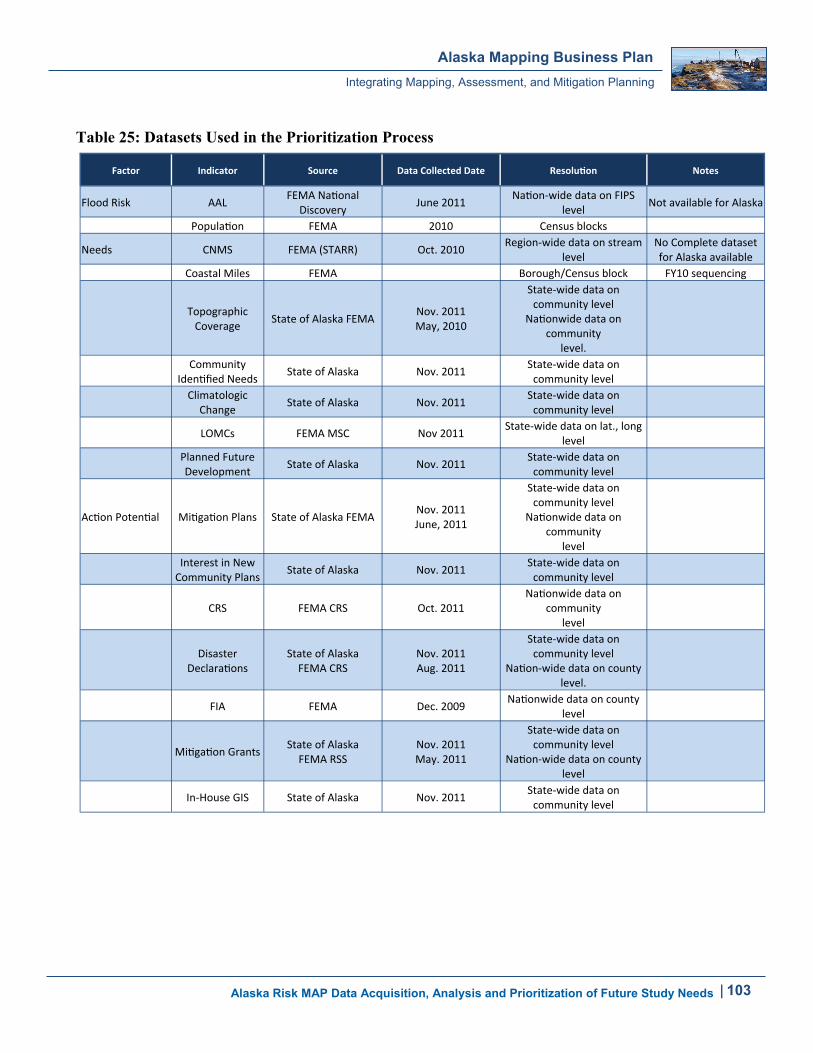
The focus of this effort was to collect the best available and most up-to-date data to optimize the accuracy of the information used in the decision making process. The table below provides a detailed list of datasets which were used in the prioritization process. Each indicator was classified into one of three factors: Flood Risk, Needs, and Action Potential. These factors, as well as individual indicators, were incorporated into the algorithm after normalization by population or area weighting at the HUC-8 level. This is critical when comparing watersheds as it allows for a fair comparison between entities when population numbers and total areas are different from one to another. This evaluation is performed primarily at the HUC-8 level.
Data Processing The different types of data provided lend themselves to inclusion in a prioritization algorithm in different ways. To prepare the tables, decisions must be made on data type and normalization method – keeping in mind a consistent ranking method. For the purposes of this analysis we will assume that the lower the rank (1 being the lowest) the more likely a unit (FIPS, CID, HUC) is to be recommended for study (meaning it is considered a higher priority by our system). Since the goal is to make prioritization recommendations, each data table should evaluate how one unit compares to another for the factor described by that data table to the extent possible. Area/Population Weighting Depending on the resolution of the contributing datasets, each indicator was first ranked at a watershed (HUC-8), County (FIPS), or Community (CID) level. For factors that existed at a HUC-8 watershed level, the factor rankings transferred directly to the master ranking scheme. For factors ranked at the county or community level, the appropriate area or population weighting was applied to the data such that counties/communities with a large percentage of their respective area in a given watershed would contribute more to that watershed’s eventual ranking for that factor than would the ranking of counties/communities which barely had a footprint in the watershed. The majority of the datasets used are available by political boundaries (CID or FIPS) rather than at the watershed level. The abovementioned method of ranking HUC-8 watersheds based on the area of “influence” of constituent counties/communities ensures that this transition from political boundaries to watershed boundaries is made in a meaningful manner without over- or under-representing the representative strength of the constituent counties/communities. Considering Types of Data Inclusion – Rank vs. Binary The data sets which have been collected can contribute to a prioritization calculation in one of two ways; they can either be used to provide a relative ranking for each unit (FIPS or CID depending on the data), or they can provide a binary YES/NO (1/0) for each unit. An example of data lending itself to ranking would be the FIA data, where each unit has its own unique set of attributes (in that case rep loss, properties, etc.). An example of data lending itself to binary inclusion would be the Climate Change table, where each community listed simply as a YES/NO. Much of the locally collected data was processed as a binary data set including Planned Future Development, Topographic Coverage, Community Identified Needs, Mitigation Plans, Interest in New Community Plans, Mitigation Grants, In-House GIS, IAID, and Climatological Change.
Alaska Risk MAP Data Acquisition, Analysis and Prioritization of Future Study Needs
Alaska Mapping Business Plan
Integrating Mapping, Assessment, and Mitigation Planning
100 |
Risk Factor Average Annualized Loss Rank The Average Annualized Loss (AAL) Rank is a ranking, by watershed, of the total AAL. This starts with a Rank of 1 being the watershed with the highest AAL dollar amount. However, no AAL data analysis was available for Alaska to use on this project. Therefore, all the watersheds had the same ranking and no weighting factor is applied to this indicator. When the AAL data becomes available in the future, the indicator can be introduced to the algorithm. With proper weighting factor, AAL could contribute to the Risk factor. Population Rank Population Rank rates the highest population with a value of 1 to indicate that it is the most important, and
increases in order to the watershed of lowest population.
Needs Factor Coordinated Needs Management Strategy (CNMS) This ranking uses the CNMS inventory to compare mileages within each watershed, which are considered Non-NVUE. New, Validated, or Updated Engineering (NVUE) is the FEMA standard that provides a basis for assessing the engineering analysis used to develop flood elevations. FEMA developed the standard to help mapping partners determine where new study data should be collected, where updates to existing flood hazard data should be performed, and whether previously developed flood study data could still be considered valid. The Non-NVUE category is composed of all paper inventory study miles, as well as any modernized NOT VALID and REQUIRES ASSESSMENT mileage. Higher priority can be given to watersheds with more mileage in this category. The CNMS data for Alaska currently shows that ALL stream miles are Non-NVUE compliant, thus all watersheds will have the same rank for this indicator. Additionally, FEMA’s contractor STARR indicated that the only streams currently included in CNMS for the State of Alaska are those currently in DFIRM format. This excludes a large number of streams and makes this dataset incomplete. When the CNMS data is updated and some distinctions between the watersheds can be made, this indicator can be introduced to the algorithm at that time. Ultimately, CNMS should contribute heavily to the Needs factor. Coastal Miles Since the CNMS inventory only includes riverine mileages, a significant amount of coastal shoreline mileages within the state of Alaska are not considered. The Coastal Needs indicator addresses the needs of floodplain studies for coastal communities. The indicator ranks all watersheds based on the linear distance of coastline within a watershed as it relates to the overall area of coastal communities within the state. Higher priority is given to watersheds that include more coastal communities. Topographic Coverage Rank Topographic data availability was part of the FY11 algorithm and is considered here as an action potential. Here watersheds are ranked based on the percentage of their area that are covered by available topographic
Alaska Risk MAP Data Acquisition, Analysis and Prioritization of Future Study Needs
Alaska Mapping Business Plan
Integrating Mapping, Assessment, and Mitigation Planning
| 101
coverage (discounting the 30m resolution National Elevation Dataset- NED), with a Rank of 1 representing the watershed(s) with the highest percentage of topographic coverage. The base NED product was discounted based on the National Academy’s findings on floodplain analyses and quality elevation data and the associated applicability of this particular dataset. Community Identified Needs Rank Community Identified Needs ranking is a weighted value representing the needs which were previously unidentified. Several communities have expressed the need for new or updated flood studies. Higher priority was given to communities that have identified such needs. Climatological Change Rank This ranking utilizes local input to identify any significant climatological changes observed in a community. Several communities have reported hydrological impact caused by climatological changes, such as rising sea level, glacier recessions, flooding introduced by glacial dam breaches, melting of permafrost, etc. This factor evaluates the relative area of a watershed where the impact of significant climatological changes was reported. The watersheds are ranked based on the percentage of their area with significant climatological changes. LOMC Rank The Letters of Map Change (LOMC) ranking is a combined weighted value representing the presence and number of LOMCs within communities located in specific watersheds. Higher priority was given to watersheds including communities with greater numbers of processed LOMCs.
Planned Future Development Rank This ranking utilizes the local inputs to identify any planned future development in a community. It evaluates the area of planned future development within a watershed as it relates to the overall area within the State of Alaska. A rank of 1 indicates a watershed which has seen the highest percentage of area that has planned future development. This is considered a Need because the planned future development is an indicator of future urbanization where the new physical environment is no longer being represented appropriately in the engineering model and on the map.
Action Potential Factor Mitigation Plan Rank The Mitigation Plan ranking is a weighted value indicating the presence of active mitigation plans within communities located in a watershed. Higher priority was given to those watersheds of which higher percentages of their respective areas included communities with mitigation plans in place. Interest in New Community Plans The Interest in New Community Plans ranking is a weighted value indicating the willingness of communities to either update their plans or develop new community plans. Higher priority was given to
Alaska Risk MAP Data Acquisition, Analysis and Prioritization of Future Study Needs
Alaska Mapping Business Plan
Integrating Mapping, Assessment, and Mitigation Planning
102 |
watersheds of which higher percentages of their respective areas included communities with community plans in place. Community Rating System Rank The Community Rating System (CRS) ranking is a combined weighted value representing the CRS rating of communities located in each of the watersheds. Higher priority was given to watersheds that included communities with a better overall CRS rating. In essence, communities that are more in compliance and have a better CRS rating will contribute positively to achieving the goals of Risk MAP. Disaster Declarations Rank The Disaster Declarations ranking is a weighted value indicating the presence of communities within the watershed that have a history of declared flood disasters. Higher priority was given to watersheds that have more disaster declarations with the thought that communities that have had disasters declared are more likely to value and implement mitigation action to limit the scope of the impact in the future. It also provides a part of the outreach communications. Flood Insurance Administration Rank The Flood Insurance Administration (FIA) ranking is a combined weighted value representing claims, policies, repetitive loss, and repetitive loss properties intersecting the watersheds using a per capita, per unit area normalization. Higher priority was given to watersheds that included communities with high occurrences of these factors per capita per unit area. Mitigation Grants Rank The Grants ranking is a combined weighted value representing presence of ongoing/recent studies within the communities or portions thereof within each of the watersheds. Higher priority was given to areas receiving greater mitigation grants. This is based on the assumption that because these communities have received mitigation funding recently, they could be more likely to improve their communities in other ways. In-House GIS Rank The In-House GIS ranking is an indicator of the community’s capability to participate in the Risk MAP Program. A community with a strong in-house GIS program and proper supporting staff is more likely to carry out relevant aspects of the Risk MAP Program. Higher priority was been given to watersheds, which have the higher percentages of their areas intersecting communities with a confirmed In-House GIS program.
Alaska Risk MAP Data Acquisition, Analysis and Prioritization of Future Study Needs
Alaska Mapping Business Plan
Integrating Mapping, Assessment, and Mitigation Planning
| 103
Table 25: Datasets Used in the Prioritization Process
Factor Indicator Source Data Collected Date Resolu on Notes
Flood Risk AAL FEMA Na onal
Discovery June 2011
Na on-wide data on FIPS level
Not available for Alaska
Popula on FEMA 2010 Census blocks
Needs CNMS FEMA (STARR) Oct. 2010 Region-wide data on stream
level No Complete dataset for Alaska available
Coastal Miles FEMA Borough/Census block FY10 sequencing
Topographic Coverage
State of Alaska FEMA Nov. 2011 May, 2010
State-wide data on community level
Na onwide data on community
level.
Community
Iden fied Needs State of Alaska Nov. 2011
State-wide data on community level
Climatologic
Change State of Alaska Nov. 2011
State-wide data on community level
LOMCs FEMA MSC Nov 2011 State-wide data on lat., long
level
Planned Future Development
State of Alaska Nov. 2011 State-wide data on community level
Ac on Poten al Mi ga on Plans State of Alaska FEMA Nov. 2011 June, 2011
State-wide data on community level
Na onwide data on community
level
Interest in New Community Plans
State of Alaska Nov. 2011 State-wide data on community level
CRS FEMA CRS Oct. 2011 Na onwide data on
community level
Disaster
Declara ons State of Alaska FEMA CRS
Nov. 2011 Aug. 2011
State-wide data on community level
Na on-wide data on county level.
FIA FEMA Dec. 2009 Na onwide data on county
level
Mi ga on Grants State of Alaska FEMA RSS
Nov. 2011 May. 2011
State-wide data on community level
Na on-wide data on county level
In-House GIS State of Alaska Nov. 2011 State-wide data on community level
Alaska Risk MAP Data Acquisition, Analysis and Prioritization of Future Study Needs
Alaska Mapping Business Plan
Integrating Mapping, Assessment, and Mitigation Planning
104 |
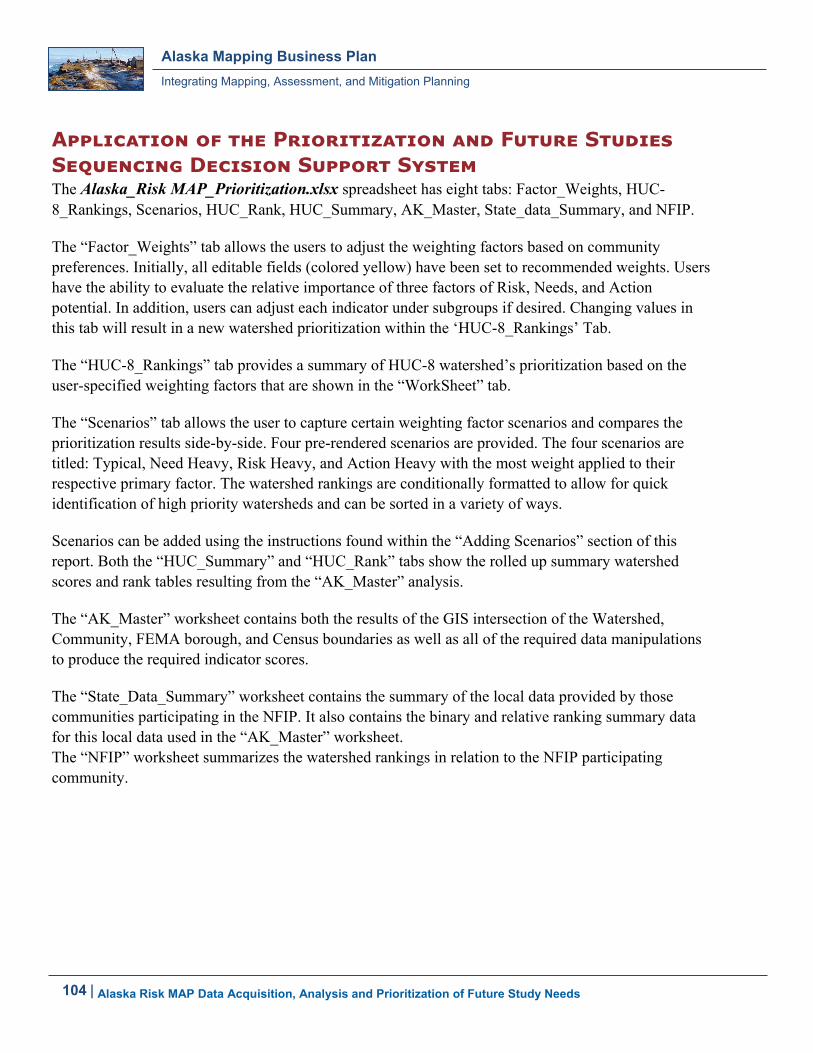
APPLICATION OF THE PRIORITIZATION AND FUTURE STUDIES SEQUENCING DECISION SUPPORT SYSTEM The Alaska_Risk MAP_Prioritization.xlsx spreadsheet has eight tabs: Factor_Weights, HUC- 8_Rankings, Scenarios, HUC_Rank, HUC_Summary, AK_Master, State_data_Summary, and NFIP.
The “Factor_Weights” tab allows the users to adjust the weighting factors based on community preferences. Initially, all editable fields (colored yellow) have been set to recommended weights. Users have the ability to evaluate the relative importance of three factors of Risk, Needs, and Action potential. In addition, users can adjust each indicator under subgroups if desired. Changing values in this tab will result in a new watershed prioritization within the ‘HUC-8_Rankings’ Tab.
The “HUC-8_Rankings” tab provides a summary of HUC-8 watershed’s prioritization based on the user-specified weighting factors that are shown in the “WorkSheet” tab.
The “Scenarios” tab allows the user to capture certain weighting factor scenarios and compares the prioritization results side-by-side. Four pre-rendered scenarios are provided. The four scenarios are titled: Typical, Need Heavy, Risk Heavy, and Action Heavy with the most weight applied to their respective primary factor. The watershed rankings are conditionally formatted to allow for quick identification of high priority watersheds and can be sorted in a variety of ways.
Scenarios can be added using the instructions found within the “Adding Scenarios” section of this report. Both the “HUC_Summary” and “HUC_Rank” tabs show the rolled up summary watershed scores and rank tables resulting from the “AK_Master” analysis.
The “AK_Master” worksheet contains both the results of the GIS intersection of the Watershed, Community, FEMA borough, and Census boundaries as well as all of the required data manipulations to produce the required indicator scores.
The “State_Data_Summary” worksheet contains the summary of the local data provided by those communities participating in the NFIP. It also contains the binary and relative ranking summary data for this local data used in the “AK_Master” worksheet. The “NFIP” worksheet summarizes the watershed rankings in relation to the NFIP participating community.
Alaska Risk MAP Data Acquisition, Analysis and Prioritization of Future Study Needs
Alaska Mapping Business Plan
Integrating Mapping, Assessment, and Mitigation Planning
| 105
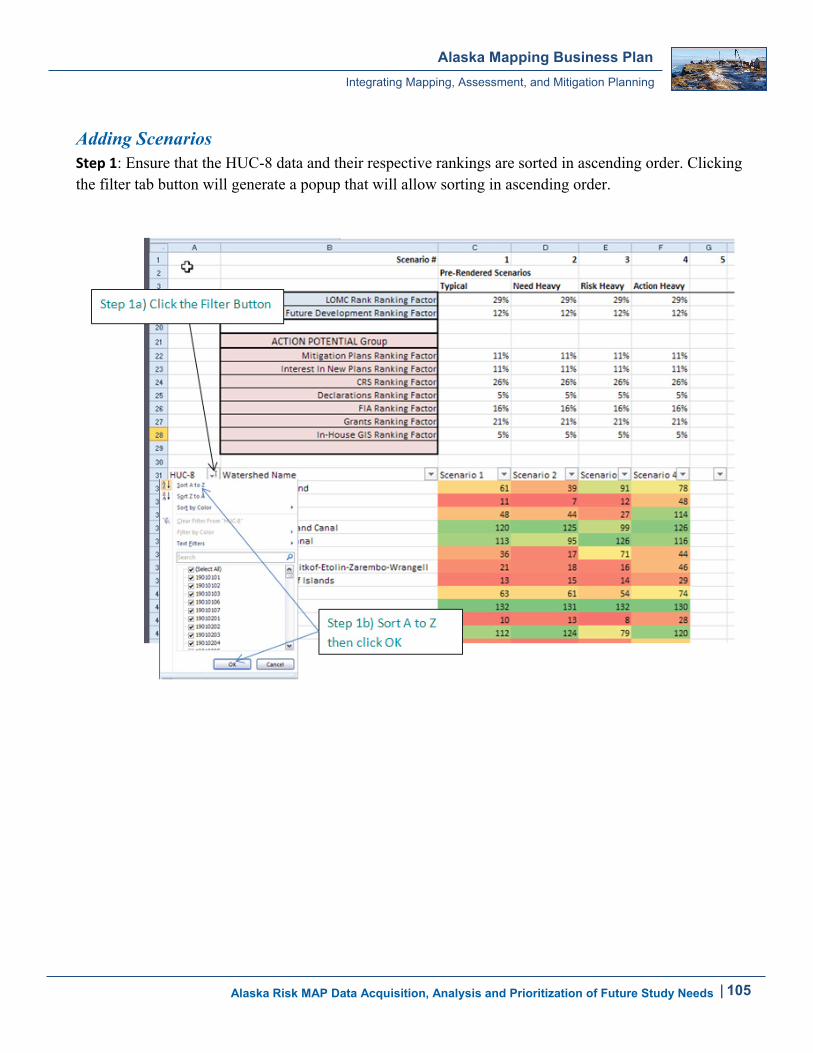
Adding Scenarios Step 1: Ensure that the HUC-8 data and their respective rankings are sorted in ascending order. Clicking the filter tab button will generate a popup that will allow sorting in ascending order.
Alaska Risk MAP Data Acquisition, Analysis and Prioritization of Future Study Needs
Alaska Mapping Business Plan
Integrating Mapping, Assessment, and Mitigation Planning
106 |
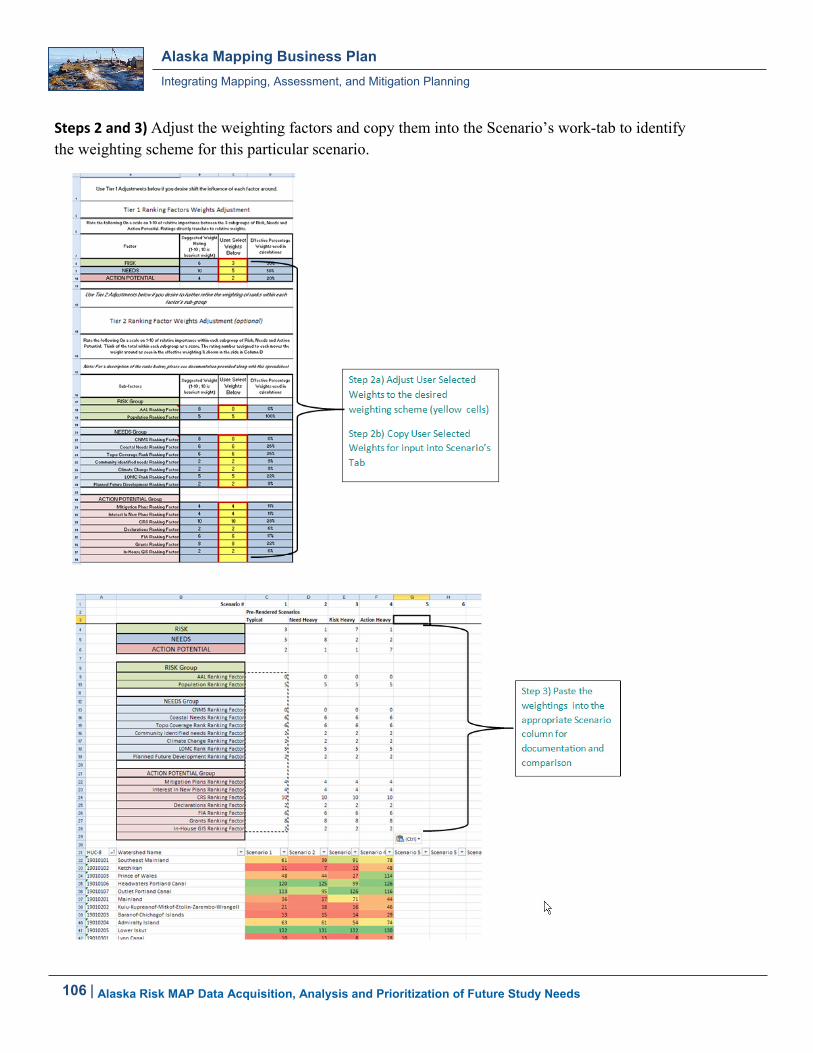
Steps 2 and 3) Adjust the weighting factors and copy them into the Scenario’s work-tab to identify the weighting scheme for this particular scenario.
Alaska Risk MAP Data Acquisition, Analysis and Prioritization of Future Study Needs
Alaska Mapping Business Plan
Integrating Mapping, Assessment, and Mitigation Planning
| 107
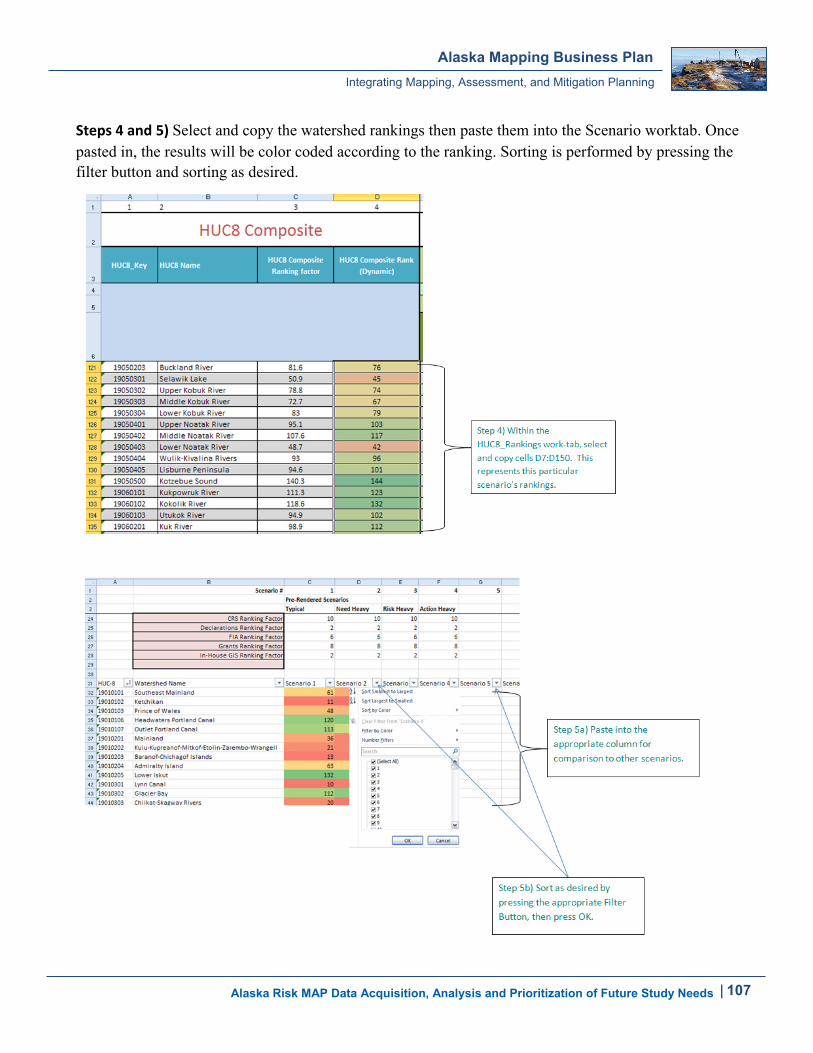
Steps 4 and 5) Select and copy the watershed rankings then paste them into the Scenario worktab. Once pasted in, the results will be color coded according to the ranking. Sorting is performed by pressing the filter button and sorting as desired.
Alaska Risk MAP Data Acquisition, Analysis and Prioritization of Future Study Needs
Alaska Mapping Business Plan
Integrating Mapping, Assessment, and Mitigation Planning
108 |
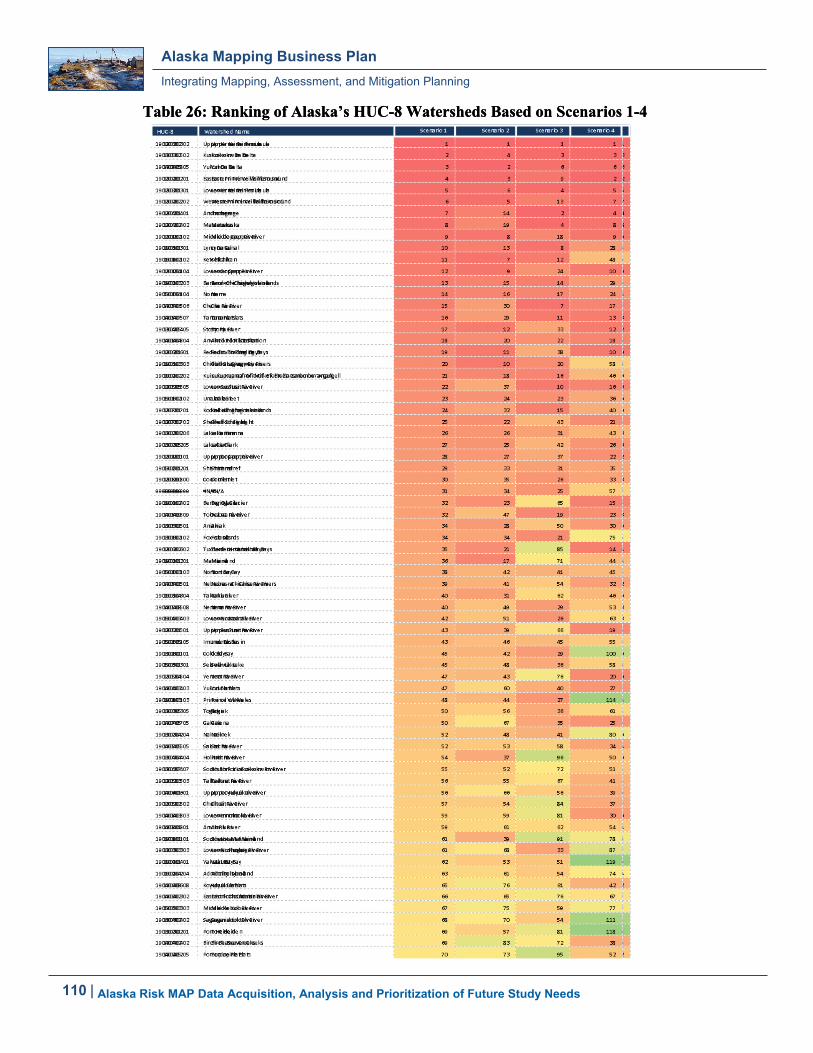
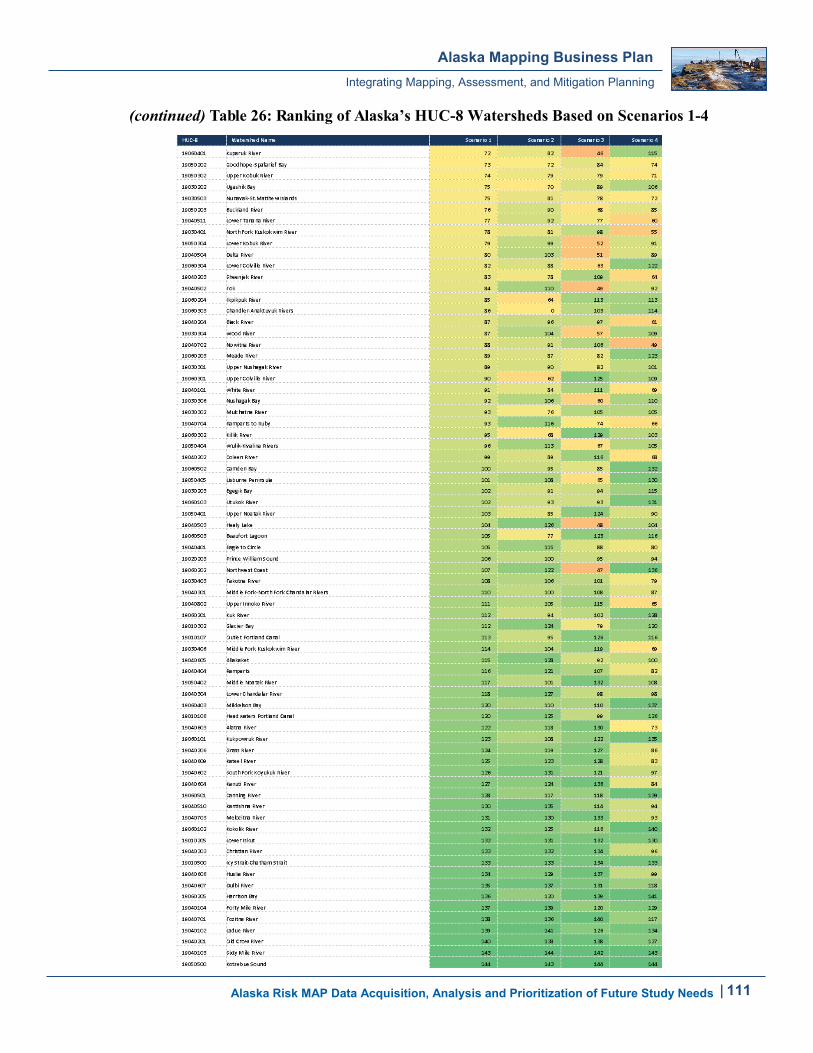
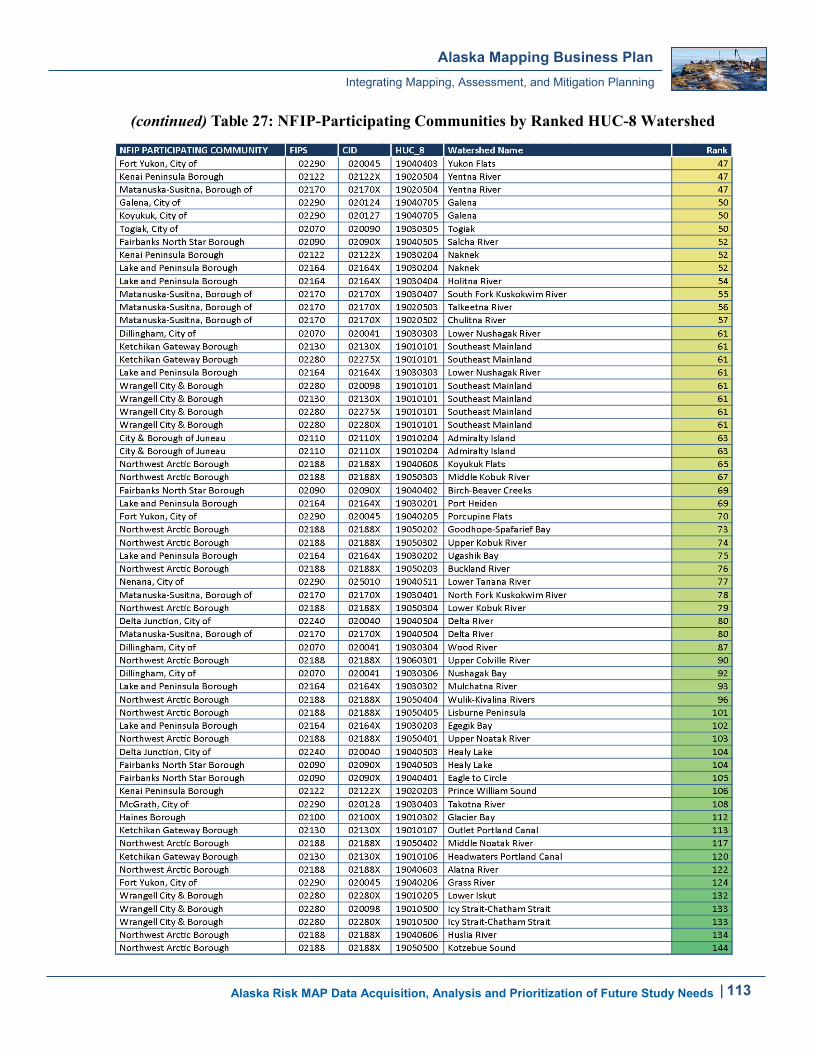
PRIORITIZATION OF FUTURE MAPPING NEEDS The focus of this work is to provide a baseline for prioritizing future study needs of Alaska’s NFIP participating communities. The data collection and analysis results indicate that the Upper Kenai Peninsula (HUC 19020302) should be considered a high priority. The overall ranking for this watershed was insensitive to the weighting distribution scenarios that were tested. Adjacent watersheds also had high prioritization rankings. The NFIP communities that are located in these high prioritized watersheds include Kenai Peninsula Borough, City of Kenai, Municipality of Anchorage, City of Soldotna, City of Aniak, City of Bethel, City of Kwethluk, City of Emmonak, City of Cordova, and the Matanuska-Susitna Borough. The prioritized rankings are illustrated by the map in Figure 24, next page, and by Table 26 on pages 110 and 111. Table 27 on pages 112-113 provides a listing of NFIP-participating communities by ranked HUC-8 watershed. In general, the watershed rankings show that the South Central Alaska portions (Anchorage, and Matanuska-Susitna Boroughs) should be given higher priority. The coastal areas for these boroughs as well as the Western Alaska coastal areas (including Bethel and Wade Hampton) also need focused Risk MAP studies. Most of these studies are currently underway. Completing the CNMS analysis is critical to accomplishing future analysis or updates to this activity. The current CNMS indicator for Alaska currently shows all watersheds will have the same rank. When the CNMS data is updated and some distinctions between the watersheds can be made, this indicator can be introduced to the algorithm at that time. Ultimately, CNMS should contribute heavily to the Needs Factor. Also, a statewide risk analysis needs to be performed. The risk analysis will define the average annualized losses. When the AAL data becomes available in the future, the indicator can be introduced to the algorithm. With proper weighting factor, AAL could contribute to the Risk factor.
Alaska Risk MAP Data Acquisition, Analysis and Prioritization of Future Study Needs
Alaska Mapping Business Plan
Integrating Mapping, Assessment, and Mitigation Planning
| 109
Fig
ure
24:
Map
of
Ran
kin
gs o
f W
ater
shed
s B
ased
on
Sce
nar
io 1
Alaska Risk MAP Data Acquisition, Analysis and Prioritization of Future Study Needs
Alaska Mapping Business Plan
Integrating Mapping, Assessment, and Mitigation Planning
110 |
Table 26: Ranking of Alaska’s HUC-8 Watersheds Based on Scenarios 1-4 Table 26: Ranking of Alaska’s HUC-8 Watersheds Based on Scenarios 1-4
Alaska Risk MAP Data Acquisition, Analysis and Prioritization of Future Study Needs
Alaska Mapping Business Plan
Integrating Mapping, Assessment, and Mitigation Planning
| 111
(continued) Table 26: Ranking of Alaska’s HUC-8 Watersheds Based on Scenarios 1-4
Alaska Risk MAP Data Acquisition, Analysis and Prioritization of Future Study Needs
Alaska Mapping Business Plan
Integrating Mapping, Assessment, and Mitigation Planning
112 |
Table 27: NFIP-Participating Communities by Ranked HUC-8 Watershed
Alaska Risk MAP Data Acquisition, Analysis and Prioritization of Future Study Needs
Alaska Mapping Business Plan
Integrating Mapping, Assessment, and Mitigation Planning
| 113
(continued) Table 27: NFIP-Participating Communities by Ranked HUC-8 Watershed