165


Alaska Broadband Audit Report | May 2015 Page | 2
TABLE OF CONTENTS Executive Summary ....................................................................................................................................... 4
Introduction .................................................................................................................................................. 7
The Alaska Broadband Education Gap .......................................................................................................... 9
National Benchmarks and Key Statewide Findings ................................................................................... 9
Regional Analysis of the School Broadband Gap .................................................................................... 33
Central Region ..................................................................................................................................... 35
Southeastern Region ........................................................................................................................... 41
Western Region ................................................................................................................................... 46
Northern Region ................................................................................................................................. 51
Southwestern Region .......................................................................................................................... 55
Impact of the Alaska Broadband Education Gap on Student Opportunities and Instruction .................... 59
E-Rate and Alaska Education ...................................................................................................................... 63
E-Rate Funding Levels in Alaska .............................................................................................................. 64
How the E-Rate Works ............................................................................................................................ 66
E-Rate Support for Broadband in Alaska ................................................................................................. 68
Recent FCC Rate Changes ....................................................................................................................... 71
Future E-Rate Opportunities ................................................................................................................... 73
Recommendations for Action ..................................................................................................................... 76
About the Alaska School Broadband Audit Project .................................................................................... 81
Data Visualization Portal ......................................................................................................................... 82
Validation Process and Data Collection .................................................................................................. 87
Validation Process ............................................................................................................................... 88
Data Collection .................................................................................................................................... 89
External Data Resources ......................................................................................................................... 90
Needs Assessment Methodology ............................................................................................................ 91
Conclusion ................................................................................................................................................... 94
Appendix ..................................................................................................................................................... 95
Appendix 1: Broadband: A Critical Element of Education in Alaska White Paper ................................. 96
Appendix 2: Site Validation Examples .................................................................................................. 106
Appendix 3: School District Summary Pages ....................................................................................... 112

Alaska Broadband Audit Report | May 2015 Page | 3

Alaska Broadband Audit Report | May 2015 Page | 4
EXECUTIVE SUMMARY
Robust broadband access has become a necessity for quality learning in the classroom. In Alaska’s mostly rural and remote school districts the state’s 128,000 K-12 public school students risk landing on the wrong side of the digital divide as terrain, remoteness, and climate challenges create obstacles for ubiquitous coverage. To explore the extent to which Alaska’s students have adequate access to these new digital learning technologies, in 2014, Connect Alaska partnered with the Alaska Department of Commerce, Community, and Economic Development to undertake the Alaska School Broadband Audit, a first-of-its-kind project designed to better understand how Alaska school districts access and use broadband. The Audit has been funded by the U.S. Department of Commerce, National Telecommunications and Information Administration’s State Broadband Initiative grant program. Through the Alaska School Broadband Audit project, Connect Alaska conducted a series of rigorous data collection projects, destined to capture the current state and future broadband needs of K-12 public school districts in Alaska. Connect Alaska gathered this data through a number of different methods and then validated that data through direct, on-site visits to all 53 school districts in the state, from Anchorage to the most remote Native Villages. While on the ground, engineers assessed the state of a school’s broadband and infrastructure while conducting on-site interviews with administrators and technical teams. To supplement the information gathered at the school level, research teams compiled information from various state and national resources to create a comprehensive database that is comprised of demographic, socio-economic, and geographic information. Connect Alaska also conducted an assessment of school technology needs, by means of a series of online and telephone surveys of Alaska educators and school IT professionals. This assessment collected information from 55 Alaska schools to examine current broadband infrastructure in educational institutions, how students are accessing the Internet for school work, and what educational opportunities might be available to students through more robust access to online resources. This Report contains summary results of this research and demonstrates that there are significant and substantial broadband gaps in Alaska’s K-12 schools. The Report 1) examines the various characteristics, needs, and future challenges of Alaska’s K-12 schools, including how Alaska schools compare to national benchmarks; 2) includes a regional assessment of connectivity; 3) contains a discussion of federal E-rate changes and what that means for Alaska schools; and 4) presents a series of recommendations for action and suggested areas of further study. Key findings include:
� 42% of Alaska schools do not meet the current E-rate short-term benchmark of 100 Kbps per student and staff member.
� Nearly all (93%) of schools in Alaska have speeds of less than 1000 Kbps per student and staff member, the long-term national goal for connectivity.
� Schools in high poverty areas are the least likely to meet these federal benchmarks as they have the lowest connectivity. For schools in areas with a poverty rate of 30% or greater, the average connectivity is only 43 Kbps per student and staff.

Alaska Broadband Audit Report | May 2015 Page | 5
� Schools that comprehensively serve grades K-12 have the lowest connectivity among school types.
� School districts serving primarily Native American populations face the greatest capacity challenges.
From an infrastructure standpoint, 24% of K-12 public schools are forced to use satellite service as their main method of connectivity because of the remote and inaccessible nature of many of the districts. The satellite connectivity results in poor latency, affecting the quality of the broadband to which schools have access. Wide Area Networks (WANs) benefit education by allowing for distance learning opportunities and access to content on a district-wide basis, and while 42 of 52 districts report use of a WAN, very few of those meet federal capacity benchmarks. Lastly, 96% of the schools report that they have Wi-Fi connectivity in classrooms, but two-thirds of the schools state that connectivity is inadequate. Through broadband technology, Alaska educators have the opportunity to greatly improve the learning experience for students in even the most remote of areas. This Report also includes several recommendations to help bridge these broadband gaps. Most importantly, this Report calls on the state and Alaska school districts to develop programs that will maximize the amount of funds that the federal E-rate program will pay for broadband connectivity for K-12 schools. Alaska is at risk of leaving millions of dollars of funding on the table – funding that could be used to connect schools and students. For example, in 2014, the Alaska State Legislature created the School Broadband Assistance Grant program and appropriately targeted schools with poor access to improve capacity to 10 Mbps – a much-needed, albeit temporary, improvement in school infrastructure. However, that funding is not permanent and, as of this writing, is not funded beyond June 2015. Were the $5 million in funding for this program to be available permanently, Connect Alaska estimates that an additional $39 million in E-rate funds to upgrade broadband in those targeted schools would follow. As of this writing, funding for this connectivity will expire in June 2015, thus leaving schools without long-term options for sustaining the improved speeds. Other recommendations include:
� Advancing and exploring procurement processes for IT purchasing, to help school districts obtain better prices for contracted services;
� Continuing to collect data on connectivity, particularly as technology changes and school districts rapidly adopt new digital methods of learning;
� Further researching digital curricula, devices, and technology learning applications; and � Further study of the effects of on-campus and off-campus connectivity solutions on school
technology programs.
Now that the federal government has set aggressive connectivity targets for K-12 schools – and has made considerable funding available to schools to upgrade their broadband connections to meet those goals by 2020 – improving broadband in Alaska schools is at its most crucial point. If Alaska does not move aggressively to have its schools meet these national benchmarks, Alaska schools and students risk falling further behind. As educators work to solve these issues and others, the Alaska Broadband Audit hopes to serve as a mechanism for informed action to benefit the students of Alaska’s public education system.

Alaska Broadband Audit Report | May 2015 Page | 6

Alaska Broadband Audit Report | May 2015 Page | 7
INTRODUCTION
In 2014, Connect Alaska embarked on the Alaska School Broadband Audit project to fully understand the needs of the state’s educational institutions. In a state so large and diverse with 72% of schools located in rural areas, Connect Alaska set out to travel the districts, collect and analyze data, and talk with administrators and technology teams to gain priceless information on how schools use technology, the speeds and connectivity with which they are working, and their current and perceived future needs. Understanding that broadband has the power to bring world-class learning opportunities to even the most remote of regions, Alaska educators were found to be pursuing education technology endeavors with great commitment and enthusiasm. However, many schools suffered from slow speeds, poor bandwidth, insufficient latency, and outdated devices. At a time when the Federal Communications Commission (FCC) has set Gigabit connectivity and ubiquitous in-school Wi-Fi as key targets for the E-rate program, these connectivity challenges are more important to document and work toward overcoming now than ever before. With insufficient school broadband, Alaska students are at risk of falling into a widening digital divide that will even further hinder educational opportunities. An important purpose of the Audit is to provide complete, comprehensive, and validated information and data to educators, school administrators, parents, and policymakers. This data includes bandwidth capacity and quality at schools, the prices paid for that connectivity, the technologies used for broadband, and the number and age of school-provided electronic devices, such as tablets, computers, or laptops, used in K-12 schools. By taking the data gathered from surveys, site visits, and state and national external resources, Connect Alaska prepared an in-depth analysis of broadband and education in Alaska, reviewing Alaska’s movement toward national benchmarks, regional comparisons, E-rate changes and implications for Alaska schools, and recommendations for closing the digital divide in the state. The substantial information gathered was also presented in an online visualization portal and district-by-district summaries (See Appendix 3) were created for efficient use by local and state educators. The collection and presentation of broadband infrastructure and use across Alaska allows state leaders to take informed action toward improving the quality of the educational experience for students as even the most remote areas seek to gain access to affordable and reliable Internet service.

Alaska Broadband Audit Report | May 2015 Page | 8

Alaska Broadband Audit Report | May 2015 Page | 9
THE ALASKA BROADBAND EDUCATION GAP
In Alaska where a significant number of schools are located off the road system in rural and remote areas, broadband connectivity is essential to the education of the state’s students. As more and more districts are participating in 1:1 initiatives and engaging in distance learning, connectivity challenges are hindering educational successes like never before. Across the state, a number of challenges create a broadband education gap among the state’s high poverty areas, those with significant Native American populations, and those located in rural and remote villages. Slow broadband speeds that fail to meet national benchmarks, high costs for services in remote areas, poor quality Wi-Fi, inadequate latency, and underutilized WAN potential are just a few of the issues that Alaska schools face daily. To analyze these issues fully and explore how they are contributing to an education gap, this Report first looks at the state as a whole and its connectivity compared to national benchmarks, and then compares the various regions of the state to pinpoint areas of particular need. National Benchmarks and Key Statewide Findings The goal of the Alaska School Broadband Audit was to assess and identify gaps in the availability, quality and use of broadband and broadband-enabled technology at Alaska’s K-12 public schools, to determine the progress that the Alaska K-12 education system is making with regard to advanced, digital, and distance learning. As discussed elsewhere in this Report, digital learning and broadband technology can give Alaskan students, particularly those in rural areas, access to a world of learning opportunities. In addition, distance learning and broadband can offer significant savings in educating Alaskan youth, allowing smaller, more rural districts to share resources and curricula, offer an increased variety in educational opportunities, and potentially lower the cost of classroom instruction overall. To undertake this analysis, Connect Alaska collected and validated the adoption, quality, and use of broadband service and broadband-enabled technology at Alaska’s K-12 public schools, including information from 53 districts in the state. Connect Alaska network engineers collected and validated dozens of pieces of individual data, working directly with school administrators, teachers, and IT staff to ensure that the Audit dataset is the most comprehensive and accurate collection of K-12 school broadband and technology data ever collected. As discussed below, all of this data is available through the Connect Alaska School Broadband Audit website, for the public and policymakers to access and compare individual school and district information. The dataset also allows for considerable analysis of trends both on a state and regional basis. The Audit data reveal that there are substantial gaps in the availability, adoption, and use of broadband and broadband-enabled technology in Alaska, and that Alaska K-12 students risk falling behind national benchmarks that have been set for school and district Internet connectivity.

Alaska Broadband Audit Report | May 2015 Page | 10
I. 93% of Audited Alaska K-12 schools do not meet the national benchmark of 1000 Kbps per student and staff.
The “connected school” is a sophisticated environment for information technology and broadband usage. In a relatively confined space such as a classroom or school wing, dozens of students and teachers frequently and simultaneously use a myriad of devices and online applications and services, all of which need to be independent of one another and have sufficient capacity. Compared to a typical American household, which has on average only 7 Internet-connected devices,1 the Internet needs of school buildings and classrooms are substantially greater. To address these needs, in 2015, the FCC established Internet connectivity benchmarks for K-12 schools that are based upon the amount of Internet capacity for each student and staff.2 Table 1: K-12 School Internet Capacity Benchmarks
Short Term Long Term (by 2020) 100 Mbps for each 1000 student and staff/ 100 Kbps for each student and staff
1 Gbps for each 1000 student and staff/ 1000 Kbps for each student and staff
The FCC established these national benchmarks to assist in managing the nation’s largest educational technology funding program, the E-rate program. As discussed below, the FCC has implemented a number of programs inside the E-rate program designed to assist school districts in meeting these speed benchmarks. Indeed, certain programs designed to help fund network construction are limited only to fund projects that will meet the long-term connectivity goal. As evidenced in the Audit, Alaska schools are not on pace to meet either of these national benchmarks. Forty-two percent (42%) of audited schools (198 of 471) have connectivity of less than 100 Kbps for each student and staff, which is the FCC’s near-term goal for school broadband connectivity accounting for 63,724 underserved students. Ninety-three percent (93%) of the schools audited (439 of 471) do not have connectivity at 1000 Kbps for each student and staff. On average, K-12 schools in Alaska have 246 Kbps of connectivity for each student and staff. This is well shy of the FCC and SETDA benchmark of 1000 Kbps for each student and staff member. Below, Table 2 shows that schools not meeting the nationwide benchmarks are located in all areas of the state, in urban and rural areas, and in areas with different poverty rates. Failure to meet these standards is seen in all regions across Alaska, as Figure 1 shows.
1 Federal Communications Commission, 2015 Broadband Progress Report, GN Docket No. 14-126, FCC 15-10 (rel. Feb. 4, 2015), available at: http://www.verizon.com/cs/groups/public/documents/adacct/bandwith-and-multipledevice.pdf, at para. 29. 2 Federal Communications Commission, Modernizing the E-rate Program for Schools and Libraries, WC Docket No. 13-184, Order and Further Notice of Proposed Rulemaking, 29 FCC Rcd 8870 (2014) (First E-rate Modernization Order), available at: https://apps.fcc.gov/edocs_public/attachmatch/FCC-14-99A1.pdf, at paras. 34-38.

Alaska Broadband Audit Report | May 2015 Page | 11
Table 2: Regional Benchmark Analysis
Regions
Total Audited Schools With
Reported Connectivity
Number of Schools With Connectivity
of <100 Kbps/
Student-Staff
Number of Schools With Connectivity
of <1000 Kbps/
Student-Staff
Average Connectivity/ Student-Staff
(Kbps)
Statewide 471 198 439 246
Rural3 333 129 310 301 Urban 138 69 129 201
Central 263 95 241 265 Northern 57 34 57 52 Southeastern 60 13 54 383 Southwestern 35 22 34 55 Western 56 34 53 115
Air 159 95 155 79 Ferry 75 15 65 466 Road System 237 88 219 249
Northern, air only access; satellite as primary network access 57 34 57 52
Road-based access and fiber access; large student population in large sites 232 88 213 255
Road system; fiber access, medium to small schools 18 8 18 117
Southeast, ferry as primary access; microwave or fiber access in most 62 7 53 549
Southwestern Rural remote, air access only; generally small sites with primarily satellite and some microwave
35 22 34 55
Western, air only access and either satellite or microwave; large student population primarily spread over many small sites
67 39 64 112
3 This analysis utilizes definitions of “rural” and “urban” schools and districts adopted by the FCC in December 2014 for use in the E-rate program, as the E-rate program provides a substantial share of funding for broadband connectivity for Alaska K-12 schools and libraries. Those new FCC rules regard the Anchorage, Fairbanks, and Matanuska-Susitna school districts as “urban” and all other school districts in Alaska as “rural.” The FCC E-rate program regards a school as being “urban” if it is located in an area regarded by the U.S. Census Bureau as an “Urbanized Area” or an “Urban Cluster” with a population of 25,000 or more. A school is regarded as being “rural” if it is not regarded as “urban.” To determine whether a particular school district is “urban” or “rural” is based on whether the majority of schools in that district fall into either the “urban” or “rural” category. Because school district boundaries do not necessarily follow U.S. Census Bureau geographies, an “urban” district may have “rural” schools. For example, in the Anchorage school district, 11 schools are located in “rural” areas.

Alaska Broadband Audit Report | May 2015 Page | 12
School districts with largest share of White students 306 104 278 278
School districts with largest share of American Indian or Alaska Native students 163 92 159 86
Poverty rate of 10% or less 245 97 226 252 Poverty rate between 10% and 21% 100 30 89 386 Poverty rate between 21% and 30% 90 44 88 105 Poverty rate of 30% or more 36 27 36 43
Figure 1: Map Highlighting Regional Benchmark Analysis

Alaska Broadband Audit Report | May 2015 Page | 13
II. The Alaska School Broadband Assistance Grant program appropriately targeted
schools that did not meet broadband capacity benchmarks; however, those grants were temporary and these recipient districts are now at risk of backsliding.
In 2014, the Alaska State Legislature created the School Broadband Assistance Grant program (School BAG). The program is administered by the Alaska State Library and assists schools in reaching Internet download speeds of 10 Mbps from February through June 2015. School districts that have less than 10 Mbps download speeds could apply for School BAG funds; the Alaska State Library awarded nearly $5 million in funds in February 2015 to 27 school districts. The School BAG grants are offered to assist districts in paying for their portion of Internet connectivity through the FCC’s E-rate program.4 The Legislature made $5 million available for Fiscal Year 2015 for connectivity through June 2015 only, and as of this writing, funding for the program has not been renewed for Fiscal Year 2016. At the time Connect Alaska began to collect Alaska School Broadband Audit data, the School BAG grants had not been awarded, and connectivity generally had not been upgraded at recipient school districts. The Audit data does show that the School BAG grants were targeted to school districts that had the most need for broadband Internet connectivity. However, even with these grants that would bring school connections up to 10 Mbps for five months, connectivity for many schools in the targeted districts would still falls short of nationwide connectivity benchmarks.
4 For a discussion of the E-rate program and Alaska, see the E-Rate and Alaska Education section of this report.

Alaska Broadband Audit Report | May 2015 Page | 14
Twenty-seven Alaska school districts received School BAG grants in 2015, for a total of $4.909 million. Table 3: School BAG Grants by School District
School District FY 2015 School BAG Grants
Alaska Gateway $236,548.20 Aleutians East $164,383.24 Aleutian Region $217,907.69 Bering Strait $553,482.92 Bristol Bay $85,503.02 Chatham $73,073.28 Chugach $292,457.76 Dillingham City $149,903.27 Hoonah City $18,414.40 Iditarod Area $209,840.84 Kashunamiut $33,232.71 Kenai Peninsula $21,687.07 Kuspuk $151,920.97 Lake and Peninsula Borough $358,992.42 North Slope Borough $255,520.00 Northwest Arctic Borough $480,014.89 Pelican City* $40,155.40 Pribilof $19,991.06 Saint Mary's $66,089.58 Southeast Island $392,114.36 Southwest Region $564,631.70 Tanana City $79,224.41 Unalaska City $46,327.98 Yakutat $24,718.81 Yukon Flats $183,966.80 Yukon-Koyukuk $127,392.07 Yupiit $102,327.08
Source: Alaska State Library. *Pelican City was unable to make the network upgrade and returned these grant funds in Fiscal Year 2015.

Alaska Broadband Audit Report | May 2015 Page | 15
Case Study 1: St. Paul School, Pribilof School District St. Paul School is located on the remote Pribilof Island group on Saint Paul Island in the Bering Sea. The school is a single structure that educates students in Kindergarten through Grade 12 with the district office on site as well. The district is working to implement 1:1 initiatives and currently exceeds the state average in device availability in the classroom. However, the ability to realize the full potential of this digital transition has been severely limited by the insufficient network in the classroom. While the district currently possesses a sufficient LAN, the WAN has previously been connected to the Internet with satellite at a speed of only 1.5 Mbps. The speed gap substantially limited what the district was able to implement for curriculum and required the on-site location of many services that would be better served to the school if bandwidth allowed cloud services to be used. As part of the School BAG program, St. Paul School has had that capacity expanded to 10 Mbps – but this increased speed is only available until the end of June. Assuming there will be no funding for additional bandwidth from the state beyond that date, the Pribilof Island School District is planning to drop back to 4 Mbps, with 2.5 Mbps being dedicated to St. Paul School. With a small student population of 82 district-wide, sustained robust speeds would allow for services that could be accessed off-site and would offer many more options for extended learning.
In general, School BAG grants went to the most severely challenged districts in the state, including those with severe connectivity gaps and vulnerable populations. Of the $4.9 million awarded, 69% went to districts in which the average Kbps per student and staff was below the 100 Kbps near-term FCC benchmark.

Alaska Broadband Audit Report | May 2015 Page | 16
The vast majority of funding – $3.6 million – went to districts that serve predominantly Native American student populations. Schools generally off the road system and in communities with high poverty rates also received most of the School BAG funding. Table 4: School BAG Funding and Student and Staff Population
Total School BAG Funding
Total Number of Students and
Staff Statewide $4,909,666.53 139,029 Central $760,533.87 104,423 Southwestern $1,607,640.38 9,806 Southeastern $508,320.85 12,565 Northern $1,679,601.09 2,660 Western $353,570.34 9,575
School Districts with average connectively <100 Kbps/Student-Staff $3,372,188.55 69,986 School Districts with average connectively >=100 Kbps/Student-Staff $1,537,477.98 67,941
Rural $4,909,666.53 51,542 Urban - 87,487
Air $4,143,110.41 22,687 Ferry $508,320.85 15,819 Road System $258,235.27 100,523
School districts with poverty rate of 10% or less $178,236.88 105,577 School districts with poverty rate between 10% and 21% $1,673,169.49 15,927 School districts with poverty rate between 21% and 30% $2,185,250.65 11,912 School districts with poverty rate of 30% or more $873,009.51 5,613
School districts with Largest share of Caucasian students $1,062,208.65 115,824 School districts with Largest share of American Indian or Alaska Native students $3,629,550.19 23,164
Were School BAG funding still available and made permanent, the number of Alaska schools that would meet the FCC’s near-term goal for school connectivity of 100 Kbps for each student and staff member would increase substantially. Because many of the schools in grantee districts serve small student body populations, even a connection of 10 Mbps can have a dramatic impact. Table 5 below outlines the impact that upgrading schools in the grantee districts to a minimum of 10 Mbps would have on Alaska’s progress toward meeting this goal.

Alaska Broadband Audit Report | May 2015 Page | 17
Table 5: Impact of BAG Funding on Increase Connectivity
School District
Total Number
of Schools
in District
Number of Schools with Connectivity ≥100 Kbps/Student-
Staff
Before BAG
Funding
After BAG Funding Difference
Alaska Gateway School District 8 4 7 3 Aleutian Region School District 2 0 2 2 Aleutians East Borough School District 5 4 4 0 Anchorage School District 97 19 19 0 Annette Island School District 4 4 4 0 Bering Strait School District 15 4 8 4 Bristol Bay Borough School District 3 0 2 2 Chatham School District 5 3 3 0 Chugach School District 4 0 2 2 Copper River School District 5 2 2 0 Cordova City School District 3 0 0 0 Craig City School District 4 3 3 0 Delta Greely School District 6 2 2 0 Denali Borough School District 4 3 3 0 Dillingham City School District 3 0 0 0 Fairbanks North Star Borough School District 35 34 34 0 Galena City School District 4 0 0 0 Haines Borough School District 3 1 1 0 Hoonah City School District 2 0 0 0 Hydaburg City School District 2 1 1 0 Iditarod Area School District 8 6 7 1 Juneau Borough School District 14 5 5 0 Kake City School District 1 1 1 0 Kashunamiut School District 1 0 0 0 Kenai Peninsula Borough School District 43 40 40 0 Ketchikan Gateway Borough School District 10 9 9 0 Klawock City School District 1 0 0 0 Kodiak Island Borough School District 14 13 13 0 Kuspuk School District 9 7 8 1 Lake and Peninsula Borough School District 14 7 13 6 Lower Kuskokwim School District 28 13 13 0 Lower Yukon School District 10 0 0 0

Alaska Broadband Audit Report | May 2015 Page | 18
Matanuska-Susitna Borough School District 45 43 43 0 Nenana City School District 2 0 0 0 Nome Public Schools 5 2 2 0 North Slope Borough School District 11 3 3 0 Northwest Arctic Borough School District 13 2 4 2 Pelican City School District 1 0 0 0 Petersburg City School District 3 3 3 0 Pribilof Island School District 2 0 2 2 Saint Mary's School District 1 0 0 0 Sitka School District 6 5 5 0 Skagway School District 1 0 0 0 Southeast Island School District 10 8 8 0 Southwest Region School District 7 2 4 2 Tanana City School District 1 1 1 0 Unalaska City School District 2 0 0 0 Valdez City Schools 4 2 2 0 Wrangell Public School District 3 3 3 0 Yakutat School District 2 1 1 0 Yukon Flats School District 7 5 5 0 Yukon-Koyukuk School District 10 8 9 1 Yupiit School District 3 0 0 0 Statewide 506 273 301 28
Had the School BAG grants been permanent, the percentage of Alaska public schools that would meet the near-term connectivity goal of 100 Kbps for every student and staff member would at least increase by 6%, to 64% of Alaska K-12 schools. The upgrades in districts receiving School BAG grant funds would have brought most of the schools in those districts up to and beyond the near-term connectivity goal of 100 Kbps/student and staff. In addition, if School BAG funding were permanent, Connect Alaska estimates that the $5 million invested in School BAG connectivity grants would create $39.7 million in additional funds from the federal E-rate program. This surge would more than double the amount of E-rate funds that Connect Alaska estimates that Alaska schools received for their broadband connections in 2014. However, this progress and these benefits are at risk, because these upgrades were only funded for five months. As of this writing, the School BAG program has not been funded beyond June 2015. As a result, school districts are now facing difficult decisions as to whether they can afford to keep this upgraded connectivity, or be forced to lower bandwidth. Connect Alaska field teams have heard of schools that will, out of financial necessity, be ramping down broadband capacity in the coming school year because of this funding shortfall. While the School BAG program held great promise for closing at least the near-term connectivity gap for many Alaska schools, that progress was fleeting.

Alaska Broadband Audit Report | May 2015 Page | 19
III. K12 schools have the lowest connectivity of Alaska Public Schools. In many remote parts of the state, numerous schools comprehensively serve students Kindergarten through Grade 12 and act as a crucial part of the Alaskan public education system. In the Audit dataset, there are 196 of these K12 schools serving 22,284 students. These schools are frequently small, are often off the road system, and must serve a wide and diverse array of students, ranging in age from 5 to 18. As can be expected, K12 schools have to offer a wide array of curricula to their students, and faculty need to be expert and conversant in a number of subjects. As a result, students and educators in these K12 institutions in Alaska likely have the most to gain from broadband technology and digital learning, as this technology holds the promise of opening up a broad array of educational materials and wider connections to teachers and student peers. However, as a group, Alaska K12 schools are the most disconnected in the state. In terms of Internet access capacity available to students and staff, K12 schools have significantly lower broadband connectivity than dedicated elementary, middle, and high schools. The average K12 school in Alaska has connectivity of 118 Kbps per student and staff, well below the statewide average of 246 Kbps for each student and staff. In addition, the cost of providing this broadband to K12 schools in the state is substantially more costly than other schools – over $110 per month for every student and staff member, compared to $30 per month statewide.

Alaska Broadband Audit Report | May 2015 Page | 20
Case Study 2: Whittier Community School, Chugach School District
Whittier is a very beautiful, yet remote, town located on Prince William Sound just 60 miles southeast of Anchorage. Because of its prime location more than 700,000 tourists and visitors come each year. Whittier Community School educates the community’s 35 students of all grades, from pre-K through Grade 12. Connect Alaska engineers observed first-hand that broadband access is a challenge for this destination community. However, the costs of increasing bandwidth to 20 Mbps, including covering the network management and improvements needed, are estimated to be $50,000. For the small school, these costs are prohibitive and network upgrades cannot be made at this time. Increasing connectivity in the school would greatly impact student learning and no doubt have a ripple effect on the community’s efforts to remain a tourist destination and gateway.
Table 6: Connectivity and Technology by School Type
School Type Connectivity (Kbps/Student-Staff) Devices/Student
Broadband Monthly
Cost/Student-Staff
Broadband Monthly
Cost/Mbps K12 schools 118 0.81 111 943 Elementary 257 0.51 12 46 Middle or High schools 291 0.58 13 46 Statewide 246 0.59 30 122

Alaska Broadband Audit Report | May 2015 Page | 21
Without a doubt, this level of broadband service at K12 schools in Alaska is related to their generally rural and remote nature as well as their small size. Telecommunications networks have high fixed costs and substantial economies of both scale and density, which mean that purchasing relatively low levels of bandwidth to serve a smaller population will result in higher per-megabit and per-student costs. As a result, relatively remote and smaller K12 institutions are less likely to benefit from the economies of scale and density that are characteristic of broadband connectivity. That said, as discussed below, another finding of the audit is that rural and off-road schools in Alaska tend to have greater connectivity on a per-student and staff basis than their urban counterparts despite these higher costs. This finding indicates that demand for broadband in education in rural and off-road settings is strong, in spite of the substantial cost challenge. However, broadband to K12 institutions statewide as a group lags substantially. Recognizing the significant broadband gap these schools face is important as the broadband gap is likely to hinder educational opportunities for Alaska students attending K12 schools. IV. Schools with high poverty rates have lower connectivity and pay more for the
connectivity they receive. Even when compared to peers in their district and region, schools located in communities with high poverty rates are substantially less connected than schools in lower-poverty communities.

Alaska Broadband Audit Report | May 2015 Page | 22
Table 7: Speed and Cost by School Classification/Poverty Rate
School Urban/Rural Classification Under E-rate
Rule
Poverty Rate Kbps/Student-Staff
Total Monthly Cost/Student-
Staff
Total Monthly
Cost/Mbps
Rural
Poverty rate of 10% or less 369 $12 $32
Poverty rate between 10% and 21% 386 $69 $180
Poverty rate between 21% and 30% 115 $121 $1057
Poverty rate of 30% or more 43 $163 $3790
Urban
Poverty rate of 10% or less 204 $6 $30
Poverty rate between 21% and 30% 24 $13 $550
Statewide
Poverty rate of 10% or less 252 $8 $31
Poverty rate between 10% and 21% 386 $69 $180
Poverty rate between 21% and 30% 105 $110 $1044
Poverty rate of 30% or more 43 $163 $3790
Table 7 shows that statewide, schools in communities with a poverty rate of 30% or above – schools serving nearly 4,900 students – have an average connectivity of only 43 Kbps per student and staff, about one-sixth of the statewide average of 246 Kbps/student and staff. Schools with poverty rates between 21% and 30%, serving another 10,000 students, have connectivity of 105 Kbps/student and staff.

Alaska Broadband Audit Report | May 2015 Page | 23
Just as importantly, on a price per megabit basis, these schools are paying more for their service. Schools in communities with more than 30% poverty pay on average over $3,790 per megabit per month, compared to only $31 per megabit per month in areas with poverty below 10%. While some variation in service quality and cost can be expected based on regional differences Table 7 shows that this relationship between lower speeds and higher costs in high poverty areas is true when only rural schools are analyzed. Low-poverty rate rural schools have more robust connectivity (369 Kbps/student and staff) and pay less on a per-megabit per month basis ($32 per megabit per month) than high-poverty schools in similar rural and remote areas. V. Technology options and latency impede broadband and digital learning in many parts
of the state. The quality of broadband service is not only related to the raw capacity (speed) of the connection, but also the latency of that communication channel. Latency is the time it takes for a broadband communication to travel round-trip from a point in the school to servers on the Internet (which can be located around the world) and back again. Generally speaking, satellite broadband services, which require communication to reach a satellite over 22,000 miles high, have higher latency than land-based systems. A connection with high latency will impede applications that involve real-time interactivity, such as some online testing, distance learning, and two-way voice and video communications. Because of the remote and inaccessible nature of much of Alaska, many schools depend on satellite service for ultimate Internet connectivity. As Table 8 shows below, 24% of K-12 public schools in Alaska depend on satellite technology to connect to the Internet. Table 8: Technology Adoption Among Schools and Students
Technology Number of Schools Number of Students
Fiber Optic 149 (31%) 49,922 Other Wireline (DSL, cable) 152 (32%) 56,543 Wireless (fixed, mobile, microwave) 53 (11%) 7,871 Satellite 116 (24%) 9,725 Other 9 (2%) 1,151 Total 479 125,212
As explored in the regional discussions below, there are significant differences in technology choices based on regions. A school may indeed have a strong, robust physical connection to other local schools or institutions in a remote community, but that community itself might be served through a satellite connection. This satellite connection will impact the effectiveness of digital learning in those classrooms. As part of the Audit and site visits, Connect Alaska engineers conducted speed tests at school locations to test the quality and latency of this connection. Also, as part of the data collection effort, school administrators and IT staff were given access to a speed test tool. In general, latency information was obtained for a vast majority of districts in Alaska. These test results are broken into three categories:

Alaska Broadband Audit Report | May 2015 Page | 24
� Round Trip Latency Less than 100 milliseconds (ms), which is sufficient to support robust digital learning, online testing, and two-way voice and video distance learning;
� Round Trip Latency between 100 ms and 300 ms, which is sufficient to support some digital learning applications and online testing, but will adversely impact two-way voice and video distance learning ; and
� Round Trip Latency over 300 ms, which will generally be insufficient to support many digital learning applications and online testing needs, and which present a substantial barrier to robust two-way voice and video distance learning.
Sorting Audit school speed test results into groupings based on these categories of latency shows that schools educating the majority of Alaska K-12 students have round-trip latency of 100 ms or better, but that there are significant differences in the quality of the online educational experience for many students due to latency. Table 9: Latency’s Impact on Student Device Use
Students Devices/ Students
Total Broadband Monthly
Cost/Student-Staff
Kbps/Student-Staff
100 ms or better 112,650 0.56 $15.91 261 100 ms to 300 ms 819 0.68 $177.04 441 Greater than 300 ms 10,716 0.93 $160.41 70 Statewide 124,185 0.59 $29.79 246
Table 9 shows that schools suffering from high latency are nevertheless committed to digital technology and learning. These schools tend to have significantly more devices (computers, laptops, or tablets) per student, nearly one for each student in audited schools. In addition, these schools pay as much per month for broadband as schools in the best quality latency tier. However, the broadband capacity these schools receive for that cost is substantially lower – 70 Kbps for each student and staff member, compared to 261 Kbps for each student and staff member in schools with latency at 100 ms or better. Schools facing latency challenges are generally located off the road and ferry system and in the remote areas of the state. The following map of Audit latency test results by latency groupings, demonstrates that latency issues persist in the rural and remote areas of the state where wireline and even fixed wireless/microwave capacity is either not present or limited.

Alaska Broadband Audit Report | May 2015 Page | 25
Figure 2: School Latency in the State of Alaska
In addition, on a per-student and staff basis, high-latency broadband costs schools ten times as much per month ($160 per month) as schools with latency of 100 ms or better ($16 per month). This is of course a function of the fact that these schools are located in rural and remote areas, are more likely to rely on satellite connectivity, and are less able to take advantage of the economies of scale and density associated with broadband networks. VI. Rural and off-road schools have higher broadband capacity and more devices per
student than urban or on-road schools. Demonstrating the value of these tools as an important component of cost-effective education, demand for digital learning tools and applications is strong in the most rural and remote parts of Alaska. Approximately two-thirds of K-12 public schools in Alaska are located in areas regarded by the E-rate program as rural, and these schools serve approximately 40% of Alaska K-12 public school students. As discussed below, the federal E-rate program funds a discount for broadband and other telecommunications costs purchased by all K-12 schools.

Alaska Broadband Audit Report | May 2015 Page | 26
Case Study 3: Haines Borough School District The Haines School District has taken great strides in ensuring their students have access to digital learning and has more devices available to students than the state average. Currently, the high school, located in southeastern Alaska with access primarily by ferry, has 1:1 initiatives implemented with middle school students expected to benefit from a similar program by the end of the year. The district has plans to connect elementary schools with 1:1 devices following these initial rollouts. Although their network currently meets the needs of the students and staff, capacity is limiting the district’s progress forward. Connections to higher education facilities, videoconferencing, two-way distance learning applications, and other tele-learning opportunities are not being fully utilized due to bandwidth issues. The community’s residential Internet access also limits the use of broadband due to high costs and poor reliability of service.
Despite a higher poverty rate and generally more costly broadband connectivity, students and staff at E-rate rural school districts have access to higher broadband capacity and considerably more Internet-connected devices on a per student basis than urban schools.
Table 10: Rural and Urban Schools Breakdown
Rural Schools Urban Schools
Students 51,379 80,082 Poverty Rate 13.0% 8.4% Kbps/Student-Staff 301 201 Broadband Cost/Student-Staff After E-rate Discount $9.70/month $2.07/month Connected Devices/Student .76 .46 Average Age of Devices 4.55 years 4.60 years It is important to note that the monthly cost for connectivity reported above is after application of FCC E-rate discounts. The FCC E-rate program offers larger discounts to districts with higher poverty levels

Alaska Broadband Audit Report | May 2015 Page | 27
and in rural areas – and yet, even after these steeper discounts are applied, rural school districts spend more on broadband connectivity on a per student and staff basis than their Alaska urban counterparts. Additionally, these rural districts purchase more broadband capacity, relatively speaking. This finding demonstrates the clear need for greater broadband connectivity in rural Alaska. Moreover, as discussed above, Alaska schools in both urban and rural areas are not on track to meet national benchmarks for broadband connectivity. While rural schools may currently offer higher broadband capacity and devices to students than urban schools, both are at risk of falling behind the robust school connectivity that is being deployed in the Lower 48. In addition, the Audit did not study or collect data on the relative use of devices in the classrooms by schools by teachers and students. A school may have more devices on a per-student basis but may not use or integrate those devices intensely into education. Of course, in Alaska, simple “urban” and “rural” categories are generally insufficient in painting a complete picture. As Connect Alaska field engineers traveled the state to investigate school connectivity, they learned first-hand how many communities and school districts are accessible only through air or primarily through the ferry system. Table 11 demonstrates some important key differences between communities on the road system and those accessible only by air or water. These findings demonstrate the clear demand for broadband in the most inaccessible areas of Alaska. On a per-student basis, there are twice as many connected student devices in schools not on the road system as in schools on the road system. In fact, there is nearly one device (computer, laptop, or tablet) for every student in schools that are not on the road system. The most inaccessible schools, reachable only through air with high poverty levels, pay considerably more per month for broadband connectivity and have low broadband speeds, yet these institutions provide their students with many connected devices that are considerably more state-of-the-art than other districts.

Alaska Broadband Audit Report | May 2015 Page | 28
Table 11: District Breakdown Based on Accessibility
Schools on
Road System
Schools Accessible
Primarily via Ferry
Schools Accessible via Air
Schools 249 89 168 Students 93,429 14,497 23,535 Poverty Rate 8.5% 9.1% 21.0% Kbps/Student-Staff 249 466 79 Broadband Cost/Student-Staff After E-rate Discount $2.48/month $9.34/month $16.20/month Connected Devices/Student .46 .92 .96 Average Age of Devices 4.72 years 5.24 years 3.74 years
Case Study 4: Evergreen Elementary School, Wrangell Public School District Wrangell Public School District has a long history of using technology to enhance education. The district is located in southeastern Alaska near the Stikine River serving the community of Wrangell, Alaska.
Wrangell Public School District’s network currently supports a 1:1 laptop program for all students, elementary school through high school. The 1:1 initiative for grades 2 through 12 was part of the Association of Alaska School Boards’ Consortium for Digital Learning project which has been in place for 8 years, and after great success, the district recently expanded the 1:1 program to include all elementary school students.
While the network is able to support the elementary, middle, and high school programs, the primary wing of Evergreen Elementary is in great need of a wiring update to increase bandwidth. With additional bandwidth, the district could provide a wider variety of course offerings to students in order to expand on the catalog currently available. Greater bandwidth could also support the existing cloud-based courses and curriculum presently limited in usability due to occasionally slow Internet access. With a greater ability to utilize cloud-based computer services, generally, the district could eliminate locally based services saving costs and streamlining maintenance.

Alaska Broadband Audit Report | May 2015 Page | 29
VII. School districts serving predominantly Native American students face substantial
broadband capacity challenges. Of the approximately 131,000 students in the Alaska K-12 public education system, 23.6% are Native Americans.5 However, in most school districts in Alaska, Native American students are the single largest ethnic group.6 Unfortunately, school districts that serve predominantly Native American students are among the most disconnected school districts in the state. Table 12: Native American Students Access Compared to School Districts
Majority Native American Students
All Other School Districts
School Districts 28 24 Students 23,724 107,700 Poverty Rate 21.4% 8.6% Kbps/Student-Staff 86 278 Broadband Cost/Student-Staff After E-rate Discount $16.4/month $3.32/month Connected Devices/Student .98 .52 Average Age of Devices 3.82 years 4.82 years Many of these school districts are in rural and remote areas, and the data are consistent with findings on the connectivity challenges faced by schools in all rural and remote areas. The data demonstrate that like other remote communities, these schools are trying to bring technology to the classroom at an even greater rate than other schools. However, the cost and quality of connectivity remains a considerable challenge.
5 For Alaska Department of Education and Early Development enrollment data by grade by ethnicity, see http://education.alaska.gov/stats/, 6 For demographic data published by the National Center for Educational Statistics, U.S. Department of Education, see http://nces.ed.gov/surveys/sdds/ed/profiles/#2/DP03_88/5/natural-breaks/db.

Alaska Broadband Audit Report | May 2015 Page | 30
VIII. Most Alaska school districts have WANS, but those networks generally do not meet
nationwide benchmarks. Wide Area Networks (WANs) are connections between schools that allow for sharing of resources and applications within a district. WANs benefit education by allowing for distance learning opportunities and access to content on a district-wide basis, without requiring each school to have their own Internet connection to access certain resources. For many remote districts in Alaska that rely on satellite connections to the public Internet, a WAN can be important component of digital learning and allow for cost-effective sharing of resources. For example, if a district had a robust WAN that connects schools in that district, a video or application used to teach a lesson need only be downloaded once from the Internet, and then could be shared with all schools through the WAN. Recognizing the value of district WANs, the FCC has established a long-term benchmark for scalable WAN connectivity of 10 Gbps for every 1,000 students, or 10 Mbps for each student. The FCC has noted that this target is one that is flexible based on school and district size.
Case Study 5: Hoonah City School District
The Hoonah City School District faces a bandwidth issue preventing them from utilizing many services. Currently, the district, which is primarily accessed by ferry, operates a network with 6 Mbps symmetrical service including 1.5 Mbps service refunded to the school by the Library. In the near future, the funding for the library service will cease to exist so the district must solely fund their networks and thus determine where the dollars for service will come from. The network is already at about 50% capacity most of the day, while many services are not used and are closely managed due to limited bandwidth.
Because of the broadband challenges, schools in the Hoonah City School District cannot use many of the services expected to be available each day. Students and teachers are missing out on digital education tools such as video streaming, distance learning applications, and social media opportunities. With expanded bandwidth, students can take advantage of e-learning materials, and teachers and staff can benefit from online professional development.

Alaska Broadband Audit Report | May 2015 Page | 31
Nearly all school districts audited (42 of 52) have a district WAN, but the capacity of those WANs varies considerably. Nearly all school district WANs in Alaska do not meet the FCC capacity target, which indicates that Alaska school districts may not be in a position to utilize these WANs as important cost-saving tools for education. Table 13 shows that while many Alaska school districts have WANs, these WANs generally do not have sufficiently robust capacity to meet the FCC nationwide benchmark. Indeed, of the 42 Alaska school districts with WANs, only 3 district WANs meet the nationwide benchmark. Table 13: WAN Capacity Averages
Average WAN Capacity (of districts with WANs) 1.3 Mbps for each student Median WAN Capacity (of districts with WANs) 0.28 Mbps for each student Number of Districts with WAN Capacity of 10 Mbps/student or greater 3 IX. Nearly all Alaska classrooms are connected via Wi-Fi, but schools report the need to
increase the quality of those connections. Unlike broadband Internet connectivity to school buildings and WAN capacity between school buildings, the FCC has not established a specific target for on-campus wireless (usually Wi-Fi) connectivity on school campuses. However, in 2014 the FCC established a dedicated, $1 billion/year fund directed at ensuring that sufficient federal resources were available to school districts to build on-campus internal networks. Every school district has access to this fund, which will provide district funding of $150 per student over five years to build and maintain these on-campus networks. As part of the Audit, Connect Alaska sought to determine how many instructional areas in Alaska schools are connected to wired Ethernet or Wi-Fi networks and the general satisfaction with the quality of those networks. Schools report that the vast majority (96%) of instructional areas in Alaska schools are connected to on-campus Wi-Fi. However, over two-thirds of schools state that Wi-Fi access is inadequate for instruction. Table 14: Wi-Fi Capacity by Region
Wi-Fi
Adequate Elementary K12 Middle/High Statewide
Rural No 77% 47% 67% 58% 40% Yes 21% 51% 33%
Urban No 100% 88% 98% 99%
1% Yes 0% 12% 2%
Statewide No 88% 48% 80% 70% 29% Yes 11% 49% 20%

Alaska Broadband Audit Report | May 2015 Page | 32
Elementary schools report the largest dissatisfaction with Wi-Fi network quality, with 88% of schools reporting that their on-campus Wi-Fi networks are inadequate for instructional needs. The pressure on Wi-Fi network quality is perhaps most felt in larger, urban schools in which 99% of schools report that their Wi-Fi network capacity is inadequate.
Case Study 6: Yakutat Elementary School, Yakutat School District The Yakutat Elementary School, a small school located in southeastern Alaska in a district accessible primarily by ferry, is in great need of bandwidth and network reliability. To attempt to access any type of online content, the school must use a combination of the Wi-Fi and LAN hookups. According to the school, if two users are utilizing online content, it eliminates any others from accessing the Internet. Due to network challenges, minimum bandwidth, and satellite latency issues, students are not experiencing the type of connectivity that is needed in today’s global educational system. In order for students in this rural district to have access to online testing and a robust curriculum of digital learning content, funding for network rebuilding and reconfiguration as well as access to great bandwidth must be made available.

Alaska Broadband Audit Report | May 2015 Page | 33
Regional Analysis of the School Broadband Gap Since Alaska covers such a massive land area and contains a diverse array of communities, rural, and bush areas, it is important to compare the adoption and use of broadband technology by Alaska schools not simply to nationwide benchmarks but also to their peer groups. To facilitate these comparisons, this Report has grouped Alaska K-12 schools into five geographic regions: Central, Southeastern, Western, Northern, and Southwestern. The Alaska School Broadband Audit website also allows the user to compare their own school and district to any self-selected peer group, as well as state averages. As noted in the statewide findings above, the most rural and remote school districts in Alaska face the largest broadband adoption and cost challenges. However, those gaps vary considerably by region. Comparing school districts by region reveals a number of striking findings about the unique broadband challenges presented by Alaska’s geography. Table 15: District Sizes by Region
Region School Districts Students
Central
Alaska Gateway School District 404 Anchorage School District 48,154 Chugach School District 310 Copper River School District 442 Cordova City School District 349 Delta Greely School District 815 Denali Borough School District 888 Fairbanks North Star Borough School District 13,891 Galena City School District 4,384 Iditarod Area School District 333 Kenai Peninsula Borough School District 9,150 Kodiak Island Borough School District 2,477 Matanuska-Susitna Borough School District 18,037 Nenana City School District 1,040 Valdez City Schools 608 Total 101,282
Northern
Bering Strait School District 1,848 North Slope Borough School District 2,017 Northwest Arctic Borough School District 2,126 Tanana City School District 39 Yukon Flats School District 247 Yukon-Koyukuk School District 1,495 Total 7,772

Alaska Broadband Audit Report | May 2015 Page | 34
Southeastern
Annette Island School District 381 Chatham School District 172 Craig City School District 576 Haines Borough School District 280 Hoonah City School District 117 Hydaburg City School District 80 Juneau Borough School District 4,813 Kake City School District 111 Ketchikan Gateway Borough School District 2,474 Klawock City School District 123 Pelican City School District 13 Petersburg City School District 440 Sitka School District 1,402 Skagway School District 100 Southeast Island School District 201 Wrangell Public School District 278 Yakutat School District 110 Total 1,1671
Southwestern
Aleutian Region School District 37 Aleutians East Borough School District 246 Bristol Bay Borough School District 134 Dillingham City School District 469 Lake and Peninsula Borough School District 336 Pribilof Island School District 92 Southwest Region School District 602 Unalaska City School District 399 Total 2,315
Western
Kashunamiut School District 325 Kuspuk School District 387 Lower Kuskokwim School District 4,285 Lower Yukon School District 2,054 Nome Public Schools 700 Saint Mary's School District 213 Yupiit School District 457 Total 8,421
This section will compare the broadband network capacity of schools in each region, the cost of that capacity, and the number and age of connected devices (PC, laptop, or tablet) available to students and faculty for instructional purposes. Table 16 below provides some summary data on the capacity, cost, and use of devices for each region. The summary table demonstrates significant variations among Alaska schools when examined on a regional basis. Each regional discussion that follows will discuss the particular challenge faced in connecting students and educators in those regions.

Alaska Broadband Audit Report | May 2015 Page | 35
Table 16: Capacity, Cost, and Use of Devices for Each Region
Region
CAPACITY COST DEVICES
Av. Kbps/ Student-
Staff
Total Broadband
Monthly Cost
Total Monthly Cost per Student-
Staff
Total Monthly Cost per
Mbps
Number of Devices/ Student
Average Age of
Devices
Central 265 $1,216,173 $11.65 $44.43 0.47 4.72 Northern 52 $993,342 $101.30 $1955.40 0.97 4.01 Southeastern 383 $427,755 $34.04 $89.83 0.90 5.37 Southwestern 55 $312,079 $117.32 $2122.99 1.06 4.76 Western 115 $1,192,500 $124.54 $1083.11 0.94 3.11 Statewide 246 $4,141,849 $29.79 $122.20 0.59 4.57
Central Region The majority of K-12 schools are in the Central Region, which includes the large districts of Anchorage, Fairbanks, Kenai, and Matanuska-Susitna. Districts in the Central Region serve over 100,000 K-12 students, 77% of all K-12 public school students in Alaska. The most important characteristic of the Central region is that it contains all of the schools in the state that are connected to the road system – indeed, 91% of the schools in the Central Region are on the state road system, while none of the schools in the other four regions are accessible as such. That said, 25 audited schools in the Central Region are generally accessible by air or ferry. Of the five regions, the Central Region has the lowest poverty rate (8.6%). Not surprisingly given its geography, Central Region schools have among the highest broadband speeds on a per-student and staff basis and the most cost-effective prices. Schools in the region do face a number of challenges, potentially because of their large student populations. In particular, while many schools in the Central Region meet the short-run E-rate broadband capacity target of 100 Kbps/student and staff, only 8% of the schools meet the 2020 goal of 1000 Kbps/student and staff. In addition, the Central Region has the lowest number of connected instructional devices in the entire state – 0.47 – one-half less than other regions. Indeed, if one excludes the Central Region from analysis, Alaska schools in the other four regions have nearly one connected device for each student.
Central Region
� 101,282 students � 15 school districts
o Alaska Gateway o Anchorage o Chugach o Copper River o Cordova City o Delta Greely o Denali Borough o Fairbanks North Star
Borough o Galena City o Iditarod Area o Kenai Peninsula Borough o Kodiak Island Borough o Matanuska-Susitna
Borough o Nenana City o Valdez City
� 282 schools (Audited:266) o 134 Elementary o 79 Middle/High o 53 K-12 o 25 not on road system
� 8% Native American student population

Alaska Broadband Audit Report | May 2015 Page | 36
Progress Toward Broadband Capacity Benchmarks
The average student and staff member in the Central Region has broadband network capacity of 265 Kbps. Table 17 below lists, by district, the average broadband capacity for each student and staff member. These numbers are averaged by reference to student body and faculty size.
Case Study 7: Kenai Peninsula Borough School District The Kenai Peninsula Borough School District, located in central Alaska and serving one of the largest student populations in the state, operates a diverse network across a varied district. The school district serves institutions from small, K-12 schools in remote Alaska to large, metropolitan high schools, all with various types of technology for backhaul. One school in the district, Soldotna High School, manages bandwidth based on school needs and availability while managing networks at all locations. Speed tests are utilized at the school to verify network performance. While on site, Connect Alaska engineers conducted several tests utilizing a Minneapolis server location. The results were positive with all latency readings falling below the 150 milliseconds and most at or around 90 milliseconds. Supporting widespread broadband usage and implementation among students allows for a variety of technology to be used for instruction in the classroom. Soldotna provides laptops for Smart boards, utilizes multiple portables, and redistributes the technology devices as needed to get maximum use. All portables are wired with cat 5 infrastructure when deployed and are all equipped with VoIP services to enhance online engagement. Connect Alaska observed that Kenai Peninsula Borough has well-managed the great variety and diverse needs across this school district – students are well connected to broadband technology and getting a wealth of information from online tools daily.

Alaska Broadband Audit Report | May 2015 Page | 37
Table 17: Broadband Speed per Student and Staff by School District (Central Region)
Central Region School District
Kbps/ Student-Staff
Alaska Gateway School District 113 Anchorage School District 69 Chugach School District 37 Copper River School District 135 Cordova City School District 49 Delta Greely School District 134 Denali Borough School District 249 Fairbanks North Star Borough School District 437 Galena City School District 36 Iditarod Area School District 126 Kenai Peninsula Borough School District 468 Kodiak Island Borough School District 907 Matanuska-Susitna Borough School District 498 Nenana City School District 89 Valdez City Schools 99 Average 265
When examined on an individual school basis, only 8% of schools in the Central District have capacity of 1000 Kbps for each student and staff, the E-rate connectivity 2020 goal. Thirty-six percent (36%) of schools in the Central District do not have capacity of 100 Kbps, the short-term capacity goal for the E-rate program. The following chart compares these schools to schools in the Central Region that meet the short-term goal. Table 18: Connectivity Comparison (Central Region)
Schools Meeting 100 Kbps/Student-Staff Target
Schools Not Meeting 100 Kbps/Student-Staff Target
Kbps/student-staff, average 449 52 Total monthly cost per Mbps $33.61 $152.78 Devices/student 0.48 0.47 Average age of devices 4.55 4.92
Technology Breakdown
The majority of schools in the Central region are served with a wired network connection, with 105 schools audited having fiber optic connections.

Alaska Broadband Audit Report | May 2015 Page | 38
Figure 3: Technology Used to Connect Schools (Central Region)
Most schools in the Central region have latency at or better than 100 ms, which means that they have the quality of service useful for online-testing, video educational applications, and distance learning. Figure 4: Latency Comparison Based on School Type (Central Region)
There are 18 schools in the Central Region connected solely by satellite, and all of these schools have latency greater than 300 ms.
Technology Used to Connect Schools Central Region
Fiber
Wireline
Wireless
Satellite
Other
0
20
40
60
80
100
120
140
160
Elementary Middle/High K12
>300 ms
100-300 ms
≤100 ms

Alaska Broadband Audit Report | May 2015 Page | 39
Cost
As to be expected from its more-accessible and less-rural nature, the cost of connectivity in the Central Region is the lowest in the state. The following tables compare the total monthly cost for broadband capacity at Central Region schools based on technology used to connect the school. The tables measure these costs with regard to total cost per student and staff as well as total cost on a per-megabit basis. Figures 5 and 6 show the difference in costs between fiber, wireless, and other wireline technologies in the Central Region. The cost of satellite broadband services used at some Central Region schools is considerably higher than these other technologies -- $385.88 per month for each student and staff and $2,524.59 per month per Mbps. Figure 5: Broadband Monthly Cost/ Student and Staff (Central Region)
Figure 6: Broadband Monthly Cost/Mbps (Central Region)
16.06
86.62
9.22 10.37
67.33
6.31
Fiber Wireless Wireline
Broadband Monthly Cost/Student-Staff
Statewide
Central
35.2
845.75
85.41 22.94
161.77
55.81
Fiber Wireless Wireline
Broadband Monthly Cost/Mbps
Statewide
Central

Alaska Broadband Audit Report | May 2015 Page | 40
Devices
As Table 16 above shows, when measured on a per-student basis, there are fewer connected instructional devices in the Central Region than the rest of the state, 0.47 compared to 0.94.
Case Study 9: Kodiak Island Borough School District According to Connect Alaska’s district-level analysis, Kodiak Island Borough School District exceeds state averages for student download speed targets and even exceeds the national benchmark in its elementary schools. However, that is not the case in many of the district’s rural schools. While existing fiber technology bandwidth is sufficient for city schools such as Kodiak High School, many of the district’s rural schools are on satellite backhaul with dedicated bandwidth thus limiting the potential for computer technology use in the classrooms. Kodiak High School is currently undergoing an expansion of facilities with ongoing upgrades to their wireless networks within the school that will serve the 723 students and 90 faculty members. The city schools additionally utilize microwave to extend their reach to support facilities temporarily dislocated due to the ongoing expansion construction, but rural schools in the district remain at a disadvantage. In the district’s rural schools, the current level of bandwidth limits expansion and use of digital learning tools that would enhance teaching and learning. One school offers a successful Robotics class that uses the maximum bandwidth capabilities available. By increasing bandwidth, more opportunities such as this class and others can be made available to students looking to learn technology and engineering skills. In terms of devices, a refresh is currently being deployed on a five-year basis with some catch-up required due to budgeting and available funding.
Case Study 8: Lathrop High School, Fairbanks North Star Borough School District Lathrop High School, located in the large Fairbanks North Star Borough School District, is Fairbanks’ largest school and considered one of the top schools in the state. Connect Alaska engineers were impressed with the school’s demonstrated successful network management and the robust connectivity for students and faculty. The network is locally managed and provides suitable bandwidth to meet the needs of the school including security cameras. Though increasing bandwidth is not an affordable option at this time, the network is constantly being upgraded to maintain appropriate service for student and faculty usage. Lathrop High School has ambitions to pursue a 1:1 or Bring Your Own Device (BYOD) initiatives so that its emerging job-seekers have access to twenty-first century technology in school. The current network does not have capacity to support this vision. Significant upgrades resulting in greater bandwidth will need to be realized before this is possible. Greater bandwidth could also allow for the availability of widespread cloud storage which would additionally provide a great tool for the school as they aim to continue to connect their students in the most robust manner possible.

Alaska Broadband Audit Report | May 2015 Page | 41
Southeastern Region
� 11,671 students � 17 school districts:
o Annette Island o Chatham o Craig City o Haines Borough o Hoonah City o Hydaburg City o Juneau Borough o Kake City o Ketchikan Gateway Borough o Klawock City o Pelican City o Petersburg City o Sitka o Skagway o Southeast Island o Wrangell Public o Yakutat
� 72 schools (Audited: 63) o 18 Elementary o 24 Middle/High o 21 K-12 o 63 not on road system
� 18% Native American student population
Southeastern Region Southeastern Region school districts are accessible primarily through the water ferry network; however, the 72 schools in the Southeastern Region have the highest broadband connectivity in the state, 383 Kbps per student and staff on average, considerably higher than the Central Region even though the cost of that connectivity in the Southeast is greater, $34.04 per student and staff, per month. With an
estimated poverty rate of 8.8%, the Southeastern Region boasts, alongside the Central Region, the lowest rates in the state. Southeastern Region schools serve 11,671 students with the highest broadband speeds per student and staff in Alaska. With the average speeds surpassing the short-term E-rate broadband capacity target of 100 Kbps, only 10% of the schools meet the 2020 long-term goal of 1000 Kbps per student and staff. Despite high speeds, however, students are often using outdated technology devices. Of the distributed devices among student and faculties in the region, the average age of those devices is the oldest in the state at 5.37 years old. This age is significantly higher than the state average of 4.57 years.
Case Study 10: Petersburg High School, Petersburg City School District Petersburg High School, in Petersburg City School District, despite older infrastructure and remote location, is taking important steps to ensure the connectedness of its students. With a well-managed network and significant use of spectrum available, the school is regularly testing new technology applications to be implemented across the campus. Students are very active in reviewing and beta testing new software and programs to be utilized on the internal network as well as on supplied devices. The investment in new and more advanced applications is embraced by the staff and students. Additionally, students are involved in keeping the school network viable and operable as the administration focuses on implementation of 1:1 initiatives and other programs that will bring the best technology and e-learning to this southeastern Alaska school district.

Alaska Broadband Audit Report | May 2015 Page | 42
Progress Toward Broadband Capacity Benchmarks
As stated above, the average student and staff in Southeastern schools are served by speeds of, on average, 383 Kbps. Table 19 shows the average broadband capacity averaged by student body and faculty size for each school district. Table 19: Broadband Speed per Student and Staff by School District (Southeastern Region)
Southeastern Region School District
Kbps/Student-Staff
Annette Island School District 323 Chatham School District 150 Craig City School District 146 Haines Borough School District 128 Hoonah City School District 30 Hydaburg City School District 274 Juneau Borough School District 307 Kake City School District 127 Ketchikan Gateway Borough School District 733 Klawock City School District 94 Pelican City School District 83 Petersburg City School District 141 Sitka School District 498 Skagway School District 85 Southeast Island School District 321 Wrangell Public School District 242 Yakutat School District 109 Average 383
In examining schools on an individual basis, it is clear that only 10% of schools in the region meet the E-rate long-term goal of 1000 Kbps per student and staff benchmark. Even more important today, 22% of schools do not meet the short-term E-rate goal of 100 Kbps. The following table compares these schools to schools in the Central Region that meet the short-term goal.

Alaska Broadband Audit Report | May 2015 Page | 43
Table 20: Connectivity Comparison (Southeastern Region)
Schools Meeting 100 Kbps/Student-Staff Target
Schools Not Meeting 100 Kbps/Student-Staff Target
Kbps/student-staff, average 520 57 Total monthly cost per Mbps $76.07 $330.48 Devices/student 0.85 1.04 Average age of devices 5.34 5.43
Technology Breakdown
In the Southeastern Region, the majority of schools are served by a wired network, with approximately 59% of schools audited served by fiber connections (37 schools). Figure 7: Technology Used to Connect Schools (Southeastern Region)
When looking at the Southeastern Region’s latency, about 76% of schools have 100 ms or better, the speed tier needed for reliable online-testing and application usage. In a district primarily accessible by water, proper latency is important for distance learning uses; however, 21% of schools in the region indicated latency of greater than 300 ms, a level creating significant challenges for schools looking to fully utilize their technology.
Technology Used to Connect Schools Southeastern Region
Fiber
Wireline
Wireless
Satellite
Other

Alaska Broadband Audit Report | May 2015 Page | 44
Figure 8: Latency Comparison Based on School Type (Southeastern Region)
Cost
While the cost of broadband is higher than that in the Central Region, the cost per student and staff is significantly lower than that of the other three regions in the state. Schools pay, on average, $34.04 per student and staff in the Southeastern Region. Devices
In the Southeastern Region, nearly every student has a connected instructional device with 0.90 devices per student observed in the area. While the number of devices is encouraging, the age of those devices is significantly older than other regions in Alaska. Devices in the region are, on average, 5.37 years old, representing potentially out-of-date technology in schools that may have trouble making use of online and digital applications.
Latency in Southeastern Region
100 ms or better
100 ms to 300 ms
300 ms or greater

Alaska Broadband Audit Report | May 2015 Page | 45
Case Study 10: Kake School District Located in southeastern Alaska, Kake City School District, accessible primarily by ferry, began an innovative 1:1 program this year utilizing iPads. To make the program a success, the district must rely heavily on the network. To this end, Kake School District recently completed a major wireless update providing fast access to the devices and better management to optimize the network. Superintendent Shipley and Technology Director Jeff VanTrease have put together a program that is increasing student opportunities for courses as well as accelerating their learning with mobile tools, but additional bandwidth would allow them to fully realize their vision. Faculty would like to utilize virtual field trips to expose the students to experiences outside of the village. Also, students leave the district for sporting or other events and could take advantage of the mobile technology to remain in touch with teachers to ensure learning never stops and can occur anywhere. The technology department sees additional advantages of increased bandwidth with the option to provide cloud-based services. These services would be reachable inside or outside Kake to both faculty and students. Also, by doing so the district could eliminate high-cost services currently provided internally by taking advantage of the cloud and removing the need for hardware and management by district staff.

Alaska Broadband Audit Report | May 2015 Page | 46
Western Region Located in areas only accessible by air, Western Region school districts are extremely rural with a large percentage of the district schools housing K-12. The district’s nearly 8,500 students are spread out over 7 school districts and in 57 schools, 88% of which are served by wireless or satellite broadband service. The Western Region has a significant poverty rate of 23.5%, which is the highest among Alaska regions, and also comprises the highest Native American population in the state. Due to the remote and rural locations of most of the schools, it is not surprising that the cost of service is the highest in the state of Alaska, and by a rather large margin. Schools pay, on average, $124.54 per student and staff per month for service and only maintain adequate speeds at, on average, 115 Kbps per student and staff. With 61% of the districts in the region not meeting the E-rate short-term goal of 100 Kbps per student and staff, even fewer, 95%, don’t meet the long-term goal of 1000 Kbps per student and staff. Nonetheless, nearly every student in the district has access to a connected educational device and the average age of these devices is the lowest in the state at 3.11 years. Progress Toward Benchmark Capacity Benchmarks
On average, each student and staff in the Western Region has access to 115 Kbps. Below, the table lists the average network capacity each school district per student and staff, weighted by student body and faculty size. Table 21: Broadband Speed per Student and Staff by School District (Western Region)
Western Region School District
Kbps/Student-Staff
Kashunamiut School District 24 Kuspuk School District 114 Lower Kuskokwim School District 186 Lower Yukon School District 22 Nome Public Schools 58 Saint Mary's School District 26 Yupiit School District 55 Average 115
As the E-rate program has set benchmarks for broadband capacity, only 39% of schools in the Western District have access to the short-term goal of 100 Kbps and even less, 5%, have access to the 1000 Kbps 2020 benchmark. Table 22 compares the schools to others in the region that meet the short-term goal.
Western Region � 8,421 students � 7 school districts:
o Kashunamiut o Kuspuk o Lower Kuskokwim o Lower Yukon o Nome Public o Saint Mary’s o Yupiit
� 57 schools (Audited 56) o 7 Elementary o 9 Middle/High o 40 K-12 o 56 not on road system
� 84% Native American student population

Alaska Broadband Audit Report | May 2015 Page | 47
Table 22: Connectivity Comparison (Western Region)
Schools Meeting 100 Kbps/Student-Staff Target
Schools Not Meeting 100 Kbps/Student-Staff Target
Kbps/student-staff, average 331 43 Total monthly cost per Mbps $448.22 $2717.72 Devices/Student 1.03 0.91 Average age of devices 2.86 3.21 Technology Breakdown
Due to the remote nature of the districts in the Western Region of Alaska, wired connectivity is often not an option for schools. As a result, satellite and wireless services are the only solution to their broadband, with approximately 88% of schools using these two services to connect their classrooms. Figure 9: Technology Used to Connect Schools (Western Region)
In regard to latency, only about 60% of the schools within the Western Region have latency of 100 ms or greater, which is the benchmark the Audit uses for determining proper levels to stream videos, use distance learning and other applications, and take tests online.
Technology Used to Connect Schools Western Region
Fiber
Satellite
Wireless
Wireline

Alaska Broadband Audit Report | May 2015 Page | 48
Figure 10: Latency (Western Region)
Costs
As discussed, the cost of broadband in the Western Region is significantly higher than other regions in Alaska with schools paying approximately $124.54 per month per student and staff. With the remote nature and necessary use of satellite and wireless technology for coverage, schools are paying, on average, over ten times more for service than schools in the Central Region of Alaska. Table 23: Broadband Monthly Cost by Platform (Western Region)
Platform Broadband Monthly Cost/Student-Staff
Broadband Monthly
Cost/Mbps
Fiber $87.92 $212.77 Satellite $167.55 $ 4,688.00 Wireless $112.89 $ 1,637.07 Wireline $117.16 $4,452.00 Average $124.54 $ 1,083.11
Interestingly, the Audit shows that Western Region schools are paying substantially more for satellite broadband capacity than other schools in Alaska. The monthly cost per Mbps for a satellite broadband connection in the Western region is $4,688 per month, much higher than the cost per megabit for satellite connectivity in other regions.
Latency in Western Region
100 ms or better
100 ms to 300 ms
Greater than 300 ms

Alaska Broadband Audit Report | May 2015 Page | 49
Table 24: Regional Comparison of Broadband Costs and Speeds
Figure 11: Total Monthly Cost/Mbps for Satellite Broadband with Latency of 300 ms Plus
In theory, the cost of providing satellite connectivity should not vary significantly, and indeed, outside of the Western region, prices paid for satellite connections are more consistent. Variations in prices paid could be a function of whether competitive pressures are present and the procurement processes of individual school districts. In the Recommendations Section below, Connect Alaska recommends that the state and school districts improve procurement processes to take better advantage of potentially cost-saving measures like purchasing consortia. Devices
With nearly one device per student (0.94 devices per student) and, on average, the newest devices in the state compared to other regions, students in Western Region districts have access to digital learning devices that have the ability to connect them, despite the remote location of many of the communities.
0
500
1000
1500
2000
2500
3000
3500
4000
4500
5000
Central Northern Southeastern Southwestern Western Statewide
Total Monthly Cost/Mbps For Satellite Broadband With Latency of 300 ms Plus
Monthly Cost/Mbps
Satellite with Latency of 300 ms + Other Technologies
Central $2,525.00 $33.00 Northern $2,088.00 $1,371.00 Southeastern $948.00 $86.00 Southwestern $1,951.00 $2386.00 Western $4,688.00 $731.00 Statewide $2,456.00 $70.00

Alaska Broadband Audit Report | May 2015 Page | 50
Case Study 12: Lower Yukon School District Mountain Village schools of the Lower Yukon School District are only accessible by air and located in a remote, rural village in western Alaska. They choose to use satellite even though wireline service is available in most of its villages. Due to high costs and availability, the schools are unable to make the switch to lower latency, higher bandwidth options. All of the schools within the Lower Yukon School District have satellite and a 5 Mbps network connection available for use across the network. This has allowed them to begin the process of incorporating distance learning, live video streaming, ConnectED initiatives, My Math and Reading Wonders programs, and distance learning connections with the Lower 48. In order to have a usable experience, however, the network uses storage and caching equipment which is negatively impacted by the massive amounts of brownouts and blackouts the remote area often experiences. These power outages are hard on equipment, expensive to repair, and cause potentially long downtimes, causing students and teachers to lose access to on-line curriculum. Although the schools are aiming to connect their students to the best of breed twenty-first century learning tools, electrical power outages, latency, bandwidth, and network dependability continue to serve as challenges for the area.

Alaska Broadband Audit Report | May 2015 Page | 51
Northern Region Northern Region school districts, only accessible by air, are located in rural areas of Alaska and serve 7,772 students. The 57 schools in the region are located in high poverty areas with nearly half of students in the audited schools eligible for free or reduced lunch. With an overwhelming number of schools in the region serving grades K-12, the six districts cover a large and remote part of the state. With the slowest speeds in the state, the Northern Region districts have, on average, only 52 Kbps per student and staff of available bandwidth for school usage. This number falls well below the national E-rate short-term goal of 100 Kbps per student and staff with a majority of schools missing the benchmark. Additionally, no schools in the area meet the long-term E-rate goal of 1000 Kbps per student and staff. Despite slow speeds, however, districts maintain close to a 1:1 device ratio, although the average age of these devices is approximately 4 years old. Progress Toward Broadband Capacity Benchmarks
With the average speeds of 52 Kbps per student and staff, 34 of the regions 57 schools (60%) fall short of the E-rate’s short-term goal of 100 Kbps per student and staff while all schools fall short of the long-term goals. As indicated in the chart below, Northern Region schools have a need for greater bandwidth capacity to meet the increasing demands of digital learning. Table 25: Broadband Speed per Student and Staff by School District (Northern Region)
Northern Region School District Kbps/Student-Staff
Bering Strait School District 55 North Slope Borough School District 69 Northwest Arctic Borough School District 26 Tanana City School District 149 Yukon Flats School District 109 Yukon-Koyukuk School District 59 Average 52
Technology Breakdown
Schools in the Northern Region are almost exclusively served by satellite providers (88% of schools) with a small portion utilizing wireless technology. Only 2 schools use fiber or another wireline service, certainly accounting for the large amount of schools without robust access.
Northern Region � 7,772 students � 6 school districts:
o Bering Strait o North Slope Borough o Northwest Arctic Borough o Tanana City o Yukon Flats o Yukon-Koyukuk
� 57 schools o 1 Elementary o 4 Middle/High o 52 K-12 o 57 not on road system
� 80% Native American student population

Alaska Broadband Audit Report | May 2015 Page | 52
Figure 12: Technology Used to Connect Schools (Northern Region)
Latency is, not surprisingly, also an issue with Northern District schools. Eighty-nine percent (89%) of schools (or 51 of the 57 schools in the region) experience latency speeds of greater than 300 ms, the result of satellite connections and backhaul. In a remote area such as the Northern Region of Alaska, improvements in latency could offer numerous opportunities for useful distance learning applications. Figure 13: Latency (Northern Region)
Technology Used to Connect Schools Northern Region
Other
Fiber
Satellite
Wireless
Wireline
Latency in Northern Region
100 ms or better
Greater than 300 ms

Alaska Broadband Audit Report | May 2015 Page | 53
Cost
Costs in the Northern Region are above average for the state and significantly greater than the costs identified in the Central region of the state. Schools pay, on average, $101.30 monthly per student and staff for broadband services in the Northern part of Alaska (compared to $11.65 in the Central Region where schools are less rural and more accessible). The following tables indicate costs by technology at schools. Table 26: Broadband Monthly Cost/ Student and Staff by Platform (Northern Region)
Platform Monthly
Cost/Student-Staff
Monthly Cost/Mbps
Fiber $154.64 $1,875.00 Satellite $140.32 $2,088.17 Wireless $42.16 $1,738.20 Wireline $13.33 $ 550.00 Average $101.30 $1,955.40
Devices
As nearly every student in the Northern region has access to a connected instructional device (0.97 devices per student), the average age of these devices is just over 4 years old. While this age is younger than the statewide average of 4.57 years, newer devices could help facilitate greater learning, particularly long-distance educational opportunities, for students in rural, Northern Alaska.

Alaska Broadband Audit Report | May 2015 Page | 54
Case Study 13: Bering Strait District In a district without road access, connectivity is vital for students to obtain access to a wide collection of educational content. In the Bering Strait School District, which covers approximately 77,000 square miles and consists of fifteen remote villages, the ability to bring a world of learning through technology to the largely Native Alaskan population is particularly important, yet currently a large hurdle. According to Connect Alaska’s district-wide analysis, the Bering Strait District lags severely behind state averages and national benchmarks for student download speed targets. The district is presently connected almost entirely with a satellite WAN through their ISP, creating a significant challenge in a number of areas. Issues such as uploading data to the district student information system can be difficult and creates delays for staff with everyday processes like attendance and grades. Latency with the network can also be a serious problem with a number of curriculum products and assessment tools as they have requirements that exceed the ability of the network to respond in a timely fashion. If the district could be connected in a way that could eliminate these download, upload, and latency problems, there are a number of ways that it could immediately provide additional tools to staff and students alike. Distance learning, curriculum, and content products could assist students in driving their own education. In remote locations like this the number of courses available to the student body would increase dramatically. Also, according to the district, artistic capability in the local communities is great, but students are unable to share their art, and in some cases are being driven out of their communities, resulting in heritage and artistic cultural opportunities being lost. With more reliable connectivity, schools would take advantage by teaching more web design classes and encouraging distance learning to ensure their students become lifelong learners.

Alaska Broadband Audit Report | May 2015 Page | 55
Southwestern Region The 8 districts in the Southwestern Region serve the smallest number of students in any region in Alaska. Like many of the other rural districts in the state, Southwestern Region schools are connected by air access only. The 38 schools represented have a Native American population of 57% with a poverty rate above the state average at 14.4%. Of the audited schools, 58% of students in this region are eligible for free or reduced lunches. Southwestern Region schools are connected by very slow speeds, on average, around 55 Kbps per student and staff. This is only second to the Northern Region of Alaska and is coupled with very high broadband costs of $117.32 per month per student and staff (only second to the Western Region of the state). With slow speeds and high costs, broadband improvements among Southwestern schools are crucial, yet challenging, for the district served almost entirely by satellite providers. Despite these challenges, however, districts in Southwestern Alaska have the highest number of devices per student in the state – 1.06 devices per student – as schools aim to better connect students with digital learning opportunities. Progress Toward Broadband Capacity Benchmarks
The average speed per student and staff in Southwestern Alaska is well below the E-rate short-term goal (100 Kbps per student and staff) and long-term goal (1000 Kbps per student and staff). Sixty-three percent (63%) of schools fall below the 100 Kbps benchmark, the highest rate in the state, and almost all (97%) of the region’s schools do not meet the long-term benchmark. The chart below compares schools meeting the short-term goal to those that do not. Table 27: Connectivity Comparison (Southwestern Region)
Schools Meeting 100 Kbps/Student-Staff Target
Schools Not Meeting 100 Kbps/Student-Staff Target
Kbps/student-staff, average 178 40 Total monthly cost per Mbps $ 1977.79 $ 2206.06 Devices/Student 1.20 1.05 Average age of devices 5 4.73
Technology Breakdown
An overwhelming number of schools in the Southwestern Region are served by satellite connections – 24 out of 36 schools. There is no fiber connectivity in the area among schools with a small percentage relying on wireless and other technologies.
Southwestern Region
� 2,315 students � 8 school districts:
o Aleutian Region o Aleutians East Borough o Bristol Bay Borough o Dillingham City o Lake and Peninsula Borough o Pribilof o Southwest Region o Unalaska City
� 38 schools (Audited:36) o 4 Elementary o 29 Middle/High o 3 K-12 o 36 not on road system
� 57% Native American student population

Alaska Broadband Audit Report | May 2015 Page | 56
Figure 14: Technology Used to Connect Schools (Southwestern Region)
Latency issues also plague the Southwestern Region with the vast majority of schools (31 out of 36 schools) experiencing latency that falls greater than 300 ms. This number is not surprising given the high satellite usage, yet improved latency could result in more digital learning opportunities for students in the area. Figure 15: Latency (Southwestern Region)
Technology Used to Connect Schools
Southwestern Region
Other
Wireless
Satellite
Latency in Southwestern Region
100 ms or better
Greater than 300 ms

Alaska Broadband Audit Report | May 2015 Page | 57
Cost
With satellite connectivity offering slower speeds and higher latency, the costs of such connectivity is also high. Schools pay, on average, $117.32 per month per student and staff, significantly higher than the statewide average of $29.79. Table 29 showcases numerous technology types in the region and the costs associated with each. Table 28: Broadband Monthly Cost/ Student and Staff by Platform (Southwestern Region)
Platform Monthly Cost/Student-Staff Monthly Cost/Mbps Satellite $127.80 $1,951.46 Wireless $82.16 $1,473.17 Wireline $111.29 $3,429.77 Other $215.13 $2,888.86 Average $117.32 $2,122.99
Devices
As indicated in Table 16 above, the average number of devices per student in Southwestern Alaska is 1.06. This number is the highest among Alaska regions showcasing 1:1 device opportunities for students across the region. Although the number of devices is high, the average age of these devices is older than the state average. Devices in the area are on average 4.76 years old, higher than the state average of 4.57 years.
Case Study 14: Dillingham City School District Dillingham City Schools, located off the road system in southwestern Alaska, has a world-class network that, despite limited bandwidth, has been working toward a managed structure to provide the best possible experience to students and teachers. The network supports everyday staff and student usage and has the capacity to support guests and Bring Your Own Device initiatives. Despite the technology team’s best efforts in utilizing what access to broadband it does have, the district could benefit greatly from increased bandwidth. Dillingham City Schools is currently engaged in VTC with other districts with a curriculum that maintains a significant amount of online content. Currently, only approximately three classrooms are fully utilizing the digital content; however, the school would consider widespread use of such content a great tool for learning. Additionally, remote connections for students when traveling with sports or student government would be a valuable use of increased bandwidth maximizing the contact time with instructors. In addition to these classroom-focused opportunities, the community could also benefit from streaming for sporting events and fine arts allowing viewing for people that would otherwise be unable to attend due to the remote location.

Alaska Broadband Audit Report | May 2015 Page | 58

Alaska Broadband Audit Report | May 2015 Page | 59
IMPACT OF THE ALASKA BROADBAND EDUCATION GAP ON STUDENT OPPORTUNITIES AND INSTRUCTION
The Alaska School Broadband Audit project also studied the impact that the broadband gap has on student opportunities and instruction in the state. To explore this impact, Connect Alaska contracted with Hays Research Group, an Anchorage-based research firm, to conduct telephone and online surveys of 55 Alaska schools to examine current broadband infrastructure in educational institutions, how students are accessing the Internet for schoolwork, and what educational opportunities might be available to students through more robust access to online resources. While the Alaska School Broadband Audit aims to understand what technology schools possess, the Needs Assessment Survey asked educators how they see technology being used in schools presently and in the future. The results of this survey were analyzed and reported in a white paper released in February 2015 (see Appendix 1). Hays Research conducted the Needs Assessment Survey by interviewing Alaska school instructors and administrators between November 19, 2014 and December 17, 2014. Once respondents agreed to participate, the questionnaire took approximately ten minutes to complete. Multiple attempts were made to contact the principal at each school, and if unsuccessful, callers asked to speak to the individual at the school with the most knowledge about incorporating technology into the school’s curricula. Overall, 9.6% of public schools in the state responded to the survey. Approximately 75% of these schools surveyed were located in rural districts, representing an appropriate sample of largely rural Alaska where 72% of schools statewide are located in rural or remote communities – many of which are located off the road system. Figure 16: Map of Alaskan School Districts

Alaska Broadband Audit Report | May 2015 Page | 60
The key findings from the school Needs Assessment Survey indicated that despite their connectivity challenges, rural schools were using what technology they did have to better serve the educational needs of their students. Results showed that 100% of rural schools surveyed reported that students were allowed to access the Internet during the school day for classwork (surpassing the 96% of non-rural schools that reported allowing online access). To bring computer usage to their students, 93% of rural schools (91% statewide) provided laptops and tablets to their students, often on carts used in classrooms or in computer labs. Regarding the use of broadband in the classroom, two out of three rural schools (66%) responded that they rely on broadband to provide their students with educational opportunities through distance learning. Nearly all rural schools (95%) said their students use broadband to access educational content, 98% use it to conduct in-class research, and 95% use it for online testing. Distance learning is also particularly important for rural schools, as 66% of rural schools use broadband for distance learning, compared to 58% of all schools statewide (see Figure 17). Figure 17: Alaska Schools That Provide Internet Access to Students for E-Learning Applications
While schools are attempting to connect their students, particularly those in rural communities, the needs of schools are greater than the current technology offerings and those demands are only rising. Nearly three out of four rural Alaska schools (73 percent) reported that they would offer more educational opportunities to students if more bandwidth were available. Educators reported that they would use tools such as live-streaming lectures, offer online courses, and incorporate online content that complements the
lessons being taught in their classrooms. Additionally, many schools expressed that faster speeds were needed to run their existing educational programs.
Alaska Schools That Provide Internet Access to Students for E-Learning Applications
Teachers are now hamstrung without better connections . . .
ALL courseware is now including online content but schools in remote Alaska cannot use it.
Surveyed School Representative

Alaska Broadband Audit Report | May 2015 Page | 61
A major source of concern for the schools surveyed was the issue of funding, particularly among rural schools. A majority of rural schools surveyed (54%) said that they needed funding to buy or improve their equipment while 49% stated the need for funding to cover the monthly costs of faster broadband service (see Figure 18). Figure 18: Percent of Alaska Schools That Needs the Following to Offer Additional Educational Opportunities
The Needs Assessment Survey showed that districts across Alaska have very real broadband needs today and planning for improvements to technology well into the future is crucial. With 89 percent of schools statewide seeing broadband needs rising in the next five years, broadband planning and funding must be a part of Alaska’s education priorities moving forward.
Percent of Alaska Schools That Need the Following to Offer Additional Educational Opportunities to Offer Additional Educational Opportunities
Having unlimited access to resources around the world
without technical barriers will allow for broader and deeper student
exposure, along with personalized instruction that will be appropriate for the student's learning style and
needs.
Surveyed School Representative

Alaska Broadband Audit Report | May 2015 Page | 62
RECOMMENDAT

Alaska Broadband Audit Report | May 2015 Page | 63
E-RATE AND ALASKA EDUCATION
As the Alaska School Broadband Audit and Needs Assessment Survey have shown, connecting schools to broadband in Alaska is a considerable challenge and a costly one, with the consequence of geography, accessibility, population density, and the economics of broadband networks. The federal E-rate program (officially called the Schools and Libraries Universal Service Fund) is the nation’s largest education technology program that is specifically designed to bridge these gaps. For Alaska K-12 schools and libraries, the E-rate program plays a particularly import role. The Federal Communications Commission (FCC) administers the E-rate program, which provides substantial discounts for telecommunications services such as voice and data services, Internet access, and on-campus (internal) networks that are purchased or constructed by school districts and public libraries. The E-rate program only pays for network connectivity and does not help pay for connected devices, digital curricula, applications, or electronic textbooks. In the 2013/2014 school year, the E-rate program spent $49.2 million in broadband and voice connectivity to Alaska K-12 schools.7 The analysis of Audit data below shows that the lion’s share of these funds is used for broadband connections to Alaska K-12 schools – approximately $35.2 million dollars. As the demand for education technology in Alaska has increased, E-rate funding has followed. E-rate funds in the amount of $62.6 million have been committed to Alaska schools for the 2014/2015 school year, and in the most recent application window as a result of changes made by the FCC to the E-rate program last year, Alaska schools and consortia have requested over $93 million in E-rate funds, a substantial increase from prior years. This section provides a general overview of how the E-rate program works, its impact in Alaska, and a summary analysis from Audit data on how E-rate subsidies are being used to upgrade broadband connectivity to Alaska schools. While Alaska schools have been drawing increasing amounts from the federal E-rate program for broadband, the broadband gap to K-12 schools, documented in the Alaska Broadband Education Gap section of this report, remains. The FCC has created additional funding channels designed to help bring schools up to national connectivity benchmarks.
7 The E-rate program operates on a school year basis, and disbursements from the fund occur as procured services are provided. Public libraries in Alaska are also significant beneficiaries of E-rate funds. In 2013, public libraries received over $1.7 million from the E-rate fund.

Alaska Broadband Audit Report | May 2015 Page | 64
E-Rate Funding Levels in Alaska The E-rate program has provided over $350 million in funding for connecting Alaska schools since its inception in 1998.8 In 2013, the E-rate program distributed $49.2 million in funding to Alaska schools and consortia including school applicants. In addition, from 1998 through 2013, disbursements from the E-rate fund to Alaska have increased steadily. This is important because, as discussed below, since its inception in 1998 until last year, total nationwide spending in the federal E-rate program has been capped at approximately $2.25-2.3 billion per year.9 Indeed, disbursements to Alaska schools from the E-rate program have increased from approximately 0.5% of the E-rate program from 1999-2001 to over 2% in recent years. Figure 19: E-rate Disbursements to Alaska Schools and School Consortia
Source: Federal-State Joint Board on Universal Service, Universal Service Monitoring Report: 2014 (Dec. 2014), Supplementary Report Material, https://transition.fcc.gov/wcb/iatd/monitor.html.
8 For a general overview of the history of the E-rate program and the FCC’s efforts in 2014 to shift the program’s focus to broadband, see Modernizing the E-rate Program for Schools and Libraries, WC Docket No. 13-184, Order and Further Notice of Proposed Rulemaking, 29 FCC Rcd 8870 (2014) (First E-Rate Modernization Order), available at: https://apps.fcc.gov/edocs_public/attachmatch/FCC-14-99A1.pdf; and Modernizing the E-rate Program for Schools and Libraries, WC Docket No. 13-184, Order and Further Notice of Proposed Rulemaking, FCC 14-189 (rel. Dec. 19, 2013), available at: https://apps.fcc.gov/edocs_public/attachmatch/FCC-14-189A1.pdf (Second E-rate Modernization Order). 9 Because disbursements are made based on service fulfillment, disbursements for 2014 commitments are not included. For example, in 2013, USAC has committed to disburse $57.6 million but as of latest reports had only distributed $49.2 million. As a result, services contracted in 2014 that E-rate will eventually help fund may be in the process of being installed, but many significant disbursements are not likely to have occurred as of latest reports.
$-
$10,000,000
$20,000,000
$30,000,000
$40,000,000
$50,000,000
$60,000,000
1998 1999 2000 2001 2002 2003 2004 2005 2006 2007 2008 2009 2010 2011 2012 2013
E-Rate Disbursements to Alaska Schools and School Consortia

Alaska Broadband Audit Report | May 2015 Page | 65
Figure 20: Percentage of National E-Rate Disbursements to Alaska Schools and School Consortia, 1999-2013
Funding requests by Alaska schools from the E-rate program have also increased significantly over time as well, rising to $93 million in the most-recent funding request cycle, which closed in April 2015.10 Because E-rate is an application-based and capped program, not all funding requests are approved for funding, but the steady increase in E-rate funding requests from Alaska schools demonstrates the growing need for broadband connectivity at Alaska schools. However, this program-wide information does not present a complete picture of the extent to which the E-rate program helps fund broadband connections at Alaska schools. The E-rate program funds not only broadband, but also voice telephone service and other related services purchased by school districts. Unfortunately, the summary data released by the FCC and the Universal Service Administrative Company (USAC, the company that manages the E-rate program for the FCC) cannot generally be analyzed to identify how much of these funds have historically been spent specifically on broadband connections to Alaska schools. One of the main purposes of the Alaska School Broadband Audit was to overcome this difficulty and determine, as best as possible, the amounts specifically being invested into broadband service and on-campus connections in Alaska schools. Connect Alaska engineers worked directly with school administrators and IT directors to make attempt to parse out the parts of a school’s E-rate funding commitment that is attributable to broadband Internet access service. As a result, the cost per megabit reported in the Alaska Broadband Education Gap section of this report and on the Audit website represents Connect Alaska’s best efforts to discern the amount that a particular school or district’s USAC funding commitment can be attributable to broadband.
10 This summary of 2015 applications was determined using the Universal Service Administrative Company Funding Request Data Retrieval Tool, which is available at http://www.slforms.universalservice.org/DRT/Default.aspx .
0
0.5
1
1.5
2
2.5
3
1999 2000 2001 2002 2003 2004 2005 2006 2007 2008 2009 2010 2011 2012 2013
% of National E-Rate Disbursements to Alaska Schools and School Consortia
1999-2013

Alaska Broadband Audit Report | May 2015 Page | 66
How the E-Rate Works The E-rate program is fundamentally a discount program, in which the E-rate fund pays for a percentage of the costs of telecommunications and Internet access services that schools and libraries purchase and use for educational purposes. All public and private K-12 schools and public libraries are eligible for the E-rate discount program. Schools and libraries receive this discount when they negotiate and purchase eligible services from telecommunications and other providers. Eligible services include broadband data and Internet access services (wireline, wireless, and satellite), as well as voice telephone service.11 In order to receive the E-rate discount, the school or library must have an open, competitive bidding process. Eligible providers are required by FCC rules to place bids on these services that are consistent with their “lowest corresponding price” for “similarly situated,” “non-residential” customers for those services.12 After the school selects a winning bid, the school applies for the E-rate discount by filing FCC Form 471 with the Universal Service Administrative Company (USAC), a non-profit corporation organized by the FCC to administer the program.13 USAC reviews these submissions and contracted services, and if it finds that the services and contracting process were followed appropriately, USAC will issue a funding commitment to the school district. Once the contracted-for services have been installed and started, the school district informs USAC, and USAC begin to pay the service provider the federal portion of the service. The district pays its portion of the contract directly to the provider. As a result, since E-rate funds flow directly from USAC to the provider, what the school or library pays out-of-pocket for broadband service is generally substantially different than the total billed cost for that service. In addition, the nature of the E-rate application and approval process makes it difficult to identify precisely how much money the E-rate program pays for broadband service. In particular,
� USAC does not clearly collect or report data specifically for broadband Internet connectivity.
� Competitive bids might include not only broadband Internet access but other eligible services like voice telephone service, and distinguishing the cost of such bundled services can be difficult.
11 The FCC adopted the current Eligible Services List in October 2014, which can be found here: https://apps.fcc.gov/edocs_public/attachmatch/DA-14-1556A1.pdf. 12 47 CFR 54.500(f). 13 USAC accepts these applications on a school year basis in the first part of the calendar year. As a result, schools seeking discounts for the 2015/2016 school year needed to file their FCC Form 471s by April 16, 2015.

Alaska Broadband Audit Report | May 2015 Page | 67
� USAC funding commitments typically exceed actual funding disbursements, rather significantly. For example, in 2013, USAC committed over $50 million in school and library requests, but only distributed $46.3 million. This is a nationwide phenomenon that is a consequence of the involved, multi-step process for funding. A USAC funding commitment is perhaps better thought of as a commitment to spend “up to” a certain amount for the requested services in the district.14 It is not uncommon nationally for committed funds to be held up in contracting or service provision delays, never to be spent.15
The amount of federal support varies based upon the urban or rural nature of the school district and the percentage of students in the district eligible for free or reduced price school meals through the National School Lunch Program (NSLP).16 Districts are eligible for discounts based on the income level of their community, their “urban” or “rural” nature (as defined by FCC rules), and the category of services for which districts request the discount. All school districts are eligible for discounts, even those in the most affluent and urban areas of the country. Discounts range from 20% to 90%. The following table summarizes the E-rate “discount matrix.” Table 29: Category 1 and Category 2 Services Based on Income
Income Measured by % of students
eligible for the National School Lunch Program
(% of students in district)
Category 1 Services Connections TO Schools
Category 2 Services Networks INSIDE Schools
Urban Districts Rural Districts Urban Districts Rural Districts
Less than 1% 20% 25% 20% 25% 1% to 19% 40% 50% 40% 50%
20% to 34% 50% 60% 50% 60% 35% to 49% 60% 70% 60% 70% 50% to 74% 80% 80% 80% 80%
75% to 100% 90% 90% 85% 85% Source: Universal Service Administrative Company, 2015
14 Because so many steps are involved in the process, a school seeking connectivity usually has to begin the E-rate bidding process well over a year before any connectivity is actually installed. This naturally results in an incentive for bid requests and resulting awards to request and contract for more services that may ultimately be installed. For districts with multiple or diverse schools, or schools that may see fluctuating enrollment, year-to-year variation can be considerable. 15 USAC reserves these committed but unspent funds, and occasionally the FCC will order USAC to release and re-purpose those stale funds for new funding purposes. Indeed, the FCC’s creation of dedicated funding for on-campus internal networks, discussed below, is largely funded by repurposing of these committed but unspent funds. 16 Students are eligible for the National School Lunch Program if their household income is less than 185% of the federal poverty guidelines. In Alaska, the poverty guideline for a family of 4 in 2014 was $29,820. As a result, a student from a household of 4 in Alaska would be eligible for the NSLP if his or her family income was below $55,167. In the E-rate program, in lieu of NSLP eligibility, schools have the option of demonstrating need in their community through surveys that collect data on family income and household size as well. To facilitate consistent analysis for this Audit, we have focused our analysis solely on NSLP eligibility.

Alaska Broadband Audit Report | May 2015 Page | 68
Pursuant to rules written by the FCC in 2014, all schools in a school district receive the same discount. The percentage of students in the NSLP is calculated on a district-wide basis, and the determination of a school district’s “urban” or “rural” status is made by reference to all schools in the district. This represents a change from 1998-2013, in which a different discount was assigned to each individual school, based on the demographics of the student and physical location of the facility.17
E-Rate Support for Broadband in Alaska As noted above, the E-rate program is a substantial source of funding for broadband connectivity in Alaska schools. Because of recent FCC changes to the discount matrix, to understand how large that impact will be going forward, one must first estimate the level of discounts for which Alaska school districts will likely qualify in the future, and then apply that discount to the estimated broadband costs determined through the Alaska School Broadband Audit. Connect Alaska estimates the new E-rate discount category for 53 Alaska public school districts in the Alaska School Broadband Audit dataset.18 The majority of students attend the three districts regarded as “urban” under the new E-rate rules, and those districts are eligible for a 60% E-rate discount. A considerable number of school districts qualify for discounts of 80-90%. It is important to note that this is an estimate only, based on most recent NSLP data, and student body information is subject to change. In addition, districts may provide their own proof of community income to qualify for a certain discount
17 Classification as “urban” or “rural” is based on 2010 Census data. A school district is considered to be “urban” if a majority of its schools are located in either an “Urbanized Area” or an “Urban Cluster” with a population of more than 25,000. The FCC’s first attempt to re-write these discount category rules in 2014 would regard all “Urban Clusters” as “urban” areas. This rule resulted in a number of small, remote districts in rural Alaska being classified as “urban,” including Barrow, Bethel, Kotzebue, Nome, and Sitka. The state of Alaska and others successfully requested the FCC change this rule, and the FCC agreed to the change in December 2014. As a result of the change, only the Anchorage, Fairbanks, and Matanuska districts are designated as “urban” under the new FCC rules. 18 Mt. Edgecumbe High School in Sitka, a state-run residential boarding school for Native American students, is not included in the dataset given its unique status.
What are Category 1 and Category Services? Category 1 services include voice and data connections and other services to school or public library facilities. They include voice and dial-tone services, data connectivity, Internet access, and leased fiber connections. Funding for Category 1 services receive priority when USAC processes funding requests. Category 2 services include connections inside school buildings and campuses, such as Wi-Fi networks, Ethernet cabling in classrooms, routers and racks, and maintenance of those networks. A certain level of Category 2 funding is available over the next five years to all schools and public libraries, based on the number of students for schools and the square footage of public libraries. Source: USAC and 2015 E-Rate Eligible Services List, available at http://www.usac.org/sl/applicants/beforeyoubegin/eligible-services-list.aspx.

Alaska Broadband Audit Report | May 2015 Page | 69
rate. This estimate is based on the new FCC discount qualification rules, so that prior E-rate distributions to schools will likely have used different discounts for many schools. Table 30: Estimated E-Rate Discount Level by Income
Income Measured by % of students
eligible for the National School Lunch Program
(% of students in district)
Estimated E-Rate Discount Level Alaska Districts and Students
Urban Districts Rural Districts Less than 1% 20% 25%
1% to 19% 40%
50%
2 Districts
499 students
20% to 34% 50%
60%
3 Districts
6,309 students
35% to 49%
60%
3 Districts
80,082
70%
7 Districts
19,707 students
50% to 74% 80%
80%
18 Districts
13,402 students
75% to 100% 90%
90% Category 1
85% Category 2
20 Districts
11,462 students Applying these discount factors to the total broadband cost data collected through the Audit, we estimate that the E-rate program currently pays approximately $35.3 million per year for broadband connections to Alaska schools. This is an estimate only, based on current levels of connectivity

Alaska Broadband Audit Report | May 2015 Page | 70
discerned in the Audit. This estimate does not include any recent broadband upgrades or planned upgrades in the current E-rate funding cycle. When the FCC and USAC make that data available, the Audit dataset can be updated to reflect those upgrades. Even with this limitation, E-rate funds clearly have a dramatic effect. Without E-rate funds, it would cost Alaska $29.79 per month for every K-12 student and staff at the current level of connectivity. With E-rate, Alaska spends $5.48 per month for every K-12 student and staff member. Figure 21: Impact of E-Rate on Broadband Cost per Month per Student and Staff
The impact of E-rate is even more important when examined by reference to the five regional groupings of Alaska school districts. As discussed above, there are significant regional differences in school district broadband connectivity in Alaska in terms of technologies available and cost. As Figure 22 demonstrates, E-rate funding plays an important role in the more remote regions of the state. For instance, without E-rate funds, the cost of providing the current level of connectivity in the Western Region would be over $124 per month for each student and staff member, and it would be $117 per month in the Southwestern Region.
$-
$5.00
$10.00
$15.00
$20.00
$25.00
$30.00
$35.00
Broadband Cost Per Month Per Student-Staff
Without E-Rate
With E-Rate

Alaska Broadband Audit Report | May 2015 Page | 71
Figure 22: Impact of E-Rate by Region
Recent FCC Rate Changes Recognizing the increasing importance of broadband connectivity to education, in 2014, the FCC made the most significant changes to the E-rate fund since its inception. The main components of the FCC modernization initiative were to:
� Increase the E-rate funding cap to $3.9 billion per year; � Establish the robust per-student and staff broadband connectivity targets discussed above; � Dedicate and increase funding for on-campus connectivity for all schools, using a per-student
formula; � Modify rules to incentivize deployment of higher-speed network connectivity, including
additional discounts if the state directly helps fund broadband network upgrades and lower the upfront costs of special construction, through temporary revisions of amortization rules; and
� Phase out all E-rate support for legacy voice services. The FCC’s goal in this modernization effort is to encourage school districts to increase their investment in broadband capacity and on-campus networks while cutting back E-rate subsidies for school district spending on legacy voice services. Alaska school districts seem to have reacted overwhelmingly to these changes. In the most recent application cycle that closed in April 2015, school districts increased their funding requests to upgrade broadband connections to schools dramatically, and Alaska districts also sought substantial funding to improve on-campus internal networks. USAC data shows that Alaska school requests for funding in 2015 increased over 44% from 2014, from $64.9 million to $93.9 million.
$-
$20.00
$40.00
$60.00
$80.00
$100.00
$120.00
$140.00
Without E-Rate
With E-Rate

Alaska Broadband Audit Report | May 2015 Page | 72
Figure 23: Total Funding Requests from Alaska Schools and Consortia, 2005-2015 ($, millions)
As part of this surge, Alaska schools in 2015 have aggressively pursued $5.65 million in funding for Category 2 internal network connections. This action is likely a direct result of the FCC’s actions to identify and dedicate funding for this purpose. Because E-rate is a capped program and Category 1 services have received priority in all funding requests, in 2013 and 2014, the E-rate program was essentially unable to fund any request for on-campus connections nationwide. In 2014 the FCC responded, by dedicating $1 billion per year in funding for on-campus networks. Alaska school districts seem to have responded strongly to this FCC initiatives.
$-
$10
$20
$30
$40
$50
$60
$70
$80
$90
$100
2005 2006 2007 2008 2009 2010 2011 2012 2013 2014 2015
Total Funding Requests from Alaska Schools and Consortia, 2005-2015 ($, millions)

Alaska Broadband Audit Report | May 2015 Page | 73
Figure 24: E-Rate Funds for On-Campus Networks in Alaska Schools ($, millions)
The FCC’s dedicated funds for on-campus networks is a five-year program that allocates a certain amount of funding to schools on a per-student basis, with a minimum of $9,600 for each school over that period. Using Audit data of student population and discount factors, Connect Alaska estimates that public K-12 schools in Alaska will be eligible to receive approximately $12.8 million in E-rate funds for internal connections from 2015-2019. In 2015, Alaska schools appear to have requested approximately 44% of that allocated amount. Future E-Rate Opportunities Beginning next year, the FCC will be offering additional matching funds to schools to help offset the capital cost of school networks upgrades – but only if the state helps defray these costs as well. This FCC program is part of a series of medium-term measures designed to reduce the out-of-pocket costs to districts for “special construction” of fiber and other high-speed broadband connections. In particular, the FCC will provide an additional, matching discount to states that directly contribute to special construction charges for projects that will bring Alaska schools up to the 1,000 Kbps/student and staff benchmark. The initial costs of upgrading to meet this benchmark can be costly and run into the tens of thousands of dollars per location, especially if roads and property need to be dug up to install fiber optic cable. As discussed in the Alaska Broadband Education Gap section of this report, most schools in Alaska do not meet this long-term connectivity benchmark and would be eligible for the FCC’s matching program.
$-
$1.00
$2.00
$3.00
$4.00
$5.00
$6.00
2010 2011 2012 2013 2014 2015
Requested
Committed

Alaska Broadband Audit Report | May 2015 Page | 74
Beginning next year, the FCC will provide an additional discount that “matches” any additional funding that a state directly provides these schools to help pay for any special construction charges for such an upgrade, up to 10 percentage points above and beyond the discount rate applicable to the relevant entity. The cost savings of this program could be substantial. For example, before this program, a school in the 60% discount category facing a $50,000 construction charge for high-speed broadband installation would ordinarily need to find $20,000 to pay for its portion of the project (with E-rate paying $30,000, or 60%). If the state, however, implements a program that would pay $5,000 of that special construction cost, the E-rate program now will match that amount with an additional $5,000. As a result, the school would only need to find $10,000 to fund that project. Collectively, the state and school authority would save 10% of the project cost over the standard E-rate program. This program is available not solely for fiber connections but also for wireless technology, provided that the state assists districts with special construction costs and that the technology to be deployed will be capable of meeting the long-term, 1000 Kbps/student and staff connectivity benchmark. Schools do not need to subscribe to that level of connectivity to have that infrastructure project qualify. The FCC also has taken other steps designed to lower the out-of-pocket costs districts face in upgrading broadband network connections, including a suspension of amortization rules for infrastructure projects (allowing districts to apply the E-rate discount earlier) and allowing districts to pay non-recurring construction costs over multiple years. In addition, school districts now also have flexibility to invest directly in infrastructure, such as a Wide Area Network, rather than procure a network service from a broadband provider if the district can show that that investment is the most cost-effective solution.19 These changes could aid districts in rural Alaska in building WANs, which could substantially increase the speed and lower the cost of delivering digital curricula, applications, and learning materials to classrooms. By combining the district bandwidth currently spread between many satellite locations at remote sites into a single point-of-presence for the district, connected by fiber or wireless technology. By facilitating the high-speed sharing of digital materials and applications between schools in a district, there would be a reduced need to rely upon long-distance transmission of data to and from the Internet, thus potentially lowering the costs per megabit per student and faculty member dramatically. Also, with a WAN configuration, districts could remove large numbers of redundant hardware installations around the district and centralize resources. Historically, districts have not invested in WAN infrastructure due to the extremely high costs to install in very rural locations, the lack of service provider alternatives, and the general inability to use E-rate funds to pay for direct network investment. As a result, WAN construction has been overwhelmingly more expensive than simply purchasing broadband service from a provider and utilizing E-rate to pay most of the service cost for that connection. However, with the ability now to use E-rate to fund infrastructure projects where such a project is cost-effective, as well as other changes to the E-rate rules designed to lower the upfront, out-of-pocket cost of such projects, a WAN architecture may now be a solution worth exploring for many rural school districts.
19 For more detail on these changes, see the Connect Alaska white paper, FCC E-rate Modernization: Impact on Alaska K-12 Schools, released in February 2015 : http://www.connectak.org/sites/default/files/connected-nation/alaska_e-rate_modernization_policy_brief_conforming_final.pdf.

Alaska Broadband Audit Report | May 2015 Page | 75

Alaska Broadband Audit Report | May 2015 Page | 76
RECOMMENDATIONS FOR ACTION
Broadband has the power and potential to transform the classroom and educational experience of Alaskan youth, to open global windows of learning to the most rural, bush landscape, to empower teachers in their craft of educating and enlightening, to enrich, preserve, and pass on culture and traditions in the most remote Native Villages, and to be a beacon of enlightenment and connectivity for communities across Alaska. Unfortunately, without being ubiquitous and fully integrated into the educational experience, broadband also has the potential to divide. Teaching without broadband technology will soon be like teaching without a textbook, and the move to on-line assessments and testing is only a first step. In most schools in Alaska and throughout the country, instructional spaces will transform substantially to this new environment over the next few years. Students in disconnected schools that do not offer this learning atmosphere will fall increasingly behind. The Alaska School Broadband Audit has shown that there are significant and considerable gaps in broadband connectivity of K-12 schools in the state. The vast majority of schools are not on pace to meet national benchmarks for connectivity, and there are significant variations in connectivity and distribution of connected devices among regions of the state. There are also substantial differences in prices paid for similar services that cannot solely be explained by geography. And schools serving the most-vulnerable populations – those with high poverty rates, remote schools that serve all grades K-12 in one facility, and those with predominant Native American populations – are the least-connected schools in Alaska. This section outlines several recommendations for action and suggests areas of further study. This list is not meant to be exhaustive, but it represents the viewpoint of Connect Alaska staff that spent months traveling schools throughout the state, gathering and verifying data, and analyzing the results. 1. Alaska schools should work to maximize use of E-rate funds available for broadband connectivity
both to and within schools
As discussed in the E-Rate and Alaska Education section of this report, Alaska schools appear to have responded overwhelmingly to the FCC’s 2014 changes to the E-rate program, increasing their requests for funding by over 40%. This process should continue, and Alaska schools should continue to be aggressive in their pursuit of E-rate funds.
2. The state and Alaska school districts should actively seek to establish a "special construction"
state funding program that would qualify Alaska schools for an additional E-rate discount of up to 10%. Failure of the state to implement a program would leave important E-rate funds on the table.
Beginning next year the FCC will make additional E-rate funds available to help offset upfront “special construction costs,” such as the cost of digging and installing fiber or building a wireless microwave tower, to schools. The FCC has found that even with standard E-rate discounts, upfront costs of construction can still be a barrier. As a result, the FCC will offer to have E-rate pay an

Alaska Broadband Audit Report | May 2015 Page | 77
additional discount on these costs for upgrades – but only if the state provides matching funds. These additional matching funds will be available from the E-rate beginning in 2016. The state and Alaska school districts should work together to create a program that would take advantage of this new funding opportunity. As discussed above, the new FCC program will contribute up to 10% of a project cost through this program. With special construction charges for high-speed connectivity frequently costing tens of thousands of dollars, those savings could be substantial. Moreover, investing in higher upfront network capacity has the potential to lower the cost of service down the road. As a result, in the long run a state program designed to take advantage of this FCC program could both close the broadband gap and save a considerable amount of money for Alaska schools.
The Alaska School BAG program could have served as the starting point for such a program. As discussed above, the Alaska School BAG program would have closed the near-term broadband connectivity gaps in many schools were it funded beyond June 2015. With most of the recipient 27 districts that received School BAG grants in high E-rate discount rate categories, School BAG funds over $39 million in additional E-rate funds for the state – more than double what Connect Alaska estimates that the E-rate pays for broadband in Alaska schools today.
3. The state and Alaska schools should investigate, explore, and advance alternative procurement
processes, such as joint or regional bidding, or increased technical assistance to school IT purchasing managers. Changes might help resolve some of the significant cost variability found for similarly situated schools and districts. Better purchasing processes may also increase incentive for high-discount schools to have more cost-effective procurements.
The regional analysis section demonstrates that there are wide variations in the cost per megabit of broadband service between schools, districts, and regions, even among those similarly-situated. This suggests that purchasing and procurement procedures might be improved to help bring additional buying power to Alaska schools. Alaska schools and the state should explore opportunities to improve these procedures, encourage or facilitate statewide, joint, or regional purchasing arrangements, and provide more technical assistance to Alaska schools with their IT purchasing processes.
One potential model for a statewide or regional initiative is the Online With Libraries Program, or Alaska OWL. The Alaska OWL Program began as a federal grant program through NTIA and helps 97 libraries in the state procure broadband bandwidth through a collaborative purchasing arrangement. Alaska OWL, which has been state-funded for the last two years, makes state contributions to library connectivity under the pretense that OWL recipients apply for E-rate funding. Additionally, the program negotiates state and regional prices for library broadband upgrades.
For the last two years, the Alaska OWL Program has been funded directly by the state. In doing so, the project has facilitated strong increase in the purchase and use of broadband at Alaska libraries. Moreover, the Alaska OWL Program has provided a substantial return on the state’s investment, as it has resulted in a significant increase in the amount of E-rate funding that has been directed to Alaska libraries, from less than $500,000 per year in 2010 to well over $2 million by 2013. With a current budget of $761,000, the program pays for itself in E-rate funds for libraries in Alaska that

Alaska Broadband Audit Report | May 2015 Page | 78
likely would not otherwise get E-rate funding. While funding for Alaska OWL Program is included in the current budget, as of this writing, that budget has not yet been approved by the Legislature.20
The FCC E-rate program also has made rule changes to facilitate consortia applications for funding, such as giving consortia applications funding priority reviews and to allow for the use of designated master contracts, and allowing a consortium to seek individual service bids for its members even if the consortium is not the ultimate purchasing agent. Districts and the state should explore these new joint purchasing opportunities as a way to increase the bargaining power of district purchases of connectivity and to lower administrative costs.
4. The state and schools should continue to collect data on connectivity, track Alaska school and
library responses to the FCC e-rate rule changes, and update this report on an annual basis. Alaska school districts should review their investments in technology, including WANs on a yearly basis.
Beginning next year, the FCC and USAC state that they will be releasing more data on e-rate utilization by schools and libraries. In its reform efforts, the FCC has promised to make more data about the use of E-rate funds by schools and libraries available in an open and electronic format. When that data is made available, the Audit website and dataset could be updated with this new data, so as to provide an ongoing picture of connectivity at Alaska schools. Yearly technology reviews, particularly with regard to exploring the potential for WANs to save costs, should be part of an ongoing data collection project. Collection of data and yearly reviews will allow school E-rate funding requests to be based on the network structure that best serves the long-term needs of the institution. With microwave and other network technologies dramatically dropping in cost year to year, annual reviews may be particularly important for many rural, historically high-cost districts.
5. Further research should be conducted on the actual use of digital curricula, electronic text books,
and connected devices in Alaska schools. The Audit did not explore, for instance, the number of hours of "digital instruction," the nature and quality of digitally-enabled instruction, impact on test scores, and the quality of online test experience.
The goal and scope of the Alaska School Broadband Audit was on the “connectedness” of schools and classrooms in Alaska – a technical assessment of IT capabilities and processes. While visiting schools to gather this information, Connect Alaska staff encountered a wide range of uses and applications of broadband and digital education tools, an array as diverse as the state itself.
Further research on how educators and schools are using technology would be an important area of study, particular if one seeks to fully understand the educational impact of technology. How many hours per day are connected devices used in education? What are the most-used educational applications and services in the state? How readily are electronic textbooks being used in K-12 classrooms? Research on these questions would help advise educators and the state on the ways to maximize the impact of broadband on educational outcomes.
20 For more information, see http://library.alaska.gov/dev/owl.html and OWL Connects Alaskans, available at http://library.alaska.gov/pdf/anc/owl/OWL_infographic.pdf.

Alaska Broadband Audit Report | May 2015 Page | 79
6. Study the effect of off-campus connectivity for education and explore off-campus connectivity solutions.
A child’s education does not stop at the classroom door. As schools move increasingly toward digital curricula and connected devices as key learning tools, the extent to which students may not have access to those tools once they leave school will become increasingly important.
Every day in Alaska – indeed, nationwide – educators are faced with the challenge about whether to give homework assignments that require broadband connections for research and content. For students with computers and broadband at home, completing these assignments is relatively easy. For students without, completing that same assignment might require a nighttime visit to the library or squatting at a local free Wi-Fi spot. In rural and bush areas, off-campus connectivity beyond certain locations may be virtually non-existent or costly. The state and Alaska schools should explore opportunities to bridge this gap. In areas of the state with wireless broadband coverage, schools could purchase off-campus connectivity on those networks for school-provided devices, thus offering a way for students to take those devices home and connect back to the school network. Another alternative would be for schools or local libraries to purchase wireless broadband Wi-Fi hubs and make them available to qualifying students for check-out, which would allow temporary provision of broadband at home to complete an assignment. Local businesses could be encouraged to offer “school spots,” Wi-Fi connections that would tunnel directly back to school networks. Service providers could work collaboratively with schools, communities, and local businesses to overcome this challenge.

Alaska Broadband Audit Report | May 2015 Page | 80

Alaska Broadband Audit Report | May 2015 Page | 81
ABOUT THE ALASKA SCHOOL BROADBAND AUDIT PROJECT
The Alaska School Broadband Audit took significant strides to ensure that the data collected and analyzed fully represent the status and needs of Alaska schools and that the data is presented in a manner that could prove useful to interested parties from local educators to state administrators. Specific data collection methods were employed, including committing great resources to using Alaska-based engineers and research firms on the ground to validate school information, extraction of external data from reliable national and state databases, and surveys of school administrators and technical teams. The information gathered was not only presented in this report but also in a data visualization portal online for easy access to data on a district-by-district level.

Alaska Broadband Audit Report | May 2015 Page | 82
Data Visualization Portal The data visualization portal (akbroadbandaudit.org) provides all Alaska stakeholders – policymakers, school administrators, researchers, teachers, and other Alaska stakeholders – access to the raw datasets and interactive reports and charts and allows users to perform additional analyses and data comparisons of school and/or district broadband data along with state, regional, or national benchmarks. The goal of this data visualization portal is to display the Alaska Broadband Audit results in an engaging manner while offering the ability to download charts, share, and print the visual representation of the data. Additionally, the website allows users to seamlessly access white papers and the complete school audit report with analyses of the data performed by Connect Alaska. Below are instructions for using the portal: A. To View a District and School Report
1. Access the website by going to www.akbroadbandaudit.org.
2. Scroll over the school district Alaska map in the middle of the homepage to see the Alaska
school districts. When hovering on a school district, it will be highlighted.

Alaska Broadband Audit Report | May 2015 Page | 83
3. There are 2 ways to obtain a district report
� Click on the school district on the map or use the dropdown list to select a school district.
� A user can also find district reports by going to the reports page using the top navigation
and clicking View Reports.
Once a user is on the View Reports page you can select the school district using the district dropdown list and clicking Go to Report.

Alaska Broadband Audit Report | May 2015 Page | 84
4. Viewing the school district reports - The school reports will be generated on the format shown below. To view individual school reports from a selected district, click on the dropdown list next to the district name on the district report to generate the school report.
B. Interacting with School or District Reports
To view individual
school reports

Alaska Broadband Audit Report | May 2015 Page | 85
1. When viewing the district report, a user can interact with the reports and charts in the following
manner: � To see the actual bar value, a user should hover over the bar.
� Users can also turn bars on and off by clicking the legend under the chart to see only desired values and/or benchmarks.
� Users can download each chart in various image formats by clicking on the top right corner of the chart.
� Users can share the complete report page seamlessly using social media. Clicking on the red icon with a plus sign provides a large menu of different applications to use to share the reports including email, printing, social media etc.
C. Comparing and Contrasting School and District Data The data visualization portal allows users to compare Alaska schools’ and/or districts’ broadband data to regional peers, any other schools and/or districts, statewide averages and a national benchmark.
1. From the homepage, click on the View Reports link on the top navigation.
2. Select the broadband district metric to analyze under the Compare Schools and Districts section of the page.
3. Select up to 3 districts to compare. 4. Select the benchmarks and averages to analyze.

Alaska Broadband Audit Report | May 2015 Page | 86
5. Click GO! And the results will be generated. The chart will appear below the GO! icon. To compare school reports, repeat the same process for schools.
6. Select the specific district and/or school. 7. Select districts/schools to compare along with the district, regional, state or national
benchmarks. 8. Click GO! to run the report. 9. Similar to other charts, a user can share or print the report as discussed earlier.
D. Generating the Raw Dataset
1. To generate the complete dataset in an excel format go View Reports link on the top navigation.
2. Click on the thumbnail labeled Alaska School Audit Dataset.

Alaska Broadband Audit Report | May 2015 Page | 87
Validation Process and Data Collection A critical component to the success of the Alaska Broadband Audit was the on-the-ground presence and coordination among the districts across Alaska. As part of the project, Connect Alaska committed substantial hours, manpower, and planning into carrying out school site visits in all 53 school districts in the state. Not only were schools surveyed, but each district was personally visited by a qualified team of engineers focused on understanding the successes, challenges, and current broadband capacity of each district in the state. Before the actual traveling began, careful planning and coordination was completed. Connect Alaska engineers contacted technology coordinators, administrators, and auditors to plan site visits, and in August 2014, visits to urban and remote districts alike ensued. Engineers traveled across the state to districts on and off the road system, those accessible primarily by ferry, and schools only accessible by air in cars, jets, single-engine, and floatplanes with trips planned strategically to minimize travel costs and time. By the project completion, approximately 58,000 miles had been flown, 2,000 miles had been driven, and 60 schools had been visited. With the willingness of the school administrators and technical staff being crucial to the success of the site visits, an on-the-ground presence allowed the Alaska Broadband Audit project to understand much more thoroughly the needs of the students in the state. Figure 25: Map of School District Site Visits
� 58,000 miles flown � 2,000 miles driven � 60 schools visited
� 100% of school districts represented

Alaska Broadband Audit Report | May 2015 Page | 88
Validation Process Figure 26: Site Validation Image
When planning a site visit, Connected Nation engineers coordinated with district administrations to identify priority schools for site visits. Visits would be planned around one of two types of locations – those institutions that represented a typical school for the district or those that were significantly different from the other schools in the district perhaps due to connectivity challenges. Once schools were identified, travel plans were coordinated to minimize travel costs and time.
Figure 27: Site Validation Image
While onsite, the engineers conducted a variety of inspections, tests, and interviews. First and foremost, a visual inspection was completed identifying various technology aspects including backhaul presence and type, network switches and caching equipment, wiring configuration, access points, end points, and devices. Connect Alaska reviewed and took note of routers, switches, modems, and wiring plants and servers and attempted to visually confirm how the connection was made out. Accompanying photos were taken to capture the school’s infrastructure and landscape for identification and reference. Secondly, inventories were gathered on items such a network hardware, staff and student computers, as well as technology-based curriculum solutions. Wireless and wired speed tests were completed by the engineers onsite by performing tests for latency, upload, download, and wireless radio interference along with other activities as needed based on the network structure. Additionally, an audit questionnaire was completed by the district (see Appendix 2) asking for data regarding the schools that were not directly visited to create a complete picture of how broadband is utilized within the district. Lastly, interviews with technical and administrative staff were conducted to fully understand the position, current and future needs, and challenges teachers and staff face when bringing broadband to their students.

Alaska Broadband Audit Report | May 2015 Page | 89
Data Collection Data from both engineers was compiled and verified to assure integrity and then combined with data collected online to create a picture of broadband service to K-12 public school districts from across Alaska. A myriad of information was garnered during the site visits including:
� Current Broadband Service Provider � Technology and Type of Service � Broadband Partnerships with other
Institutions � Broadband Service Level � Monthly Broadband Rate for Service � E-rate Discounts � Dedicated or Shared Connection � Internal and External Download and
Upload Speeds � Latency � LAN connections � Wi-Fi Accessibility � Buildings – Single Structure or Multiple
Structures � Connection of Buildings � Managed versus Passive Networks � Primary Networking Equipment
� Planned Upgrades � Connection and Security Policies � Number of Devices per Student and per
Faculty-Staff � School Provided Devices and Bring-
Your-Own-Device Policies � Average Age of Devices � Technology Budget for Equipment � Future Technology Investments � Non-Technical Barriers to Technology
Implementation � WAN Connectivity � Number of schools connected to WAN � Technology Type Used for WAN
Deployment � Limitations Preventing WAN Usage � Current and Future Broadband Needs � Barriers to Broadband Improvements
Challenges in Data Collection
While performing the audits and data collections a number of challenges were encountered for showcasing an accurate picture of how broadband affects education in the state. In a state like Alaska with a great number of remote and rural areas, often off the road system, robust connectivity is crucial yet frequently very difficult to obtain due to environmental challenges, affordability, and other factors. These same factors affected the data collection process as weather, flights, and ferry transportation often determined the travel schedule for visiting sites in some of the most rural of areas. Figure 28: Image of the Lower Yukon School District Central Office
Additionally, properly representing the data as mid-year changes occurred in particular districts also served as challenging. For example, funding became available in 2015 for districts to increase bandwidth in small sites to 10 Mbps for the support of educational activities. This funding caused a much-needed bump to a number of sites offering higher speeds than originally represented in the earliest data collection.

Alaska Broadband Audit Report | May 2015 Page | 90
Engineers also learned that many institutions combine bandwidth with the local community library when that is housed within the school causing the bandwidth reported to be higher than may have been expected when looking strictly at the district E-rate application. Ongoing monitoring of networks in the state would be a vital data gathering activity for those attempting to determine the best manner to support broadband in K-12 education as Alaska schools aim to connect their students with the benefits of distance learning, online testing, and other digital applications. External Data Resources In addition to data points collected directly from schools or school districts themselves regarding technology adoption and use, Connect Alaska research staff also searched and extracted some socio-economic, demographic, and geographic information from various external resources at the individual school or school district level, and merged them into the Audited dataset for comprehensive analyses. Specifically, based on multiple databases from the Alaska Department of Education & Early Development (EED), the research staff collected student body population by schools and school districts, number of schools in school districts, and school district ID,21 and verified and adjusted self-reported school types and school physical addresses.22 To examine how the community income level impacts technology adoption and use among schools, median household income and poverty rate by school district levels were extracted from Census 2013 and manipulated into the collected data. In addition, the Free/Reduced Lunch Eligibility is another important metric to measure a community’s level of wealth. Therefore, this metric by individual school and individual school district level were also included in the dataset. Individual school level eligibility was from the Alaska Department of Education and Early Development’s (EED) 2013 National School Lunch Program Free & Reduced Percentage Report, 23 and the district level eligibility was extracted from the Universal Service Administrative Company’s (USAC) 2015 470 information.24 School and school district urban/rural classification were under the new E-rate rule, where schools are classified as urban when a school’s physical address is located in one of the following areas: 1) ‘Urban areas’ which are densely settled cores of census tracts that have 50,000 or more people, and 2) ‘Urbanized clusters’ which are located near ‘Urban areas’ that have between 25,000 and 49,999 people; schools that are not located in these areas are classified as rural. School district urban/rural classification depends on how many schools in a district are located in urban or rural areas. If a majority of a district’s schools are classified as rural, then this entire school district is classified as rural; otherwise, it is labeled as urban. For audited schools’ urban/rural classification, the research staff identified urban/rural status of most of the schools by matching the USAC’s urban/rural report with the audited dataset by school names.25 For those with invalid physical addresses in the USAC report, the research staff included them under the new E-rate rule using a corrected, self-reported physical address. As a result, 341 schools were classified as rural among 479 audited schools, and 3 school districts were classified as urban including Anchorage, Fairbanks, and Matanuska-Susitna in the Audited dataset.
21 EED: http://education.alaska.gov/stats/. 22 EED: http://education.alaska.gov/DOE_Rolodex/SchoolCalendar/. 23 EED: http://education.alaska.gov/21cclc/pdf/2013_nslp_free_and_reduced_eligibility_report.pdf. 24 USAC: http://www.slforms.universalservice.org/Form470DownloadTool. 25 USAC: http://universalservice.org/sl/tools/urban-rural-report/default.aspx.

Alaska Broadband Audit Report | May 2015 Page | 91
Race/ethnicity information by school districts was obtained from NCES’s School District Demographic System based on 2010 census.26 With that, it could be addressed regarding racial effect on variation in technology between multiple groups. In addition, some metrics on a regional basis cannot be directly extracted from the above external resources. This report made a weighted estimate. For example, regional poverty rates were estimated as a weighted average of the region’s school district’s poverty rates weighted by a school district’s total population, the sum of the product of each school district population and poverty rate divided by the sum of each school district’s population in a particular region. The data collected from these external resources and the effective use of information in the existing Connect Alaska database allowed for a greater depth of understanding of Alaska’s schools and communities where they are located. Needs Assessment Methodology Connect Alaska, in partnership with the Alaska Department of Commerce, Community, and Economic Development, contracted with Anchorage-based Hays Research, to conduct surveys of Alaska public schools across the state. Hays Research was identified as an expert in data collection on topics related to education in Alaska, and chosen based in-part due to their 13 years of experience focusing on the unique challenges that arise when attempting to collect data from schools and households in remote parts of the state. Hays Research conducted surveys on behalf of Connect Alaska between November 19, 2014 and December 17, 2014. Surveys were conducted using mixed methodologies, with representatives from Hays Research contacting public K-12 schools across the state by telephone and also offering them the opportunity to provide more in-depth responses online to ensure that time restrictions did not limit the information that school administrators were able to provide. Once respondents agreed to participate, these surveys took approximately ten (10) minutes to complete. The purposes of this survey were as follows:
1. Determine whether, and/or to what extent, current broadband speeds and availability hamper Alaska schools’ ability to provide high quality education to their students;
2. Determine schools’ normative, expressed, and perceived broadband needs; 3. Help policymakers determine the costs that would be required to improve school broadband
connectivity to normative standards; 4. Determine current uses of broadband and computer technology at Alaska K-12 public schools; 5. Determine school administrators’ current expressed and perceived technology needs; 6. Determine school administrators’ anticipated technology needs for the near future; and 7. Collect data about broadband-enabled applications or programs that Alaska schools would
utilize if higher broadband speeds were deployed. Multiple attempts were made to contact the principal at each participating school. In instances where the principal was not available, callers asked to speak to the individual at the school with the most 26 NCES: http://nces.ed.gov/surveys/sdds/ed/index.asp.

Alaska Broadband Audit Report | May 2015 Page | 92
knowledge about incorporating technology into the school’s curricula. Contact names and phone numbers were obtained from the Alaska Department of Education and Early Development. Altogether, representatives of 55 Alaska public schools were contacted, representing a response rate of 9.6% of public schools in the state.

Alaska Broadband Audit Report | May 2015 Page | 93

Alaska Broadband Audit Report | May 2015 Page | 94
CONCLUSION
As evidenced in the Alaska School Broadband Audit report, technology needs among schools are great and the capacity needed for even adequate levels of service is on the rise. With a large majority of schools falling behind the E-rate’s long-term benchmark of 1000 Kbps per student and staff, Alaska must make strides to improve the quality of broadband access for its educational institutions. Accordingly, the state’s K-12 public school students need commitment from state and local leaders and educators to take strong action toward improving the broadband capacity, speeds, and costs of the technology students require to ensure even the most remote of villages are connected to world-class educational content. As Connect Alaska learned from Audit travels, interviews, and research, school districts are dedicated to utilizing what technology they do have to guarantee quality learning, however, often schools are facing slow speeds, poor latency, high costs of service, and out-of-date equipment. Through improved funding, research, and E-rate support, Alaska schools can offer students better connectivity and digital learning opportunity helping to close the digital divide across the state. As discussed above, the complete results, data, and findings of this Audit are publicly available at www.akbroadbandaudit.org. These data and findings will be available for the public to review, use, study, and compare. These data and findings do not belong to Connect Alaska, but rather to the educators and school IT staff who filled out forms, answered phone calls, and patiently explained their challenges. These data and findings belong to the network engineers who crossed the state, to visit every school district and who took the time to understand the unique challenge each district faces. And most importantly, these data findings belong to the people of Alaska, who send their children to school every day, in the hope that they will get the best education possible.

Alaska Broadband Audit Report | May 2015 Page | 95
APPENDIX

Alaska Broadband Audit Report | May 2015 Page | 96
Appendix 1: Broadband: A Critical Element of Education in Alaska White Paper

�
�
����������������
� �

�
���
� �
�����������
• � �������������������������������������������������������������� ��
• ����������������������������������� �������������������� ���� ����� ��������� ���� �� �������� ������������������� ���������������������
• ����������������������������������� ��� ��� ��� �������� ���!!� ������������� �� ������������������������ ����� �� ����� ����������
• ���!"!����+@@"�������� ��� ��� �����������"##�$�!��Q�+���!+��������+��!+X�������!���"������������"����+����+��+!�"��������!+"�������������!�������
• ���� ���� �������������������������������������������������������������������� ����
• ���������� �������������������������������������������������������� �� ���������� � ������� ���Z������������������������������ �� �������������
• � ���������� ����������� ��� �� �������� ����������������� ����������������������� ����������������������������������������� ���� ������������������������������ ������������������������������������������������ �������������������� ����������������������������������� ������������
�
���������� ������������������������������� ��������������������������
��������������������������������������������������
�����������

�
���
������������� ���
����������������� ���� �� ���� ��������� ����������� �������������������� ������������������������ ���������� ���������������������� ���������� �������������� ������� ��� ����������������������� ����� ������� �������������������������������������[����� ��������������������������������[�������������� �� ������������ �� ���� ��� �� ������������������������������������ ���������������������������������������������������������������� ��� �������������������������� ��� ������ � �����������������������������������Z����������������������������� ������ ���� �������������������� ������������������������������� ������������������������ ������������������������������������������ ��������������������������������������������������� ��� ���� ������Z������������������������������������������ ���� ��� ����������� � ��������������� ��� �������������������������������� ����� ������ �������������� �������������� ���� ��� � ��������������������� �\�
� ������������������������������������������� � �������������� ���������������� �������������������������������������������� �� �������������� ����������������������������������� ������������������ ����������Z��Z��Z������������� ���������������������������� �������������������������������������������������� ���� ���Z������������������������������������������������ � � �������� ���������� ������������ ���������� ������������������������������������ ��������������������������������������������� ���������������� ������������������������� ���������������� ������������������������ ���������������������� ������ ���� ������� ���� �� �������������������������������� ��������� ��������������������������� ����������������� �������� ��������������������������������������������������������������� ������������ ������������������������������� ��
�
�
���������������������������������������������������������������������������������� �������������������� ������������ �������������������������� �� ������������������
� �� !!!"����"�# ������ "���$"�
��������������������������������������� ���������������������������
��������� ������������

�
���
��������������������������� ������������������������������������������������������������� �� ������������� �������� ����� �� ������ ����������������� ����������������������� �� ������ ������������������������������]�������������������������� �������������������������� ������������������������� ��������� ��������Z�����������Z����� �����^�
����������������� ������������������������������� �������������� �������������� ���������������������������������������������������������������������������������������������� ������������������������������������������ �������������������� ��� ������� ���������������������� ����������� ��������� � ��Z���������������
� �
��������������������������������������������������������������������%������������������ �������������������������� ��� ������ ���� � ��������&��'���� �� ���(���� �����(�����
'������� ���� ���%)�*+%)�,����������"�*������������&��'���� �� ���(���� �����(�����'������� ��(('����� ���%)�*+%)�,�����������
� �� ����� �"����&�"#� -.� �/(' "��
�������� ������������������ ��� � ������ �������� ������ ������ ���������� � � � ������Z������������ �������������
������������������������������������������������������������������

�
���
��������������� �������� �
������������������ ������������������������������������������������ � �������������������� ��������������������������� ���������� ������������������ ���������� � � ��� ������������� ��������������������������������� ��������������������������������������������������������������������
������������������������������������������������������������� ���� ����������� ����� � ������ �������� ����� ������������������������ ���������� ��������������������������� ��� �������%������������������������������������������ ������
�������������������� � � �� ����� ����������� ���� ��������������������������������������������� ��������������������� ����������������� ��� �������������������� ������������� ������� � ������������ ����� �� � ��������� ��� �� �� ��� ������������������������������������������������������������������������������Z�����������`�� ��������������������������� ���������������������Z���������������� ����������������� � ��������������� �� �������������� ������� ������������������ ���������������������������������������������������������������������
� ����� �������� ����������� ����������������������������������������� �� ��������� ��������������� ��� ���������� �����������������������������������������������������������
� �
��������������������������������������������������������������������`��+"!��{�����{}}�����+�����������+��+!}�����}���"��}����}����+��������~���������
��������������������������� ������������������������ �
����������������
��������������������������������� ���� �� ������������������������ ���������

�
���
������������ ������� ����������������������
��������������������������������������������
������ ���������������������������� �������������Z������������������������������������������������������ ������������������������������������������������������������������ ������������������������������������� ���������������� �� ������������������������������������������
�������� � ������ ���� ������ �� ���� �������������� � ������� ����������� ��������� ������� ������������������������������������������������������ ���������� ������������������������������������������ ���������������� ��������������������� �����������������Z��������������������� ������������������� �� � ��������������� �������� �������� ������������������ � ������������ ����������������� �� ������ �������� �������������������������������������������������������������������������������������������������������������������������������� �� �������������������� ��������� ��������� ��� ��������������������������������������������������������������������������������������� �������������������������������������������������������������������� ������� ����������������� ��������������������������������������������Z ��������������������������������������������� ����������������������������������� ��������� ������ ���
�
��������������������������������������������������������������������������������������!�������Q�++ {�����!�����������������!"@�+����"�����������X�������������!��+��������{}}�����+@+!!+��+!�}��� "�}����}��\^��"��������+!��������
�������&'������� ������ ����������� ���� �������� ��� ���� �������%���������!!��� �����

�
���
�������� ����������������� �������������������� ������ �������������������������������������� �������������� ��������������������������� ������������������� ������� � � �������������� ���� ��� ������ ���� ������� ���������������� ��� ����� �������� ������������������������ ���������������� ���������� �� ��� ��������� �������������������������������������������������������������������������������������������������������� ������������������������������ ������� ������������������ ������������������������������� �������������������������������������� ������������ ������� ���������� ����������������
�� ������������������������� �� �������� � �� ����� ���� ���������������������������������������Z�������������������������������� ������������������ ������������ ���� ���������������� �������������� ������� �� ����������������������������������������� ������������������������� ������� ������������������������Z����������� ������� ������������������������� �����������������������
�
��
�����������������������������������������������������������������������+"!��{�����{}}�����+����������+��+!�}�����}���"��}�����}��~��}�+���Q~�!���~+�~���~���~�!+����~��������+�~����������
������������������������������ �����������������������������
������ �� ������������������ ������ ���� � ������������� �� ������������������ ��������������� ��� ���������������������������� ����
���� ���� �������

�
���
���������������� ������������������������������������������������������������������������������������������������������������������������������������ ��� ����� ���������������� ���� ���� ����� ������
����������������� �������������������������������������������������������������������������������������������������� ������������������������ ��������������������������Z���������������������������������� ��������������������������������������� ������������������ ������������������������������������������������� ��������
�
�
�
�
�
�
�
�
�
�
�
�
�
������������� ���������������������������������������� �������������������������������������������������������������������������������������������������������������������
�
�
���������������������� ��������� ������������������������������������������ ��������� ����������� ��������������� ��������� �����������

�
���
������������
������������������ � ����������� ������ ��� �������������������������������������������������������������������� ������������������������������Z������������������ ���������������� � ����� ����������������������� �������� ��� �������������� ��������������������������������� �������������������� ������������������������������������������������������������������ ���������������� ������������ �� ������� ������������ ���������� � ������ ������� � ��������
���������� � �� ������� �� ������������������������� ���� ����� � �� ����������������� ������������������������������������� ��� �� ������������� ���� ��� � ���� ��� �� � ���� ������������������ ������������ ������������������������ ������
�
���������������������� � �������� ���������������������������������������������������� �������
�
�
�
�
�
�
�
�
�
������������������������������������������ ����������������� ������������� ��������� ����� ��������������������������������������� ����������� ������� ����� ����������������������� � ������ ��������� ����� �������� ��������������������������������� ������������� ��������������������������
������������������� �������������������� ��������������������������������������������������������� ��������� ��������� ����
��� ��������� �������������������������������������������
������ �������������� ��

Alaska Broadband Audit Report | May 2015 Page | 97
Appendix 2: Site Validation Examples The following site validations serve as a sample of the 53 visits across Alaska. Kodiak High School Onsite Assessment Kodiak Island School District Onsite Assessment “Kodiak High School is currently under construction and the upgrade to Wi-Fi is underway. The middle and high schools are separated by a connecting hall. There is a large amount of rural schools on satellite backhaul dedicated bandwidth. The bandwidth is sufficient for city schools. The rural schools are workable but have limited expansion capabilities. The network department recently increased its staffing, and the director position remains open. A refresh is deployed every five years with some catch-up required due to budgeting and available monies. The school uses both Apple and IBM technologies.” Visit completed by John Determan on October 16, 2014.
External Connectivity Current Broadband Service Provider GCI What type of service is provided to your school? (Asymmetric xDSL, Symmetric xDSL, Other Copper Wireline, Cable Modem-DOCSIS 3.0, Cable Modem-Other, Optical Carrier/Fiber to the End User, Satellite, Terrestrial Fixed Wireless-Unlicensed, Terrestrial Fixed Wireless-Licensed, Terrestrial Mobile Wireless, Electric Power Line, Other)
Fiber
Does your school partner with any other local entity, other than schools, for broadband service?
No
What service level does your school subscribe to? 400 Mbps symmetrical district wide
What monthly rate is paid for the services provided? See district wide
Is this inclusive or exclusive of E-rate? See district wide How much E-rate support does your school receive for its Internet connectivity (% and dollar)?
72%
Is the school connection a dedicated connection from your provider, a shared connection with other schools on a district-wide network, or a combination of the two?
Shared
Download: 320 Mbps Upload: 366 Mbps Latency (Ping): 7 Path can be tested using "tracert *.*":
Page | 106

Alaska Broadband Audit Report | May 2015 Page | 98
Internal Connectivity Is your school entirely hardwired (LAN)? Yes Is it overlaid or extended with Wi-Fi? Yes If your campus consists of multiple buildings, how are they connected? Multiple
How many Instructional rooms/spaces exist in and around the school facility? 43
How many of these instructional spaces are connected via LAN connection? All
How many of these instructional spaces are connected via a wireless LAN (e.g., Wi-Fi) connection?
All
Are there additional areas that you would like to see connected that are not currently? How many? Are they adjacent or remote?
Yes
Are there other non-instructional areas of your school that you have connected, either through LAN or Wi-Fi facilities?
Yes
If you have Wi-Fi at your school, is it managed or are the access points and routers passively moving traffic?
Managed
Do you feel that the current Wi-Fi deployment in your school is adequate for your needs?
No
What is the primary networking equipment currently deployed at your school? (e.g., Cisco 7600 series router, Cisco Catalyst 6500 series switch, Cisco Pix 501 firewall, Cisco 871 W-G-A-K9 Ethernet wireless router)
Cisco Apps, Cisco Dell switches
Are upgrades planned to the current equipment? Yes
Are there connection policies in place for devices on the school network? Are these policies written or implied?
Yes , GCI handles all filtering
Are there security policies in place? Are these policies written or implied? Yes
Download: Upload: Latency (Ping):
Page | 107

Alaska Broadband Audit Report | May 2015 Page | 99
Devices & Applications Number of devices per student, either provided by the student or the school? Number of devices
400 laptops 120 iPads
Does the school provide devices for students? Yes Does the school require students to have devices? No Are students and/or faculty allowed to connect personal devices to the school network?
Yes
Number of devices per faculty and staff member? 2 to 1 for all certified teachers
In general, how old are the computers, devices, and software applications that are currently used?
5 years
Does your school (or system) budget technology and connectivity-related equipment into its yearly budget? Yes but limited Does your school intend to invest in additional technologies in the next 12, 24, or 36 months? Briefly describe?
Yes if funded. WiFi needs updating, backhaul needs to be increased simultaneously
Are there non-technical barriers to implementing or utilizing certain technologies? Yes
District Information Does the district operate a system-wide network such as a LAN or WAN, that connects all schools and other facilities with one another? WAN How many schools and facilities are connected to this network? 13 What technology type is used to deploy this network? Copper, fiber, microwave, or wireless?
Fiber, wireless and satellite
If the district operates a district-wide network, are all schools connected? Yes Please list any school not connected to the district-wide network?
N/A What limitations keep these schools from being connected to the district-wide network? N/A What is the capacity of the district-wide network? 300 Mbps What is the maximum connection speed to individual schools across the district-wide network? 300 Mbps Does the school district provide unique applications, other than broadband connectivity across the district-wide network?
Multiple web based; scholastic based
Are there specific applications that are enabled by the use of the district-wide network? Distance Delivery Are there specific applications that you would like to use if the district either had a district-wide network or had more capacity on the current network?
Capacity and district-wide adequate for today's demands
Page | 108

Alaska Broadband Audit Report | May 2015 Page | 100
Lathrop High School Onsite Assessment Fairbanks North Star Borough School District Onsite Assessment “Nice network and management. The school uses security cameras on the network and manages the cameras locally. Current bandwidth is good, but it is not affordable to increase speeds. The network is in good shape and constantly upgrading wireless access points and network equipment. Regarding the future, the school would like to move to a 1:1 initiative and/or establish a Bring Your Own Device (BYOD) policy; however, current network restrictions limit such implementations. Moreover, the school would have interest in 100% cloud storage and would consider it a huge step toward the future.” Visit completed by John Determan on September 16, 2014.
External Connectivity Current Broadband Service Provider ACS and GCI What type of service is provided to your school? (Asymmetric xDSL, Symmetric xDSL, Other Copper Wireline, Cable Modem-DOCSIS 3.0, Cable Modem-Other, Optical Carrier/Fiber to the End User, Satellite, Terrestrial Fixed Wireless-Unlicensed, Terrestrial Fixed Wireless-Licensed, Terrestrial Mobile Wireless, Electric Power Line, Other)
Fiber
Does your school partner with any other local entity, other than schools, for broadband service?
No
What service level does your school subscribe to? 200 M
What monthly rate is paid for the services provided? $8,000
Is this inclusive or exclusive of E-rate? Inclusive How much E-rate support does your school receive for its Internet connectivity (% and dollar)?
80% ($6400.00)
Is the school connection a dedicated connection from your provider, a shared connection with other schools on a district-wide network, or a combination of the two?
District-wide
Download: 317 Upload: 192 Latency (Ping): 484 Path can be tested using "tracert *.*":
Page | 109

Alaska Broadband Audit Report | May 2015 Page | 101
Internal Connectivity Is your school entirely hardwired (LAN)? Yes Is it overlaid or extended with Wi-Fi? Yes If your campus consists of multiple buildings, how are they connected? No
How many Instructional rooms/spaces exist in and around the school facility?
How many of these instructional spaces are connected via LAN connection? All
How many of these instructional spaces are connected via a wireless LAN (e.g., Wi-Fi) connection?
All
Are there additional areas that you would like to see connected that are not currently? How many? Are they adjacent or remote?
No
Are there other non-instructional areas of your school that you have connected, either through LAN or Wi-Fi facilities
Parking lot and sport venues
If you have Wi-Fi at your school, is it managed or are the access points and routers passively moving traffic?
Yes
Do you feel that the current Wi-Fi deployment in your school is adequate for your needs?
No
What is the primary networking equipment currently deployed at your school? (e.g., Cisco 7600 series router, Cisco Catalyst 6500 series switch, Cisco Pix 501 firewall, Cisco 871 W-G-A-K9 Ethernet wireless router)
Cisco varies 1200, 1100, 3600 3550
core, 2960S gigabit
Are upgrades planned to the current equipment? Yes
Are there connection policies in place for devices on the school network? Are these policies written or implied?
Yes acceptable written
Are there security policies in place? Are these policies written or implied? Included in acceptable use
Download: 17 Upload: 15 Latency (Ping): 48
Page | 110

Alaska Broadband Audit Report | May 2015 Page | 102
Devices & Applications Number of devices per student, either provided by the student or the school? Does the school provide devices for students? Yes Does the school require students to have devices? No Are students and/or faculty allowed to connect personal devices to the school network?
Faculty only
Number of devices per faculty and staff member? 1:1 teachers In general, how old are the computers, devices, and software applications that are currently used?
More than 5 years
Does your school (or system) budget technology and connectivity related equipment into its yearly budget? Yes Does your school intend to invest in additional technologies in the next 12, 24, or 36 months? Briefly describe? Yes Are there non-technical barriers to implementing or utilizing certain technologies? No comment
District Information Does the district operate a system-wide network such as a LAN or WAN, that connects all schools and other facilities with one another? Yes
How many schools and facilities are connected to this network? 37 What technology type is used to deploy this network? Copper, fiber, microwave, or wireless? fiber-copper
If the district operates a district-wide network, are all schools connected? Yes Please list any school not connected to the district-wide network. One with limited
bandwidth due to remoteness
What limitations keep these schools from being connected to the district-wide network? Remoteness
What is the capacity of the district-wide network? 6 Mb to 4 Gig What is the maximum connection speed to individual schools, across the district-wide network? 4 Gig
Does the school district provide unique applications, other than broadband connectivity across the district-wide network?
Distance ed; video conferencing;
VOIP Are there specific applications that are enabled by the use of the district-wide network?
Distance ed; video conferencing;
VOIP Are there specific applications that you would like to use if the district either had a district-wide network or had more capacity on the current network? Student BYOD
Page | 111

Alaska Broadband Audit Report | May 2015 Page | 103
Appendix 3: School District Summary Pages
Page | 112

Students and Staff Have Access to
112 Kbps of Internet Connectivity
at a Total Cost of
$94.86 Per User, Per Month.
DISTRICT FACTS
Population 2,442Student Body
Schools
Region
Median Household
Poverty Rate
Free/Reduced Lunch Eligibility
E-Rate Discount
4048
Central(Road System)
$40,795 20%
97%
90%
HOW SCHOOLS ARE CONNECTED TO THE INTERNET
TECHNOLOGY IN THE CLASSROOM
DOWNLOAD SPEED TARGETS PER STUDENT/STAFF
ELEMENTARY
K-12 SCHOOL
District Average Statewide Average National Benchmark
Kbps PER STUDENT/STAFF
500 10000
WIRELINE
FIBER
SATELLITE
3
2
1
Alaska Gateway School District
SCHOOL BROADBAND AUDIT
ALASKA
AVERAGE AGE OF DEVICES (YEARS)NUMBER OF DEVICES PER STUDENT
StatewideDistrict
0.6 0.6 2
4.6
® 2015 CONNECT ALASKA
1WIRELESS
For more information, visit akbroadbandaudit.org.
Analyses based on validated data from 94% of Alaska K-12 schools that participated in the audit.

Students and Staff Have Access to
48 Kbps of Internet Connectivity
at a total Cost of
$243.90 Per User, Per Month.
DISTRICT FACTS
Population 439Student Body
Schools
Region
Median Household
Poverty Rate
Free/Reduced Lunch Eligibility
E-Rate Discount
37 2
Southwestern(Air)
$68,750 12%
81%
90%
HOW SCHOOLS ARE CONNECTED TO THE INTERNET
TECHNOLOGY IN THE CLASSROOM
DOWNLOAD SPEED TARGETS PER STUDENT/STAFF
K-12 SCHOOL
District Average Statewide Average National Benchmark
Kbps PER STUDENT/STAFF
500 1000 0
WIRELINE
FIBER
SATELLITE
0
0
2
Aleutian Region School District
SCHOOL BROADBAND AUDIT
ALASKA
AVERAGE AGE OF DEVICES (YEARS)NUMBER OF DEVICES PER STUDENT
StatewideDistrict
0.8 0.6 2 4.6
® 2015 CONNECT ALASKA
For more information, visit akbroadbandaudit.org.
0WIRELESS
F
Analyses based on validated data from 94% of Alaska K-12 schools that participated in the audit.

, 2015%
Students and Staff Have Access to
152 Kbps of Internet Connectivity
at a total Cost of
$310.28 Per User, Per Month.
DISTRICT FACTS
Population 3,141Student Body
Schools
Region
Median Household
Poverty Rate
Free/Reduced Lunch Eligibility
E-Rate Discount
2465
Southwestern(Air)
$61,250 16.7%
73%
80%
HOW SCHOOLS ARE CONNECTED TO THE INTERNET
TECHNOLOGY IN THE CLASSROOM
DOWNLOAD SPEED TARGETS PER STUDENT/STAFF
K-12 SCHOOL
District Average Statewide Average National Benchmark
Kbps PER STUDENT/STAFF500 10000
WIRELINE
FIBER
SATELLITE
0
0
5
Aleutians East Borough School District
SCHOOL BROADBAND AUDIT
ALASKA
AVERAGE AGE OF DEVICES (YEARS)NUMBER OF DEVICES PER STUDENT
StatewideDistrict
1 0.6 5 4.6
® 2015 CONNECT ALASKA
0WIRELESS
Analyses based on validated data from 94% of Alaska K-12 schools that participated in the audit.
For more information, visit akbroadbandaudit.org.

Students and Staff Have Access to
69 Kbps of Internet Connectivity
at a Total Cost of
$5.80 Per User, Per Month.
DISTRICT FACTS
Population 295,237 Student Body
Schools
Region
Median Household
Poverty Rate
Free/Reduced Lunch Eligibility
E-Rate Discount
48,154 97
Central(Road System)
$77,454 8%
47%
60%
HOW SCHOOLS ARE CONNECTED TO THE INTERNET
TECHNOLOGY IN THE CLASSROOM
DOWNLOAD SPEED TARGETS PER STUDENT/STAFF
ELEMENTARY
MIDDLE | HIGH SCHOOL
District Average Statewide Average National Benchmark
Kbps PER STUDENT/STAFF
500 10000
WIRELINE
FIBER
SATELLITE
94
1
0
Anchorage School District
SCHOOL BROADBAND AUDIT
ALASKA
AVERAGE AGE OF DEVICES (YEARS)NUMBER OF DEVICES PER STUDENT
StatewideDistrict
0.5 0.6 4.9 4.6
® 2015 CONNECT ALASKA
For more information, visit akbroadbandaudit.org.
0WIRELESS
K-12 SCHOOL
Analyses based on validated data from 94% of Alaska K-12 schools that participated in the audit.

Students and Staff Have Access to
323 Kbps of Internet Connectivity
at a Total Cost of
$79.36 Per User, Per Month.
DISTRICT FACTS
Population 1,630 Student Body
Schools
Region
Median Household
Poverty Rate
Free/Reduced Lunch Eligibility
E-Rate Discount
3814
Southeast (Ferry)
$50,052 13%
87%
90%
HOW SCHOOLS ARE CONNECTED TO THE INTERNET
TECHNOLOGY IN THE CLASSROOM
DOWNLOAD SPEED TARGETS PER STUDENT/STAFF
ELEMENTARY
MIDDLE | HIGH SCHOOL
District Average Statewide Average National Benchmark
Kbps PER STUDENT/STAFF
500 10000
WIRELINE
FIBER
SATELLITE
0
4
0
Annette Island School District
SCHOOL BROADBAND AUDIT
ALASKA
AVERAGE AGE OF DEVICES (YEARS)NUMBER OF DEVICES PER STUDENT
StatewideDistrict
1.4 0.6
5.4 4.6
® 2015 CONNECT ALASKA
For more information, visit akbroadbandaudit.org.
0WIRELESS
Analyses based on validated data from 94% of Alaska K-12 schools that participated in the audit.

Students and Staff Have Access to
54 Kbps of Internet Connectivity
at a Total Cost of
$170.98 Per User, Per Month.
DISTRICT FACTS
Population 6,022Student Body
Schools
Region
Median Household
Poverty Rate
Free/Reduced Lunch Eligibility
E-Rate Discount
1,848 15
Northern(Air)
$36,763 38%
85%
90%
HOW SCHOOLS ARE CONNECTED TO THE INTERNET
TECHNOLOGY IN THE CLASSROOM
DOWNLOAD SPEED TARGETS PER STUDENT/STAFF
K-12 SCHOOL
District Average Statewide Average National Benchmark
Kbps PER STUDENT/STAFF500 10000
WIRELINE
FIBER
SATELLITE
0
0
14
Bering Strait School District
SCHOOL BROADBAND AUDIT
ALASKA
AVERAGE AGE OF DEVICES (YEARS)NUMBER OF DEVICES PER STUDENT
StatewideDistrict
1 0.6
5 4.6
® 2015 CONNECT ALASKA
For more information, visit akbroadbandaudit.org.
1WIRELESS
Analyses based on validated data from 94% of Alaska K-12 schools that participated in the audit.

Students and Staff Have Access to
82 Kbps of Internet Connectivity
at a Total Cost of
$237.91 Per User, Per Month.
DISTRICT FACTS
Population 933Student Body
Schools
Region
Median Household
Poverty Rate
Free/Reduced Lunch Eligibility
E-Rate Discount
1343
Southwestern(Air)
$79,531 8%
50%
80%
HOW SCHOOLS ARE CONNECTED TO THE INTERNET
TECHNOLOGY IN THE CLASSROOM
DOWNLOAD SPEED TARGETS PER STUDENT/STAFF
ELEMENTARY
MIDDLE | HIGH SCHOOL
District Average Statewide Average National Benchmark
Kbps PER STUDENT/STAFF
500 10000
WIRELINE
FIBER
STATELLITE
0
0
0
Bristol Bay Borough School District
SCHOOL BROADBAND AUDIT
ALASKA
AVERAGE AGE OF DEVICES (YEARS)NUMBER OF DEVICES PER STUDENT
StatewideDistrict
1 0.6
5.1 4.6
® 2015 CONNECT ALASKA
For more information, visit akbroadbandaudit.org.
1WIRELESS
Analyses based on validated data from 94% of Alaska K-12 schools that participated in the audit.

Students and Staff Have Access to
150 Kbps of Internet Connectivity
at a Total Cost of
$120.69 Per User, Per Month.
DISTRICT FACTS
Population 1,370 Student Body
Schools
Region
Median Household
Poverty Rate
Free/Reduced Lunch Eligibility
E-Rate Discount
1725
Southeast (Ferry)
$48,333 14%
55%
80%
HOW SCHOOLS ARE CONNECTED TO THE INTERNET
TECHNOLOGY IN THE CLASSROOM
DOWNLOAD SPEED TARGETS PER STUDENT/STAFF
K-12SCHOOL
District Average Statewide Average National Benchmark
Kbps PER STUDENT/STAFF
500 1000 0
WIRELINE
FIBER
SATELLITE
0
0
3
Chatham School District
SCHOOL BROADBAND AUDIT
ALASKA
AVERAGE AGE OF DEVICES (YEARS) NUMBER OF DEVICES PER STUDENT
StatewideDistrict
0.9 0.6
5.0 4.6
® 2015 CONNECT ALASKA
For more information, visit akbroadbandaudit.org.
0WIRELESS
Analyses based on validated data from 94% of Alaska K-12 schools that participated in the audit.

Students and Staff Have Access to
36 Kbps of Internet Connectivity
at a Total Cost of
$96.75 Per User, Per Month.
DISTRICT FACTS
Population 399Student Body
Schools
Region
Median Household
Poverty Rate
Free/Reduced Lunch Eligibility
E-Rate Discount
3104
Central(Air)
$41,042 22.3%
79%
90%
HOW SCHOOLS ARE CONNECTED TO THE INTERNET
TECHNOLOGY IN THE CLASSROOM
DOWNLOAD SPEED TARGETS PER STUDENT/STAFF
K-12 SCHOOL
District Average Statewide Average National Benchmark
Kbps PER STUDENT/STAFF500 1000 0
WIRELINE
FIBER
SATELLITE
2
0
0
Chugach School District
SCHOOL BROADBAND AUDIT
ALASKA
AVERAGE AGE OF DEVICES (YEARS)NUMBER OF DEVICES PER STUDENT
StatewideDistrict
0.3 0.6 4.5 4.6
® 2015 CONNECT ALASKA
For more information, visit akbroadbandaudit.org.
0WIRELESS
Analyses based on validated data from 94% of Alaska K-12 schools that participated in the audit.

Students and Staff Have Access to
135 Kbps of Internet Connectivity
at a Total Cost of
$9.58 Per User, Per Month.
DISTRICT FACTS
Population 2,493Student Body
Schools
Region
Median Household
Poverty Rate
Free/Reduced Lunch Eligibility
E-Rate Discount
4425
Central(Road System)
$52,540 11%
46%
70%
HOW SCHOOLS ARE CONNECTED TO THE INTERNET
TECHNOLOGY IN THE CLASSROOM
DOWNLOAD SPEED TARGETS PER STUDENT/STAFF
K-12 SCHOOL
District Average Statewide Average National Benchmark
Kbps PER STUDENT/STAFF
500 1000 0
WIRELINE
FIBER
SATELLITE
2
2
0
Copper River School District
SCHOOL BROADBAND AUDIT
ALASKA
AVERAGE AGE OF DEVICES (YEARS)NUMBER OF DEVICES PER STUDENT
StatewideDistrict
0.9 0.6
4 4.6
® 2015 CONNECT ALASKA
For more information, visit akbroadbandaudit.org.
0WIRELESS
Analyses based on validated data from 94% of Alaska K-12 schools that participated in the audit.

Students and Staff Have Access to
48 Kbps of Internet Connectivity
at a Total Cost of
$20.87 Per User, Per Month.
DISTRICT FACTS
Population 2,604Student Body
Schools
Region
Median Household
Poverty Rate
Free/Reduced Lunch Eligibility
E-Rate Discount
3493
Central(Ferry)
$96,875 1%
66%
80%
HOW SCHOOLS ARE CONNECTED TO THE INTERNET
TECHNOLOGY IN THE CLASSROOM
DOWNLOAD SPEED TARGETS PER STUDENT/STAFF
ELEMENTARY
MIDDLE | HIGH SCHOOL
District Average Statewide Average National Benchmark
Kbps PER STUDENT/STAFF
500 10000
WIRELINE
FIBER
SATELLITE
0
2
0
Cordova City School District
SCHOOL BROADBAND AUDIT
ALASKA
AVERAGE AGE OF DEVICES (YEARS)NUMBER OF DEVICES PER STUDENT
StatewideDistrict
1 0.6
5 4.6
® 2015 CONNECT ALASKA
For more information, visit akbroadbandaudit.org.
0WIRELESS
Analyses based on validated data from 94% of Alaska K-12 schools that participated in the audit.

Students and Staff Have Access to
145 Kbps of Internet Connectivity
at a Total Cost of
$36.16 Per User, Per Month.
DISTRICT FACTS
Population 1,301Student Body
Schools
Region
Median Household
Poverty Rate
Free/Reduced Lunch Eligibility
E-Rate Discount
5764
Southeast (Ferry)
$59,643 17.60%
76%
90%
HOW SCHOOLS ARE CONNECTED TO THE INTERNET
TECHNOLOGY IN THE CLASSROOM
DOWNLOAD SPEED TARGETS PER STUDENT/STAFF
ELEMENTARY
MIDDLE | HIGH SCHOOL
District Average Statewide Average National Benchmark
Kbps PER STUDENT/STAFF
500 10000
WIRELINE
FIBER
SATELLITE
0
3
0
Craig City School District
SCHOOL BROADBAND AUDIT
ALASKA
AVERAGE AGE OF DEVICES (YEARS)NUMBER OF DEVICES PER STUDENT
StatewideDistrict
0.9 0.6
4 4.6
® 2015 CONNECT ALASKA
For more information, visit akbroadbandaudit.org.
0WIRELESS
Analyses based on validated data from 94% of Alaska K-12 schools that participated in the audit.

Students and Staff Have Access to
133 Kbps of Internet Connectivity
at a Total Cost of
$22.06 Per User, Per Month.
DISTRICT FACTS
Population 4,796 Student Body
Schools
Region
Median Household
Poverty Rate
Free/Reduced Lunch Eligibility
E-Rate Discount
8156
Central(Road System)
$72,353 11.1%
36%
70%
HOW SCHOOLS ARE CONNECTED TO THE INTERNET
TECHNOLOGY IN THE CLASSROOM
DOWNLOAD SPEED TARGETS PER STUDENT/STAFF
District Average Statewide Average National Benchmark
Kbps PER STUDENT/STAFF
500 10000
WIRELINE
FIBER
SATELLITE
0
3
1
Delta Greely School District
SCHOOL BROADBAND AUDIT
ALASKA
AVERAGE AGE OF DEVICES (YEARS)NUMBER OF DEVICES PER STUDENT
StatewideDistrict
1 0.6
3 4.6
® 2015 CONNECT ALASKA
For more information, visit akbroadbandaudit.org.
0WIRELESS
ELEMENTARY
MIDDLE | HIGH SCHOOL
K-12 SCHOOL
Analyses based on validated data from 94% of Alaska K-12 schools that participated in the audit.

Students and Staff Have Access to
248 Kbps of Internet Connectivity
at a Total Cost of
$174.27 Per User, Per Month.
DISTRICT FACTS
Population 2,020 Student Body
Schools
Region
Median Household
Poverty Rate
Free/Reduced Lunch Eligibility
E-Rate Discount
8884
Central(Road System)
$72,500 11.4%
33%
60%
HOW SCHOOLS ARE CONNECTED TO THE INTERNET
TECHNOLOGY IN THE CLASSROOM
DOWNLOAD SPEED TARGETS PER STUDENT/STAFF
K-12 SCHOOL
District Average Statewide Average National Benchmark
Kbps PER STUDENT/STAFF 500 1000 0
WIRELINE
FIBER
SATELLITE
0
0
0
Denali Borough School District
SCHOOL BROADBAND AUDIT
ALASKA
AVERAGE AGE OF DEVICES (YEARS)NUMBER OF DEVICES PER STUDENT
StatewideDistrict
1 0.6
4 4.6
® 2015 CONNECT ALASKA
For more information, visit akbroadbandaudit.org.
3WIRELESS
Analyses based on validated data from 94% of Alaska K-12 schools that participated in the audit.

Students and Staff Have Access to
49 Kbps of Internet Connectivity
at a Total Cost of
$50.68 Per User, Per Month.
DISTRICT FACTS
Population 2,156 Student Body
Schools
Region
Median Household
Poverty Rate
Free/Reduced Lunch Eligibility
E-Rate Discount
4693
Southwestern(Air)
$68,036 12.9%
76%
90%
HOW SCHOOLS ARE CONNECTED TO THE INTERNET
TECHNOLOGY IN THE CLASSROOM
DOWNLOAD SPEED TARGETS PER STUDENT/STAFF
ELEMENTARY
MIDDLE | HIGH SCHOOL
District Average Statewide Average National Benchmark
Kbps PER STUDENT/STAFF
500 10000
WIRELINE
FIBER
SATELLITE
0
0
0
Dillingham City School District
SCHOOL BROADBAND AUDIT
ALASKA
AVERAGE AGE OF DEVICES (YEARS)NUMBER OF DEVICES PER STUDENT
StatewideDistrict
1 0.6
5 4.6
® 2015 CONNECT ALASKA
For more information, visit akbroadbandaudit.org.
2WIRELESS
Analyses based on validated data from 94% of Alaska K-12 schools that participated in the audit.

Students and Staff Have Access to
437 Kbps of Internet Connectivity
at a Total Cost of
$1.12 Per User, Per Month.
DISTRICT FACTS
Population 98,656 Student Body
Schools
Region
Median Household
Poverty Rate
Free/Reduced Lunch Eligibility
E-Rate Discount
13,891 35
Central(Road System)
$69,223 8%
37%
60%
HOW SCHOOLS ARE CONNECTED TO THE INTERNET
TECHNOLOGY IN THE CLASSROOM
DOWNLOAD SPEED TARGETS PER STUDENT/STAFF
ELEMENTARY
MIDDLE | HIGH SCHOOL
District Average Statewide Average National Benchmark
Kbps PER STUDENT/STAFF
500 10000
WIRELINE
FIBER
SATELLITE
13
21
0
Fairbanks NorthStar Bourough School District
SCHOOL BROADBAND AUDIT
ALASKA
AVERAGE AGE OF DEVICES (YEARS)NUMBER OF DEVICES PER STUDENT
StatewideDistrict
0.5 0.6 4.1 4.6
® 2015 CONNECT ALASKA
0WIRELESS
For more information, visit akbroadbandaudit.org.
Analyses based on validated data from 94% of Alaska K-12 schools that participated in the audit.

Students and Staff Have Access to
35 Kbps of Internet Connectivity
at a Total Cost of
$146.11 Per User, Per Month.
DISTRICT FACTS
Population 566Student Body
Schools
Region
Median Household
Poverty Rate
Free/Reduced Lunch Eligibility
E-Rate Discount
4,384 4
Central(Air)
$60,313 12%
49%
70%
HOW SCHOOLS ARE CONNECTED TO THE INTERNET
TECHNOLOGY IN THE CLASSROOM
DOWNLOAD SPEED TARGETS PER STUDENT/STAFF
K-12 SCHOOL
District Average Statewide Average National Benchmark
Kbps PER STUDENT/STAFF500 1000 0
WIRELINE
FIBER
SATELLITE
0
0
2
Galena City School District
SCHOOL BROADBAND AUDIT
ALASKA
AVERAGE AGE OF DEVICES (YEARS)NUMBER OF DEVICES PER STUDENT
StatewideDistrict
0.5 0.6 2.2
4.6
® 2015 CONNECT ALASKA
0WIRELESS
Analyses based on validated data from 94% of Alaska K-12 schools that participated in the audit.
For more information, visit akbroadbandaudit.org.

Students and Staff Have Access to
127 Kbps of Internet Connectivity
at a Total Cost of
$11.18 Per User, Per Month.
DISTRICT FACTS
Population 2,546 Student Body
Schools
Region
Median Household
Poverty Rate
Free/Reduced Lunch Eligibility
E-Rate Discount
2803
Southeast (Ferry)
$52,866 8%
51%
80%
HOW SCHOOLS ARE CONNECTED TO THE INTERNET
TECHNOLOGY IN THE CLASSROOM
DOWNLOAD SPEED TARGETS PER STUDENT/STAFF
MIDDLE | HIGH SCHOOL
District Average Statewide Average National Benchmark
Kbps PER STUDENT/STAFF
500 10000
WIRELINE
FIBER
SATELLITE
0
1
0
Haines Borough School District
SCHOOL BROADBAND AUDIT
ALASKA
AVERAGE AGE OF DEVICES (YEARS)NUMBER OF DEVICES PER STUDENT
StatewideDistrict
1 0.6
4 4.6
® 2015 CONNECT ALASKA
0WIRELESS
For more information, visit akbroadbandaudit.org.
Analyses based on validated data from 94% of Alaska K-12 schools that participated in the audit.

Students and Staff Have Access to
30 Kbps of Internet Connectivity
at a Total Cost of
$173.86 Per User, Per Month.
DISTRICT FACTS
Population 722Student Body
Schools
Region
Median Household
Poverty Rate
Free/Reduced Lunch Eligibility
E-Rate Discount
117 2
Southeast (Ferry)
$50,714 17%
59%
80%
HOW SCHOOLS ARE CONNECTED TO THE INTERNET
TECHNOLOGY IN THE CLASSROOM
DOWNLOAD SPEED TARGETS PER STUDENT/STAFF
K-12 SCHOOL
District Average Statewide Average National Benchmark
Kbps PER STUDENT/STAFF
500 10000
WIRELINE
FIBER
SATELLITE
1
0
0
Hoonah City School District
SCHOOL BROADBAND AUDIT
ALASKA
AVERAGE AGE OF DEVICES (YEARS)NUMBER OF DEVICES PER STUDENT
StatewideDistrict
1 0.6
4 4.6
® 2015 CONNECT ALASKA
0WIRELESS
Analyses based on validated data from 94% of Alaska K-12 schools that participated in the audit.
For more information, visit akbroadbandaudit.org.

Students and Staff Have Access to
273 Kbps of Internet Connectivity
at a Total Cost of
$102.74 Per User, Per Month.
DISTRICT FACTS
Population 364Student Body
Schools
Region
Median Household
Poverty Rate
Free/Reduced Lunch Eligibility
E-Rate Discount
80 2
Southeast (Ferry)
$37,361 10.8%
100%
90%
HOW SCHOOLS ARE CONNECTED TO THE INTERNET
TECHNOLOGY IN THE CLASSROOM
DOWNLOAD SPEED TARGETS PER STUDENT/STAFF
K-12 SCHOOL
District Average Statewide Average National Benchmark
Kbps PER STUDENT/STAFF
500 10000
WIRELINE
FIBER
SATELLITE
0
0
0
Hydaburg City School District
SCHOOL BROADBAND AUDIT
ALASKA
AVERAGE AGE OF DEVICES (YEARS)NUMBER OF DEVICES PER STUDENT
StatewideDistrict
1 0.6
6 4.6
® 2015 CONNECT ALASKA
1WIRELESS
Analyses based on validated data from 94% of Alaska K-12 schools that participated in the audit.
For more information, visit akbroadbandaudit.org.

Students and Staff Have Access to
126 Kbps of Internet Connectivity
at a Total Cost of
$578.26 Per User, Per Month.
DISTRICT FACTS
Population 1,100Student Body
Schools
Region
Median Household
Poverty Rate
Free/Reduced Lunch Eligibility
E-Rate Discount
3338
Central(Air)
$40,417 21.6%
51%
80%
HOW SCHOOLS ARE CONNECTED TO THE INTERNET
TECHNOLOGY IN THE CLASSROOM
DOWNLOAD SPEED TARGETS PER STUDENT/STAFF
K-12 SCHOOL
District Average Statewide Average National Benchmark
Kbps PER STUDENT/STAFF500 10000
WIRELINE
FIBER
SATELLITE
0
0
7
Iditarod Area School District
SCHOOL BROADBAND AUDIT
ALASKA
AVERAGE AGE OF DEVICES (YEARS)NUMBER OF DEVICES PER STUDENT
StatewideDistrict
1 0.6
6 4.6
® 2015 CONNECT ALASKA
0WIRELESS
For more information, visit akbroadbandaudit.org.
Analyses based on validated data from 94% of Alaska K-12 schools that participated in the audit.

Students and Staff Have Access to
306 Kbps of Internet Connectivity
at a Total Cost of
$4.28 Per User, Per Month.
DISTRICT FACTS
Population 31,897 Student Body
Schools
Region
Median Household
Poverty Rate
Free/Reduced Lunch Eligibility
E-Rate Discount
4,81314
Southeast (Ferry)
$81,490 6%
29%
60%
HOW SCHOOLS ARE CONNECTED TO THE INTERNET
TECHNOLOGY IN THE CLASSROOM
DOWNLOAD SPEED TARGETS PER STUDENT/STAFF
ELEMENTARY
MIDDLE | HIGH SCHOOL
District Average Statewide Average National Benchmark
Kbps PER STUDENT/STAFF
500 10000
WIRELINE
FIBER
SATELLITE
7
6
0
Juneau Borough School District
SCHOOL BROADBAND AUDIT
ALASKA
AVERAGE AGE OF DEVICES (YEARS)NUMBER OF DEVICES PER STUDENT
StatewideDistrict
1 0.6
5.7 4.6
® 2015 CONNECT ALASKA
0WIRELESS
For more information, visit akbroadbandaudit.org.
Analyses based on validated data from 94% of Alaska K-12 schools that participated in the audit.

Students and Staff Have Access to
127 Kbps of Internet Connectivity
at a Total Cost of
$96.19 Per User, Per Month.
DISTRICT FACTS
Population 487Student Body
Schools
Region
Median Household
Poverty Rate
Free/Reduced Lunch Eligibility
E-Rate Discount
111 1
Southeast (Ferry)
$38,750 28%
70%
80%
HOW SCHOOLS ARE CONNECTED TO THE INTERNET
TECHNOLOGY IN THE CLASSROOM
DOWNLOAD SPEED TARGETS PER STUDENT/STAFF
K-12 SCHOOL
District Average Statewide Average National Benchmark
Kbps PER STUDENT/STAFF
500 1000 0
WIRELINE
FIBER
SATELLITE
0
0
0
Kake City School District
SCHOOL BROADBAND AUDIT
ALASKA
AVERAGE AGE OF DEVICES (YEARS)NUMBER OF DEVICES PER STUDENT
StatewideDistrict
1 0.6
5 4.6
® 2015 CONNECT ALASKA
1WIRELESS
Analyses based on validated data from 94% of Alaska K-12 schools that participated in the audit.
For more information, visit akbroadbandaudit.org.

Students and Staff Have Access to
24 Kbps of Internet Connectivity
at a Total Cost of
$73.17 Per User, Per Month.
DISTRICT FACTS
Population 1,062Student Body
Schools
Region
Median Household
Poverty Rate
Free/Reduced Lunch Eligibility
E-Rate Discount
3251
Western (Air)
$40,096 36%
82%
90%
HOW SCHOOLS ARE CONNECTED TO THE INTERNET
TECHNOLOGY IN THE CLASSROOM
DOWNLOAD SPEED TARGETS PER STUDENT/STAFF
K-12 SCHOOL
District Average Statewide Average National Benchmark
Kbps PER STUDENT/STAFF
500 1000 0
WIRELINE
FIBER
SATELLITE
0
0
0
Kashunamiut School District
SCHOOL BROADBAND AUDIT
ALASKA
AVERAGE AGE OF DEVICES (YEARS)NUMBER OF DEVICES PER STUDENT
StatewideDistrict
1 0.6
5 4.6
® 2015 CONNECT ALASKA
1WIRELESS
For more information, visit akbroadbandaudit.org.
Analyses based on validated data from 94% of Alaska K-12 schools that participated in the audit.

Students and Staff Have Access to
468 Kbps of Internet Connectivity
at a Total Cost of
$6.32 Per User, Per Month.
DISTRICT FACTS
Population 56,163 Student Body
Schools
Region
Median Household
Poverty Rate
Free/Reduced Lunch Eligibility
E-Rate Discount
9,150 43
Central(Road System)
$61,793 9%
36%
70%
HOW SCHOOLS ARE CONNECTED TO THE INTERNET
TECHNOLOGY IN THE CLASSROOM
DOWNLOAD SPEED TARGETS PER STUDENT/STAFF
ELEMENTARY
MIDDLE | HIGH SCHOOL
District Average Statewide Average National Benchmark
Kbps PER STUDENT/STAFF
500 10000
WIRELINE
FIBER
SATELLITE
11
24
0
Kenai Peninsula Borough School District
SCHOOL BROADBAND AUDIT
ALASKA
AVERAGE AGE OF DEVICES (YEARS)NUMBER OF DEVICES PER STUDENT
StatewideDistrict
0.5 0.6 6 4.6
® 2015 CONNECT ALASKA
7WIRELESS
K-12 SCHOOL
For more information, visit akbroadbandaudit.org.
Analyses based on validated data from 94% of Alaska K-12 schools that participated in the audit.

Students and StaffHave Access to
733 Kbps of Internet Connectivity
at a Total Cost of
$21.26 Per User, Per Month.
DISTRICT FACTS
Population 13,595 Student Body
Schools
Region
Median Household
Poverty Rate
Free/Reduced Lunch Eligibility
E-Rate Discount
2,47410
Southeast (Ferry)
$62,519 10.2%
41%
70%
HOW SCHOOLS ARE CONNECTED TO THE INTERNET
TECHNOLOGY IN THE CLASSROOM
DOWNLOAD SPEED TARGETS PER STUDENT/STAFF
ELEMENTARY
MIDDLE | HIGH SCHOOL
District Average Statewide Average National Benchmark
Kbps PER STUDENT/STAFF
500 10000
WIRELINE
FIBER
SATELLITE
0
9
0
Ketchikan Gateway Borough School District
SCHOOL BROADBAND AUDIT
ALASKA
AVERAGE AGE OF DEVICES (YEARS)NUMBER OF DEVICES PER STUDENT
StatewideDistrict
1 0.6
6 4.6
® 2015 CONNECT ALASKA
0WIRELESS
K-12SCHOOL
For more information, visit akbroadbandaudit.org.
Analyses based on validated data from 94% of Alaska K-12 schools that participated in the audit.

Students and Staff Have Access to
93 Kbps of Internet Connectivity
at a Total Cost of
$9.75 Per User, Per Month.
DISTRICT FACTS
Population 611 Student Body
Schools
Region
Median Household
Poverty Rate
Free/Reduced Lunch Eligibility
E-Rate Discount
1231
Southeast (Ferry)
$37,083 20%
77%
90%
HOW SCHOOLS ARE CONNECTED TO THE INTERNET
TECHNOLOGY IN THE CLASSROOM
DOWNLOAD SPEED TARGETS PER STUDENT/STAFF
K-12 SCHOOL
District Average Statewide Average National Benchmark
Kbps PER STUDENT/STAFF500 1000 0
WIRELINE
FIBER
SATELLITE
0
1
0
Klawock City School District
SCHOOL BROADBAND AUDIT
ALASKA
AVERAGE AGE OF DEVICES (YEARS)NUMBER OF DEVICES PER STUDENT
StatewideDistrict
2
0.6
6 4.6
® 2015 CONNECT ALASKA
0WIRELESS
For more information, visit akbroadbandaudit.org.
Analyses based on validated data from 94% of Alaska K-12 schools that participated in the audit.

Students and Staff Have Access to
907 Kbps of Internet Connectivity
at a Total Cost of
$79.74 Per User, Per Month.
DISTRICT FACTS
Population 13,850 Student Body
Schools
Region
Median Household
Poverty Rate
Free/Reduced Lunch Eligibility
E-Rate Discount
2,47714
Central(Ferry)
$68,718 12%
51%
80%
HOW SCHOOLS ARE CONNECTED TO THE INTERNET
TECHNOLOGY IN THE CLASSROOM
DOWNLOAD SPEED TARGETS PER STUDENT/STAFF
ELEMENTARY
MIDDLE | HIGH SCHOOL
District Average Statewide Average National Benchmark
Kbps PER STUDENT/STAFF 500 10000
WIRELINE
FIBER
SATELLITE
0
6
7
Kodiak Island Borough School District
SCHOOL BROADBAND AUDIT
ALASKA
AVERAGE AGE OF DEVICES (YEARS)NUMBER OF DEVICES PER STUDENT
StatewideDistrict
1 0.6
4.8 4.6
® 2015 CONNECT ALASKA
For more information, visit akbroadbandaudit.org.
0WIRELESS
K-12 SCHOOL
Analyses based on validated data from 94% of Alaska K-12 schools that participated in the audit.

Students and Staff Have Access to
114 Kbps of Internet Connectivity
at a Total Cost of
$234.92 Per User, Per Month.
DISTRICT FACTS
Population 1,495Student Body
Schools
Region
Median Household
Poverty Rate
Free/Reduced Lunch Eligibility
E-Rate Discount
3879
Western (Air)
$42,500 26%
92%
90%
HOW SCHOOLS ARE CONNECTED TO THE INTERNET
TECHNOLOGY IN THE CLASSROOM
DOWNLOAD SPEED TARGETS PER STUDENT/STAFF
District Average Statewide Average National Benchmark
Kbps PER STUDENT/STAFF500 10000
WIRELINE
FIBER
SATELLITE
0
0
9
Kuspuk School District
SCHOOL BROADBAND AUDIT
ALASKA
AVERAGE AGE OF DEVICES (YEARS)NUMBER OF DEVICES PER STUDENT
StatewideDistrict
1 0.6
3.5 4.6
® 2015 CONNECT ALASKA
For more information, visit akbroadbandaudit.org.
0WIRELESS
ELEMENTARY
MIDDLE | HIGH SCHOOL
K-12 SCHOOL
Analyses based on validated data from 94% of Alaska K-12 schools that participated in the audit.

Students and Staff Have Access to
90 Kbps of Internet Connectivity
at a Total Cost of
$125.86 Per User, Per Month.
DISTRICT FACTS
Population 1,454Student Body
Schools
Region
Median Household
Poverty Rate
Free/Reduced Lunch Eligibility
E-Rate Discount
33614
Southwestern(Air)
$51,786 21.1
71%
80%
HOW SCHOOLS ARE CONNECTED TO THE INTERNET
TECHNOLOGY IN THE CLASSROOM
DOWNLOAD SPEED TARGETS PER STUDENT/STAFF
K-12 SCHOOL
District Average Statewide Average National Benchmark
Kbps PER STUDENT/STAFF
500 1000 0
WIRELINE
FIBER
SATELLITE
0
0
13
Lake and Peninsula Borough School District
SCHOOL BROADBAND AUDIT
ALASKA
AVERAGE AGE OF DEVICES (YEARS)NUMBER OF DEVICES PER STUDENT
StatewideDistrict
1.4 0.6
5 4.6
® 2015 CONNECT ALASKA
For more information, visit akbroadbandaudit.org.
0WIRELESS
Analyses based on validated data from 94% of Alaska K-12 schools that participated in the audit.

Students and Staff Have Access to
186 Kbps of Internet Connectivity
at a Total Cost of
$109.84 Per User, Per Month.
DISTRICT FACTS
Population 14,424 Student Body
Schools
Region
Median Household
Poverty Rate
Free/Reduced Lunch Eligibility
E-Rate Discount
4,28528
Western (Air)
$53,542 21.1%
68%
80%
HOW SCHOOLS ARE CONNECTED TO THE INTERNET
TECHNOLOGY IN THE CLASSROOM
DOWNLOAD SPEED TARGETS PER STUDENT/STAFF
District Average Statewide Average National Benchmark
WIRELINE
FIBER
SATELLITE
0
6
0
Lower Kuskokwim School District
SCHOOL BROADBAND AUDIT
ALASKA
AVERAGE AGE OF DEVICES (YEARS)NUMBER OF DEVICES PER STUDENT
StatewideDistrict
1 0.6 2.6
4.6
® 2015 CONNECT ALASKA
For more information, visit akbroadbandaudit.org.
22 WIRELESS
ELEMENTARY
MIDDLE | HIGH SCHOOL
Kbps PER STUDENT/STAFF 500 1000 0
K-12 SCHOOL
Analyses based on validated data from 94% of Alaska K-12 schools that participated in the audit.

Students and Staff Have Access to
21 Kbps of Internet Connectivity
at a Total Cost of
$155.33 Per User, Per Month.
DISTRICT FACTS
Population 6,095Student Body
Schools
Region
Median Household
Poverty Rate
Free/Reduced Lunch Eligibility
E-Rate Discount
2,05410
Western (Air)
$39,511 32%
100%
90%
HOW SCHOOLS ARE CONNECTED TO THE INTERNET
TECHNOLOGY IN THE CLASSROOM
DOWNLOAD SPEED TARGETS PER STUDENT/STAFF
K-12SCHOOL
District Average Statewide Average National Benchmark
Kbps PER STUDENT/STAFF
500 10000
WIRELINE
FIBER
SATELLITE
0
0
10
Lower Yukon School District
SCHOOL BROADBAND AUDIT
ALASKA
AVERAGE AGE OF DEVICES (YEARS)NUMBER OF DEVICES PER STUDENT
StatewideDistrict
0.8 0.6
4 4.6
® 2015 CONNECT ALASKA
For more information, visit akbroadbandaudit.org.
0WIRELESS
Analyses based on validated data from 94% of Alaska K-12 schools that participated in the audit.

Students and Staff Have Access to
497 Kbps of Internet Connectivity
at a Total Cost of
$14.74 Per User, Per Month.
DISTRICT FACTS
Population 91,519 Student Body
Schools
Region
Median Household
Poverty Rate
Free/Reduced Lunch Eligibility
E-Rate Discount
18,037 45
Central(Road System)
$71,037 9.9%
36%
60%
HOW SCHOOLS ARE CONNECTED TO THE INTERNET
TECHNOLOGY IN THE CLASSROOM
DOWNLOAD SPEED TARGETS PER STUDENT/STAFF
District Average Statewide Average National Benchmark
Kbps PER STUDENT/STAFF
WIRELINE
FIBER
SATELLITE
1
41
0
Matanuska-Susitna Borough School District
SCHOOL BROADBAND AUDIT
ALASKA
AVERAGE AGE OF DEVICES (YEARS)NUMBER OF DEVICES PER STUDENT
StatewideDistrict
0.3 0.6 3.9 4.6
® 2015 CONNECT ALASKA
For more information, visit akbroadbandaudit.org.
1WIRELESS
ELEMENTARY
MIDDLE | HIGH SCHOOL
500 1000 0
K-12 SCHOOL
Analyses based on validated data from 94% of Alaska K-12 schools that participated in the audit.

Students and Staff Have Access to
88 Kbps of Internet Connectivity
at a Total Cost of
$28.89 Per User, Per Month.
DISTRICT FACTS
Population 446Student Body
Schools
Region
Median Household
Poverty Rate
Free/Reduced Lunch Eligibility
E-Rate Discount
1,040 2
Central(Road System)
$56,250 16%
37%
70%
HOW SCHOOLS ARE CONNECTED TO THE INTERNET
TECHNOLOGY IN THE CLASSROOM
DOWNLOAD SPEED TARGETS PER STUDENT/STAFF
MIDDLE | HIGH SCHOOL
District Average Statewide Average National Benchmark
Kbps PER STUDENT/STAFF
500 10000
WIRELINE
FIBER
SATELLITE
1
0
0
Nenana City School District
SCHOOL BROADBAND AUDIT
ALASKA
AVERAGE AGE OF DEVICES (YEARS)NUMBER OF DEVICES PER STUDENT
StatewideDistrict
1 0.6
5 4.6
® 2015 CONNECT ALASKA
For more information, visit akbroadbandaudit.org.
0WIRELESS
Analyses based on validated data from 94% of Alaska K-12 schools that participated in the audit.

Students and Staff Have Access to
58 Kbps of Internet Connectivity
at a Total Cost of
$35.34 Per User, Per Month.
DISTRICT FACTS
Population 3,673Student Body
Schools
Region
Median Household
Poverty Rate
Free/Reduced Lunch Eligibility
E-Rate Discount
7005
Western (Air)
$71,643 10%
100%
90%
HOW SCHOOLS ARE CONNECTED TO THE INTERNET
TECHNOLOGY IN THE CLASSROOM
DOWNLOAD SPEED TARGETS PER STUDENT/STAFF
ELEMENTARY
MIDDLE | HIGH SCHOOL
District Average Statewide Average National Benchmark
Kbps PER STUDENT/STAFF
500 10000
WIRELINE
FIBER
SATELLITE
0
0
0
Nome Public Schools
SCHOOL BROADBAND AUDIT
ALASKA
AVERAGE AGE OF DEVICES (YEARS)NUMBER OF DEVICES PER STUDENT
StatewideDistrict
0.8 0.6
4 4.6
® 2015 CONNECT ALASKA
For more information, visit akbroadbandaudit.org.
4WIRELESS
Analyses based on validated data from 94% of Alaska K-12 schools that participated in the audit.

Students and Staff Have Access to
69 Kbps of Internet Connectivity
at a Total Cost of
$73.26 Per User, Per Month.
DISTRICT FACTS
Population 9,484Student Body
Schools
Region
Median Household
Poverty Rate
Free/Reduced Lunch Eligibility
E-Rate Discount
2,01711
Northern(Air)
$80,761
10.3% 51% 80%
HOW SCHOOLS ARE CONNECTED TO THE INTERNET
TECHNOLOGY IN THE CLASSROOM
DOWNLOAD SPEED TARGETS PER STUDENT/STAFF
District Average Statewide Average National Benchmark
WIRELINE
FIBER
SATELLITE
0
0
11
North Slope Borough School District
SCHOOL BROADBAND AUDIT
ALASKA
AVERAGE AGE OF DEVICES (YEARS)NUMBER OF DEVICES PER STUDENT
StatewideDistrict
1 0.6
3 4.6
® 2015 CONNECT ALASKA
For more information, visit akbroadbandaudit.org.
0WIRELESS
ELEMENTARY
MIDDLE | HIGH SCHOOL
Kbps PER STUDENT/STAFF
500 1000 0
K-12 SCHOOL
Analyses based on validated data from 94% of Alaska K-12 schools that participated in the audit.

Students and Staff Have Access to
26 Kbps of Internet Connectivity
at a Total Cost of
$72.59 Per User, Per Month.
DISTRICT FACTS
Population 7,624Student Body
Schools
Region
Median Household
Poverty Rate
Free/Reduced Lunch Eligibility
E-Rate Discount
2,126 13
Northern(Air)
$61,607 22%
100%
90%
HOW SCHOOLS ARE CONNECTED TO THE INTERNET
TECHNOLOGY IN THE CLASSROOM
DOWNLOAD SPEED TARGETS PER STUDENT/STAFF
K-12 SCHOOL
District Average Statewide Average National Benchmark
Kbps PER STUDENT/STAFF
500 1000 0
WIRELINE
FIBER
SATELLITE
0
0
10
Northwest Arctic Borough School District
SCHOOL BROADBAND AUDIT
ALASKA
AVERAGE AGE OF DEVICES (YEARS)NUMBER OF DEVICES PER STUDENT
StatewideDistrict
1 0.6
4.5 4.6
® 2015 CONNECT ALASKA
For more information, visit akbroadbandaudit.org.
3WIRELESS
Analyses based on validated data from 94% of Alaska K-12 schools that participated in the audit.

Students and Staff Have Access to
83 Kbps of Internet Connectivity
at a Total Cost of
$1,162.78 Per User, Per Month.
DISTRICT FACTS
Population 60 Student Body
Schools
Region
Median Household
Poverty Rate
Free/Reduced Lunch Eligibility
E-Rate Discount
13 1
Southeast (Ferry)
$89,167 5%
85%
90%
HOW SCHOOLS ARE CONNECTED TO THE INTERNET
TECHNOLOGY IN THE CLASSROOM
DOWNLOAD SPEED TARGETS PER STUDENT/STAFF
K-12 SCHOOL
District Average Statewide Average National Benchmark
Kbps PER STUDENT/STAFF
500 1000 0
WIRELINE
FIBER
SATELLITE
1
0
0
Pelican City School District
SCHOOL BROADBAND AUDIT
ALASKA
AVERAGE AGE OF DEVICES (YEARS)NUMBER OF DEVICES PER STUDENT
StatewideDistrict
1 0.6 2.5
4.6
® 2015 CONNECT ALASKA
For more information, visit akbroadbandaudit.org.
0WIRELESS
Analyses based on validated data from 94% of Alaska K-12 schools that participated in the audit.

Students and Staff Have Access to
141 Kbps of Internet Connectivity
at a Total Cost of
$132.79 Per User, Per Month.
DISTRICT FACTS
Population 2,987Student Body
Schools
Region
Median Household
Poverty Rate
Free/Reduced Lunch Eligibility
E-Rate Discount
4403
Southeast (Ferry)
$66,125 12%
52%
80%
HOW SCHOOLS ARE CONNECTED TO THE INTERNET
TECHNOLOGY IN THE CLASSROOM
DOWNLOAD SPEED TARGETS PER STUDENT/STAFF
ELEMENTARY
MIDDLE | HIGH SCHOOL
District Average Statewide Average National Benchmark
Kbps PER STUDENT/STAFF
500 10000
WIRELINE
FIBER
SATELLITE
0
3
0
Petersburg City School District
SCHOOL BROADBAND AUDIT
ALASKA
AVERAGE AGE OF DEVICES (YEARS)NUMBER OF DEVICES PER STUDENT
StatewideDistrict
0.6 0.6 5 4.6
® 2015 CONNECT ALASKA
For more information, visit akbroadbandaudit.org.
0WIRELESS
Analyses based on validated data from 94% of Alaska K-12 schools that participated in the audit.

Students and Staff Have Access to
19 Kbps of Internet Connectivity
at a Total Cost of
$119.57 Per User, Per Month.
DISTRICT FACTS
Population 737Student Body
Schools
Region
Median Household
Poverty Rate
Free/Reduced Lunch Eligibility
E-Rate Discount
92 2
Southwestern(Air)
$41,750 11.8%
71%
80%
HOW SCHOOLS ARE CONNECTED TO THE INTERNET
TECHNOLOGY IN THE CLASSROOM
DOWNLOAD SPEED TARGETS PER STUDENT/STAFF
K-12 SCHOOL
District Average Statewide Average National Benchmark
Kbps PER STUDENT/STAFF
500 1000 0
WIRELINE
FIBER
SATELLITE
0
0
2
Pribilof Island School District
SCHOOL BROADBAND AUDIT
ALASKA
AVERAGE AGE OF DEVICES (YEARS)NUMBER OF DEVICES PER STUDENT
StatewideDistrict
1.1 0.6 1.9
4.6
® 2015 CONNECT ALASKA
For more information, visit akbroadbandaudit.org.
0WIRELESS
Analyses based on validated data from 94% of Alaska K-12 schools that participated in the audit.

Students and Staff Have Access to
26 Kbps of Internet Connectivity
at a Total Cost of
$117.16 Per User, Per Month.
DISTRICT FACTS
Population 521Student Body
Schools
Region
Median Household
Poverty Rate
Free/Reduced Lunch Eligibility
E-Rate Discount
2131
Western (Air)
$41,467 18%
100%
90%
HOW SCHOOLS ARE CONNECTED TO THE INTERNET
TECHNOLOGY IN THE CLASSROOM
DOWNLOAD SPEED TARGETS PER STUDENT/STAFF
K-12 SCHOOL
District Average Statewide Average National Benchmark
Kbps PER STUDENT/STAFF500 10000
WIRELINE
FIBER
SATELLITE
1
0
0
Saint Mary's School District
SCHOOL BROADBAND AUDIT
ALASKA
AVERAGE AGE OF DEVICES (YEARS)NUMBER OF DEVICES PER STUDENT
StatewideDistrict 2
0.6 2
4.6
® 2015 CONNECT ALASKA
For more information, visit akbroadbandaudit.org.
0WIRELESS
Analyses based on validated data from 94% of Alaska K-12 schools that participated in the audit.

Students and Staff Have Access to
498 Kbps of Internet Connectivity
at a Total Cost of
$26.17 Per User, Per Month.
DISTRICT FACTS
Population 8,945 Student Body
Schools
Region
Median Household
Poverty Rate
Free/Reduced Lunch Eligibility
E-Rate Discount
1,402 6
Southeast (Ferry)
$69,405 10%
36%
70%
HOW SCHOOLS ARE CONNECTED TO THE INTERNET
TECHNOLOGY IN THE CLASSROOM
DOWNLOAD SPEED TARGETS PER STUDENT/STAFF
ELEMENTARY
MIDDLE | HIGH SCHOOL
District Average Statewide Average National Benchmark
Kbps PER STUDENT/STAFF
500 10000
WIRELINE
FIBER
SATELLITE
0
5
0
Sitka School District
SCHOOL BROADBAND AUDIT
ALASKA
AVERAGE AGE OF DEVICES (YEARS)NUMBER OF DEVICES PER STUDENT
StatewideDistrict
0.2
0.6 4 4.6
® 2015 CONNECT ALASKA
For more information, visit akbroadbandaudit.org.
0WIRELESS
Analyses based on validated data from 94% of Alaska K-12 schools that participated in the audit.

Students and Staff Have Access to
85 Kbps of Internet Connectivity
at a Total Cost of
$23.15 Per User, Per Month.
DISTRICT FACTS
Population 1,080 Student Body
Schools
Region
Median Household
Poverty Rate
Free/Reduced Lunch Eligibility
E-Rate Discount
1001
Southeast (Ferry)
$71,667 5.5%
15%
50%
HOW SCHOOLS ARE CONNECTED TO THE INTERNET
TECHNOLOGY IN THE CLASSROOM
DOWNLOAD SPEED TARGETS PER STUDENT/STAFF
K-12 SCHOOL
District Average Statewide Average National Benchmark
Kbps PER STUDENT/STAFF500 1000 0
WIRELINE
FIBER
SATELLITE
0
0
0
Skagway School District
SCHOOL BROADBAND AUDIT
ALASKA
AVERAGE AGE OF DEVICES (YEARS)NUMBER OF DEVICES PER STUDENT
StatewideDistrict
1 0.6
0 4.6
® 2015 CONNECT ALASKA
For more information, visit akbroadbandaudit.org.
1WIRELESS
Analyses based on validated data from 94% of Alaska K-12 schools that participated in the audit.

Students and Staff Have Access to
320 Kbps of Internet Connectivity
at a Total Cost of
$195.47 Per User, Per Month.
DISTRICT FACTS
Population 2,087Student Body
Schools
Region
Median Household
Poverty Rate
Free/Reduced Lunch Eligibility
E-Rate Discount
20110
Southeast (Ferry)
$43,906
12.5%
61%
80%
HOW SCHOOLS ARE CONNECTED TO THE INTERNET
TECHNOLOGY IN THE CLASSROOM
DOWNLOAD SPEED TARGETS PER STUDENT/STAFF
K-12 SCHOOL
District Average Statewide Average National Benchmark
Kbps PER STUDENT/STAFF
500 1000 0
WIRELINE
FIBER
SATELLITE
6
2
1
Southeast Island School District
SCHOOL BROADBAND AUDIT
ALASKA
AVERAGE AGE OF DEVICES (YEARS)NUMBER OF DEVICES PER STUDENT
StatewideDistrict
1 0.6
3.3 4.6
® 2015 CONNECT ALASKA
For more information, visit akbroadbandaudit.org.
0WIRELESS
Analyses based on validated data from 94% of Alaska K-12 schools that participated in the audit.

Students and Staff Have Access to
32 Kbps of Internet Connectivity
at a Total Cost of
$111.29 Per User, Per Month.
DISTRICT FACTS
Population 2,767Student Body
Schools
Region
Median Household
Poverty Rate
Free/Reduced Lunch Eligibility
E-Rate Discount
6027
Southwestern(Air)
$41,705 22%
92%
90%
HOW SCHOOLS ARE CONNECTED TO THE INTERNET
TECHNOLOGY IN THE CLASSROOM
DOWNLOAD SPEED TARGETS PER STUDENT/STAFF
ELEMENTARY
K-12 SCHOOL
District Average Statewide Average National Benchmark
Kbps PER STUDENT/STAFF
500 10000
WIRELINE
FIBER
SATELLITE
7
0
0
Southwest Region School District
SCHOOL BROADBAND AUDIT
ALASKA
AVERAGE AGE OF DEVICES (YEARS)NUMBER OF DEVICES PER STUDENT
StatewideDistrict
1 0.6
5 4.6
® 2015 CONNECT ALASKA
For more information, visit akbroadbandaudit.org.
0WIRELESS
Analyses based on validated data from 94% of Alaska K-12 schools that participated in the audit.

Students and Staff Have Access to
148 Kbps of Internet Connectivity
at a Total Cost of
$375.51 Per User, Per Month.
DISTRICT FACTS
Population 261Student Body
Schools
Region
Median Household
Poverty Rate
Free/Reduced Lunch Eligibility
E-Rate Discount
39 1
Northern(Air)
$45,000 12%
64%
80%
HOW SCHOOLS ARE CONNECTED TO THE INTERNET
TECHNOLOGY IN THE CLASSROOM
DOWNLOAD SPEED TARGETS PER STUDENT/STAFF
K-12SCHOOL
District Average Statewide Average National Benchmark
Kbps PER STUDENT/STAFF 500 10000
WIRELINE
FIBER
SATELLITE
0
0
0
Tanana City School District
SCHOOL BROADBAND AUDIT
ALASKA
AVERAGE AGE OF DEVICES (YEARS)NUMBER OF DEVICES PER STUDENT
StatewideDistrict
1 0.6 2
4.6
® 2015 CONNECT ALASKA
For more information, visit akbroadbandaudit.org.
1WIRELESS
Analyses based on validated data from 94% of Alaska K-12 schools that participated in the audit.
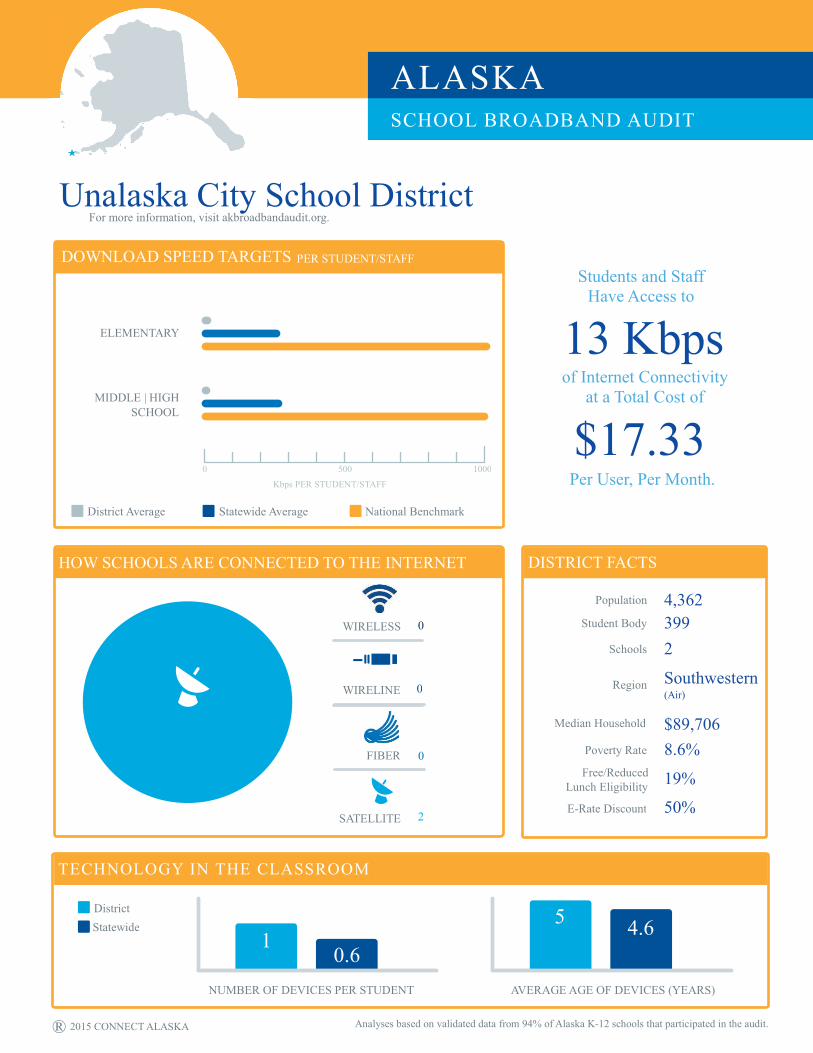
Students and Staff Have Access to
13 Kbps of Internet Connectivity
at a Total Cost of
$17.33 Per User, Per Month.
DISTRICT FACTS
Population 4,362Student Body
Schools
Region
Median Household
Poverty Rate
Free/Reduced Lunch Eligibility
E-Rate Discount
3992
Southwestern(Air)
$89,706 8.6%
19%
50%
HOW SCHOOLS ARE CONNECTED TO THE INTERNET
TECHNOLOGY IN THE CLASSROOM
DOWNLOAD SPEED TARGETS PER STUDENT/STAFF
ELEMENTARY
MIDDLE | HIGH SCHOOL
District Average Statewide Average National Benchmark
Kbps PER STUDENT/STAFF
500 10000
WIRELINE
FIBER
SATELLITE
0
0
2
Unalaska City School District
SCHOOL BROADBAND AUDIT
ALASKA
AVERAGE AGE OF DEVICES (YEARS)NUMBER OF DEVICES PER STUDENT
StatewideDistrict
1 0.6
5 4.6
® 2015 CONNECT ALASKA
For more information, visit akbroadbandaudit.org.
0WIRELESS
Analyses based on validated data from 94% of Alaska K-12 schools that participated in the audit.

Students and Staff Have Access to
98 Kbps of Internet Connectivity
at a Total Cost of
$17.22 Per User, Per Month.
DISTRICT FACTS
Population 3,995Student Body
Schools
Region
Median Household
Poverty Rate
Free/Reduced Lunch Eligibility
E-Rate Discount
6084
Central(Road System)
$93,625 8% 32%
60%
HOW SCHOOLS ARE CONNECTED TO THE INTERNET
TECHNOLOGY IN THE CLASSROOM
DOWNLOAD SPEED TARGETS PER STUDENT/STAFF
MIDDLE | HIGH SCHOOL
District Average Statewide Average National Benchmark
Kbps PER STUDENT/STAFF500 1000 0
WIRELINE
FIBER
SATELLITE
0
3
0
Valdez City Schools
SCHOOL BROADBAND AUDIT
ALASKA
AVERAGE AGE OF DEVICES (YEARS)NUMBER OF DEVICES PER STUDENT
StatewideDistrict
0.7 0.6 1.0
4.6
® 2015 CONNECT ALASKA
For more information, visit akbroadbandaudit.org.
0WIRELESS
Analyses based on validated data from 94% of Alaska K-12 schools that participated in the audit.

Students and Staff Have Access to
241 Kbps of Internet Connectivity
at a Total Cost of
$61.45 Per User, Per Month.
DISTRICT FACTS
Population 2,371Student Body
Schools
Region
Median Household
Poverty Rate
Free/Reduced Lunch Eligibility
E-Rate Discount
2783
Southeast (Ferry)
$45,841 9.5%
54%
80%
HOW SCHOOLS ARE CONNECTED TO THE INTERNET
TECHNOLOGY IN THE CLASSROOM
DOWNLOAD SPEED TARGETS PER STUDENT/STAFF
ELEMENTARY
MIDDLE | HIGH SCHOOL
District Average Statewide Average National Benchmark
Kbps PER STUDENT/STAFF
500 10000
WIRELINE
FIBER
SATELLITE
0
3
0
Wrangell Public School District
SCHOOL BROADBAND AUDIT
ALASKA
AVERAGE AGE OF DEVICES (YEARS)NUMBER OF DEVICES PER STUDENT
StatewideDistrict
1 0.6
5 4.6
® 2015 CONNECT ALASKA
For more information, visit akbroadbandaudit.org.
0WIRELESS
Analyses based on validated data from 94% of Alaska K-12 schools that participated in the audit.

C
Students and Staff Have Access to
109 Kbps of Internet Connectivity
at a Total Cost of
$140.00 Per User, Per Month.
DISTRICT FACTS
Population 607Student Body
Schools
Region
Median Household
Poverty Rate
Free/Reduced Lunch Eligibility
E-Rate Discount
110 2
Southeast (Ferry)
$72,500 6%
80%
90%
HOW SCHOOLS ARE CONNECTED TO THE INTERNET
TECHNOLOGY IN THE CLASSROOM
DOWNLOAD SPEED TARGETS PER STUDENT/STAFF
MIDDLE | HIGH SCHOOL
District Average Statewide Average National Benchmark
Kbps PER STUDENT/STAFF
500 1000 0
WIRELINE
FIBER
SATELLITE
1
0
1
Yakutat School District
SCHOOL BROADBAND AUDIT
ALASKA
AVERAGE AGE OF DEVICES (YEARS)NUMBER OF DEVICES PER STUDENT
StatewideDistrict
0.5 0.6 6 4.6
® 2015 CONNECT ALASKA
For more information, visit akbroadbandaudit.org.
0WIRELESS
Analyses based on validated data from 94% of Alaska K-12 schools that participated in the audit.

Students and Staff Have Access to
109 Kbps of Internet Connectivity
at a Total Cost of
$195.02 Per User, Per Month.
DISTRICT FACTS
Population 1,330 Student Body
Schools
Region
Median Household
Poverty Rate
Free/Reduced Lunch Eligibility
E-Rate Discount
2477
Northern (Air)
$27,014 32.1%
76%
90%
HOW SCHOOLS ARE CONNECTED TO THE INTERNET
TECHNOLOGY IN THE CLASSROOM
DOWNLOAD SPEED TARGETS PER STUDENT/STAFF
K-12 SCHOOL
District Average Statewide Average National Benchmark
Kbps PER STUDENT/STAFF 500 10000
WIRELINE
FIBER
SATELLITE
0
0
7
Yukon Flats School District
SCHOOL BROADBAND AUDIT
ALASKA
AVERAGE AGE OF DEVICES (YEARS)NUMBER OF DEVICES PER STUDENT
StatewideDistrict
0.5 0.6 6 4.6
® 2015 CONNECT ALASKA
For more information, visit akbroadbandaudit.org.
0WIRELESS
Analyses based on validated data from 94% of Alaska K-12 schools that participated in the audit.

Students and Staff Have Access to
59 Kbps of Internet Connectivity
at a Total Cost of
$87.77 Per User, Per Month.
DISTRICT FACTS
Population 1,974Student Body
Schools
Region
Median Household
Poverty Rate
Free/Reduced Lunch Eligibility
E-Rate Discount
1,49510
Northern(Air)
$31,343 27.6%
56%
80%
HOW SCHOOLS ARE CONNECTED TO THE INTERNET
TECHNOLOGY IN THE CLASSROOM
DOWNLOAD SPEED TARGETS PER STUDENT/STAFF
MIDDLE | HIGH SCHOOL
District Average Statewide Average National Benchmark
Kbps PER STUDENT/STAFF
500 10000
WIRELINE
FIBER
SATELLITE
1
1
8
Yukon-Koyukuk School District
SCHOOL BROADBAND AUDIT
ALASKA
AVERAGE AGE OF DEVICES (YEARS)NUMBER OF DEVICES PER STUDENT
StatewideDistrict
0.9 0.6
3 4.6
® 2015 CONNECT ALASKA
For more information, visit akbroadbandaudit.org.
0WIRELESS
K-12 SCHOOL
Analyses based on validated data from 94% of Alaska K-12 schools that participated in the audit.

Students and Staff Have Access to
54 Kbps of Internet Connectivity
at a Total Cost of
$208.42 Per User, Per Month.
DISTRICT FACTS
Population 1,416 Student Body
Schools
Region
Median Household
Poverty Rate
Free/Reduced Lunch Eligibility
E-Rate Discount
4573
Western (Air)
$36,979 36.2%
100%
90%
HOW SCHOOLS ARE CONNECTED TO THE INTERNET
TECHNOLOGY IN THE CLASSROOM
DOWNLOAD SPEED TARGETS PER STUDENT/STAFF
K-12 SCHOOL
District Average Statewide Average National Benchmark
Kbps PER STUDENT/STAFF500 10000
WIRELINE
FIBER
SATELLITE
0
0
0
Yupiit School District
SCHOOL BROADBAND AUDIT
ALASKA
AVERAGE AGE OF DEVICES (YEARS)NUMBER OF DEVICES PER STUDENT
StatewideDistrict
0.5 0.6
2.6
4.6
® 2015 CONNECT ALASKA
For more information, visit akbroadbandaudit.org.
3WIRELESS
Analyses based on validated data from 94% of Alaska K-12 schools that participated in the audit.


