42
ALBA SOLUZIONI Consultancy and information services in energy and finance Peter Crilly Energy Commodities Conference 2018 10 May 2018 The Italian gas and power markets 1
ALBA SOLUZIONI Consultancy and information services in energy and finance
Peter Crilly Energy Commodities Conference 2018 10 May 2018
The Italian gas and power markets
1
ALBA SOLUZIONI
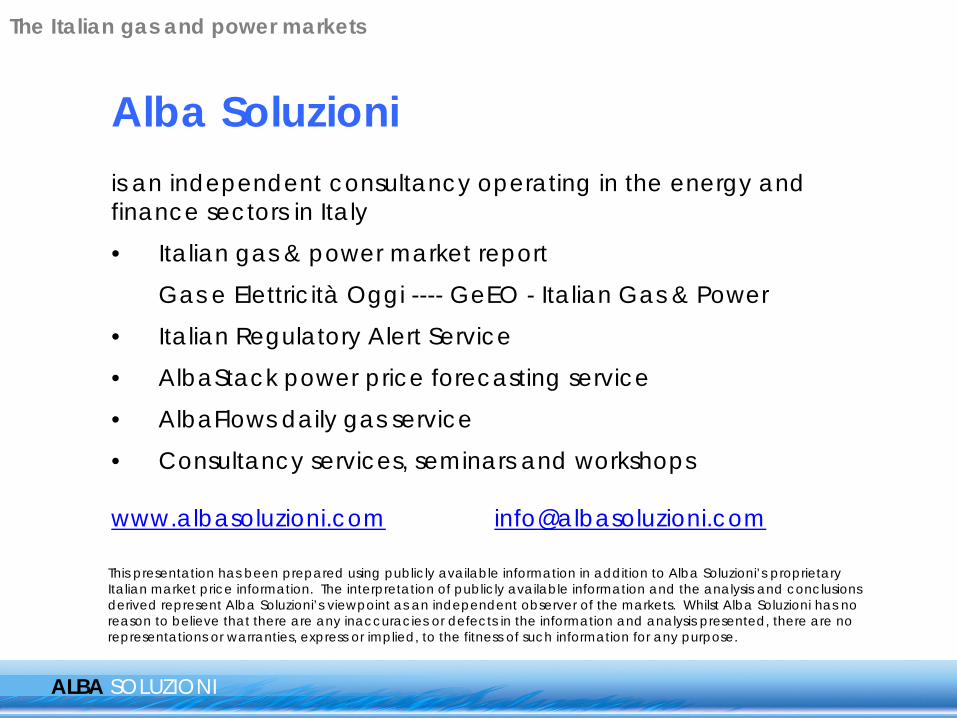
Alba Soluzioni is an independent consultancy operating in the energy and finance sectors in Italy
• Italian gas & power market report
Gas e Elettricità Oggi ---- GeEO - Italian Gas & Power
• Italian Regulatory Alert Service
• AlbaStack power price forecasting service
• AlbaFlows daily gas service
• Consultancy services, seminars and workshops
www.albasoluzioni.com [email protected]
The Italian gas and power markets
This presentation has been prepared using publicly available information in addition to Alba Soluzioni’s proprietary Italian market price information. The interpretation of publicly available information and the analysis and conclusions derived represent Alba Soluzioni’s viewpoint as an independent observer of the markets. Whilst Alba Soluzioni has no reason to believe that there are any inaccuracies or defects in the information and analysis presented, there are no representations or warranties, express or implied, to the fitness of such information for any purpose.
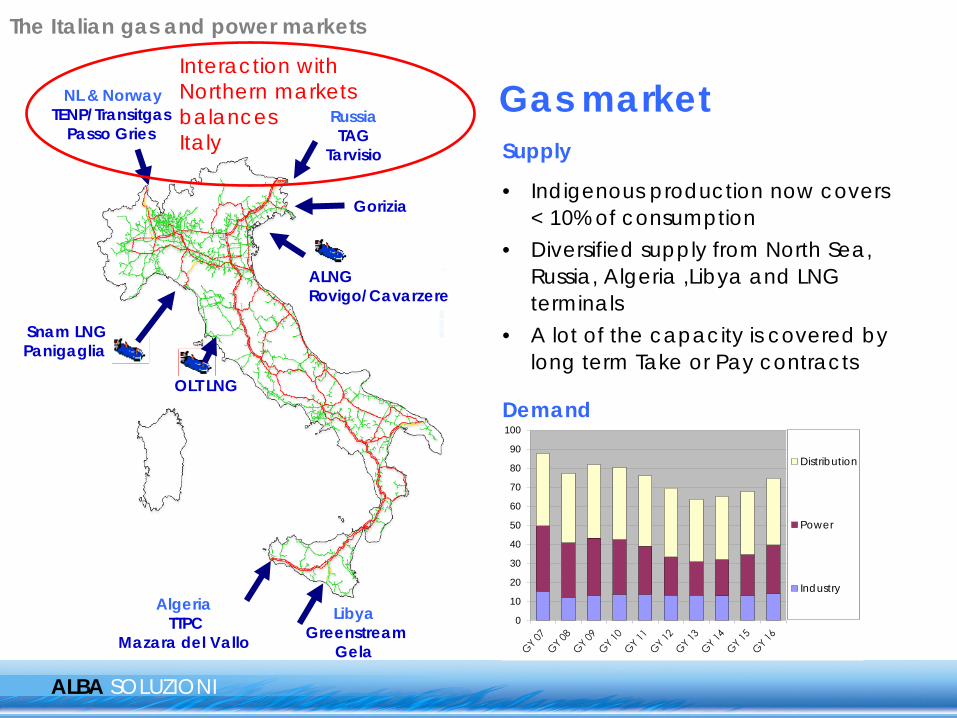
Gas market Russia TAG
Tarvisio
ALNG Rovigo/Cavarzere
Libya Greenstream
Gela
NL & Norway TENP/Transitgas
Passo Gries
Algeria TTPC
Mazara del Vallo
Snam LNG Panigaglia
Supply
• Indigenous production now covers < 10% of consumption
• Diversified supply from North Sea, Russia, Algeria ,Libya and LNG terminals
• A lot of the capacity is covered by long term Take or Pay contracts
Demand
ALBA SOLUZIONI
Gorizia
OLT LNG
0
10
20
30
40
50
60
70
80
90
100
Distribution
Power
Industry
The Italian gas and power markets
Interaction with Northern markets balances Italy
ALBA SOLUZIONI
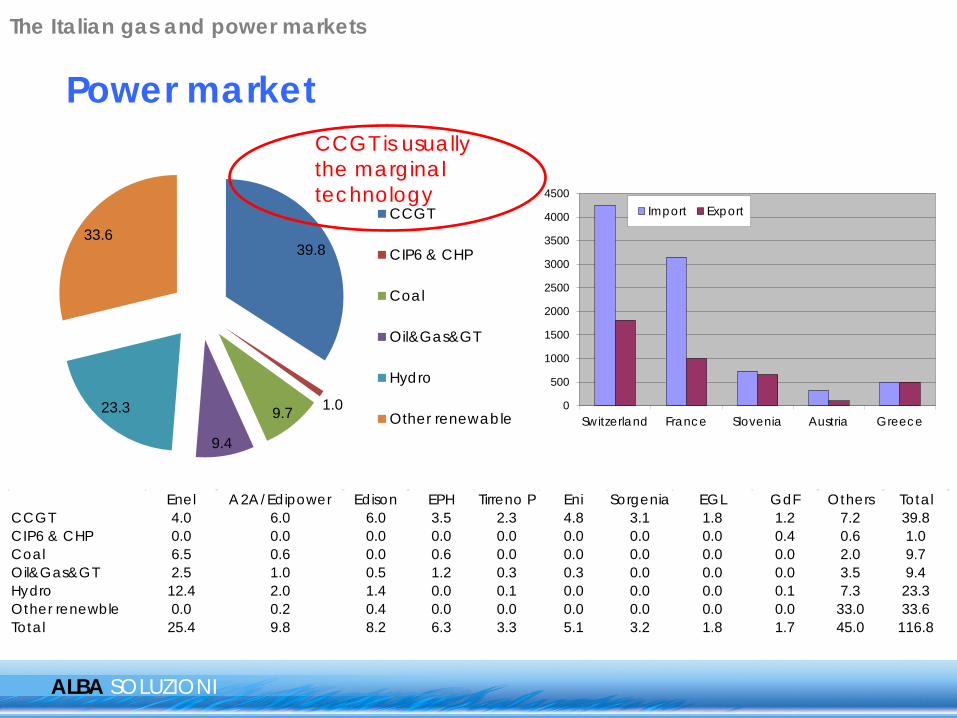
Enel A2A/Edipower Edison EPH Tirreno P Eni Sorgenia EGL GdF Others TotalCCGT 4.0 6.0 6.0 3.5 2.3 4.8 3.1 1.8 1.2 7.2 39.8CIP6 & CHP 0.0 0.0 0.0 0.0 0.0 0.0 0.0 0.0 0.4 0.6 1.0Coal 6.5 0.6 0.0 0.6 0.0 0.0 0.0 0.0 0.0 2.0 9.7Oil&Gas> 2.5 1.0 0.5 1.2 0.3 0.3 0.0 0.0 0.0 3.5 9.4Hydro 12.4 2.0 1.4 0.0 0.1 0.0 0.0 0.0 0.1 7.3 23.3Other renewble 0.0 0.2 0.4 0.0 0.0 0.0 0.0 0.0 0.0 33.0 33.6Total 25.4 9.8 8.2 6.3 3.3 5.1 3.2 1.8 1.7 45.0 116.8
39.8
1.09.7
9.4
23.3
33.6CCGT
CIP6 & CHP
Coal
Oil&Gas>
Hydro
Other renewable
Power market
0
500
1000
1500
2000
2500
3000
3500
4000
4500
Switzerland France Slovenia Austria Greece
Import Export
The Italian gas and power markets
CCGT is usually the marginal technology
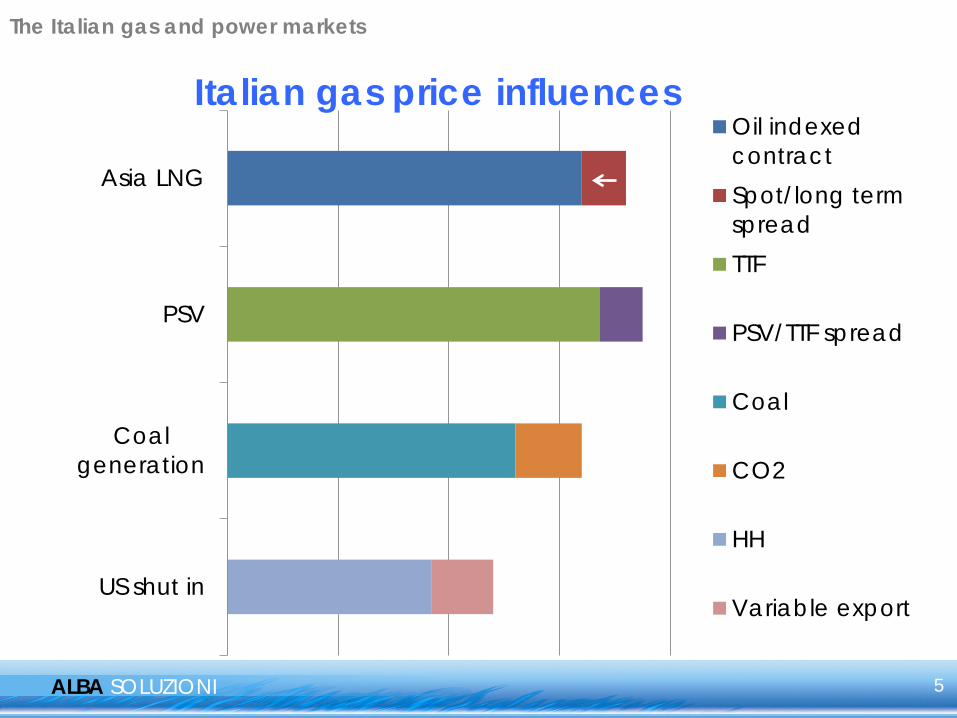
Italian gas price influences
ALBA SOLUZIONI
US shut in
Coalgeneration
PSV
Asia LNG
Oil indexedcontractSpot/long termspreadTTF
PSV/TTF spread
Coal
CO2
HH
Variable export
The Italian gas and power markets
5

Italian power
ALBA SOLUZIONI
As CCGT is usually the marginal technology, it can be helpful to look at the Italian power prices as being the sum of
• CCGT gas cost
• CCGT CO2 cost
• and the clean spark spread
Power prices respond to changes in gas and CO2 prices
Power market fundamentals drive the spark spread
0
5
10
15
20
25
30
35
40
45
50
Italian power
clean sparkspread
CO2
PSV gas
6
Italian gas and power market update
ALBA SOLUZIONI
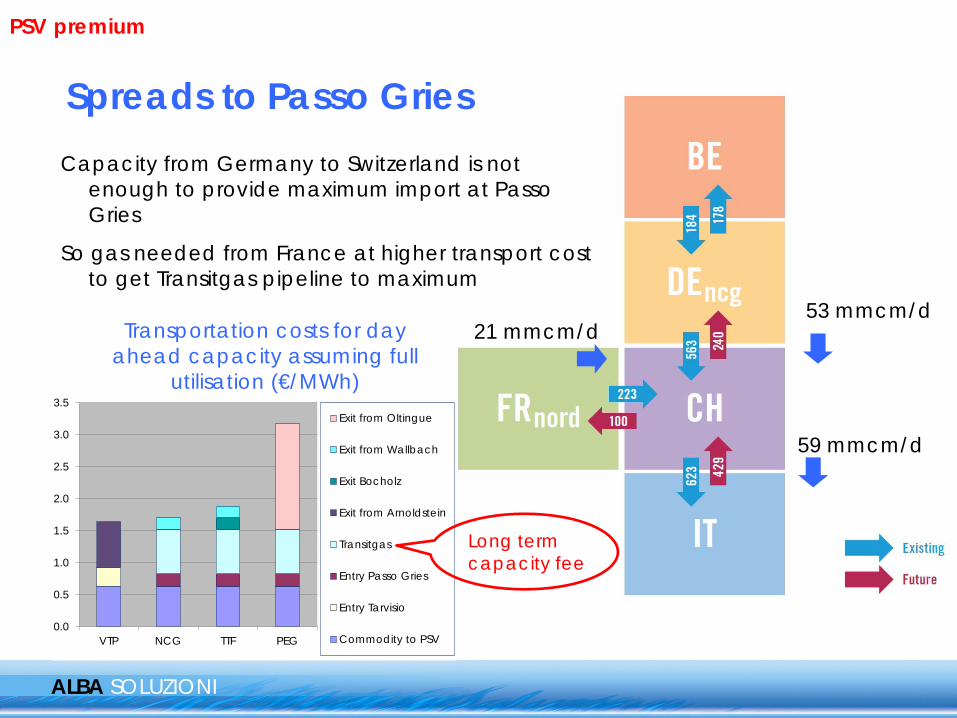
Capacity from Germany to Switzerland is not enough to provide maximum import at Passo Gries
So gas needed from France at higher transport cost to get Transitgas pipeline to maximum
Spreads to Passo Gries
0.0
0.5
1.0
1.5
2.0
2.5
3.0
3.5
VTP NCG TTF PEG
Exit from Oltingue
Exit from Wallbach
Exit Bocholz
Exit from Arnoldstein
Transitgas
Entry Passo Gries
Entry Tarvisio
Commodity to PSV
53 mmcm/d 21 mmcm/d
59 mmcm/d
Transportation costs for day ahead capacity assuming full
utilisation (€/MWh)
PSV premium
Long term capacity fee
121416182022242628303234
PSV
TTF
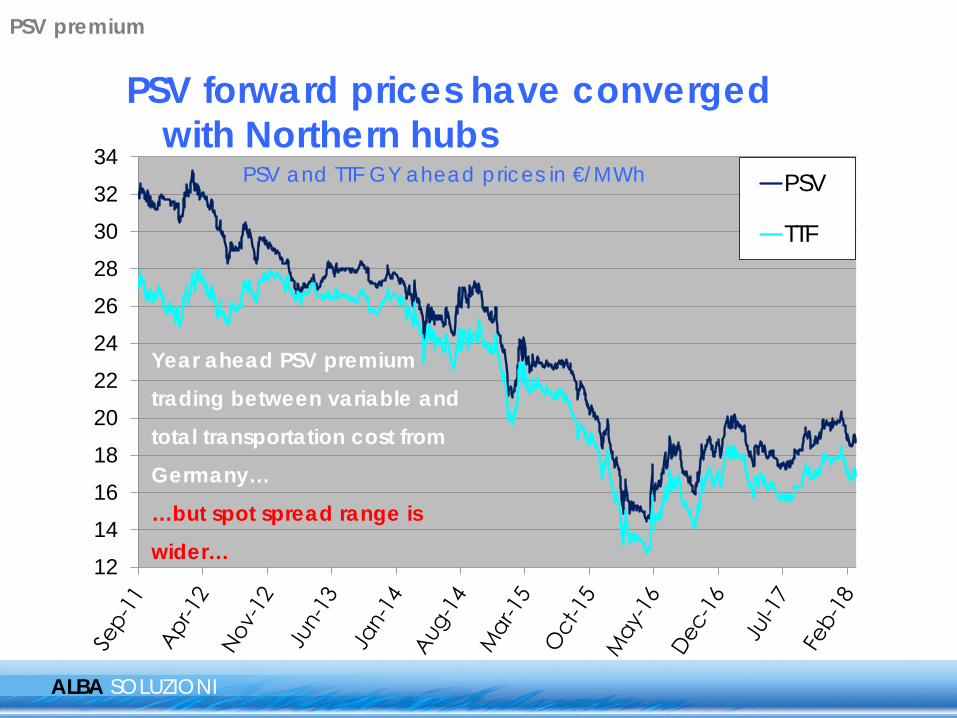
PSV forward prices have converged with Northern hubs
ALBA SOLUZIONI
Year ahead PSV premium
trading between variable and
total transportation cost from
Germany…
…but spot spread range is
wider…
PSV and TTF GY ahead prices in €/MWh
PSV premium
ALBA SOLUZIONI
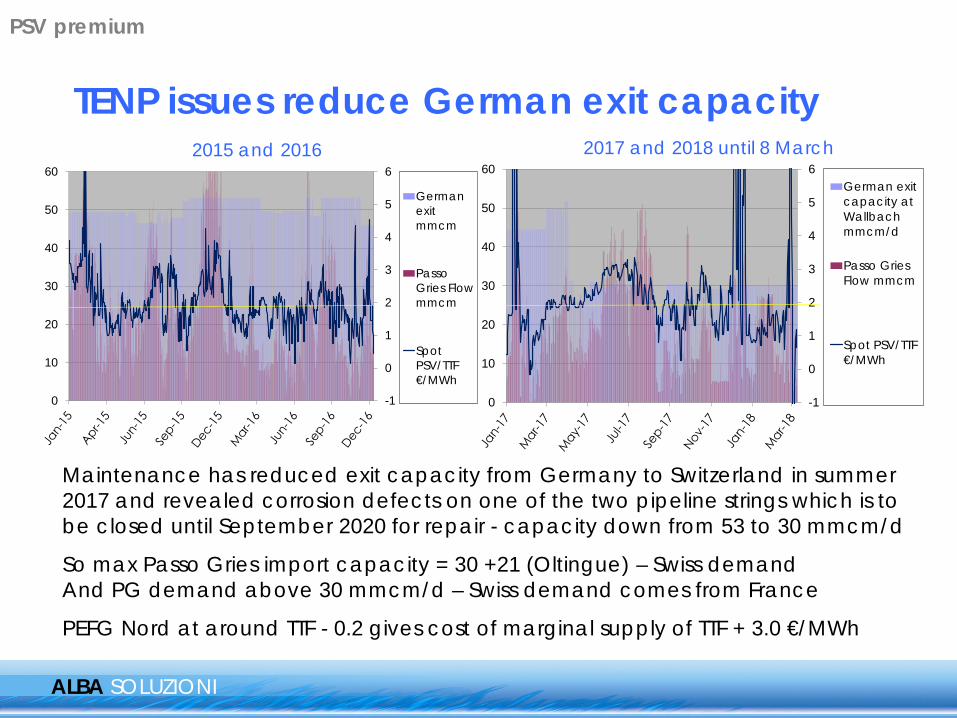
TENP issues reduce German exit capacity 2015 and 2016 2017 and 2018 until 8 March
Maintenance has reduced exit capacity from Germany to Switzerland in summer 2017 and revealed corrosion defects on one of the two pipeline strings which is to be closed until September 2020 for repair - capacity down from 53 to 30 mmcm/d
So max Passo Gries import capacity = 30 +21 (Oltingue) – Swiss demand And PG demand above 30 mmcm/d – Swiss demand comes from France
PEFG Nord at around TTF - 0.2 gives cost of marginal supply of TTF + 3.0 €/MWh
-1
0
1
2
3
4
5
6
0
10
20
30
40
50
60
Germanexitmmcm
PassoGries Flowmmcm
Spot PSV/TTF €/MWh
-1
0
1
2
3
4
5
6
0
10
20
30
40
50
60German exitcapacity atWallbachmmcm/d
Passo GriesFlow mmcm
Spot PSV/TTF €/MWh
PSV premium
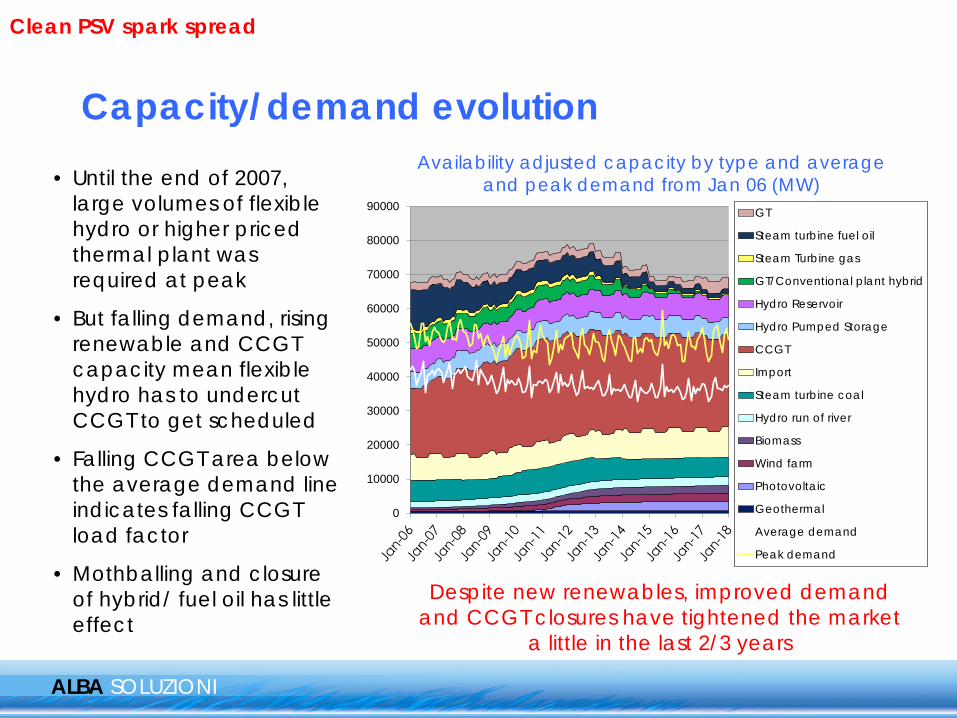
Capacity/demand evolution
ALBA SOLUZIONI
Availability adjusted capacity by type and average and peak demand from Jan 06 (MW)
• Until the end of 2007, large volumes of flexible hydro or higher priced thermal plant was required at peak
• But falling demand, rising renewable and CCGT capacity mean flexible hydro has to undercut CCGT to get scheduled
• Falling CCGT area below the average demand line indicates falling CCGT load factor
• Mothballing and closure of hybrid/ fuel oil has little effect
0
10000
20000
30000
40000
50000
60000
70000
80000
90000 GT
Steam turbine fuel oil
Steam Turbine gas
GT/Conventional plant hybrid
Hydro Reservoir
Hydro Pumped Storage
CCGT
Import
Steam turbine coal
Hydro run of river
Biomass
Wind farm
Photovoltaic
Geothermal
Average demand
Peak demand
Despite new renewables, improved demand and CCGT closures have tightened the market
a little in the last 2/3 years
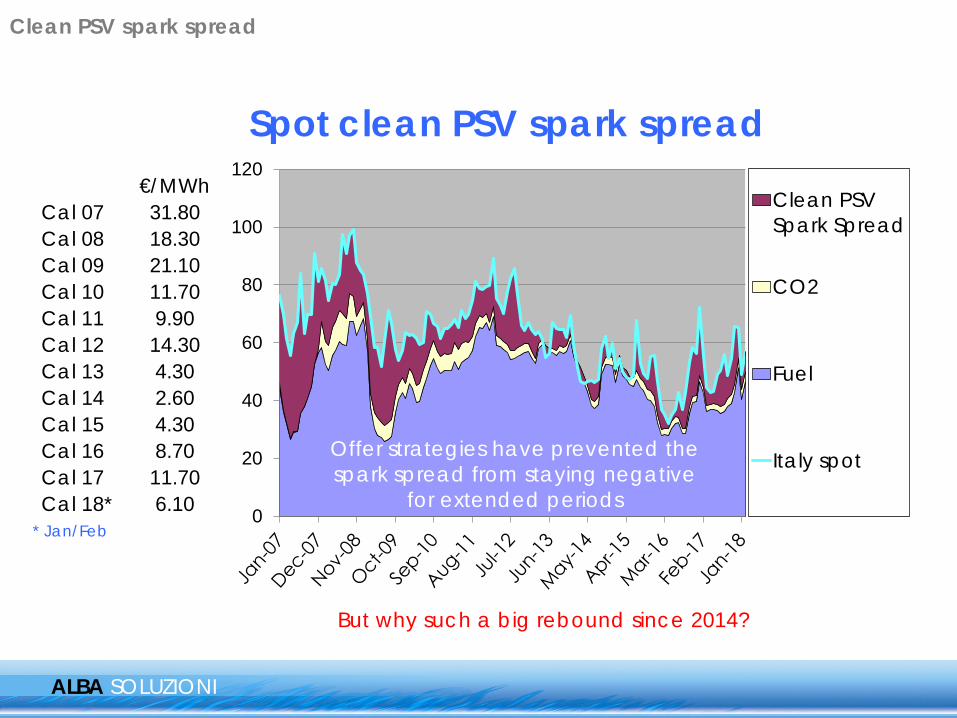
Clean PSV spark spread
ALBA SOLUZIONI
Spot clean PSV spark spread
But why such a big rebound since 2014?
Clean PSV spark spread
* Jan/Feb
€/MWhCal 07 31.80Cal 08 18.30Cal 09 21.10Cal 10 11.70Cal 11 9.90Cal 12 14.30Cal 13 4.30Cal 14 2.60Cal 15 4.30Cal 16 8.70Cal 17 11.70Cal 18* 6.10 0
20
40
60
80
100
120Clean PSVSpark Spread
CO2
Fuel
Italy spotOffer strategies have prevented the spark spread from staying negative
for extended periods
ALBA SOLUZIONI
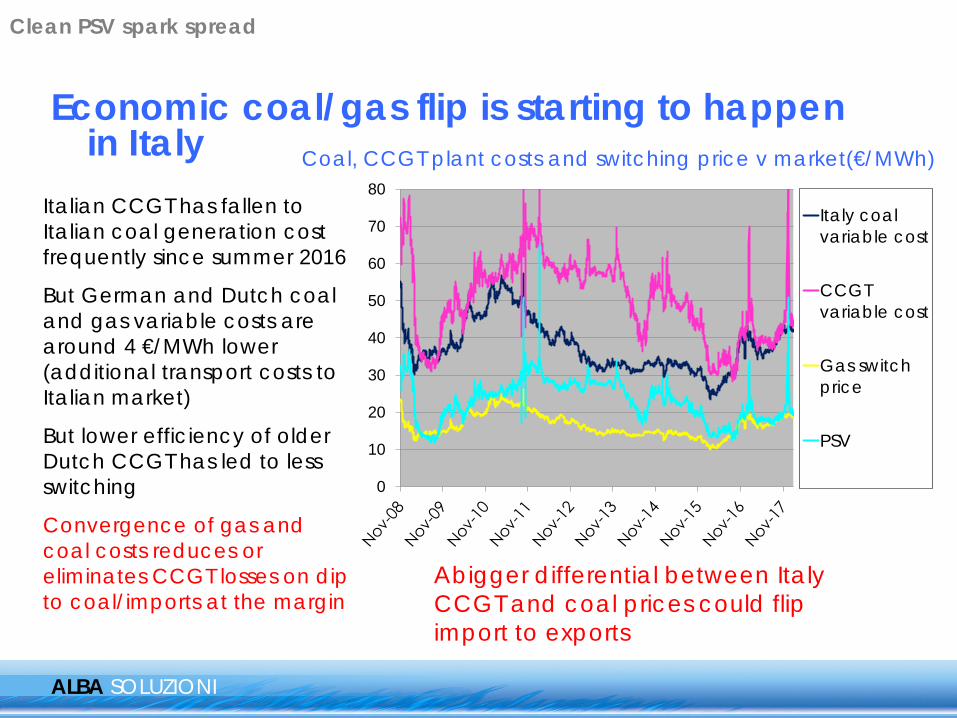
Economic coal/gas flip is starting to happen in Italy Coal, CCGT plant costs and switching price v market(€/MWh)
Italian CCGT has fallen to Italian coal generation cost frequently since summer 2016
But German and Dutch coal and gas variable costs are around 4 €/MWh lower (additional transport costs to Italian market)
But lower efficiency of older Dutch CCGT has led to less switching
Convergence of gas and coal costs reduces or eliminates CCGT losses on dip to coal/imports at the margin
Abigger differential between Italy CCGT and coal prices could flip import to exports
0
10
20
30
40
50
60
70
80Italy coalvariable cost
CCGTvariable cost
Gas switchprice
PSV
Clean PSV spark spread
ALBA SOLUZIONI
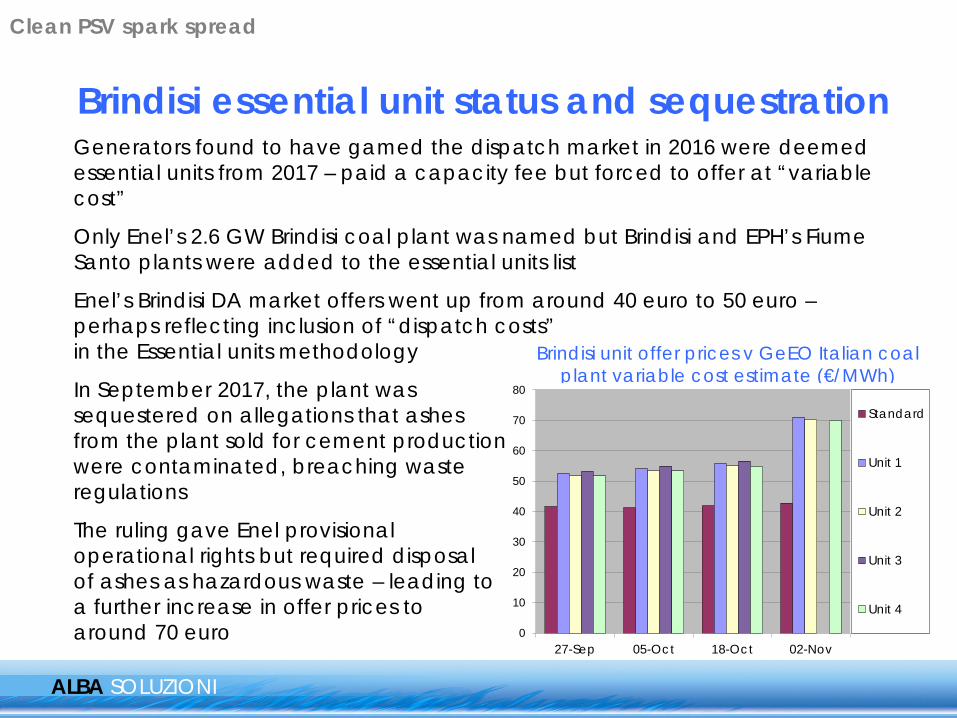
Brindisi essential unit status and sequestration Generators found to have gamed the dispatch market in 2016 were deemed essential units from 2017 – paid a capacity fee but forced to offer at “variable cost”
Only Enel’s 2.6 GW Brindisi coal plant was named but Brindisi and EPH’s Fiume Santo plants were added to the essential units list
Enel’s Brindisi DA market offers went up from around 40 euro to 50 euro – perhaps reflecting inclusion of “dispatch costs” in the Essential units methodology
In September 2017, the plant was sequestered on allegations that ashes from the plant sold for cement production were contaminated, breaching waste regulations
The ruling gave Enel provisional operational rights but required disposal of ashes as hazardous waste – leading to a further increase in offer prices to around 70 euro
Brindisi unit offer prices v GeEO Italian coal plant variable cost estimate (€/MWh)
0
10
20
30
40
50
60
70
80
27-Sep 05-Oct 18-Oct 02-Nov
Standard
Unit 1
Unit 2
Unit 3
Unit 4
Clean PSV spark spread
ALBA SOLUZIONI
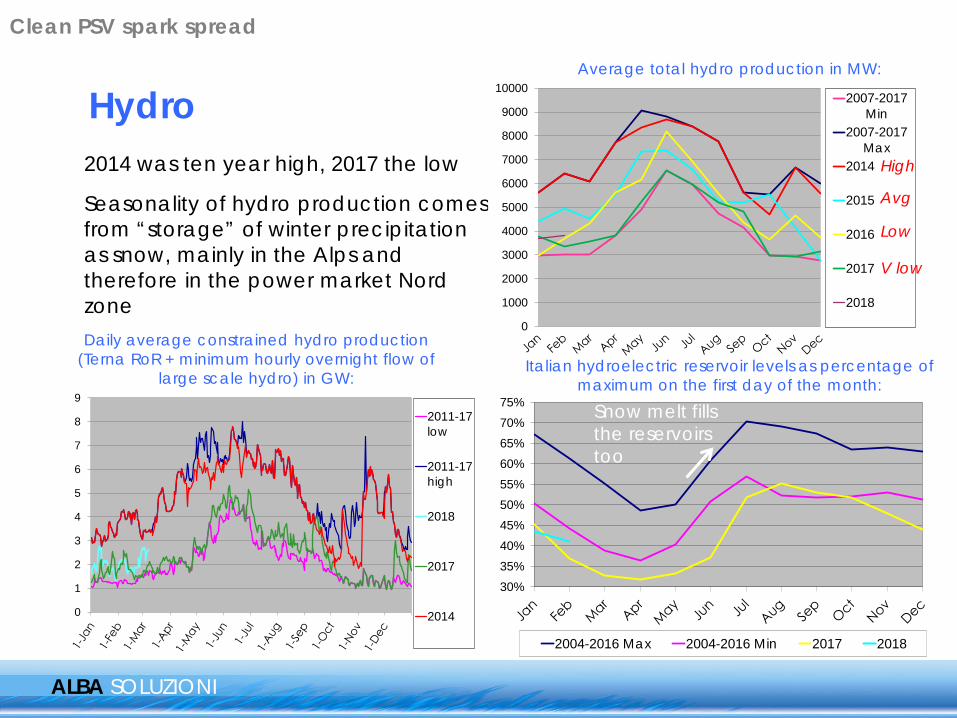
Hydro Average total hydro production in MW:
Italian hydroelectric reservoir levels as percentage of maximum on the first day of the month:
2014 was ten year high, 2017 the low
Seasonality of hydro production comes from “storage” of winter precipitation as snow, mainly in the Alps and therefore in the power market Nord zone Daily average constrained hydro production
(Terna RoR + minimum hourly overnight flow of large scale hydro) in GW:
30%35%40%45%50%55%60%65%70%75%
2004-2016 Max 2004-2016 Min 2017 2018
0
1000
2000
3000
4000
5000
6000
7000
8000
9000
100002007-2017
Min2007-2017
Max2014
2015
2016
2017
2018
0
1
2
3
4
5
6
7
8
92011-17low
2011-17high
2018
2017
2014
Snow melt fills the reservoirs too
Clean PSV spark spread
High Avg Low V low
0
10
20
30
40
50
602015/16nuclear
2016/17nuclear
2017/18nuclear
Coal 2015/16
Coal 2016/17
Coal 2017/18
ALBA SOLUZIONI
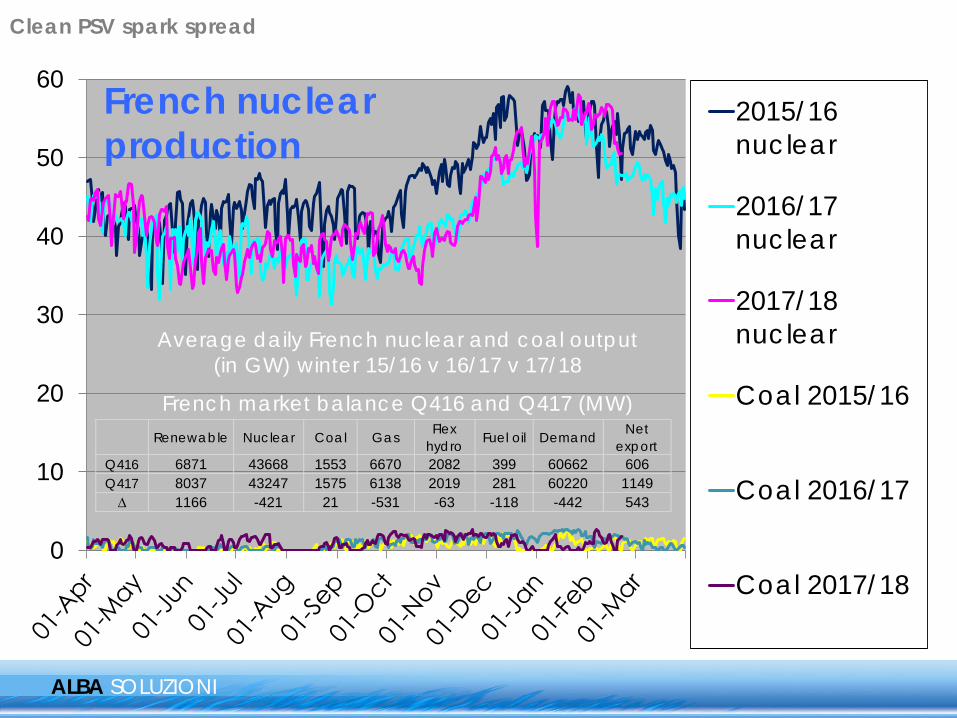
French nuclear production
Average daily French nuclear and coal output (in GW) winter 15/16 v 16/17 v 17/18
French market balance Q416 and Q417 (MW) Renewable Nuclear Coal Gas Flex
hydro Fuel oil Demand Net export
Q416 6871 43668 1553 6670 2082 399 60662 606Q417 8037 43247 1575 6138 2019 281 60220 1149∆ 1166 -421 21 -531 -63 -118 -442 543
Clean PSV spark spread
-
10,000
20,000
30,000
40,000
50,000
60,000
70,000
80,000GT
Steam turbine fuel oil
GT/Conventional plant hybrid
Steam Turbine gas
Hydro Reservoir
Hydro Pumped Storage
CCGT
Import
Steam turbine coal
Hydro run of river
Biomass
Wind farm
Photovoltaic
Geothermal
Peak demand
Average demand
ALBA SOLUZIONI
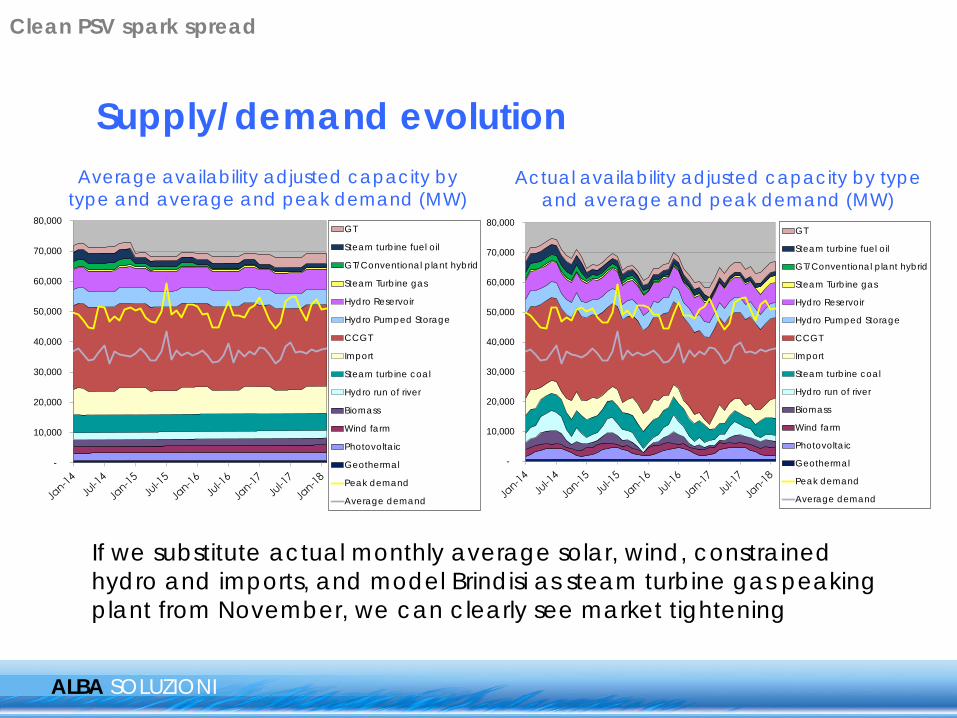
Supply/demand evolution Average availability adjusted capacity by
type and average and peak demand (MW) Actual availability adjusted capacity by type
and average and peak demand (MW)
If we substitute actual monthly average solar, wind, constrained hydro and imports, and model Brindisi as steam turbine gas peaking plant from November, we can clearly see market tightening
-
10,000
20,000
30,000
40,000
50,000
60,000
70,000
80,000GT
Steam turbine fuel oil
GT/Conventional plant hybrid
Steam Turbine gas
Hydro Reservoir
Hydro Pumped Storage
CCGT
Import
Steam turbine coal
Hydro run of river
Biomass
Wind farm
Photovoltaic
Geothermal
Peak demand
Average demand
Clean PSV spark spread
-6
-4
-2
0
2
4
6
Demand
Import
Hydro
Wind
Solar
Market tightness
ALBA SOLUZIONI
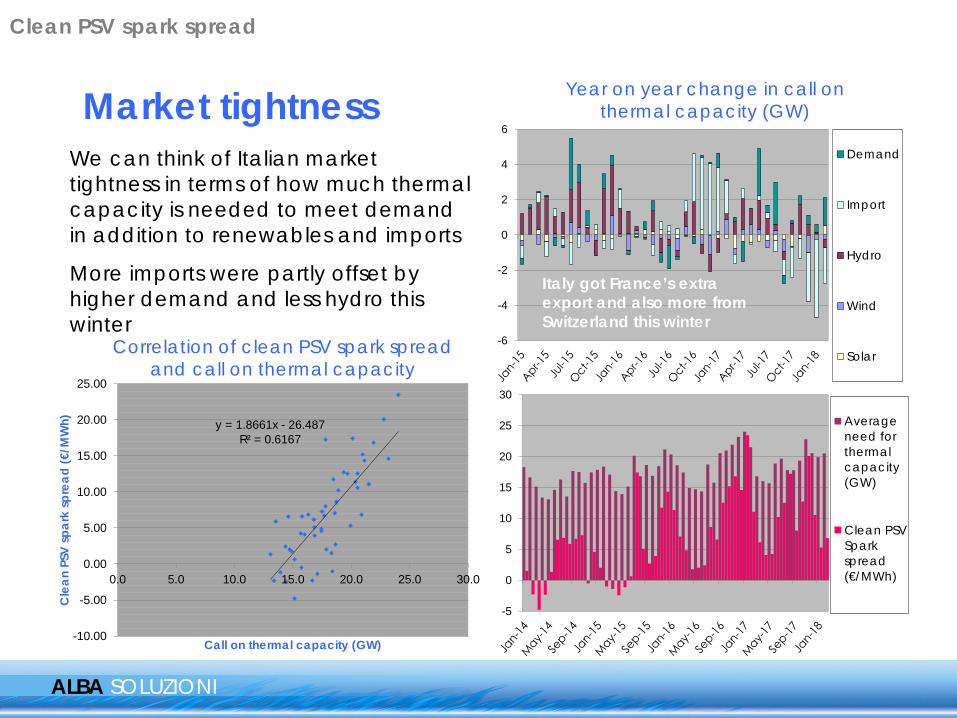
We can think of Italian market tightness in terms of how much thermal capacity is needed to meet demand in addition to renewables and imports
More imports were partly offset by higher demand and less hydro this winter
Year on year change in call on thermal capacity (GW)
y = 1.8661x - 26.487R² = 0.6167
-10.00
-5.00
0.00
5.00
10.00
15.00
20.00
25.00
0.0 5.0 10.0 15.0 20.0 25.0 30.0
Cle
an P
SV sp
ark
spre
ad (€
/MW
h)
Call on thermal capacity (GW)
Correlation of clean PSV spark spread and call on thermal capacity
Italy got France’s extra export and also more from Switzerland this winter
-5
0
5
10
15
20
25
30
Averageneed forthermalcapacity(GW)
Clean PSV Spark spread (€/MWh)
Clean PSV spark spread
ALBA SOLUZIONI
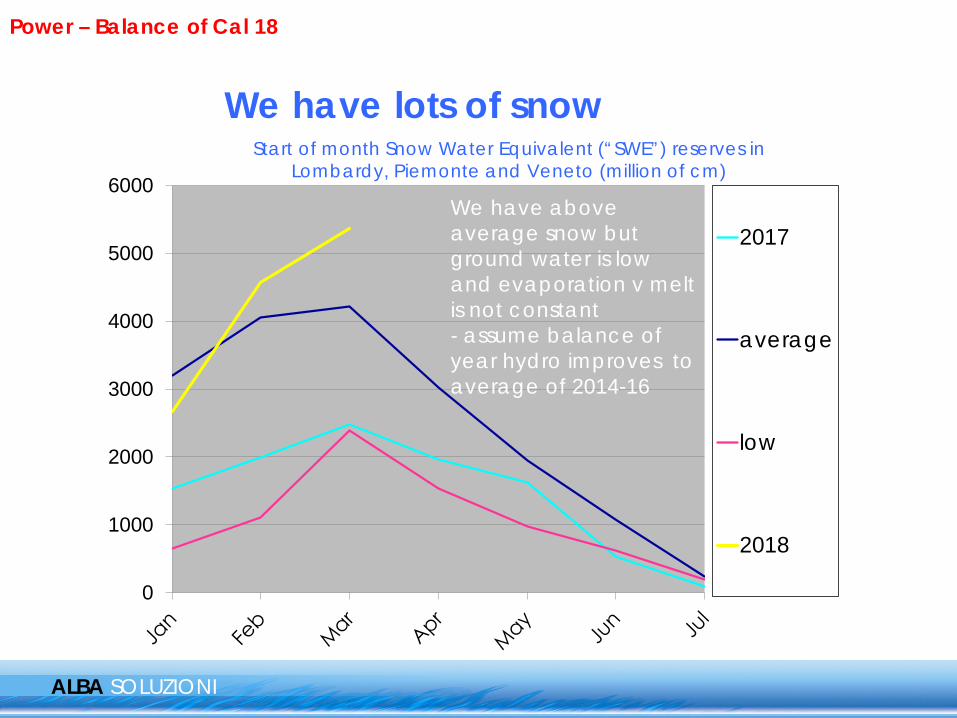
We have lots of snow
0
1000
2000
3000
4000
5000
6000
2017
average
low
2018
Start of month Snow Water Equivalent (“SWE”) reserves in Lombardy, Piemonte and Veneto (million of cm)
We have above average snow but ground water is low and evaporation v melt is not constant - assume balance of year hydro improves to average of 2014-16
Power – Balance of Cal 18

ASN has asked EdF to examine and report on the manufacturing files of components manufactured at Creusot Forge foundry in all of its 58 reactors
Only 12 have been done so far, most of the remaining 46 will close for refuelling over the summer
EdF annual production forecast is close to the four year average, so looks like some delays are anticipated due to several 10 year inspections scheduled
ALBA SOLUZIONI
French nuclear still risk for Q418?
Average daily nuclear output (in GW)
0
10
20
30
40
50
602015/16nuclear
2016/17nuclear
2017/18nuclear
Coal 2015/16
Coal 2016/17
Coal 2017/18
Annual nuclear output (in TWh)
So assume imports at average of last 4 years?
0
50
100
150
200
250
300
350
400
450
2015 2015 2016 2017 2018
Annualproduction
EdFForecast
Power – Balance of Cal 18
ALBA SOLUZIONI
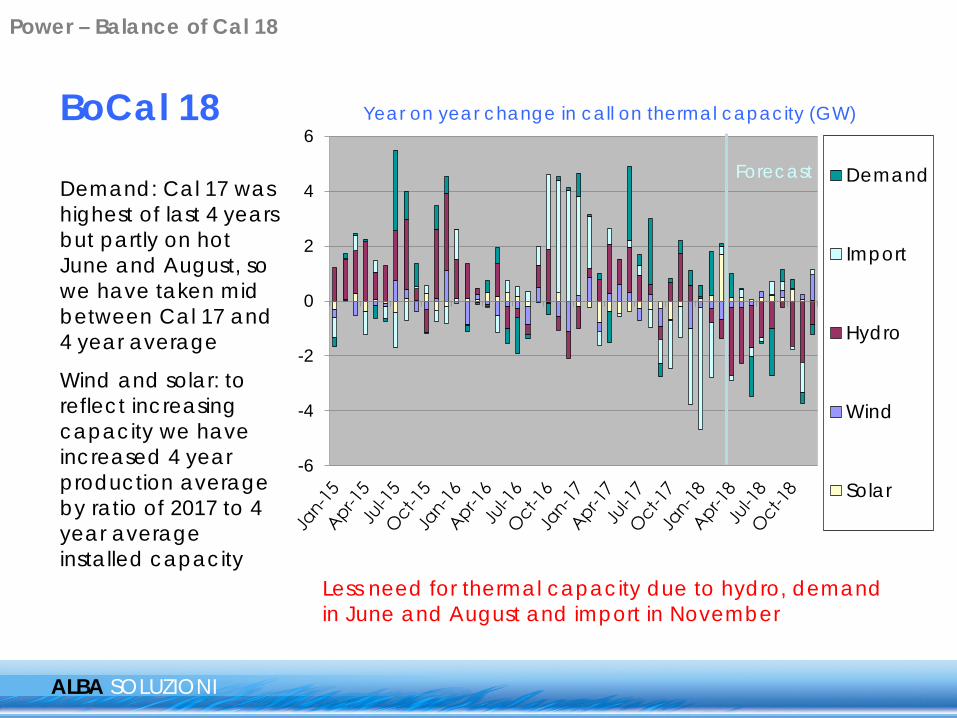
BoCal 18
Demand: Cal 17 was highest of last 4 years but partly on hot June and August, so we have taken mid between Cal 17 and 4 year average
Wind and solar: to reflect increasing capacity we have increased 4 year production average by ratio of 2017 to 4 year average installed capacity
-6
-4
-2
0
2
4
6
Demand
Import
Hydro
Wind
Solar
Year on year change in call on thermal capacity (GW)
Less need for thermal capacity due to hydro, demand in June and August and import in November
Forecast
Power – Balance of Cal 18

ALBA SOLUZIONI
Balance of 2018 curve v 2017 v model Curve prices on 15 March 2018 (€/MWh)
Market has already priced in an increase in hydro output
Use of 2 year correlation (less coal) takes us 1.50 euro higher
1% increase to Cal 17 level demand takes us 0.50 euro higher
Italia It/Fr It/GerClean SS PSV
CSS Cal 17 ∆ YoY Model
∆ v model
Apr 47.75 9.65 14.00 1.55 4.09 -2.54 -0.17 1.72Mag 44.60 14.15 14.55 0.10 4.25 -4.15 -0.57 0.67Giu 47.90 14.45 15.25 3.30 10.23 -6.93 2.33 0.97Q218 46.75 12.75 14.60 1.65 6.19 -4.54 0.53 1.12Q318 52.85 18.25 18.70 8.35 12.59 -4.24 6.46 1.89Sum-18 49.80 15.50 16.65 5.00 9.39 -4.39 3.49 1.51Q418 55.10 5.65 16.25 9.20 14.46 -5.26 9.67 -0.47
0.00
2.00
4.00
6.00
8.00
10.00
12.00
2-Oct 2-Nov 2-Dec 2-Jan 2-Feb 2-Mar
Q418
S18Clean PSV spark spreads in €/MWh
Power – Balance of Cal 18
April CSS outturn -0.22 €/MWh
-2000
0
2000
4000
6000
8000
10000
12000
14000Previous Min2004-2015
Previous Max2004-2015
SY16
SY17
Demand
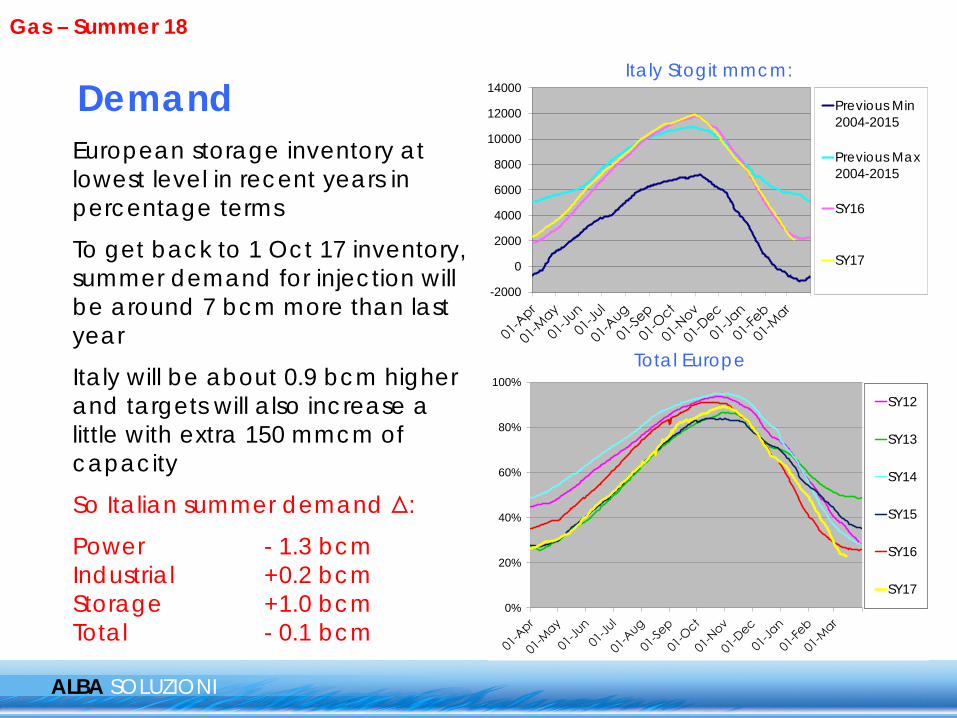
ALBA SOLUZIONI
European storage inventory at lowest level in recent years in percentage terms
To get back to 1 Oct 17 inventory, summer demand for injection will be around 7 bcm more than last year
Italy will be about 0.9 bcm higher and targets will also increase a little with extra 150 mmcm of capacity
So Italian summer demand Δ:
Power - 1.3 bcm Industrial +0.2 bcm Storage +1.0 bcm Total - 0.1 bcm
Italy Stogit mmcm:
Total Europe
0%
20%
40%
60%
80%
100%
SY12
SY13
SY14
SY15
SY16
SY17
Gas – Summer 18
ALBA SOLUZIONI
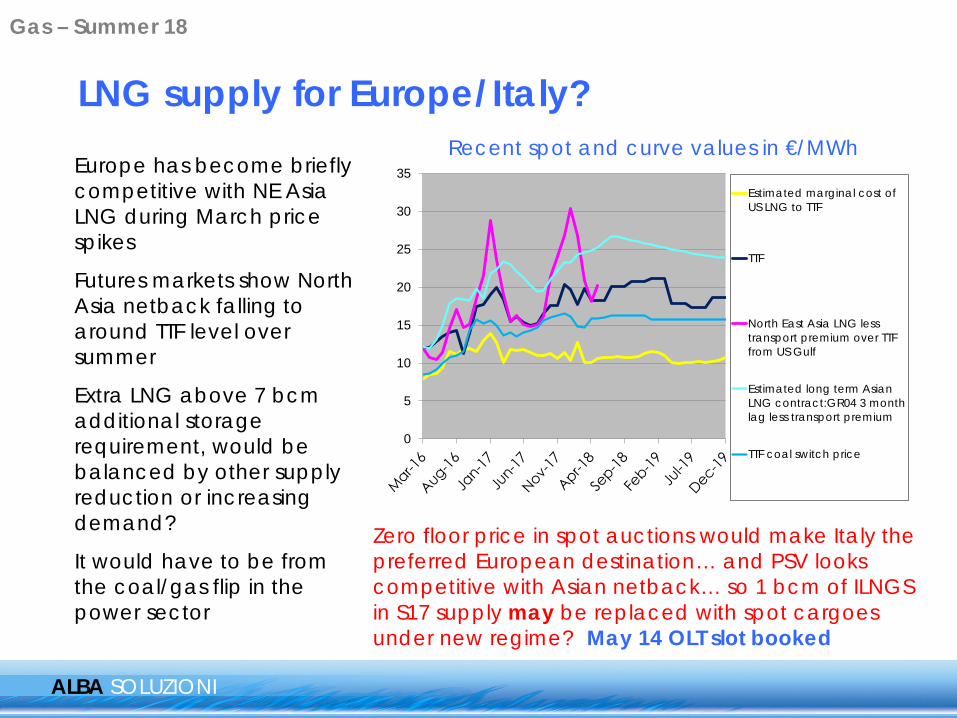
LNG supply for Europe/Italy? Recent spot and curve values in €/MWh
Europe has become briefly competitive with NE Asia LNG during March price spikes
Futures markets show North Asia netback falling to around TTF level over summer
Extra LNG above 7 bcm additional storage requirement, would be balanced by other supply reduction or increasing demand?
It would have to be from the coal/gas flip in the power sector
Zero floor price in spot auctions would make Italy the preferred European destination… and PSV looks competitive with Asian netback… so 1 bcm of ILNGS in S17 supply may be replaced with spot cargoes under new regime? May 14 OLT slot booked
Gas – Summer 18
0
5
10
15
20
25
30
35Estimated marginal cost ofUS LNG to TTF
TTF
North East Asia LNG lesstransport premium over TTFfrom US Gulf
Estimated long term AsianLNG contract:GR04 3 monthlag less transport premium
TTF coal switch price
0
10
20
30
40
50
60
70
80
90
100
Mazaradel Vallo
Tarvisio PassoGries
Gela LNG NationalProduction
Sum-13
Sum-14
Sum-15
Sum-16
Sum-17
ALBA SOLUZIONI
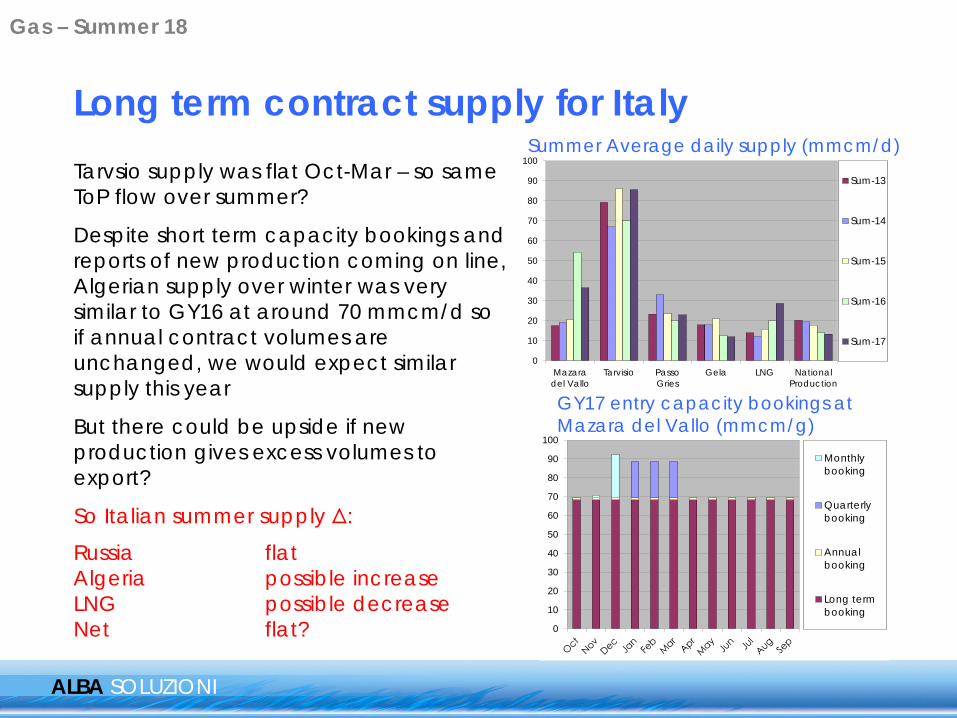
Long term contract supply for Italy Tarvsio supply was flat Oct-Mar – so same ToP flow over summer?
Despite short term capacity bookings and reports of new production coming on line, Algerian supply over winter was very similar to GY16 at around 70 mmcm/d so if annual contract volumes are unchanged, we would expect similar supply this year
But there could be upside if new production gives excess volumes to export?
So Italian summer supply Δ:
Russia flat Algeria possible increase LNG possible decrease Net flat?
Summer Average daily supply (mmcm/d)
0
10
20
30
40
50
60
70
80
90
100
Monthlybooking
Quarterlybooking
Annualbooking
Long termbooking
GY17 entry capacity bookings at Mazara del Vallo (mmcm/g)
Gas – Summer 18
0
10
20
30
40
50
60
70
80
90
100
Mazaradel Vallo
Tarvisio PassoGries
Gela LNG NationalProduction
Sum-13
Sum-14
Sum-15
Sum-16
Sum-17
ALBA SOLUZIONI
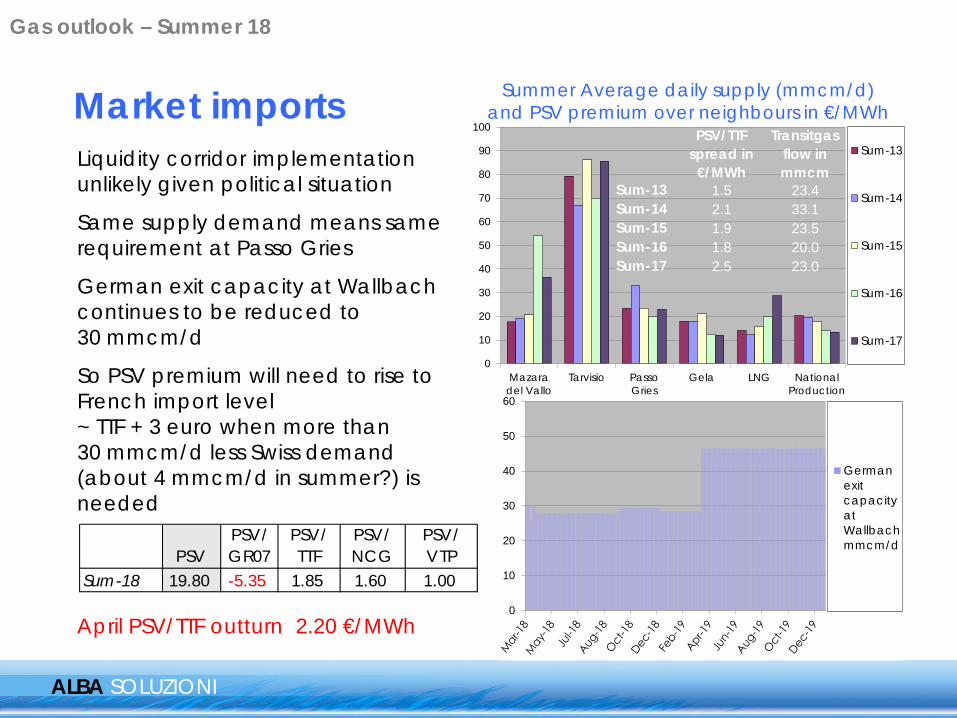
Market imports Liquidity corridor implementation unlikely given political situation
Same supply demand means same requirement at Passo Gries
German exit capacity at Wallbach continues to be reduced to 30 mmcm/d
So PSV premium will need to rise to French import level ~ TTF + 3 euro when more than 30 mmcm/d less Swiss demand (about 4 mmcm/d in summer?) is needed
Summer Average daily supply (mmcm/d) and PSV premium over neighbours in €/MWh
PSV/TTF spread in €/MWh
Transitgas flow in mmcm
Sum-13 1.5 23.4Sum-14 2.1 33.1Sum-15 1.9 23.5Sum-16 1.8 20.0Sum-17 2.5 23.0
0
10
20
30
40
50
60
GermanexitcapacityatWallbachmmcm/d
PSVPSV/ GR07
PSV/ TTF
PSV/ NCG
PSV/ VTP
Sum-18 19.80 -5.35 1.85 1.60 1.00
Gas outlook – Summer 18
April PSV/TTF outturn 2.20 €/MWh
12
13
14
15
16
17
18
19
02-Jul 02-Aug 02-Sep 02-Oct
Daily PSVprice
Injectionvolume
ALBA SOLUZIONI
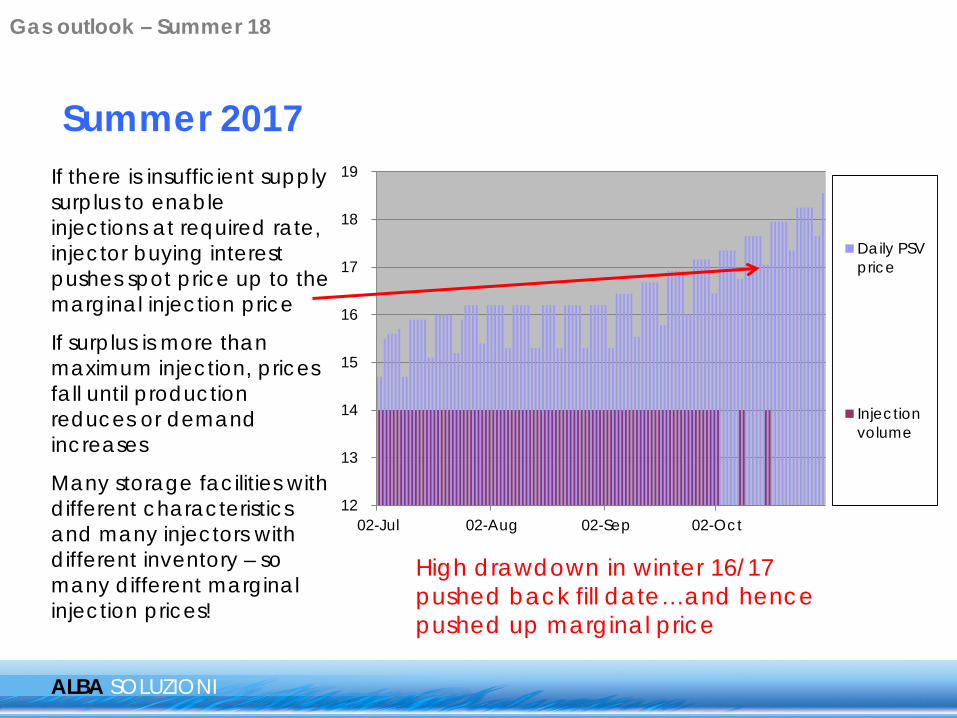
If there is insufficient supply surplus to enable injections at required rate, injector buying interest pushes spot price up to the marginal injection price
If surplus is more than maximum injection, prices fall until production reduces or demand increases
Many storage facilities with different characteristics and many injectors with different inventory – so many different marginal injection prices!
Summer 2017
High drawdown in winter 16/17 pushed back fill date…and hence pushed up marginal price
Gas outlook – Summer 18
14
15
16
17
18
19
20
PSV spot
PSV Oct
TTF spot
TTF Oct
ALBA SOLUZIONI
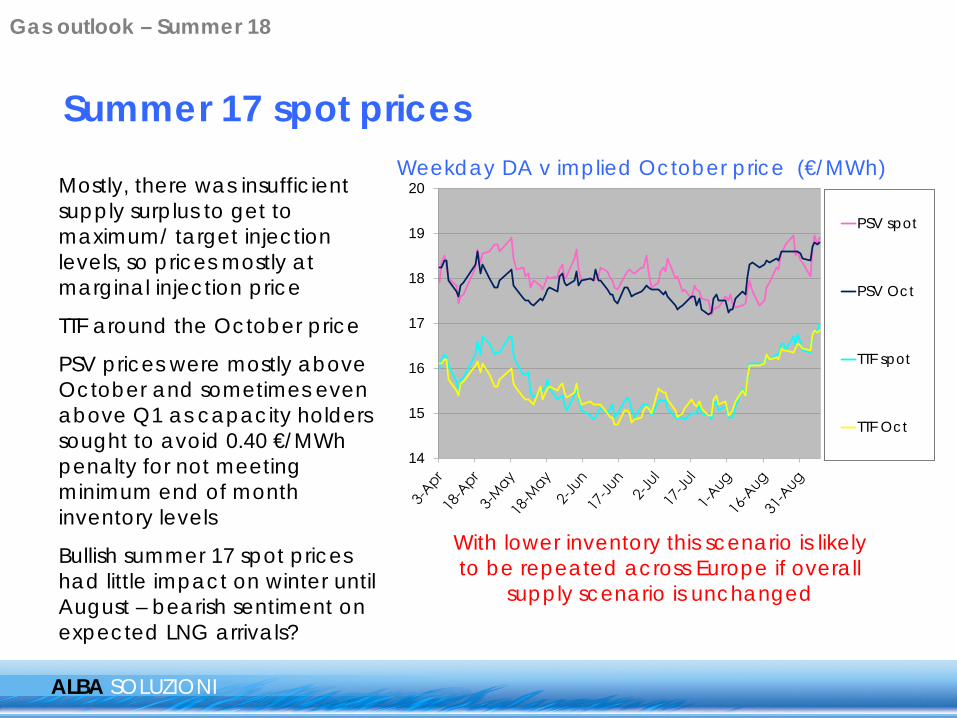
Mostly, there was insufficient supply surplus to get to maximum/ target injection levels, so prices mostly at marginal injection price
TTF around the October price
PSV prices were mostly above October and sometimes even above Q1 as capacity holders sought to avoid 0.40 €/MWh penalty for not meeting minimum end of month inventory levels
Bullish summer 17 spot prices had little impact on winter until August – bearish sentiment on expected LNG arrivals?
Summer 17 spot prices Weekday DA v implied October price (€/MWh)
With lower inventory this scenario is likely to be repeated across Europe if overall
supply scenario is unchanged
Gas outlook – Summer 18
Demand scenarios
ALBA SOLUZIONI
Annual power demand (TWh
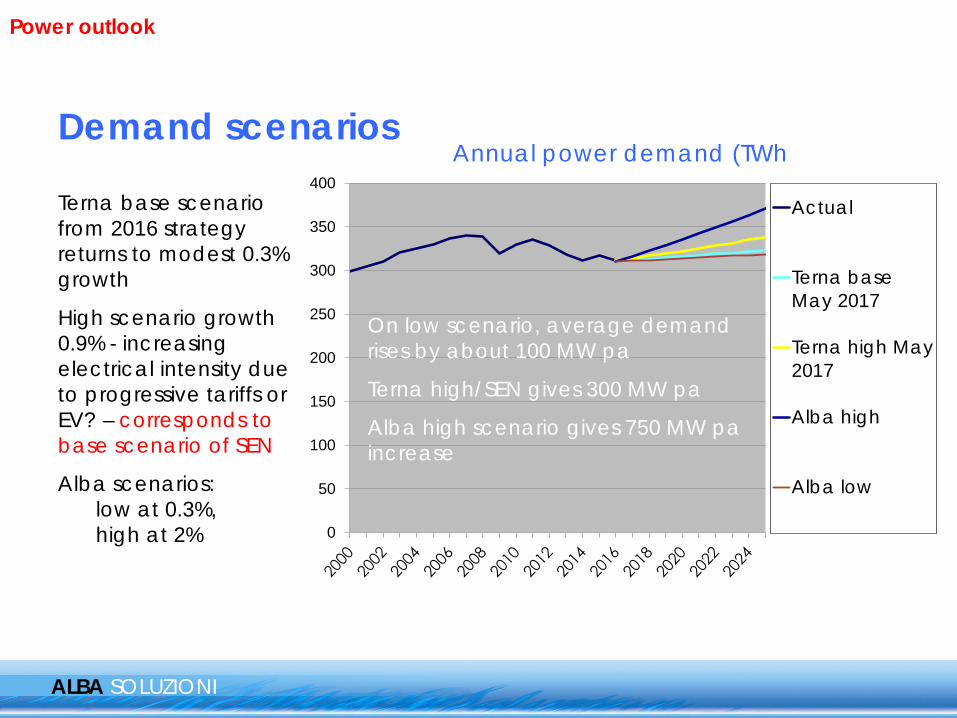
Terna base scenario from 2016 strategy returns to modest 0.3% growth
High scenario growth 0.9% - increasing electrical intensity due to progressive tariffs or EV? – corresponds to base scenario of SEN
Alba scenarios: low at 0.3%, high at 2%
Power outlook
0
50
100
150
200
250
300
350
400Actual
Terna baseMay 2017
Terna high May2017
Alba high
Alba low
On low scenario, average demand rises by about 100 MW pa
Terna high/SEN gives 300 MW pa
Alba high scenario gives 750 MW pa increase
0
100
200
300
400
500
600
700
800
900
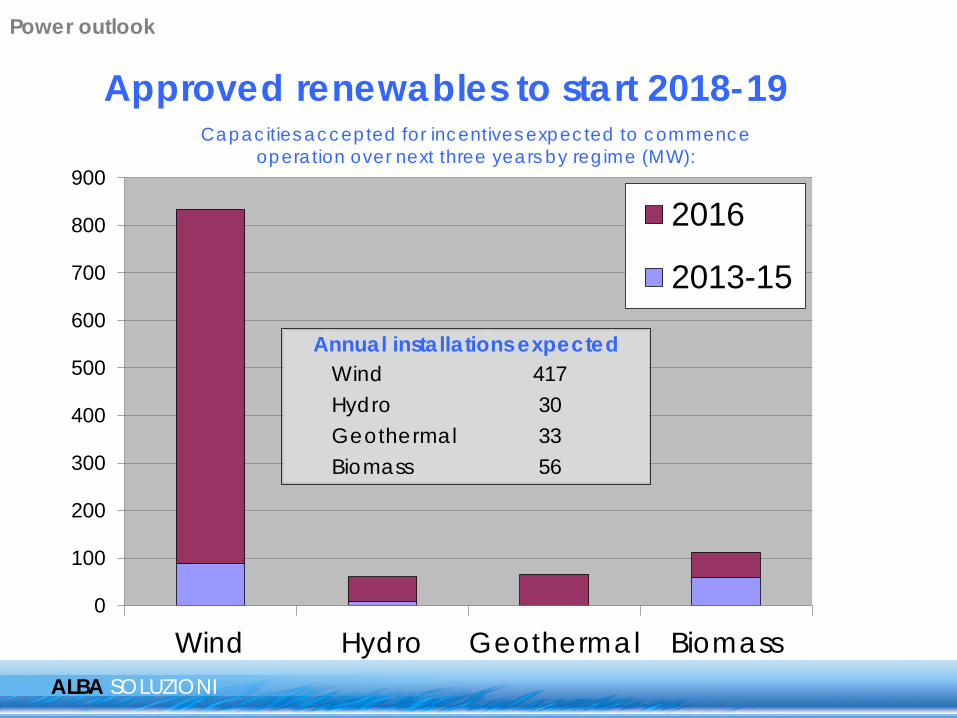
Wind Hydro Geothermal Biomass
2016
2013-15
Wind 417Hydro 30Geothermal 33Biomass 56
Annual installations expected
ALBA SOLUZIONI
Approved renewables to start 2018-19
Power outlook
Capacities accepted for incentives expected to commence operation over next three years by regime (MW):
ALBA SOLUZIONI
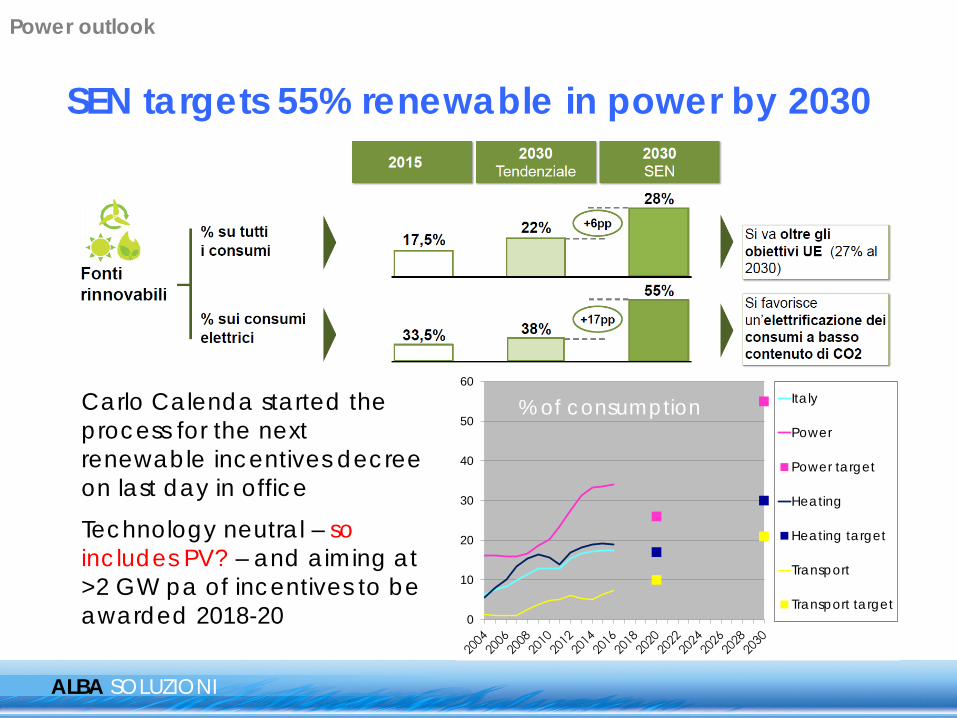
SEN targets 55% renewable in power by 2030
0
10
20
30
40
50
60Italy
Power
Power target
Heating
Heating target
Transport
Transport target
% of consumption Carlo Calenda started the process for the next renewable incentives decree on last day in office
Technology neutral – so includes PV? – and aiming at >2 GW pa of incentives to be awarded 2018-20
Power outlook
ALBA SOLUZIONI
SEN target 2020-2030 installation rates
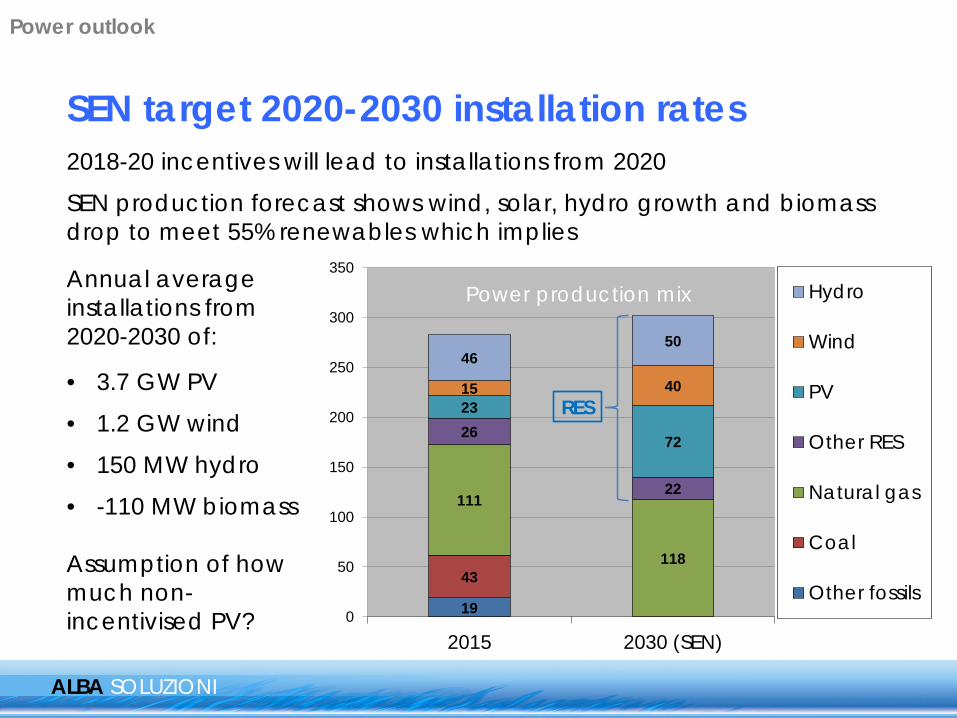
2018-20 incentives will lead to installations from 2020
SEN production forecast shows wind, solar, hydro growth and biomass drop to meet 55% renewables which implies
19
43
111
118
26
22
23
72
15 40
4650
0
50
100
150
200
250
300
350
2015 2030 (SEN)
Hydro
Wind
PV
Other RES
Natural gas
Coal
Other fossils
RES
Annual average installations from 2020-2030 of:
• 3.7 GW PV
• 1.2 GW wind
• 150 MW hydro
• -110 MW biomass Assumption of how much non-incentivised PV?
Power production mix
Power outlook
ALBA SOLUZIONI
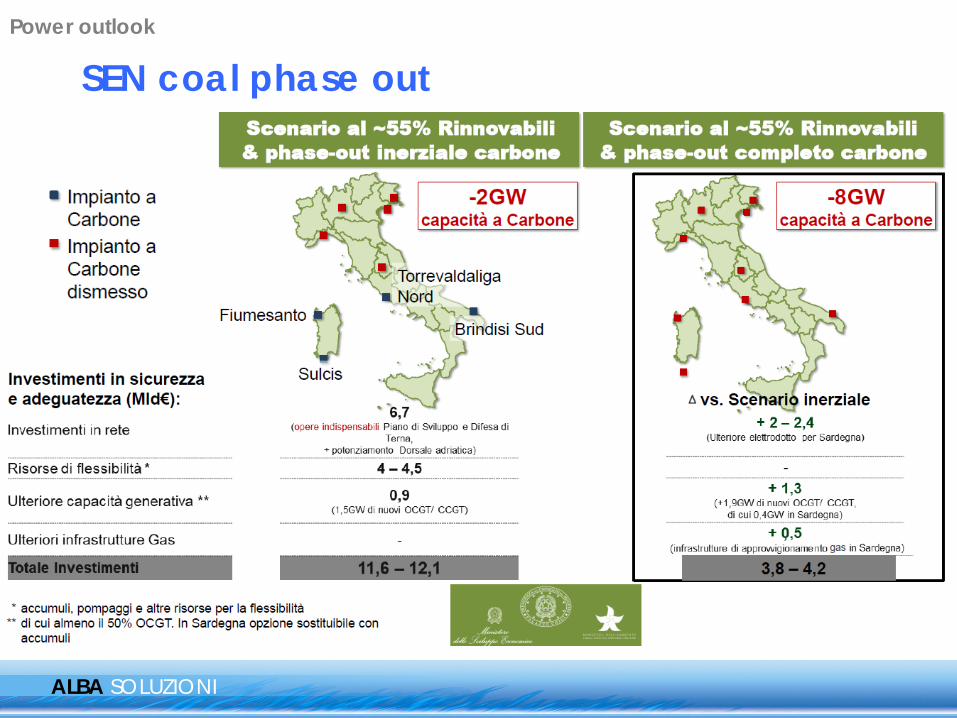
SEN coal phase out Power outlook
ALBA SOLUZIONI
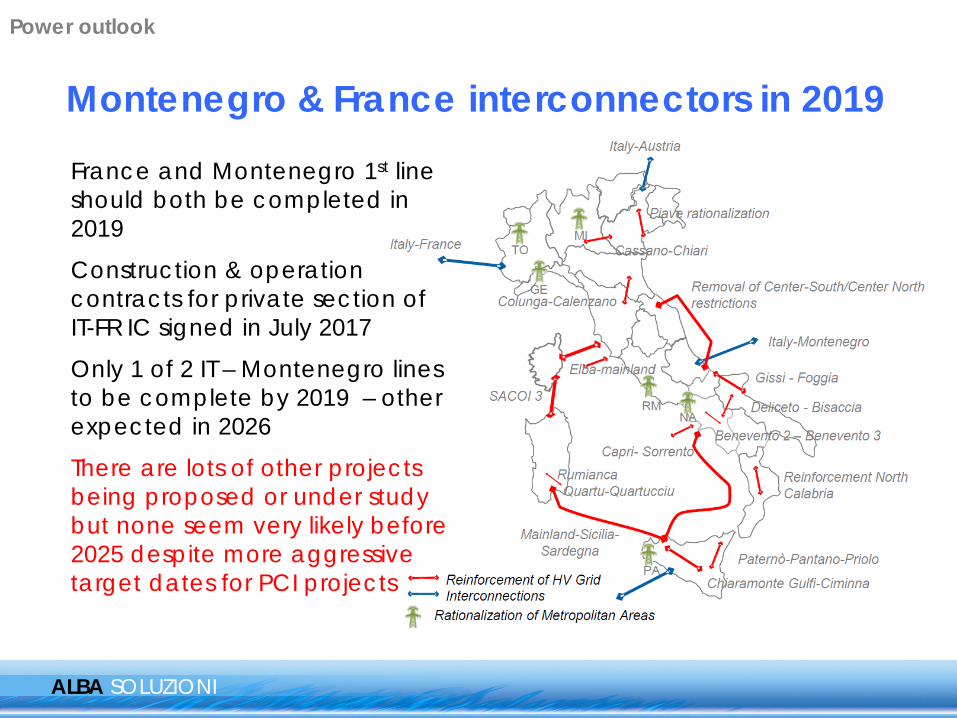
France and Montenegro 1st line should both be completed in 2019
Construction & operation contracts for private section of IT-FR IC signed in July 2017
Only 1 of 2 IT – Montenegro lines to be complete by 2019 – other expected in 2026
There are lots of other projects being proposed or under study but none seem very likely before 2025 despite more aggressive target dates for PCI projects
Montenegro & France interconnectors in 2019
Power outlook
ALBA SOLUZIONI
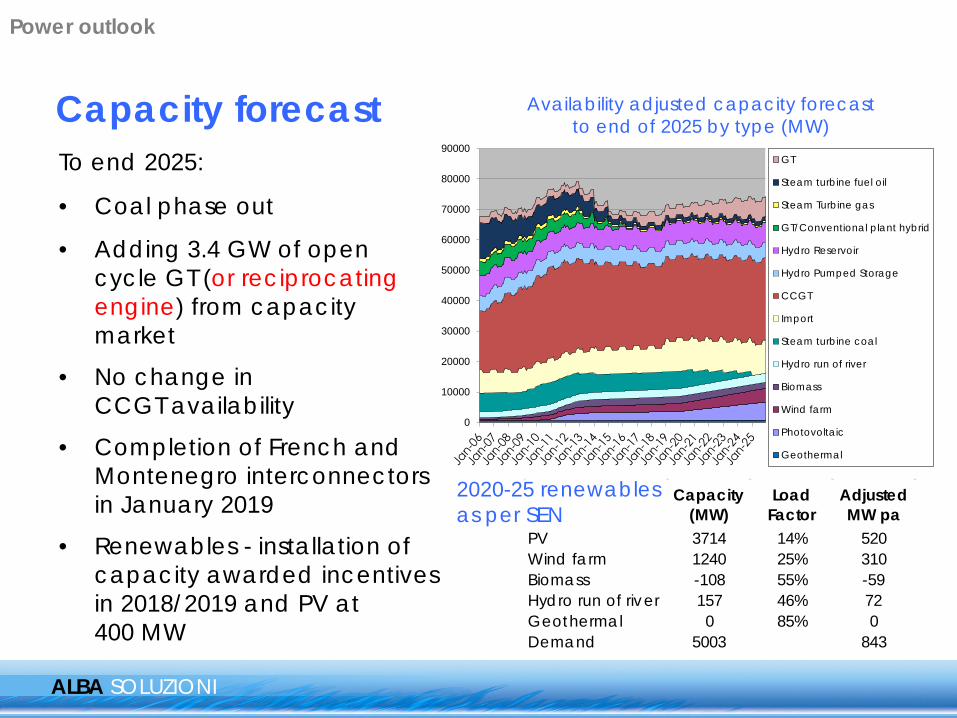
Capacity forecast Availability adjusted capacity forecast to end of 2025 by type (MW)
To end 2025:
• Coal phase out
• Adding 3.4 GW of open cycle GT (or reciprocating engine) from capacity market
• No change in CCGT availability
• Completion of French and Montenegro interconnectors in January 2019
• Renewables - installation of capacity awarded incentives in 2018/2019 and PV at 400 MW
0
10000
20000
30000
40000
50000
60000
70000
80000
90000GT
Steam turbine fuel oil
Steam Turbine gas
GT/Conventional plant hybrid
Hydro Reservoir
Hydro Pumped Storage
CCGT
Import
Steam turbine coal
Hydro run of river
Biomass
Wind farm
Photovoltaic
Geothermal
Capacity (MW)
Load Factor
Adjusted MW pa
PV 3714 14% 520Wind farm 1240 25% 310Biomass -108 55% -59Hydro run of river 157 46% 72Geothermal 0 85% 0Demand 5003 843
2020-25 renewables as per SEN
Power outlook
0
10000
20000
30000
40000
50000
60000
70000
80000
90000GT
Steam turbine fuel oil
GT/Conventional plant hybrid
Steam Turbine gas
Hydro Reservoir
Hydro Pumped Storage
CCGT
Import
Steam turbine coal
Hydro run of river
Biomass
Wind farm
Photovoltaic
Geothermal
Peak demand
Average demand
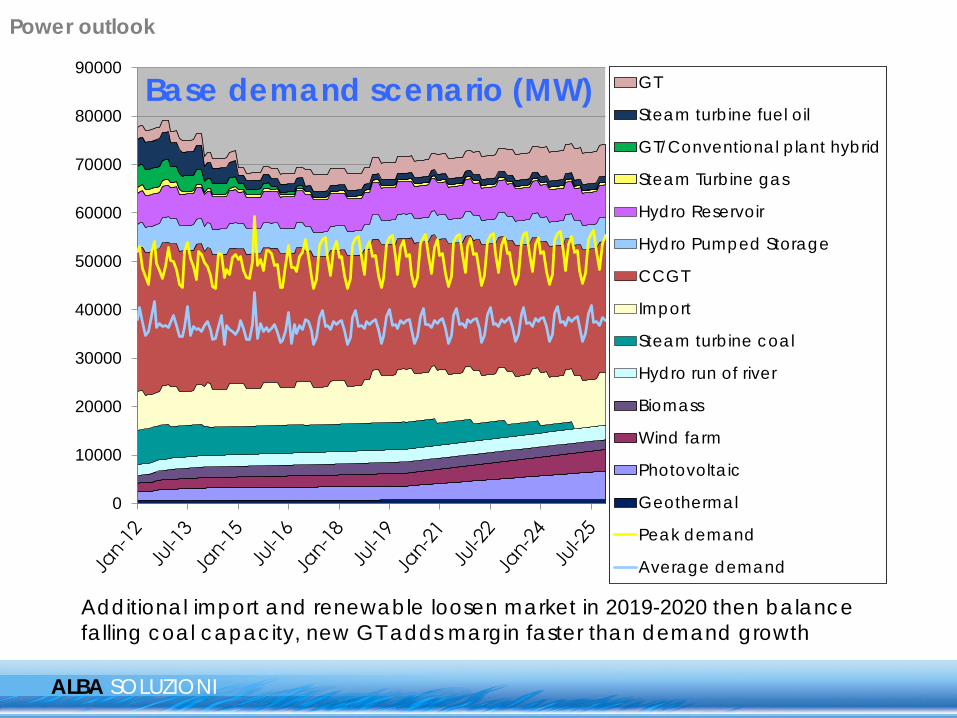
Base demand scenario (MW)
ALBA SOLUZIONI
Additional import and renewable loosen market in 2019-2020 then balance falling coal capacity, new GT adds margin faster than demand growth
Power outlook
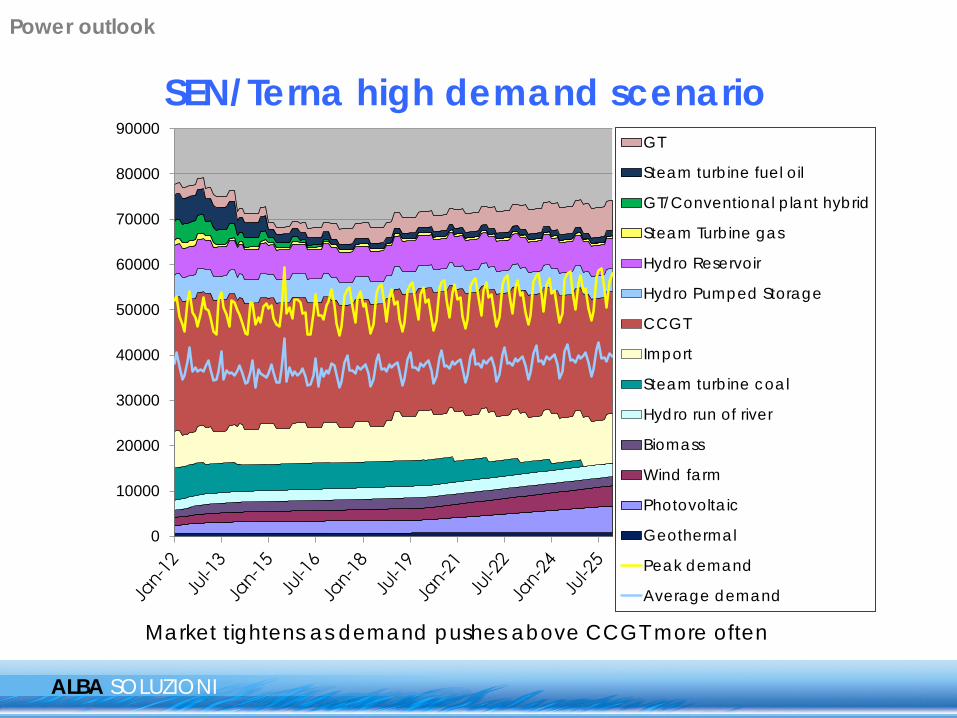
SEN/Terna high demand scenario (MW)
ALBA SOLUZIONI
Market tightens as demand pushes above CCGT more often
0
10000
20000
30000
40000
50000
60000
70000
80000
90000GT
Steam turbine fuel oil
GT/Conventional plant hybrid
Steam Turbine gas
Hydro Reservoir
Hydro Pumped Storage
CCGT
Import
Steam turbine coal
Hydro run of river
Biomass
Wind farm
Photovoltaic
Geothermal
Peak demand
Average demand
Power outlook

ALBA SOLUZIONI
Cal 18 backwardation on expected improvement in French nuclear availability and hydro
Cal 19/20 backwardation driven by new interconnectors
SEN target renewable installation rate would allow phase out of coal without overall tightening
Flexibility from storage will help smooth out diurnal profile in summer
But winter peaks on calm, cloudy days?
Conclusions - Power Average spot clean
PSV spark spread
Italia It/Fr It/GerClean SS PSV
Cal 19 48.35 8.45 13.75 5.75Cal 20 46.05 6.50 12.10 5.55
€/MWhCal 07 31.80Cal 08 18.30Cal 09 21.10Cal 10 11.70Cal 11 9.90Cal 12 14.30Cal 13 4.30Cal 14 2.60Cal 15 4.30Cal 16 8.70Cal 17 11.80Cal 18 6.10Cal 19 5.75Cal 20 5.55
Power outlook
0
5
10
15
20
25
30
35
40
45
50
Italy coal
CCGT
switch price
PSV
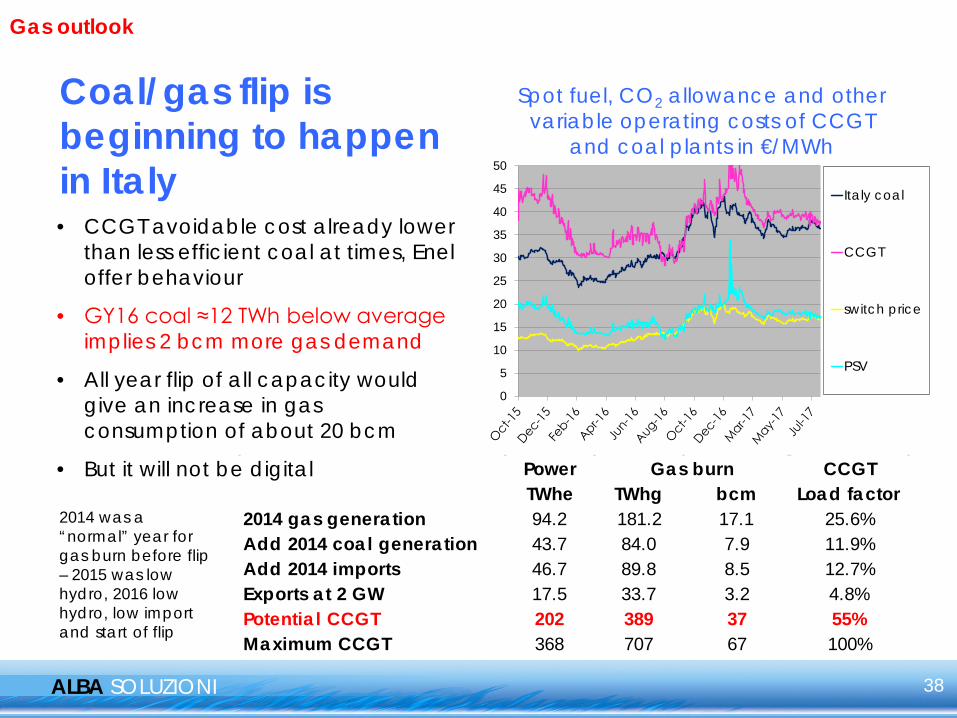
Coal/gas flip is beginning to happen in Italy
ALBA SOLUZIONI
Spot fuel, CO2 allowance and other variable operating costs of CCGT
and coal plants in €/MWh
Power CCGTTWhe TWhg bcm Load factor
2014 gas generation 94.2 181.2 17.1 25.6%Add 2014 coal generation 43.7 84.0 7.9 11.9%Add 2014 imports 46.7 89.8 8.5 12.7%Exports at 2 GW 17.5 33.7 3.2 4.8%Potential CCGT 202 389 37 55%Maximum CCGT 368 707 67 100%
Gas burn
• CCGT avoidable cost already lower than less efficient coal at times, Enel offer behaviour
• GY16 coal ≈12 TWh below average implies 2 bcm more gas demand
• All year flip of all capacity would give an increase in gas consumption of about 20 bcm
• But it will not be digital
2014 was a “normal” year for gas burn before flip – 2015 was low hydro, 2016 low hydro, low import and start of flip
38
Gas outlook
0
20
40
60
80
100
120Actual
Feb 2009 SRGforecast
2017 SRG low
2017 SRG high
Alba base
Alba flip
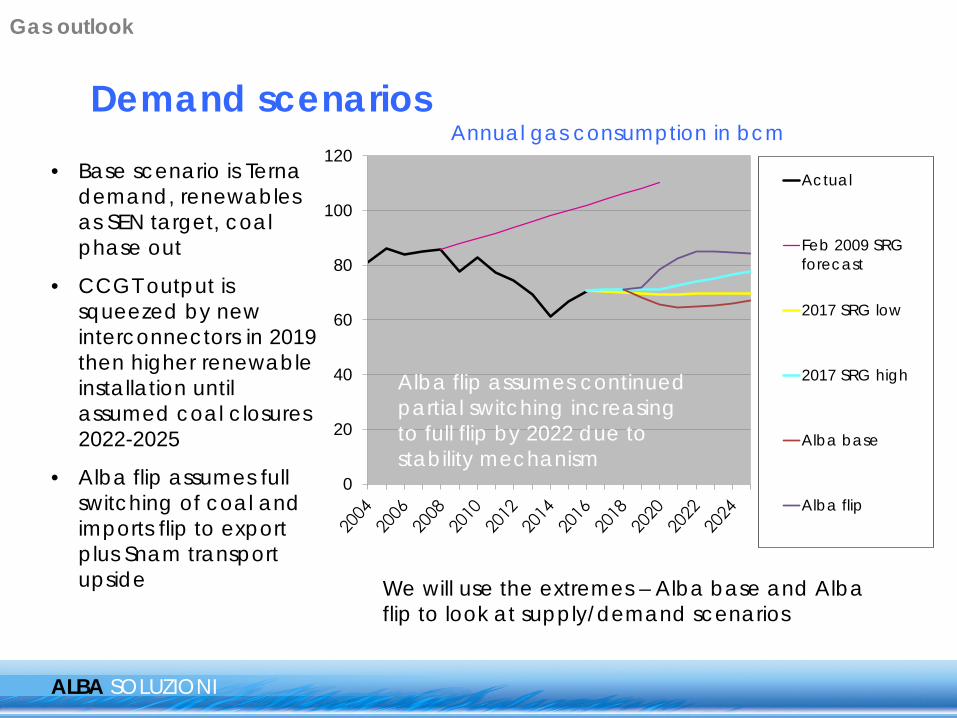
Demand scenarios
ALBA SOLUZIONI
• Base scenario is Terna demand, renewables as SEN target, coal phase out
• CCGT output is squeezed by new interconnectors in 2019 then higher renewable installation until assumed coal closures 2022-2025
• Alba flip assumes full switching of coal and imports flip to export plus Snam transport upside
Annual gas consumption in bcm
Alba flip assumes continued partial switching increasing to full flip by 2022 due to stability mechanism
We will use the extremes – Alba base and Alba flip to look at supply/demand scenarios
Gas outlook

ALBA SOLUZIONI
Long Term ToP from Algeria, Libya, TAP, LNG including outages and ToP adjustments
Annualised ToP plus northern supply capacity and demand in (bcm) - existing and committed infrastructure ToP assumed at 90% of
Libyan and TAP capacity, 6.4 bcm at ALNG/Rovigo
Algeria ToP forecast based on current supply
TAG and Transitgas included at 100% of annual supply capacity
There is still ample margin without Algerian renewal in low demand scenario Contract issues:
2019 Ukraine and Tunisian transit expiry
-
10
20
30
40
50
60
70
80
90
100 Transitgas
TAG
Back up LNG
TAP
Rovigo
Transmed
Panigaglia
Greenstream
Gorizia
Production
Alba low power/highrenewables
Alba flip
Gas outlook
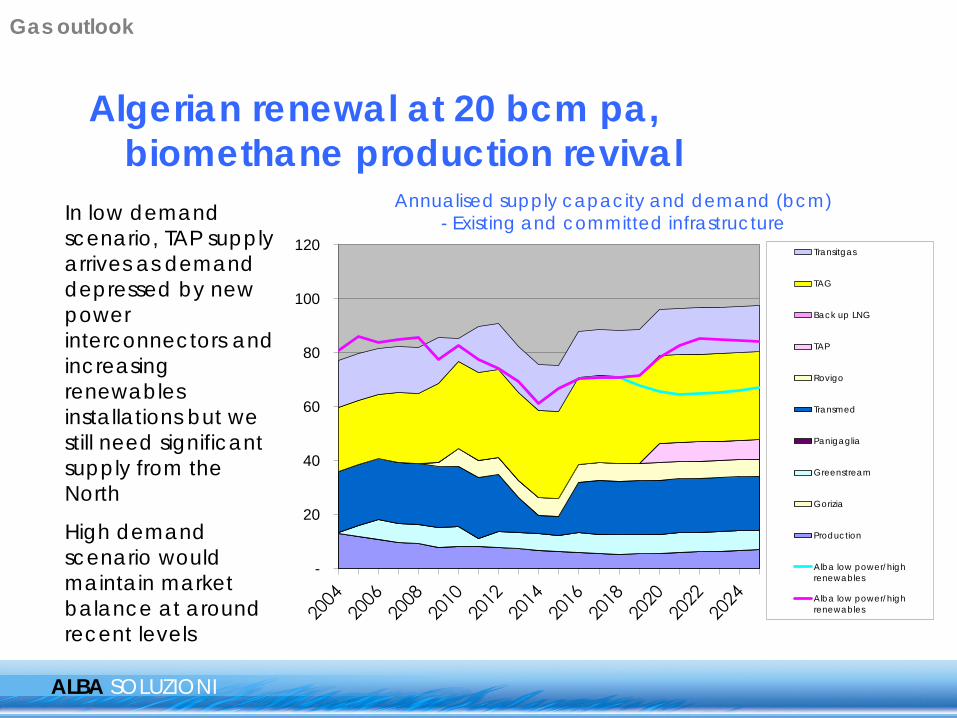
Algerian renewal at 20 bcm pa, biomethane production revival
ALBA SOLUZIONI
Annualised supply capacity and demand (bcm) - Existing and committed infrastructure In low demand
scenario, TAP supply arrives as demand depressed by new power interconnectors and increasing renewables installations but we still need significant supply from the North
High demand scenario would maintain market balance at around recent levels
-
20
40
60
80
100
120 Transitgas
TAG
Back up LNG
TAP
Rovigo
Transmed
Panigaglia
Greenstream
Gorizia
Production
Alba low power/highrenewables
Alba low power/highrenewables
Gas outlook
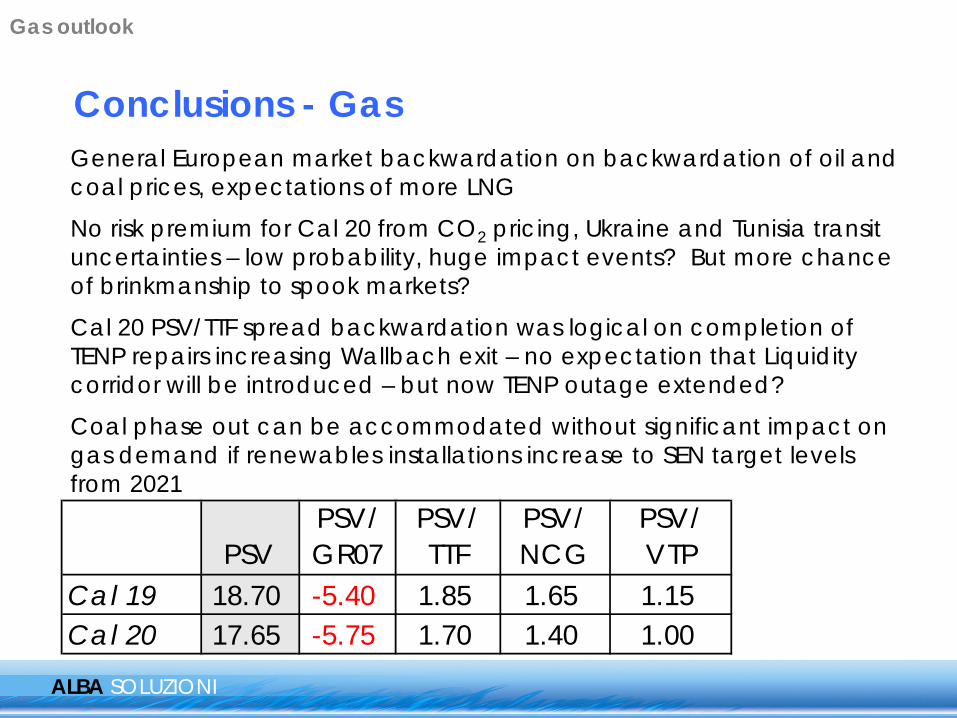
Conclusions - Gas
ALBA SOLUZIONI
General European market backwardation on backwardation of oil and coal prices, expectations of more LNG
No risk premium for Cal 20 from CO2 pricing, Ukraine and Tunisia transit uncertainties – low probability, huge impact events? But more chance of brinkmanship to spook markets?
Cal 20 PSV/TTF spread backwardation was logical on completion of TENP repairs increasing Wallbach exit – no expectation that Liquidity corridor will be introduced – but now TENP outage extended?
Coal phase out can be accommodated without significant impact on gas demand if renewables installations increase to SEN target levels from 2021
Gas outlook
PSVPSV/ GR07
PSV/ TTF
PSV/ NCG
PSV/ VTP
Cal 19 18.70 -5.40 1.85 1.65 1.15Cal 20 17.65 -5.75 1.70 1.40 1.00


