ReportNo. 15698-ALB Albania GrowingOut of Poverty May 30, 1997 Human Resources Operations Division Country Department II Europe and Central Asia Region Document of the World Bank I. I I 1. II I I .1 I l I II , I 'I I1' ro 1, 1 11 II I I I|1,, , . ,I,,,I I I .I , ,, I 1 , I IJ ' I Public Disclosure Authorized Public Disclosure Authorized Public Disclosure Authorized Public Disclosure Authorized Public Disclosure Authorized Public Disclosure Authorized Public Disclosure Authorized Public Disclosure Authorized
Transcript
Report No. 15698-ALB
AlbaniaGrowing Out of PovertyMay 30, 1997
Human Resources Operations DivisionCountry Department IIEurope and Central Asia Region
ADF Albanian Development FundCMEA Council For Mutual Economic AssistanceGDP Gross Domestic ProductIMR Infant Mortality RateMOLSP Ministry of Labor and Social PolicyPIP Public Investment ProgramINSTAT Albanian Institute for Statistics
AcknowledgementsThis report was managed and written by Christine Allison (Senior Economist). The team that prepared thematerials for the report included Robert Christiansen, Yvonne Ying and Sasoun Tsirounian (rural poverty),Janis Bernstein, Helen Garcia and Bulent Ozbilgin (urban poverty), Helena Tang (macroeconomicbackground), Melitta Jakab (demographics and health), Helen Shariari (gender issues), and HaroldAlderman (food security and social assistance). Background studies were prepared by Rachel Wheeler(land issues), Ahmet Mancellari (labor market), Nora Dudwick (qualitative survey), Dennis Herschbach(historical overview) and UNICEF (education). Peter Szivos provided techncial assistance to INSTAT. Anumber of people provided invaluable assistance in Albania: Peter Schumanin and Sokol Kondi (UNDP),Gianfranco Rotigliano and Bertrand Bainvel (UNICEF). Mimoza and Nesti Dhamo (urban surveys) and thestaff of the resident mission. The Netherlands Trust Fund lor Poverty Assessments provided funding for thesocial assessment and the gender study. Peer Reviewers arc Christiaan Grootaert, Jack van Holst Pellekaanand Lawrence Salmen. Luca Barbone is the responsible Lead Economist. The work was undertaken underthe divisional responsibility of Ralph Harbison, and the departmental responsibility initially of KemalDervis and later of Jean-Michel Severino.
Vice President: Johanies Linn, ECAVPDirector: Hans J. Apitz, Acting Director, EC2DR
INTRODUCTION .......................................................................... iii
EXECUTIVE SUMMARY .......................................................................... iv
CHAPTER 1: POPULATION, LABOR, MACROECONOMIC AND SOCIALDIMENSIONS ....................................... 1...................................
Introduction .......................................................................... 1Population Pressure and Movement .......................................................................... 3Labor Market Developments -- The Emergence of Unemployment and Private Employment ..... 5The Emergence of Private Sector Led Growth ............................................................. 9The Challenges to Public Finance .......................................................................... 11Maintaining Essential Services and Transfers for the Poor ............................................. 15
CHAPTER 2: POVERTY IN ALBANIA: THE RURAL AREAS ........................................... 23An Overview of Agriculture and Rural Poverty ......................................................... 23The Importance of Land .......................................................................... 24Profile of Rural Households in 1994 ....................................................................... 27
Size and Fragmentationof Holdings .............................................................. 27Levels and Composition of Gross Farm Income ............................................... 30The Incidence of Poverty on the Basis of Gross Agricultural Income ...................... 31
A Household Typology Based on Land and Livestock Holdings ...................................... 32Non-Farm Sources of Income .......................................................................... 34
CHAPTER 3: POVERTY IN ALBANIA: THE URBAN AREAS ........................................... 37An Overview of Urban Poverty .......................................................................... 38Urban Poverty in 1996 .......................................................................... 39
Poverty Incidence and Poverty Gap ............................................................... 39Poverty and Household Characteristics: the Poverty Profile ................................ 41Poverty and Household Conditions .............................................................. 46Priority Household Problems and Coping Mechanisms ....................................... 49
CHAPTER 4: PROSPECTS AND POLICIES FOR POVERTY REDUCTION ........................... 51Promoting Economic Opportunities for the Poor ......................................... .................. 52
Rural Development .................................. 53Urban Development .................................. 54Public Expenditure and Investment .................................. 55Mobility and Migration .................................. 57
Reaching Out to the Poor .................................. 57Social Assistance -- Ndhime Ekonomike .................................. 58Helping the Unemployed .................................. 59Pensions .................................. 59
ANNEX 1: The Urban Surveys ......................... 62ANNEX 2: Tables for Chapter 2 ......................... 65ANNEX 3: Tables for Chapter 3 ......................... 72ANNEX 4: Developments in Health ......................... 79
TABLES
1.1 Population, Labor Force and Employment. 1980-19951.2 Distribution of Employment by Major Sectors, 1980-19941.3 Trends in Average Public Sector Wages and Prices, 1990-961.4 Labor Force, Employment and Unemployment, 1989-19951.5 Trends in GDP, 1990-951.6 Public Expenditure as a Share of GDP1.7 Education and Health Expenditures as a Share of GDP1.8 Gross Enrollment Ratios1.9 Regional Differentials in Morbidity, Mortality, and Facility Utilization1.10 Trends in Social Assistance1.11 Regional Dimensions of Social Assistance, 1994
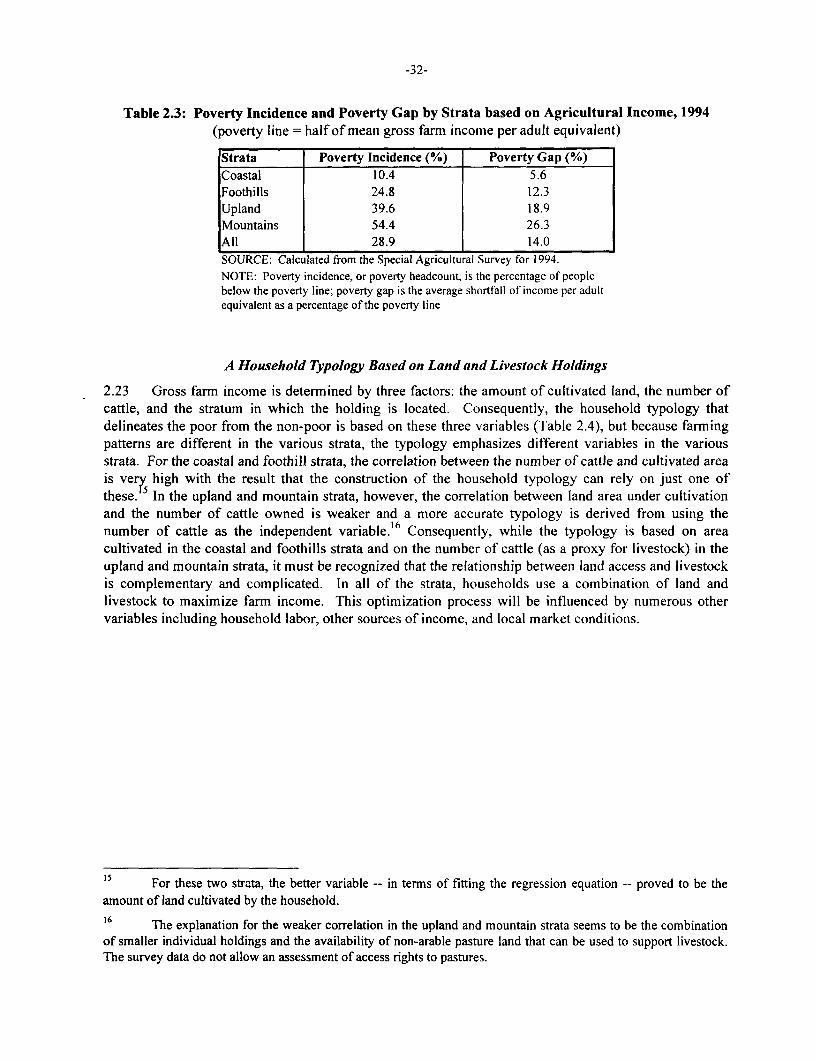
2.1 Profile of Agricultural Holdings, 19942.2 Gross Farm Income by Deciles, 19942.3 Poverty Incidence and Poverty Gap by Strata Based on Agricultural Income, 19942.4 Household Typology2.5 Main Sources of Household Income in Selected Districts, 1995
3.1 Poverty Incidence and Poverty Gap for Tirana and Three Other Towns, 19963.2 Poverty Incidence, Poverty Gap and Household Characteristics, 19963.3 Poverty Incidence, Household Expenditure and Education and Household Head, 19963.4 Asset Ownership by Poverty Status and Remittances from Abroad3.5 Household Services for the Poor and Non-poor
BOXES
1.1 A Brief Historical Overview1.2 Internal Migration1.3 Labor Market Developments before 19901.3 Food Security in Albania1.4 Prevalence of Low Anthropometric Measurement in Northern Albania1.5 Health Care and the Urban Poor
2.1 Village Living Conditions2.2 Data Sources and Methodology2.3 Land Use Patterns2.4 Remittances in the Rural Economy
3.1 Data Sources and the Urban Sites3.2 Recent Migrants to Tirana3.3 Borrowing to Supplement Income
FIGURES
3.1 Income Sources of Poor and Non-poor Households3.2 Monthly Household Expenditures Share3.3 Priority Problems in Elbasan, Fier and Lezha
FOREWORD
This report was prepared by a World Bank team working in collaboration with theAlbanian Government during the first half of 1996. At the request of the Government,formal discussions of the findings and recommendation of the report were delayed untilafter the municipal elections of the fall of 1996. Discussions were scheduled, andpartially held, in January 1997, when the report, in addition to the Government, wasdistributed to a number of NGOs and other members of civil society. Unfortunately,discussions with the Government could not take place satisfactorily, as the onset of thecrisis provoked by the collapse of the pyramid schemes pre-empted the attention of thepolicy-makers.
As well known, the Albanian crisis has degenerated beyond most observers' expectations,and the present is fraught with uncertainty. Many of the conclusions in this report arelikely to have been made obsolete by the severity of the civil strife and the collapse ofinstitutions witnessed over the past few months. The effects of the massive loss of wealthresulting from the collapse of the pyramid schemes must be substantial for large parts ofthe population; the destruction of productive and social assets, as well as the loss of jobsand the deep recession now evident in Albania must have increased in significant waysthe number of those at risk for poverty, malnutrition and displacement. As conditionspermit, an assessment of poverty trends, determinants and anti-poverty policies will haveto be repeated with highest priority. Nevertheless, at a time when Albanian society andthe international community are seeking to build a recovery strategy to overcome thistragic moment in Albanian history, some of the data and analysis in this report may be ofgreat value. It is with these developments and prospects in mind that this report is beingmade available for wider circulation, virtually unedited from the July 1996 working draft.
May 28, 1997
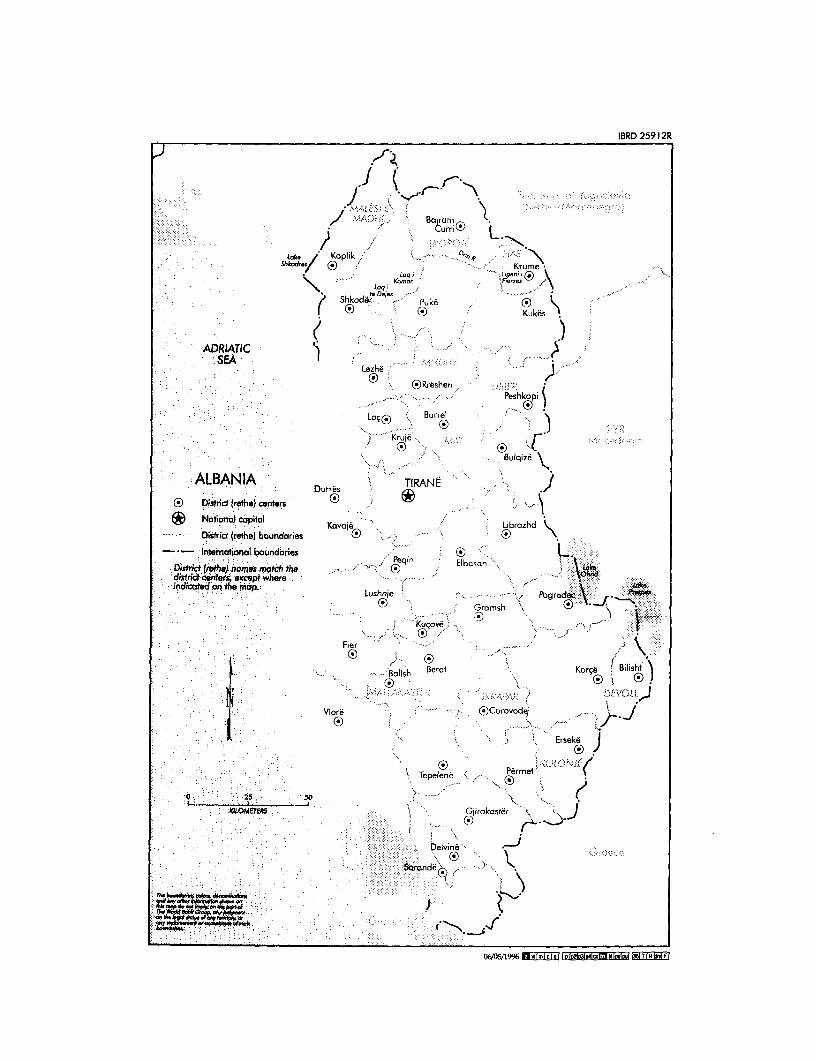
IBRD 25912R
J~~ >4
Lk. / Koplik ,. -q'Shkodrsf Krume\ 0no K,rume
ShkodarDee Puke
0- 53 i,3Kukes1 .
SEALezh6
( (3RreshenPeshkopi !
LoJ 0>i? Burrel
;f Krue , ,: .s ' .... ,
0 . Bulqize
ALBANIA TlRANE .Durres Tm N
D ?istrid (reths) centers
* NotioJnoci copiloI Kovaj , Librozhd
s,trid (rethel boundaries
-*- Ierenmational boundaries Peqin
District (tothe) names mnatch the Elbosandistrict centefsx exept where-indicated on the map. . f * ogrodec
FiLr hv = ' ' Grnsh G r msh
--Balish Berai Kor;
Vlorb- (®)Corovode,
ErsekeJ
Tepelene ermet '
0 25 50
aLomEs ,i Glrokaster
Delvine
Sorandecb ( ' -.
06/05t1996 1 .(pZDl34 1 IdX 1 TR | lfU
iii
INTRODUCTION
This is the first Poverty Assessment to be prepared since Albania became a member of the WorldBank Group in 1992. During the past four years, Albania has been a major recipient of IDA funds.Because of its low per capita income, around $670 in 1995, and the development problems it continues toface, Albania can expect to continue to draw upon IDA resources in the future. Understanding the impactof recent economic liberalization, stabilization and structural change on the welfare of the population aswell as examining the prospects for further income growth over the next five to ten years are of particularimportance as the next round of IDA-funded projects are being designed.
This report is necessarily broad in scope as it attempts to document a wide range ofmacroeconomic, structural and sectoral developments, all central to understanding poverty. Ideally, thisbreadth should be complemented by a robust analysis of the magnitude and characteristics of thepopulation differentiated by their income status and other essential welfare characteristics. This wouldenable one to better understand the impact of the development path on different groups of the population.Albania has yet to mount a nationwide household survey that details household income and/orexpenditure and other important variables. Such a survey was undertaken in 1993 and 1994, but itscoverage was limited to Tirana. In the absence of a nationwide household survey, the compilation of a"poverty profile", typically the core of a Poverty Assessment, had to be addressed in a different way inthis report. A wide number of data and information sources, qualitative as well as quantitative, somegenerated specially for the purpose of this report, are drawn on. Inter alia, a Social Assessment and aGender Assessment were carried out as integral parts of the background work, and they are drawn onthroughout the report. In this way, the report is rich in depth in certain areas, but lacks a quantitativerigor that is usually present in World Bank Poverty Assessments: only very broad-brush estimates ofpoverty and general characterizations of the poor compared to the non-poor can be made. The povertyanalysis is also constrained by the absence of a nationally recognized income or welfare threshold, andan exchange rate estimate in purchasing power parity terms. For all these reasons, the quantitativeestimates carried in this report should be interpreted as "orders of magnitude."
The report is organized in the following way. The Executive Summary provides the reader with aquick overview of recent developments in Albania, the present day situation with household incomes andwelfare, and the policy agenda that is recommended to bring about substantial improvement in theeconomic well-being of Albanians. This is followed by Chapter One, which covers four broad topics:population growth and migration; labor market developments; macroeconomic trends; and publicexpenditure, with a particular emphasis on public services ( health and education) and social transfers(the social safety net). Chapter Two examines poverty as it appears in the rural areas, and Chapter Threeas it appears in the towns and cities. The report's concluding Chapter Four draws together the findings ofthe previous chapters and sets out a policy agenda for Albania to "grow out of poverty."
-iv-
EXECUTIVE SUMMARY
i. The first four years of democratic governmenit have taken Albania decisively out ofthe realms of central planning and placed the economy well on the way to being open andcompetitive, and largely subject to market forces. Three successive years of high economicgrowth attest to the major progress made in stabilization and structural adjustment, especially theprivatization of much of the country's productive resources. Yet because the output loss was sogreat at the beginning of the transition, recorded 1995 GDP represented only 80 percent of the1989 level.
ii. Economic progress since 1992 has eased most of the population out of the extremedepths of poverty and near-starvation that prevailed in the 1990-91 period. Privatization of farmland has given the large rural population -- at a minimutn -- a safety net, and in many cases abasis for more significant income growth. In the urban areas, private business opportunities, self-employment and remittances from emigrants have giv'en the population a critical boost, andhelped counterbalance public enterprise job losses. Both rural and urban populations alike havebenefited from the formal social safety net, comprising pensions, unemployment benefit andsocial assistance, but both have had to cope with very poor infrastructure and declining publicand social services. All told, decades of economic mismanagement, rapid population growth, alow per capita arable land area and mass loss of unviable jobs have all contributed to makeAlbania a very poor country with a large number of very poor people.
iii. Because of the pervasiveness of low incomes and continuing population growth,sustained economic growth is the key to poverty reduction. Albania's prospects for continuedgrowth are good, and a number of key steps to pave the way for sustained growth over themedium and long-run have already been taken. But there is still a lot to be done, especially in theareas of fiscal consolidation and public expenditure (and investment), financial sector refonn,and developing an adequate commercial legislative and regulatory framework to promote furtherprivate sector growth. But even a highly successful broad-based growth path will fail to raisedirectly the standard of living of all the people: the elderly, the sick, and the long-termunemployed are groups that may need special help. Targeted poverty-reducing policies andprograms should complement broader pro-growth policies to ensure that all Albanians enjoy animprovement in their economic well-being.
What is known about Poverty in Albania
iv. The absence of nationwide, comprehensive household data render poverty analysisdifficult, and estimates that can be made from partial data sets must be interpreted with thegreatest of caution. One of the key recommendations of this report is that Albania establish anationwide survey of household incomes and expenditures to help better quantify the extent ofpoverty, characterize the poor, understand the importance of new sources of income, and aidpublic policy and program design. The best estimates that can be derived from availableinformation suggest that around 30 percent of the rural population (approaching 600,000 peopleout of a total of 1.9 million), and around 15 percent of the urban population (185,000 people outof an urban total of 1.3 million) are in poverty relative to the rest of the country's rural and urbanpopulations. Grossing up for the entire country indicates that around one quarter of thepopulation is in relative poverty. Although the orders of magnitude cannot be precise, allevidence suggests that poverty is more pervasive among the rural population than the urbanpopulation, but, generally speaking, poverty in the rural areas is less severe than in the towns.There are, however, some important variations: poverty is severe in the mountainous areas, andmuch less severe in Tirana. Beyond those in poverty, inany other people are vulnerable to
poverty. Their incomes are not far above the poverty threshold, and they are also facing poorpublic services and deteriorating social services.
Rural Poverty
v. The main determinants of rural poverty are small farm size and livestock holding,and little off-farm income from wage employment and remittances. An estimated one quarter ofthe rural population lives on a farm that is too small to sustain those families to a very modestlevel of subsistence from farming alone. The vast majority of these families live in the uplandareas and the mountains, and have farms of less than half a hectare. The poorest decile of peoplelive on an agricultural income of less than the equivalent of US$70 per annum, and are unable tomeet even their staple food requirements year round. They are dependent on the provision ofsubsidized wheat/flour through the winter months, and on cash transfers (pensions and socialassistance). Poor families are also found in the foothills and the coastal plains, but their numbersare fewer. Beyond these very poor families are others whose land holding is of an insufficientsize (less than one hectare) to produce a significant marketable surplus, thus restricting their cashincomes.
vi. Non-farm income is critical for many farming households, representing around onequarter to one fifth of total rural income. Although impossible to quantify (because of absence ofdata), it is estimated that somewhere between 70 and 90 percent of rural households aredependent on a source of income other than farming, in the main social cash transfers. The mostwidespread transfers are pensions and social assistance, but the value of these are small. In termsof magnitude of non-farm income rendered to recipient families the most important isremittances, followed by wage employment, and non-farming business income. In all likelihoodit is non-farm sources of income, especially remittances, that differentiate the upper rural incomehouseholds from other households more than farm income. However, under certain assumptionsabout land consolidation and access to markets, farm incomes could grow significantly inimportance in the future.
Urban Poverty
vii. Regardless of the poverty line used, urban poverty has some distinct characteristics:
* poorest of all, both in terms of incidence and severity are households with anunemployed head. These unemployed heads are typically male, in their early 40s,and with little or no formal education.
* next come three-generational households headed by a pensioner, often a womanwho has survived her husband. While pensioners themselves are not among thepoorest, the presence of unemployed grown-up children and dependentgrandchildren in their households makes them poor.
* households headed by a low wage earning man constitute the third largest groupin poverty. These household heads are around 50 years of age, have little or noeducation and are employed or self-employed in a low-paying job.
* poverty is more prevalent among children and young adults than among prime-aged people. Families with 3 and more children are especially vulnerable to poverty.
* households that have no regular source of market income and rely on social cashtransfers are typically very poor. The social assistance program, NdhimeEkonomike, is playing a key role as the social safety net, but the program appears tosuffer from inclusion and exclusion errors, and payment levels are very low.
-vi-
* Private transfers, especially remittances from abroad, are a critical source ofincome and investment for urban households. Households benefiting fromremittances are more likely to be non-poor, if not affluent.
viii. While home and land ownership do rise with income, access to urban services do notdiffer significantly for the poor compared to the non-poor. (Neither do they differ significantlyfor new urban settlements compared to established settlements.) The bulk of the urbanpopulation receive largely inadequate urban services and are exposed to unhealthy environmentalconditions. This reflects decades of under-investment, and poor revenue circumstances. In thisway, the poor and the non-poor are treated equally badly. The poor differ from the non-poor inone important way: they are less able to pay for urban services and, in the case of health servicesfor example, do not seek medical treatment because of the expense. Yet, despite the deficiencyof urban services, these are not cited by either the poor or the non-poor as priority problems.People have been living with these problems for decades and have learned to cope. On the otherhand, economic insecurity is a new phenomenon.
Regional Poverty
ix. All indicators suggest a regional dimension to poverty, which to some extent cutsacross the rural-urban distinction. (For example, coastal areas have a poverty incidence that islower than most towns.) Poverty is most pervasive in the north/northeast, which is predominatelyrural and mountainous. Here, close to half of the population are in poverty, reflecting smallaverage land holdings (less than 0.5 hectare), low farm incomes (especially cash incomes frommarketed produce), and very limited opportunities for off-farm employment. The fertility rateand infant mortality rate are also higher than elsewhere, and there is evidence of malnutrition ininfants and young children. Even the towns of the north, e.g. Lezha, have a higher povertyincidence than other towns. Outside the north/northeast there are substantial pockets of povertyin both rural and urban locations. Very poor people can be found in the mountains aroundPogradec and in the district of Gramsh. With regard to the towns, those with the highest rates ofunemployment, e.g. Elbasan, are particularly vulnerable to poverty, as are those whose ruralhinterland is producing very little.
Promoting Economic Opportunities for the Poor
x. Sustained economic growth is the key to poverty alleviation in Albania, and theoptimal growth path is one that promotes broadly based rural development, and urbanemployment and self-employment. There are four basic elements to the "growing out of poverty"strategy:
* rural development: maximizing the growth potential of the agricultural sector,and promoting up-stream and down-stream linkages with agriculture to develop off-farm rural employment;
* urban development: facilitating self-employment and private small- andmedium-enterprise development in the urban areas;
* public expenditure: ensuring efficient public expenditure/public investment tounderpin private sector growth in both rural and urban areas, and creating a healthyand well-educated, flexible labor force; and
* mobility and migration: facilitating the mobility of the population to movefrom areas of low economic potential to areas of higher economic potential.
-VIi-
Rural Development
xi. Agricultural growth will continue to be the driving force behind rural development,but because of the land constraint, progress with poverty reduction will depend increasingly onaccess to alternative employment and business opportunities either in-country or abroad. Inorder to promote rural sector growth, a number of developments need to occur, starting withland. Since even the smallest farms are divided into three or more parcels, often some distanceapart, at a minimum, consolidation of parcels needs to take place to facilitate more efficient useof land and time, and for farmers to have greater security over crops and livestock. Beyond this,consolidation of very small plots into larger plots is a likely development once the land marketbegins to operate. To facilitate this, greater administrative effort is needed to finalize the titlingof land in order for land sales to occur.
xii. Public policy should also be aimed at providing adequate conditions for high levelsof private investment in support services in the areas with the greatest growth potential for thedomestic market and for export, i.e. the coastal plain. To this effect, a number of measures couldbe considered. First, credit, vital for production and investment, is severely constrained by theinsufficiently developed financial system. The rehabilitation of the Rural Commercial Bank andthe development of other avenues for rural credit beyond those provided under the ADF, shouldbe a first priority. Bureaucratic and regulatory impediments to the growth of employmentintensive businesses should be removed. The public investment program should give appropriateweight to the requirements of rural and agricultural infrastructure, especially those elements thatare likely to foster private investment in agriculture. These themes will be taken up in theagriculture sector strategy part of the forthcoming CEM (Country Economic Memorandum).
xiii. In the more immediate future, widespread ownership of small plots, critical to short-term political and social stability, household food security and equity goals, can probably beconsistent with continuing growth in the agricultural sector, continuing the trend of the past twoto three years. At some future date, however, because of their very small hectarage, many farmswill reach the outer bounds of their growth potential, and subsequent growth in the sector islikely to be concentrated among the larger (> 1.5 hectares) holdings in the coastal area andplains, where advanced technologies and cropping patterns can be introduced. Only a part of thepopulation (i.e., the 35 percent that currently occupies these holdings) will benefit directly fromthis phase of growth. Yet international experience demonstrates the positive impact of a dynamicagricultural sector on the rest of the rural economy: growth in demand for farm labor, up-streamand down-stream farm-related services, and for products of the rural non-farm sector is all to thebenefit of the rural population at large. In particular, poor farmers with very small plots of landwill have the opportunity to supplement their farm income with income from other ruralactivities.
Urban Development
xiv. Albania is currently the least urbanized country in Europe with only 40 percent ofthe population living in cities and towns. Rural-urban migration has already swelled the ranks ofthe urban population and this trend can only gather momentum as the rural sector sheds people.A major concern for those who have migrated to the cities is the absence of secure land tenure.To address these problems, the government should consider the following: (a) adopt a relativelylow-cost and rapid means for clarifying land ownership and registering properties; and (b)provide temporary registration that ensures that migrant households have access to schools andhealth facilities, and can obtain business licenses.
-viii-
xv. Because of huge job losses over the past five years and emerging highunemployment rates, employment growth, including self-employment and small businessopportunities is the essential precondition to a reduction in urban poverty. Promoting self-employment and private small- and medium-enterprise development in the urban areas would bewell-served by ensuring that the necessary legal, regulatory and institutional framework isconducive to small business growth (to be further discussed in the forthcoming CEM), byexpanding the scope of small business advice (especially quality assurance and marketing), andproviding small-scale urban credit and other financial sector services. The latter wouldcomplement remittance income which for the past several years has had a significant impact onthe rise of small business activity in the urban areas. The recently approved IDA credit in supportof ADF micro-enterprise activities in urban areas represents an important start in this respect, butlike the rural program, a credit scheme catering for the somewhat larger enterprises is alsoneeded.
xvi. Urban environmental problems are threatening Albania's cities, and as the urbanpopulation grows, the negative health and environmental effects normally associated with poorsanitation and waste management will undoubtedly get worse unless the necessary urban servicesare upgraded. While major investments in water supply and sanitation are under consideration inElbasan, Fier, and Lezha, attention also should focus on additional urban services such as solidwaste management and drainage. In designing these improvements in infrastructure andservices, efforts should focus on standards of service and cost recovery that are appropriate toAlbania's income level, together with funded provisions to provide life-line access to electricity,water and sanitation for the poorer urban households. Although the infrastructure and urbanservice requirements of the emerging peri-urban areas are easily apparent, the needs of the moreestablished inner-cities should not be disregarded.
Public Expenditure and Investment
xvii. The demands on the public budget for infrastructure, public utilities, social services,transfer payments and the civil service will continue to be vast, yet the revenue base of thecountry is unlikely to provide the resources for all these competing demands. Some growth inrevenues as a share of GDP is foreseen over the next 2-3 years, primarily resulting from therecently introduced VAT system, and donor support is likely to continue, but these will onlysatisfy some of the country's needs. The Albanian Government, therefore, will need to keeppublic expenditures broadly in line with revenues (running a modest fiscal deficit), it will have tobe necessarily selective in the areas it finances, including the use of donor financing, and stressexpenditure efficiency to maximize the benefit of public investment. Policies that encourageprivate investment, both domestically financed and foreign financed, can play an importantcomplementary role.
xviii. There will remain, of course, a number of functions and areas of responsibility thatare legitimately and appropriately the role of the state. From the perspective of povertyalleviation, there are a number of areas that call out for public expenditure (investment). Themost important ones are the following: education and training, urban infrastructure and services(water, sanitation, and solid waste, along the lines discussed above), roads and agriculturalsupport services in the high potential agricultural areas, health, and small business services andcredit programs. The 1996-98 public investment program (PIP) may have to be revisited toensure that these priorities, especially education, are accorded an appropriate weight.
xix. In the post- 1990 period there has been some deterioration in the education and healthstatus of the Albanian population, which hitherto was unusually good for the country's income
-ix-
level. School enrollment rates have fallen, and infant mortality and adult morbidity due toinfectious diseases have increased. Data on the incidence of these deteriorations is not available,but in all likelihood low income families in both rmral and urban areas are sufferingdisproportionately. Although in large part a reflection of the general economic environment,some of the deterioration can be traced to declining coverage and quality of social services. This,in turn, can be related to falling public expenditure on health and education. These negativetrends need urgent attention, with measures taken to ensure their reversal, especially as theyimpact on low income families. Inter alia, protection of public expenditure on health andeducation is central to this reversal.
xx. Pensions, unemployment benefit and social assistance all remain central to povertyprevention and alleviation, but caution needs to be exercised to ensure that the appropriateincentive systems remain in tact, that a dependency on the state does not develop, and thatemployment is not over-taxed to fund these transfers. (Private transfers, extended family supportsystems, and self-help are very much in evidence in present-day Albania and should beencouraged and not undermined by state-funded support systems.)
Mobility and Migration
xxi. Large numbers of Albanians are already leaving the land and migrating to town,responding to both the constraints of the rural areas and the attraction of the towns.Notwithstanding the pressure that migration is putting on urban infrastructure and services,population movement from areas of low economic potential to areas of higher economicpotential leads to an increase in economic well-being, for the individuals concerned and thenation as a whole. Policies that support demographic mobility should be encouraged. Removingadministrative and legal barriers to farm land sales (discussed above), thereby giving would-bemigrants some capital, and easing the mechanism for securing land in urban locations for homeconstruction, would be well complemented by investments in education and training to providethe migrants, and their children, with the skills necessary to be effective in a rapidly modernizingurban environment.
xxii. Emigration to Italy and Greece in search of work opportunities has been a criticalpart of the betterment strategy for many Albanian families in the post-communist era.Remittances from Albanian migrants have been the main source of savings for financingdomestic investment, with much of the investment going into housing and small businessdevelopment. The prospects for emigration and remittances have important implications for thefuture, especially for poverty reduction. In this regard too, policies that increase the chance ofsuccessful emigration for work and encourage investimnent of remittances are to be supported,especially education and training. However, emigration is a sensitive issue for recipient countriesand for the EU as a whole, and the continued support for Albanian emigrants cannot beguaranteed. The forthcoming CEM will analyze the present situation in some details, andexamine prospects for further emigration from the perspective of receiving countries.
Reaching Out to the Poor
xxiii. The growth policies discussed in the preceding paragraphs should benefit the bulk ofthe Albanian population, who, over time, will enjoy risilg disposable incomes and improvedwelfare. However, there will be segments of the population -- the elderly, the sick and less able-bodied, those with little or no education, the long-term unemployed, and those in disadvantagedparts of the country -- who may not participate in the growth-generating activities, and findthemselves peripheral to the income and welfare gains. For these people, additional policies thattarget them and their particular circumstances are needed. The household data suggest that rural
-x..
poverty is more pervasive yet less severe (but with some notable regional variations) comparedto urban poverty which is less widespread but more severe. These observations have importantimplications for policy design.
xxiv. Focused poverty-reducing policies and programs should be targeted at fourpopulation groups, two rural and two urban:
* transitional rural poor: those whose land holding is of an insufficient size togenerate a sufficient income to sustain a family, who need some transitionalincome support (e.g., social assistance) until they are able to supplement theirincome from other activities. These people might need additional programs tolaunch them into other income-generating activities, such as credit provided bythe ADF, education and training;
* permanent rural poor: those rural people who will never be able to sustainthemselves from farming and other income-earning opportunities -- the elderly,the sick and those living in the poorest rural areas. These people will need long-term income support (social assistance, pensions and, possibly, feedingschemes);
- transitional urban poor: the urban unemployed, who need income maintenance(unemployment benefit followed by social assistance) until they are re-employed, or become self-employed. In order to regain employment/self-employment, certain active-labor market programs might play a role. In theevent of income insufficiency from low-wage employment, an incomesupplement (partial social assistance) may still be necessary, and the objectiveshould be for the family to be better-off in employment than entirely dependenton social assistance; and
* permanent urban poor: the urban elderly and sick who are unable toparticipate in the labor market, and who will need long-term income support(pensions and social assistance).
xxv. For all these four groups, income supplements (cash social transfers) and programsthat encourage re-employment need to be complemented by health, nutrition and educationservices that reach out to the poor, and their children, to enable them to participate in an activelife.
Social Assistance -- Ndhime Ekonomike
xxvi. Since its inception in 1993, this program has played a critical role in both the ruraland the urban areas. For small-scale farmers, especially in the north and north-east, and the long-term unemployed, it has been the difference between survival and starvation. At its peak, close to20 percent of families were receiving assistance, at a cost to the budget in excess of 2 percent ofGDP. In parts of rural Albania, benefit incidence is as high as 50 percent. There has been somedecline in the number of beneficiaries during the past two years, but the real value of the ndhimebudget has fallen more sharply. The effect of this is declining individual payments -- between1993 and 1995, the value of a full ndhime payment fell by 20 percent in real terms. For familiesdependent on social assistance this has presented major hardship.
xxvii. This report also reveals that some households above the poverty line are receivingsocial assistance, while some households under the poverty line are not receiving support. This isa particular problem in the urban areas where income can be "hidden" and eligibility is moredifficult to assess. Perfect targeting is rarely achieved with such programs, but improvements
-xi-
can generally be made. Measures adopted over the past year or so (abolition of the minimumpayment, part-retention of program savings by local authorities, an assessment of livingconditions, and the installation of an inspectorate) should reduce inclusion and exclusion errors,but by how much remains to be seen. A critical development will be the trend in payment levelsto the most needy families for whom an increase in the real value of assistance is desirable.However, given the overall fiscal situation, any increase in payments to the poorest should becounterbalanced by a decrease in payments elsewhere. In the longer run, household surveysshould permit closer monitoring of the recipients of ndhime as well as the closer identification ofhousehold characteristics associated with poverty, thus facilitating further fine-tuning of theprogram.
Helping the Unemployed
xxviii. Unemployment developed very rapidly in Albania as the economy collapsed, largenumbers of state-enterprise jobs were lost, and the introduction of unemployment benefitsprovided an important component of the social safety net. Nonetheless, unemployment --especially among household heads -- is the main determinant of urban poverty. At one yearentitlement duration and with average benefits being slightly higher than the minimum wage, thescheme could be considered quite generous. (Other transition economies have reducedentitlement periods to 6-9 months, and lowered the replacement rate.) In addition, it is thoughtthat a number of unemployment payment beneficiaries are working in the informal economy. Atthe same time, the phenomenon of long-term unemployment is developing (that is, people beingout of work for more than a year). This is a worrisome development as people begin to losetouch with the world-of-work and find it increasingly difficult to hold down a job as and whenone emerges. Experience from other countries shows the association of long-termunemployment, poverty and inter-generational deprivation. In the light of these observations,three recommendations are appropriate: (a) set payment levels such that they are below theminimum wage, thereby giving the right incentive to return to work, albeit a low-wage job; (b)concentrate more resources on active labor market programs (retraining, small business start-up,public works programs, etc.), and (c) target the long-term unemployed, using a combination ofactive labor market programs and income support schemes to promote re-employment with anincome gain. Since many of the long-term unemployed lack schooling, some basic educationprograms may be necessary before other labor market programs could become effective.
Pensions
xxix. Pension incomes are critical for many urban and rural residents. For urbanpensioners, the pension is of a sufficient amount to meet minimum subsistence needs, and theyare not found to be among the poorest. However, many households comprise three generationsand pensions are often one of the most important sources of income for a family of five or six.When spread around so many people, the pension is barely adequate, and these families areindeed among the poorest. But it is not the place of the pension to alleviate their poverty -- otherinterventions should be preferred.
xxx. For rural families, pensions are also an important source of income. Amonghouseholds with less than half a hectare of land, almost 40 percent rely on pensions as their mainsource of income. Given the low value of the agricultural pension, 900 lek/month, thesehouseholds can be thought of as extremely poor. The overall fiscal situation of the pension(social security) fund is such that it is not feasible to recommend any significant general increasein agriculture pensions. However, given the inequities in land holdings, which bear littlerelationship with any previous contribution to the economy, a case could be made for some
-xii-
incremental payments to elderly rural residents who have very little land. Whether the pension isthe appropriate mechanism, or whether social assistance or another instrument would be better,should be explored further.
CHAPTER ONE
POPULATION, LABOR, MACROECONOMIC AND SOCIAL DIMENSIONS
Introduction
1.1 Albania has made tremendous progress in the past three years, recording annual economicgrowth rates close to 10 percent, and lifting per capita income above US$650. This reflects majorprogress in stabilization and structural adjustment, especially the privatization of much of the country'sproductive resources (land and enterprises), and liberalization of prices, trade and foreign exchange. Yetbecause the output decline was so great at the beginning of the transition, 1995 GDP (real) representedonly around 80 percent of the 1989 level. Growth -- albeit starting from a low base -- has emanatedprimarily from the private sector, especially agriculture, construction and services. Underpinning growthin construction and services, are investments financed through private transfers from abroad, primarilyremittances from out-of-country workers (more than 10 percent of GDP). Production in the stateindustrial sector, which dominated GDP in the past, has declined to a mere shadow of its past, and led tohigh unemployment especially in towns hitherto dominated by a state enterprise. In part this is beingcounteracted by rapid growth in self-employment and small-scale manufacturing, but this is still of aninsufficient magnitude to fully compensate for the demise of state enterprises.
1.2 As a direct result of the near virtual output collapse and the subsequent restructuring ofproduction, Albania's tax base has been seriously eroded. 1995 revenues were around 25 percent of GDPcompared to 47 percent in 1990. Domestically financed public expenditure has been similarly lowered inorder to close the fiscal deficit. Major restructuring of expenditures (such as the elimination of subsidiesto enterprises) and substantial inflow of donor funds have protected the provision of important publicservices and transfer payments (such unemployment benefit and social assistance), but this effort needsto be multiplied in order to make an impact on decades of accumulated under-investment, poorinfrastructure and inadequate public and social services. Recent improvement in public savings augurswell for future public investment, which has already doubled as a share of GDP since 1992.
1.3 But Albania will need many years of high economic growth to raise the standard of living of thepeople to approximate that of neighboring countries. With around 3.2 million people, a doubling in 30years (since 1960), and a population growth rate still approaching 2 percent p.a., the resource base of thecountry is seriously challenged. At present, around 60 percent of the population is located in the ruralareas, with 65 percent of the labor force working in agriculture (on own small plots), albeit in some caseson a part-time basis. Such a high share of the population in the rural areas and largely dependent onagriculture is an artificial situation, reflecting the forced settlement pattems developed under thecommunist regime. Already rapid rural-urban migration is occurring. Since formal employmentopportunities are few in the towns, due to the loss of around half of all non-agricultural jobs in the years1990-95, most migrants as well as long-term urban residents are working as self-employed and/orstarting small businesses. The official estimate of urban unemployment is high, but many of thoseregistered as unemployed are likely working in the informal economy. flowever, long-termunemployment is emerging as a serious economic and social phenomenon, and labor force participationof women is falling as few working opportunities present themselves for women. In contrast, men,especially young men, have left the country is search of work. An estimated 15 percent of the labor force,or 25 percent of the male labor force, has been working abroad during the past 3-4 years. This has been acritical safety valve for the country.
1.4 These broad-brushed themes are explored in this chapter, with more in-depth analysis to befound in chapters 2 and 3. The sequence of topics in this chapter is: population growth, emigration andmigration; labor market developments; recent macroeconomic developments; and public expenditure.
-2-
Box 1.1: A Brief Historical OverviewDevelopments before 1990
Albania has been extremely poor for most of its history. The political and economic collapse of the early 1990s hasonly aggravated fundamental structural problems that existed for decades. Albania was among the poorest countriesin Europe before the communists took power, but the structural problems inherited at the end of World War 11 werecompounded by a repressive political regime and a mismanaged economy. By 1990, the roots of modem-daypoverty were already well planted, and impose a major challenge to post-communist governments. Malnutrition andfood shortages, a lack of basic consumer goods, and limited and poor housing had existed for decades. Decayinginfrastructure (roads, water and sewerage system), inadequate energy sources, and out-dated social services hadbeen a feature of life for years. Throughout history, racial, religious, linguistic and political differences among thepeople conspired against unity, stability and economic development, thus contributing to poverty. Also, oftenchanging allegiance from one foreign power to another had serious social and economic consequences.
Shortly following its declaration of independence in 1912, Albania was drawn into World War 1. Widespreaddestruction and famine followed. The country lacked the resources to modernize, and at that time turned first toBelgrade for help, then to Italy. Prior to World War 11, with assistance from Italy, Albania began to develop.Administrative buildings in Tirana, roads, ports, and factories were built and coastal land was drained. This broughtprosperity to at least a part of the population. However, in 1939, Mussolini annexed Albania, and Albania wasdrawn into WWII. At the end of the war, Albania -- war damaged and lacking food for the population -- turnedonce again to Belgrade for support. At this time, the large agricultural estates were divided and given to formertenant farmers, which resulted in a further decline in production and a worsening food crisis, culminating in thefamine of 1948. In exchange for more assistance, Albania eliminated all forms of capitalist production.
In 1948, Albania switched allegiance from Belgrade to Moscow. A highly centralized form of planning and controlwas imposed. The first five year plan (1951-55) stressed industrialization, and great sacrifices were asked of thepopulation toward this goal. Some 70 percent of the population continued to be engaged in farming, living close tobare subsistence. At the end of the 1950s, agriculture was collectivized into cooperatives and state farms, with allland being turned over to the state. This was resisted by the peasants, who slaughtered animals and destroyed cropsand farms rather than submit to the state. Despite purges to eliminate the offenders, peasant unrest continued till the1990s.
The break with Moscow occurred in 1961, and the switch to China as the key foreign partner brought largequantities of food aid in the period 1961-65. This prevented mass starvation. However, throughout the remainder ofthe Chinese period (until 1972) the agricultural sector was "milked" to provide support for the industrializationstrategy. However, few of the projects that were launched during this period -- including the large Elbasanmetallurgical complex -- were completed on time. After 1972, a shift in favor of agricultural development tookplace. and the government began to decentralize industry in the hope of evening out development and differencesbetween towns and rural areas. Cultural, education, health and welfare services were improved in rural areas.Restrictions on internal migration were further tightened.
Relations with China were finally severed in 1978, and thereafter the economic situation deteriorated further.Agricultural and industrial production fell, the importation of equipment and spare parts reduced, furthercollectivization of farms failed to prevent declining production, and provision of basic services deteriorated due tofailing supplies. Wage differentials were further compressed, and wages and incomes in general reduced, thoughpartly compensated by additional subsidies. Considerable attention was given to "self-reliance" especially in foodproduction, which amounted to doing "more with less." But not only was the capacity to produce waning, so wasthe will to work for so little. By the end of the period, rapid population growth combined with lagging farm andindustrial output led the Albanian people to immense hardship, food shortages, unsanitary conditions andovercrowded housing. In many respects Albania's poverty worsened during the 1945-1990 period, thereby makingthe task of the post-communist government all the more difficult.
-3-
Population Pressure and Movement
1.5 During the period 1960-1990, Albania's population doubled from 1.6 million to around 3.2million, an annual growth rate of 2.4 percent. This growth rate was 3-4 times higher than for neighboringEuropean countries during this time. Rapid population growth was an objective of the communistregime, expanding the workforce for military and economic development, and swelling the ranks of theyouth who would be fully indoctrinated in communist ideology.' As a result of this rapid growth, by1990 Albania had become the most densely populated Balkan country (with 114 inhabitants per squarekilometer). In the 1970s and 1980s, after the break with China, the Albanian Government tried toinfluence population growth in favor of rural areas, hoping thereby to increase farm and miningproduction and relieve pressure on the cities. A combination of incentives (education, health and welfarefacilities, and other development programs) and tight controls on migration were used to this end. Theimpact of this policy was to maintain a high share of the total population in the rural areas (64 percent in1990), a share considerably higher than any other Southern, Central or East European country.
1.6 As a predominately agrarian economy, the relationship between cultivable land and population isimportant. Albania has limited arable land, and the population grew fast under the communist regime.Consequently, Albania has one of the lowest per capita arable land areas of any European country. In thepost-1990 period, the pace of population growth has lessened (to around 1.8 percent p.a.) as familiesbegin to have both motivation and means to control fertility. Out-migration has also diminished the sizeof the population. Nonetheless, the size of the existing population and the momentum of past highfertility rates pose an enormous burden on the country's resource base, and on the economy to generatean income sufficient to sustain the population. Moreover, because of its youthful structure, it will besome time before the population growth rate coincides with that of neighboring countries, and growingnumber of school-aged children and new entrants to the labor force will challenge the Albanian economyfor years to come. (On the positive side, unlike other Central and West European countries, Albania willnot face an old-age dependency problem for many decades.) Population pressure, especially in the ruralareas, is resulting in two wide-scale phenomena: emigration in search of work and a better life; and rural-urban migration.
1.7 Emigration. Albania has been losing population since 1990 due to mass emigrating toneighboring countries (primarily Greece and Italy). In many cases the emigration is of a short duration,in search of work. In some cases it is permanent. Because of the nature of the emigration it is difficultto get beyond imprecise estimates of the numbers involved. Estimates derived from census data and voterregistration (van der Pol, 1992) put the 1992 figure at around 200,000 people. Data gathered byMancellari et al. (1995) from the Greek Ministry of Foreign Affairs put the numbers of total emigrantsmuch higher at around 350-400,000 in 1992 and 1993. Figures for 1994 from the Ministry of Labor andSocial Assistance show also a figure of around 350,000 people. (No estimates exist for 1995.) Alladministrative districts have lost people due to emigration, but the largest losses have been in the south(in the areas close to the Greek border) and the north-east.
1.8 Emigration is heavily concentrated among males in the age group 15 to 35, who constitute 75percent of the total. (In so far as emigration for work occurs among women, it is concentrated in the 20-35 age range.) Most conservative estimates of emigrants suggest that around 30 percent of males 15 to35 years of age are working abroad, and more than 35 percent of active employment for this age groupoccurs through foreign employment. Overall, around 15 percent of the labor force was working abroad inthe period 1992-1994.
1 By 1985, three-quarters of all Albanian citizens had been born and educated under the communist system.
-4-
1.9 Migration. Internal migration has been another important feature of the post-1990 period. Sincerestrictions on internal migration were lifted, there has been substantial movement of people from ruralto urban areas. In five years, at least 200,000 people -- 6 percent of the population -- have migrated fromthe countryside to the towns. As discussed above, the communist regime created an artificially high ruralpopulation, well-beyond the carrying capacity of the land. In addition to farm workers and miners,teachers, doctors and other categories of professions were assigned jobs wherever they were needed,often in remote villages, with minimal facilities.2 Only people with particular personal connections couldchoose an alternative posting. As a consequence, people are leaving the villages at will and heading forthe towns in search of a better life, and easier communication with the outside world. Like emigration, itis the districts of the south and the north-east that are losing population. People are moving primarily toTirana (which has doubled in size in five years), followed by Durres, Kruja, Elbasan, Pogradec andShkodra.
Box 1.2: Internal Migration
Who are the migrants? In the main, whole families are migrating, but often in stages. First a male adult (notnecessarily head of household), then the rest of the immediate family. In subsequent stages, other blood relativesmay also move. In some circumstances, married young adults, hitherto living with their parents in a small villagehouse, will leave the village for the town. It is likely that migrants are not the poorest families in the villages sincemigrating involves considerable costs: transport to town, and funds to "buy" land and construct a shelter. Migrantstypically fund their move by selling livestock, selling (and bringing) materials from their village house, remittances,and cashing-in compensation vouchers given to former political prisoners (worth around $2,400).
Why are people migrating? There are a number of "push" and "pull" factors causing people to migrate: to avoidthe hardship of life in the villages (especially onerous for women), and the isolation (which includes difficult accessto a health facility and schools), loss of jobs and houses (because of the return of land on which houses were built toformer owners), denial of, or dispute over agricultural land (blood feuds), or a very small plot of land insufficient tosupport a family, overcrowding and the desire of young adults to exit from the control of their parents, and thewidely help belief that life in the towns is more prosperous.
Settling in the City. The most difficult problem is finding land to settle. Many migrants "buy" land illegally, andthen proceed to construct a house, and (illegally) connect themselves to electricity and drinking water. However,since the land on which they settle lacks legal title, and they cannot register with the city council, they cannot getaccess to other facilities and services (e.g. health facilities and schools).
"Before 1991, Din and his family lived in a village in Tropoja district. Din worked as a veterinary assistance andhis wife as an accountant for the cooperative farm, but she lost her job with the dismantling of the cooperative. Theywere given 400 sq. meters of land, much less than the 2000 sq. meters entitled to them under the law (for a family offive), because of claims from former land owners. Worse still, their house was on the land of a former owner whoreclaimed that land. The owner refused to sell the land but told Din to take whatever he could salvage and leave.Din and his family left and how live in a one-room house in Shkodra on land they bought for $900."
2 The villages were extremely undeveloped. Only 5 percent of rural dwellings had piped water, many houseswere 30-40 minutes from the nearest drinking water source, electricity was weak and sporadic, few villages hadtelephones, and access to town was difficult, especially during the winter months.
-5-
Labor Market Developments -- The Emergence of Unemployment and Private Employment
1.10 Labor market developments are of immense importance to household and individual welfaresince wages are typically the most important source of household income. Work on other transitioncountries (e.g. Poland, Hungary, Romania and Bulgaria) has shown the relationship between long-termunemployment and poverty, as countries no longer guarantee full employment and wage dispersionbegins to develop. This section traces the developments in the labor market since 1990. Labor markettrends reflect the initial contraction of output and the restructuring of the economy, as discussedelsewhere in this chapter. Major developments are:
* the net loss of around 275,000 jobs (20 percent of the total) between 1990 and 1995.However, the land reform program, which created a large number of family farms, hasabsorbed an additional 65,000 persons. The non-agricultural economy in fact lost close to350,000 jobs -- almost half the pre-1990 number of non-agricultural jobs;
* the share of total employment in the agriculture sector is now 65 percent (compared to 22percent in 1990), that is 750,000 people; industry accounts for a mere 8 percent (compared to34 percent in 1990);
* many people classified as employed in agriculture are under-employed, either on a seasonalbasis or on a permanent basis. The labor surplus in the agricultural sector presents a majorchallenge to job creation. Already, significant rural-urban migration can be witnessed.Worker emigration has acted as a critical safety valve for the rural sector as well as thefacilitator of resources to migrate from village to town;
* the non-agricultural private sector, in part spontaneotis and in part created throughprivatization, has grown rapidly and now provides employment for about 140,000 people --10 percent of the labor force. Many of these people are self-employed. l,ittle is known aboutwages and earnings in this sector;
* employment in the public sector has declined. Major job losses in public enterprises havebeen accompanied by down-sizing in public administration, social services and defense.Until 1995, real wages in the public sector had fallen below their 1990 level. By the end of1995 they had more than recovered their 1990 real value, and the average public sector wagewas 6568 lek/month ($70);
* (net) job losses have been much more acute for women than men, and large numbers ofwomen have left the labor force, typically following a period of unemployment. There arealmost as many women of working age outside the labor force as there are employed;
* registered unemployment has fallen to 13 percent at the end of 1995. Less than a third of theregistered unemployed are entitled to unemployment benefit since their entitlement of oneyear has expired. Increasing numbers of unemployed are long-term unemployed, and aredependent on social assistance and casual employment;
* there is a considerable number of people working ii the informal economy, including thoseregistered as unemployed;
* emigration in search of work, mainly to Greece and Italy, has played a critical role in thedomestic economy, and moderated unemployment.
-6-
Box 1.3: Labor Market Developments before 1990
Fed by earlier increases in the birth rate, the population of working age increased until 1990, reaching 1.9 million in1990. During this period, a high proportion of the working age population was active in the labor force (more than80 percent of both men and women), and classified as "employed". (Until the late 1980s, the labor force wassynonymous with those in employment. That is to say, the notion of unemployment did not exist.) State enterprises,especially coal mines and steel plants, and agricultural cooperatives were heavily subsidized to promote fullemployment. Employment was heavily concentrated in two sectors of the economy: industry (34 percent) andagriculture (22 percent). Construction accounted for another 10 percent of employment. The service sector wasvery small. The mobility of labor was very low, unless it was forced by the state when a particular requirementarose. Wages were stable and barely differentiated between sectors and professions. Workers were rewarded forhigh productivity and good performance in other ways.
1.11 Labor force. The number of Albanians of working age who are active in the labor force (theparticipation rate) has declined quite substantially during the transition years. From a peak of 84 percentin 1989, the participation rate stood at around 73 percent in 1995. The bulk of the people who have leftthe labor force are women -- some 200,000, or one quarter of the 1990 labor force , are no longerworking, or actively seeking work.
1.12 Employment. Between 1990 and 1993, employment fell by almost 400,000. The employmentdecline was similar between men and women. Since 1993, employment has recovered somewhat, and1995 employment levels were close to 80 percent of 1990 levels. But employment recovery has beenmuch stronger for men than for women (1995 employment as a proportion of 1990 was 88 percent formen versus 72 percent for women). In 1995, only one in two women of working age held a job; fiveyears earlier, three-quarters of working age women were employed.
SOURCE: Statistical Yearbook of Albania, 1991; Institute of Statistics
1.13 The distribution of employment has shifted dramatically in the post-1990 period. (Table 1.2)Employment in agriculture (self-employed farmers, their wives and working age children on familyfarms) dominates the present-day picture, accounting for 65 percent of total jobs. By contrast, industryhas collapsed from its former dominance of the employment scene and now employs around 8 percent ofworkers. Employment in social services and public administration has also declined. In 1990 allemployment was classified as either "public sector" or "cooperative sector". In 1994, almost three-
-7-
quarters of employment was in the private sector. In agriculture, private sector employment leaped fromzero to 590,000 in 1993 with the privatization of cooperatives. Another 160,000 employees on formerstate farms were re-classified as private sector farmers in 1994 when they were given land. Today, some750,000 working-age adults occupy and work 466,000 farms -- an average of 1.6 working persons perfarm.
1.14 Non-agricultural private sector employment has also grown rapidly, from zero in 1990 to around140,000 in 1995. This is the combined effect of privatization of state enterprises (including retailbusinesses) and the development of new businesses. At the end of 1995 there were 56,000 registeredbusinesses, mostly concentrated in services, trade, transport, manufacturing (especially agroprocessing),construction and production of construction materials. The bulk of private businesses are small in size,and the majority (between 80 and 90 percent) are self-employment enterprises. The balance of in-country employment (265,000 workers, 23 percent of the total) is in the public sector. Of this, about onehalf is employed in public administration, the social services and other services, and the other half instate-owned enterprises (some non-operational), public utilities, and transport and communications.
Table 1.2: Distribution of Employment by Major Sectors, 1980-1994 (%)
SOURCE: Statistical Yearbook of Albania, 1991; Institute of StatisticsNOTE: *The main activities are thought to be services, construction, and small scale manufacturing.
1.15 Wages. Average wages in the public sector declined in real terms until 1995, with the biggestdecline occurring in 1993 (when they lost one third of their 1990 value). Two wage increases in 1995brought wage increases above price increases for the first time in five years, and at year end the averagemonthly wage was 6,568 lek (US$69). A further increase in public sector wages on April 1, 1996 (20percent) has put real wages in 1996 about 25 percent higher than their 1990 level (at the equivalent ofUS$83 per month). Little is known about private sector wages. It is generally thought that non-agricultural private sector wages exceed those of the public sector by a factor of 2-2.5. Private sectorwages are much more differentiated than public sector wages, reflecting scarcity of skills demanded bythe market economy, returns of education, and hours worked.
Table 1.3: Trends in Average Public Sector Wages and Prices, 1990-96
1.16 Unemployment. Unemployment developed very rapidly in Albania as the economy collapsed in1991 and 1992. It peaked in 1992 at 27 percent. Since then it has fallen to around 13 percent at the endof 1995 (Table 1.4).3 While the recent (1995 over 1994) decline appears to be a genuine trend, changes inprevious years registered unemployment figures are dominated by reclassifications. For example, during1993 and through till April 1994, unemployment fell by around 160,000 as former state farm workers,hitherto registered as unemployed, were allocated land and considered employed. Between April andJuly 1994, unemployment rose again (by 60,000) due to job losses associated with the first wave ofprivatization. Since mid-1994, there has been a steady fall in the number of registered unemployed. Thisreflects both the expiration of entitlement for unemployment benefit and in some cases withdrawal fromthe labor force, and some modest job growth. However, the share of long-term unemployed -- that is,people out of work for more than one year -- continues to be very substantial (more than 70 percent ofthe total), and numbers around 135,000. These people are both men and women of all ages, many(around 35 percent) are household heads, and predominantly city dwellers. From the perspective ofpoverty, these are likely to be a particularly vulnerable group.
Table 1.4: Labor Force, Employment and Unemployment, 1989-1995(by gender)
1989 1990 1991 1992 1993 1994 1995
Labor force (as % of working age pop.) 83.5 83.2 80.2 80.5 76.4 79.7 72.8female 84.6 81.6 75.6 75.4 67.3 68.7 59.8male 82.5 84.7 84.6 85.7 85.9 90.4 85.6
Employment (as % of working age 77.4 75.3 72.9 59.2 59.3 65.1 63.4
1.1 7 There is considerable variation in the unemployment rate in Albania's districts. Unemploymentis lowest in the southern half of the country, and highest in the central industrial districts (Elbasan,Kucove, Gramsh, Pogradec and Berat) and some of the northern districts (Lac, Shkoder and Tropoje). In
3 The absolute number of registered unemployed persons is similar for men and women. However, since thesize of the female labor force is smaller, the unemployment rate for women is higher than for men (14.7 versus 11.7percent in 1995). Trends in registered unemployment for men and women have followed similar patterns. However,outcomes at the end of registered unemployment appear quite different. Women are leaving the labor force in largenumbers: the inactivity rate for women of working age has increased from 18 percent in 1990 to 40 percent in1995. While this includes some young women opting for further education beyond the age of 15, it also includeslarge numbers of older women. Men, on the other hand, are finding work -- albeit in the informal sector or abroad --while some remain long-term unemployed.
-9-
absolute numbers, most unemployed are found in the cities (Tirana, Berat, Durres, Elbasan, Fier andShkoder). Less than 7,000 people are registered as unemployed in the rural sector.
1.18 By 1995, less than 30 percent of registered unemployed were drawing unemployment benefit.The main reason for this was expiration of the one-year entitlement period. For those drawing benefit,the average amount -- a flat rate -- during 1995 was 3417 lek/month (1920 lek basic benefit plusadditional amounts for dependents and energy price adjustment). This is slightly more than the minimumwage (3300 lek/month) and just over fifty percent of the average public sector wage.
The Emergence of Private Sector Led Growth
1.19 In the last three years Albania has been steadily recovering from the drastic output declineassociated with the transition. Following a 40 percent real reduction over the period 1990-92, GDP hasrebounded strongly since 1993, recording annual growth rates around 9 percent. Per capita GDP hasincreased from US$350 in 1993 to US$667 in 1995.4 The growth recovery has been virtually all fromprivate sector activities (especially agriculture, followed by construction, transportation, and services),and attests to the major progress made in structural reforms and stabilization. Much of the growth inconstruction and other services has been funded by external remittances, although recent data suggestthat private domestic savings are increasing, challenging remittances and concessional aid as the majorsources of investment financing. The fiscal deficit has been reduced to a more moderate figure, andtogether with tight monetary policies has led to a reduction in annual inflation to a single digit. But thefiscal deficit has been brought into balance by substantially lowering expenditures to match fallingrevenues, supplemented by substantial donor financing. While the drastic reduction of most subsidies is apositive development, expenditure reduction on key public services -- e.g. health and education -- posesserious concern for the future.
1.20 Privatization and liberalization. Albania can now boast an economy that is predominantlyunder private ownership and where state controls are minimal. Measures introduced since 1991 includeprivatization of agricultural land (former cooperatives and state farms) and virtually all small enterprises(with less than 300 workers), progress with privatization and liquidation of large state-ownedenterprises3 including public utilities (electricity and water) but leaving strategic enterprises (chromium,copper, oil and gas) in the public domain for the time being, the abolition of almost all price controls, theunification and floating of the exchange rate, and sweeping liberalization of the trade and paymentsregime.
1.21 The Sources of Growth. Albania has been steadily recovering from the economic collapse itsuffered at the beginning of the transition. However, the magnitude of the output reduction in the early1990s was so large that even with this sustained recovery in growth, real GDP in 1995 was only around80 percent of 1989 GDP (as best measured by not entirely consistent data). The important features of thisgrowth recovery are the following:
* almost all the growth has emanated from the private sector, which now accounts for morethan two-thirds of GDP.
* the main contributor to the recovery in growth has been the agricultural sector. After thehuge decline in agricultural output in 1990-91, output began to recover in 1992 with four
4 Using the Atlas methodology. This puts it on par with Egypt and Armenia. Macedonia at (US$820) andRomania (at UD$1,140) are the nearest Central and Southern European comparators.
5 A Mass Privatization Program was launched in 1995, in parallel with a voucher scheme. To-date, about 90enterprises have been auctioned.
-10-
consecutive years of double digit growth (18.5 percent growth in 1992 followed by 3consecutive years of growth at around 10 percent).6 As a result, agriculture as a share ofGDP rose from the pre-transition 37 percent in 1990 to nearly 56 percent in 1995.7
GDP (in million leks) 16,813 16,404 50,697 114,222 171,225 204,519GDP per capita (leks) 5,123 5,032 15,892 36,055 53,474 62,948
SOURCE: Ministry of Finance and IMF Staff Estimates for 1995.
* in contrast to agriculture, there has been a large decline in state industrial production whichpreviously made up the largest share of GDP, a decline that has not been sufficiently offsetby growth in private industrial production. Industry's share in GDP has dropped to only
6 Estimates of agricultural output vary between data sets, with survey data generally showing lowerestimates than administrative based estimates. Given the large weight of agriculture in total production thesedifferences are of significance.
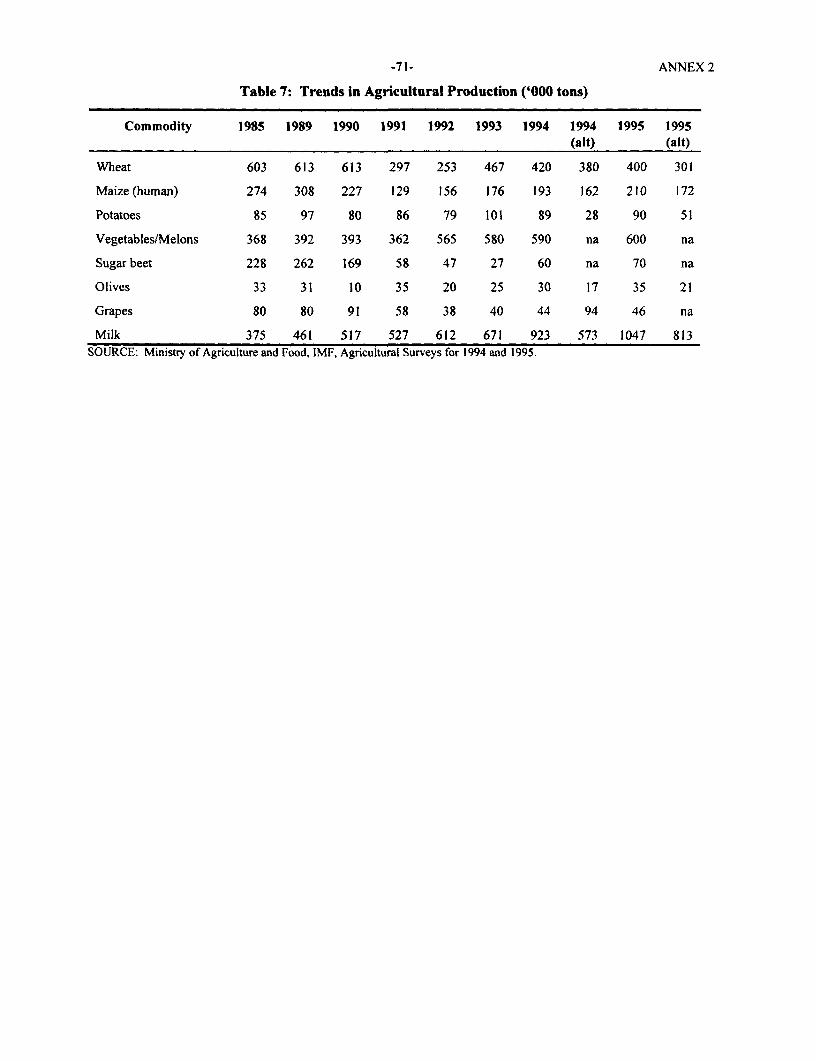
7 There are a number of interesting trends emerging in agricultural output (Annex 2, table 7). First, wheatproduction has increased significantly from the low levels of 1991 and 1992, but (according to statistics) is still wellbelow production levels of the 1980s, thereby requiring imports. Second, milk production now dominates totalagricultural production, and accounts for around one quarter/one fifth of total agricultural production (in terms ofvalue). Third, other main contributors to total (gross) agricultural output are vegetables and meat. Underlying thesetrends are significant changes in cropping patterns (predominantly out of grain crops into fodder crops andlivestock), a response to relative price changes, land ownership patterns (discussed in chapter 2) and availability oflabor, and access to markets. Changes in area planted is thought to be of less importance, and data on yields showvarious patterns.
-1 1-
around 12 percent in 1995 from nearly 40 percent in 1990.8 Private sector activities are inlight industry, including food processing, clothing and textiles, shoes, building materials andmetal products. Manufactures have been an important element in promoting Albanianexports which have tripled in US dollar terms since 1992 (albeit from a low base).
* the construction sector has registered the highest real growth from 1992-1995 at 17 percentaverage per annum. This is followed by transportation (12 percent), services (11 percent),and agriculture (10 percent). Much of the growth in construction has been in private housing,while growth in other services has come mainly from commerce. Activities in privateconstruction and other services are funded to a large extent by external remittances, eitherdirectly or through lending of these funds in the informal financial sector.
* remittances from overseas Albanians, whose estimates rose from US$150m. in 1992 toaround US$300m. in 1995, have been the single largest source of capital inflow in the lastthree years, amounting to over 10 percent of GDP. These remittances have not only beenproviding significant balance of payments support, but have also been the most importantsource of capital for domestic private investments, supporting the growth in the services andconstruction sectors.
1.22 Investment. Investment is still dominated by the public sector (accounting for 10 percent ofGDP in 1995), which is largely funded by concessional aid. Private investment has grown rapidly from azero base, and now accounts for an estimated 6 percent of GDP. Until the past year, private investmentwas almost entirely financed by capital inflows -- remittances (private transfers). National savings,however, turned positive in 1995, led by private savings (11 percent of GDP) seemingly occurring at theexpense of private consumption. There is also improvement in public savings. This is an important stepforward as increasing domestic savings are required to finance sustainable investment and promotegrowth.
The Challenges to Public Finance
1.23 The economic and political transition in 1991-92 led to a mushrooming of the fiscal deficit to 44percent of GDP in the first half of 1992 due to the decline in output, the weakening of the government'scontrol over state enterprises, and higher fiscal expenditures to counterbalance the output decline. Sincethen the government has made progress in reducing the deficit to an estimated 12 percent of GDP in1995, but much of the adjustment has been made on the expenditure side of the equation. This has notcome without cost, especially in the area of key public services, such as education and health. Continuedefforts will be required in fiscal consolidation, particularly on the revenue side, to bring the deficitfurther down to a more sustainable level but without further compromising important expenditures.
1.24 Revenues. The political and economic transition in Albania in 1991 and 1992 brought about alarge decline in total revenues, which fell from 47 percent of GDP in 1990 to 32 percent in 1991 and 25percent in 1992. This was almost entirely due to the erosion of the tax base with the virtual closure ofmany state enterprises and the breakdown of tax discipline in those that are still in operation. In order toestablish a broad-based tax system, the government introduced excise taxes and import duties in 1992,both of which have since become the major sources of tax revenues. Further effort is needed to broaden
The decline of state-owned enterprises has gone hand in hand with the demise in central planning, thedissolution of input-output chains, exacerbated by the dissolution of the CMEA, the withdrawal of state subsidies,and the imposition of a hard budget constraint.
9 Manufactures account for 60 percent of total exports, two-thirds of which are footwear and textiles, in themain destined for Italy.
-12-
the tax base. A VAT system has recently been introduced, and plans to raise VAT rates should help raiserevenues by 2-3 percent of GDP above the 1995 level of 26 percent of GDP.
1.25 Public Investment. Public investment has doubled in the post-1990 period (as a share of GDP),from 4.2 percent (1992) to 9.7 percent (1994). This reflects a high level of concessional aid. Publicinvestment has been, and will continue to be an important source of growth in the Albanian economy, butincreasingly funded from public savings rather than aid. Important features of public investment are thefollowing:
* Agriculture and Rural Development. In line with the large role of agriculture in theeconomy, the government has up to now devoted the largest share of its public investmentprogram to agriculture. In 1994 and 1995, investments in agriculture made up around 16percent of total public investment.
* Infrastructure. After agriculture come transport, communications, water supply andsewerage, all accounting for 11-12 percent of total public investment in 1995.
* Social Services. A large part of public investment has accrued to these sectors in 1994 (30percent) and in 1995 (25 percent), a reflection of strong foreign financing (especially IDA).However, as discussed below, social services are deteriorating, with serious implicationsespecially for the poor. Much more needs to be done to reverse the downward trend.
1.26 Current Expenditures. Concomitant with the decline in total revenues was also a reduction inrecurrent expenditure. Current expenditures fell from 43 percent of GDP in 1990 to 29 percent in 1995(Table 1.6). Elimination of subsidies to enterprises, which stood at 14 percent of GDP in 1990,accounted for almost the entire magnitude of current expenditure reduction. There have also beenchanges in the relative magnitudes of the other items of current expenditures, with falls in operationaland maintenance expenditures (from over 10.2 percent of GDP in 1990 to 6.7 percent in 1995) and socialsecurity expenditures (from 8.6 percent to 6.7 percent) being offset by rises in interest expenditures(from zero to 2.4 percent of GDP), unemployment benefit and social assistance.
Capital Expenditure 18.8 6.1 4.2 7.2 6.9 9.7SOURCE: Ministry of Finance and IMF.
1.27 Subsidies and Transfers. After an increase from 1992 to 1993, when they reached 15.4 percentof GDP, subsidies and transfers' 0 as a whole have been on a steady decline (Table 1.6). By 1995, they
10 These include social security (pensions and maternity allowance), social assistance, unemployment benefit,political prisoner restitution, energy compensation, enterprise support and subsidies.
-13-
were around 11 percent of GDP. The initial increase in these expenditures reflected the expansion of thesocial safety net in 1992-93 when unemployment insurance and social assistance were introduced, andbudgetary transfers were made in partial compensation for the liberalization of food and energy prices.Since then, with a recovery in economic activities, social transfers have moderated somewhat in largepart due to the sharp reduction in people eligible for unemployment compensation. There has also beensome reduction in pensions (down from 6.3 percent of GDP in 1992 to 5.1 percent in 1995) and socialassistance (from 2.2 percent in 1994 to 1.9 percent of GDP in 1995). The capacity of the budget tosupport social transfers even at these reduced levels, however, is seriously questionable, yet (as will beshown later in this chapter) their role in poverty reduction is critical. Price subsidies as a whole havebeen steadily reduced from 1992 onwards, from 3.5 percent of GDP that year to 0.6 percent of GDP in1995. In 1995, price subsidies were eliminated for firewood, coal, kerosene, heating and medicine. Theonly price subsidies left are those on public transportation, rural water supplies, water for irrigation,schoolbooks, funeral expenses, and water and electricity for flour mills and bakeries." i It is expected thatthe government will continue to raise prices, as well as public utility charges, gradually toward cost-covering levels, thereby eliminating the subsidies.
1.28 Health and Education. As a share of GDP, public expenditure on health and education amountedto around 6 percent in 1995, which is at par with other developing countries of a similar per capitaincome. However, as a share of GDP, expenditure on health and education has been falling since 1992,and real expenditure has declined precipitously. From 4.3 percent of GDP in 1992, health expendituresfell to 2.4 percent in 1995, while over the same period education expenditures fell from 4.4 percent to 3.5percent (Table 1.7). Much of the reduction fell on non-wage operational expenditures, to some extent onwage expenditures, while investments were maintained, due to foreign financing. The real value ofrecurrent spending on education in 1995 was around 40 percent of its 1990 level. The nature ofexpenditure reductions, that is mostly on non-wage operations and maintenance is reflected in thedilapidated state of schools and the poor state of hospitals. The serious implications of thesedevelopment are discussed in the following paragraphs.
I I Generalized wheat and bread price subsidies were phased out in two major steps in 1992 and 1993, leadingto more than an eight-fold nominal price increase and a tripling of the real price for bread. To a large degree, suchprice reforms were designed more to rationalize economic signals than to reduce govemment expenditure; breadprice increases were accompanied by compensatory increases in pensions, unemployment benefit, social assistanceand public sector wages. The government did not, however, decontrol bread prices. Thus, when international wheatprices increased in mid- 1995, adding to increases in other production costs, an administrative decision rather than amarket response was necessary to transmit these prices. The government used a variety of measures, including pricecontrols, to avoid conveying price rises either to consumers or to the government budget. As a first level in acascade of subsidies, wheat imported by the government was released to mills at a price substantially below importparity. Concessional aid cross-subsidized other commercial imports, thus avoiding a cost to the budget. Furtherdown the chain, the government reduced the rates charged to the largely privatized mills and bakeries for electricity,other fuel and water. Bakers in turn are required to sell any loaves larger than 0.5 kilos at the same ceiling price thathad been in place before international wheat prices rose by over a third. Plans are now in place to decontrol breadprices and to remove the subsidies.
-14-
Box 1.4: Food Security in Albania
Wheat dominates food security issues in Albania, both by its prominence in consumer budgets and becausechanging production patterns combined with fledgling marketing channels has left the central budget overlyvulnerable to international variability. In the past two years, fluctuations in international wheat prices, rising costs ofproduction, and availability of wheat (and flour) have threatened food security.
The communist government aimed for self-sufficiency in wheat production. With the breakdown in the commandeconomy and central planning, wheat production dropped by half with only a massive program of international foodaid and logistics support preventing widespread famine in the winter of 1991/92. Food aid exceeded half the totalconsumption in the country over a two-year period (July 1991-June 1993), and foreign aid agencies and personnelplayed a critical role in distribution. While the agriculture sector has largely recovered, it has diversified intolivestock, dairying, and horticulture, with little likelihood of wheat production regaining its previous importance.
To a large degree, two separate food systems have emerged, with the rural wheat-producing economy largelydistinct from the urban import based grain marketing system. Only 22 percent of farmers sell any wheat at all, andonly 4 percent of total production is marketed. Over two-thirds of farm families produce less than 170 kilos ofwheat per capita and, thus, are likely to buy some wheat or flour at the margin. There is a strong regional pattern,with the mountainous north and northeast requiring a substantial inflow of grain. Due to poor roads and heavysnow, up to 300,000 people are cut off from supplies in the winter months. Even with the privatization of other linksin the market network, the government continues to provision these remote areas for 2 to 4 months prior to thewinter road closure on a ration and currently subsidized basis. Out migration from these areas is substantial, but thegovernment does not presently have an information system that is able to adjust supplies to changes in local need.
The entire urban population is dependent on imports of wheat (or flour). Due to the place of bread in the Albaniandiet, most urban Albanians are highly vulnerable to price shocks. For this reason, the government has intervened tocontrol the price of bread. The impact of government intervention on consumers has been modest. Implicit subsidieson wheat and explicit subsidies on electricity and water have been price supports to millers as much as consumers.Moreover, bakers have adjusted loaf size to circumvent price controls. Consumers are buying bread in smaller-sizedloaves and paying close to market prices.
Table 1.7: Education and Health Expenditures, Share of GDP(percentage)
Health 4.3 3.0 2.4 2.4Operational 4.2 2.7 2.2 2.2- Wage 2.1 1.4 1.4 1.4- Non wage 2.0 1.2 0.8 0.8
Investment 0.2 0.3 0.2 0.3
SOURCE: Ministry of Finance.NOTES: I/ Includes School Book Subsidies2/ Includes Medicine Subsidies up to 1994
-15-
Maintaining Essential Services and Transfers for the Poor
1.29 Good health and education are widely recognized as playing a key role in raising individualliving standards and, in particular, being an essential element of a poverty reduction strategy. Albaniaentered the transition with generally good education and health indicators across the board for its percapita income level, reflecting the priority that had been accorded to these sectors by the communistregimes. Doctors and teachers were forced to serve in even the most remote mountainous villages,ensuring that a meaningful service could be offered to all the people. What has happened to the educationand health status of Albania's population four years into the transition as public expenditures have beenfalling? How has access to publicly funded services changed? Are patterns of differential accessemerging, and if so, are the poor more disadvantaged than others? What should be done to ensure thatpast achievements are not lost, but built on for the future? The remainder of this chapter sets out toprovide answers to these questions in the areas of health, education and social assistance. T
1.30 The main conclusions of the analysis are the following:
Education
* school enrollments, especially in pre-primary, vocational secondary and higher educationhave dropped dramatically during the transition;
* no data exist on regional patterns of school attendance and educational attainment, but thefactors influencing school enrollment suggest that inhabitants of the north/north-east as wellas other remote rural areas are most severely affected by deteriorating school quality. Recentmigrants to towns and other poor urban dwellers are also facing schooling problems for theirchildren;
* there is an urgent need to arrest the decline in school attendance, to modernize the schoolsystem, as well as re-educate and re-train adults. This requires an increase in both investmentand recurrent spending.
Health
* certain health status indicators, such as infant mortality and adult morbidity due to infectiousdiseases, have deteriorated during the transition;
* the health status of the Albanian population shows wide regional variation, with thegenerally poorer north and north-eastern districts having indicators considerably worse thanthe national average. However, this is more a function of economic circumstances andtraditions than differential access to health facilities;
* the transition has had a negative impact on the availability and quality of health services,especially in the rural areas and the emerging peri-urban areas. Urgent measures are neededto reverse this trend, including increased public expenditure.
12 Household level data that capture the beneficiaries of public services and transfers is the standard approach
to understanding the distributional consequences of public expenditure and public service provision. Unfortunately,such data are not available for Albania, thereby rendering the conventional route of incidence analysis beyond thescope of this report. Nonetheless, using other information, this chapter attempts to sketch out some dimensions ofpublic service provision and transfer payments, including distributional dimensions.
-16-
Social assistance
* since its inception in 1993, ndhime ekonomike (social assistance) has played an importantrole in supplementing the incomes of many Albanian families, especially those who havelittle farm land and the long-term unemployed. General rural indicators, such as averagefarm size, show considerable success with program targeting, but other indicators, such aslong-term unemployment, show less success;
* in an attempt to address the problem of targeting, the program has been redesigned andconferred greater authority on the shoulders of local governments and municipalities, andoverall funding has been curtailed. This far the impact appears to be a reduction in theaverage payment to families rather than any reduction in the number of beneficiary families.This is an undesirable outcome for those most in-need, given the already declining real valueof social assistance payments. Additional measures, both incentives and penalties, haverecently been introduced in an attempt to improve program targeting. It is too early to assesstheir effectiveness. 13
Education Services have been declining......
1.31 Albania entered the transition with substantial achievements in education, all the moreremarkable for its level of per capita income. In 1990, more than 40 percent of the adult population hadcompleted secondary or higher education.'4 School enrollment ratios were also high at the end of the1980s, with even the most remote mountainous villages having a school: almost 60 percent of pre-schoolchildren (3-5 years of age) were enrolled in kindergartens; around 100 percent of children aged 6-14were enrolled in primary school; and around 80 percent of the 15-18 years olds enrolled in secondaryschool. All these figures compare favorably with neighboring Central and Southern European countries,and far exceed those of most other countries with a similar per capita income. Only participation inhigher education was low .15
1.32 Because of their overwhelming association with the i(leology of the communist regime, schoolswere the object of mass destruction during the 1990-92 period. More than 5000 schools were burnt,destroyed or damaged. Pre-primary and primary schools were the most widely affected, and more thanhalf of all primary schools were seriously affected in one way or another. In districts of northern Albania,former land owners reclaimed the land on which schools had been built. Destruction of schools added toyears of neglected maintenance and inadequate school supplies, rendering the quvality of schools ratherpoor. In addition, with the opening of the country's borders, the freedom for people to move from thecountryside to towns, and the relative attraction of non-teaching jobs, large numbers of teachers have leftrural schools.
1.33 Enrollments dropped during the 1990-92 period. In 1990 alone, the education system lost132,000 pupils, or 14 percent of total enrollment. Fall-out was particularly high from pre-primary, upperprimary (grades 6-8) and vocational secondary schools (Table 1.8). Not only were school structuresphysically unwelcoming for children (especially in the winter months), and teachers and learning
13 A study on the effectiveness of recent program changes on social assistance targeting is soon to belaunched by the Ministry of Labor and Social Protection in conjunction with the World Bank.
14 Data for Tirana show that the adult population had an average of 11 years of formal education, with themale population being slightly better educated than the female population (11.4 years compared to 10.5 years). Butyounger-age cohorts (under 40 years) show a more educated female adult population.15 There is little documentation of the quality of the school system during the communist period. It is widelyknown that the curriculum was heavily embodied with communist ideology, and the isolation of the country wouldsuggest that children had little or no exposure to information about the outside world.
-17-
materials lacking, some parents required their children to take care of the livestock or earn money inother ways, and the relevance of education, especially old-style vocational education, was rapidlyrendered irrelevant. In the school year 1993-94, only two-thirds of children who had began their primaryeducation eight years earlier graduated from primary school, and of those only two-thirds chose tocontinue their studies.
1.34 In the last two years the situation has improved a little. Foreign funding has begun the process ofschool renovation and new school construction, and some materials and books are now available in theschools. Recent pay increases for all public sector workers (including two rises in 1995 and one in early1996) have improved the attractiveness of teaching, especially as a source in income in the rural areas.16Enrollments appear to have stabilized, albeit at a lower level than prior to 1990. But much more needs tobe done, especially to ensure that children from poor families and living in remoter parts of the countryhave access to a quality education.
1.35 The health status of the Albanian population has shown some deterioration in recent years, withimportant regional patterns that are associated with economic activity. The remote areas of the northappear to have health status indicators significantly worse than the more open and prosperous districts ofthe south. The mountainous remote areas of the northeast (Has, Puka, Kukes, Dibra, Mirdite, Mat andBulquize) and the districts of the south bordering Greece (Vlore, Tepelena, Grijokaster, Delvine, Devolland Sarande) stand out at the two extreme ends of the comparison. The main discrepancies regardinghealth status indicators appear in infant mortality, the incidence of respiratory diseases in children,induced non-therapeutic abortions, and nutritional status. Although little numerical evidence exists, it isgenerally acknowledged that population groups living in crowded urban centers without access to properhygiene - water and sanitation - face significant health hazard especially that of infectious diseasetransmission as illustrated by the increased incidence of most communicable diseases over the last fewyears. This is a particular concern as the pace of rural-urban migration gathers.
1.36 The transition period has had a negative impact on health services. The distruction of healthfacilities in 1992, the shortage of essential drugs and vaccines, and subsequent lack of adequate funds tofinance the health care system has caused a severe disruption in the health care delivery system. Therural areas have been worst affected since, in addition to the previously mentioned factors, medicalpersonnel have migrated to urban locations where they can generate more under-the -table payments.But recent migrants to urban locations and poor urban dwellers are also facing severe problems (Box1.6). The number of primary care access points, including policlinics, health centers, and health posts,has significantly decreased since 1989. Although there is wide regional variation among districts (from
16 At the end of 1995 the average basic wage (there are a number of add-ons) for a primary school teacherwas 4900 lek/month ($52), and a secondary school teacher 5100 lek/month ($53.50).
-18-
66 per 10,000 population to 3 per 10,000), there is no regular pattern. The availability of hospital bedshas also decreased during the transition, and unlike in the case of primary care access points, thevariation in the
Table 1.9: Regional Differentials in Morbidity, Mortality, and Facility Utilization
DISTRICT live births % of at IMR abortions incidence of infectious respiratory visit to visit ofper 10,000 home per 1000 hepatitis per diseases as diseases as % PHC per childreninhabitants deliveries live births 10,0)00 % of total of total 10,000 (0-14) to
Box 1.5: Prevalence of Child Malnutrition in Northern Albania
Although no recent nation-wide survey on nutrition is available, several organizations have carried out smaller scalesurveys. They have observed some malnutrition in the northern districts. (16 percent of the children wereunderweight, and almost 20 percent were stunted, wasted or both.) Although the prevalence of moderate
U .derweight malnutrition is similar both in rural and urban areas,16% _ severe malnutrition appears more dominant in ruralStunted . Wasted areas: while 13 percent of children from urban areas are
Stunted & Wasted\M. _ . . \ severely malnourished, 22 percent of children from
Wasted . 2^ rural areas appear to be in the same condition. Theprevalence of malnutrition has considerably decreasedsince 1993 in the observed districts of northern Albania.
9rstnted _ ¢ ., . . This can be attributed to wider land ownership and
Normal consumption of animal (especially dairy) products. The67% highest prevalence of malnutrition exists in children in
the age of 10-15 months when mothers stopbreastfeeding. This is a common pattern throughout the
developing world.
-19-
number of hospital beds demonstrates a clear regional pattern. On the other hand, the number ofphysicians has not changed significantly since the onset of transition. During the communist era healthpersonnel were quite evenly distributed across the country by administrative means. The transition haslifted all political control over the location of employment, and migration of health personnel has beentaking place from sparsely populated rural areas to urban centers where working conditions are morefavorable and the opportunity to collect under-the-table gratuities are better. This has left villages andsmall towns with intermittent and/or inadequate health care.
1.37 Prior to 1995, access to health services was not limited by ability-to-pay barriers as the healthcare delivery system was fully financed from the state budget. Now pharmaceutical co-payments, under-the-table gratuities, and health insurance contributions are the order of the day. Together these amount toaround 1,850 lek/per person p.a. -- that is close to 9 percent of average per capita gross farm income and4 percent of average per capita expenditure in the urban areas. Evidence from the urban householdsurvey (cited in Box 1.6) suggests that inability-to-pay is preventing some sick people from receivinghealth care.
Box 1.6: Health Care and the Urban Poor
Public health care for both legal residents and illegal migrants in Albania's cities is increasingly available only tothose who can pay (under-the-table payments). While most urban residents will seek treatment when they are ill, thenon-poor are more likely to seek treatment than the poor. The two most important reasons for not seeking treatmentare that it is either too expensive or family members are treated at home. Among the urban poor 54 percent said thatthey do not seek treatment at a clinic because it is too expensive. According to one legally registered employedwoman in Tirana, it was necessary to pay both doctors and nurses to get any attention for her father who had justundergone major surgery. Even when her father literally collapsed on the floor, she could not get any help until herhusband was able to get to the hospital bringing not only money, but their own instrument for measuring bloodpressure. Another employed woman in Lezha experienced similar treatment when she underwent surgery. While inthe hospital, she had to administer her own oxygen. Both women confirmed that they had to pay hundreds ofdollars to obtain help that they should have received at no charge. When asked how the poor can afford to obtainhospital care, the woman from Lezha remarked that "they do not get help; the poor are left to die."
For those who may not be legally entitled to public health services, the situation can be worse. Families do not evenhave the right to request treatment at the local clinics. Some families dealt with this by paying several dollars underthe table for each examination. In some cases, their children received vaccinations, but in a few cases, youngchildren had not received the necessary vaccinations because they were not on the district list of children. Migrantscannot even be legally buried unless they pay a bribe. According to several respondents, there was a recent death ofa young man in Bathore whose family had to pay a $70 bribe for permission to bury him.
Social Assistance has performed much better
1.38 Legislation enacted with effect from the beginning of July 1993 introduced a program of socialassistance, known as Ndhime Ekonomike. The program was designed to provide an income transfer tofamilies that had non-existent or insufficient income from market and non-market sources in order tomeet minimal subsistence requirements. The level of subsistence was set at between 70 percent and 100percent of the income of a family with two unemployed persons, each receiving unemployment benefit,adjusted for family size.)7 Payments can be made at the full amount in the absence of other income, or at
17 The base monthly unemployment benefit was 1,920 lek (per person) in 1995, generating a subsistencelevel of 3,840 lek per month for a family of two adults. However, the average paid-out unemployment benefit in1995 was 3,417 lek per month, suggesting a higher monthly subsistence minimum of 6,834 lek. The average fullsocial assistance payment in 1995 was 2,533 lek/month, slightly less than 70 percent of the base unemploymentbenefit, and 37 percent of the actual unemployment benefit level. The 70-100 percent requirement was in factdropped in January 1995.
-20-
a partial amount if other incomes exist but are inadequate. The latter is particularly important for farmingfamilies with very small incomes from tiny plots of land. The program is administered through thenetwork of local governments (communes in the countryside and municipality in the towns), and fullyfunded from the central budget.
1.39 At its inception, centrally mandated rules determined both eligibility and payment levels. Fundswere allocated to local authorities to meet all honored claims. In this way, the number of beneficiariesrapidly escalated. In an effort to improve targeting and tighten enforcement of eligibility conditions,various changes have been made in the program. Starting in November 1994, local authorities receivedtheir ndhime budget as a lump-sum and it became their responsibility to decide the allocation tofamilies, but payments were still subject to a mandated minimum. Since local authorities were reluctantto withdraw benefit from anyone, they either gave each family less, or came back to the centralgovernment and pleaded for more funds. Expenditure on the program rose to 2.2 percent of GDP in 1994(from 1.9 percent in 1993). The 1995 ndhime budget was reduced (back to 1.9 percent of GDP), theminimum payment level was abolished, and local authorities could retain a part (two-thirds) of anysavings on the block-grant (ndhime budget) and use it for community-based development programs.These measures, together with an assessment of living conditions (home visit) and the installation of aninspectorate, are designed to give local authorities incentives, additional instruments and penalties toimprove targeting of payments.
1.40 The number of families in receipt of social assistance peaked at the end of 1993 (155,038, around20 percent of the population), with the rural areas claiming a slightly higher incidence of receipt than thetowns. But in terms of expenditure, the towns dominated, accounting for almost 60 percent of totalexpenditure. The reason for this is that most urban beneficiaries of ndihme were drawing full payment onthe basis of no other sources of income, whereas most rural beneficiaries were drawing a partial paymentto supplement their farm income. By June 1995, the number of families drawing social assistance hadfallen to 137,049, or around 17 percent of the population. While in part a seasonal decline, this numberalso reflects a tightening of the enforcement rules. The rural-urban incidence of receipt became morebalanced in 1995, but still the rural areas have a slightly higher rate. Partial payments continue todominate (Table 1.10). Payment amounts have declined in absolute terms in the 1993-1995 period, andgiven inflation have lost around 20 of their real value. In 1995, the average full assistance payment was2,533 lek per month per family (US$27). This level of payment represents less than 40 percent of theurban poverty line drawn at half of mean expenditure, and almost half of the amount would need to beallocated to purchasing bread in order to meet minimum subsistence requirements. The partial payment(1,184 lek per month) is roughly equivalent to average gross farm income for the poorest decile of ruralhouseholds.
There are important regional differences in the incidence of social assistance payments. The 13 districtsthat comprise the north/northeast have an average incidence of 35.3 percent of families receivingassistance. This compares with 12.4 percent of families in the central districts, and 1 1.2 percent of
families in the southern districts. Focusing on the ruralpopulation in these three regions shows an evenlarger concentration of payments to families in the north/northeast. These regional variations are closelyassociated with variation in average farm size (Table 1.11). 18 With regard to the urban population there
18 Within regions there are also important variations. In the north/northeast, for example, there are two
districts that have benefit incidence of more than 60 percent of families (Kukes and Diber), yet Lezhe has less than12 percent. In the case of Kukes and Lezhe, the correlation between benefit incidence among the rural populationand average farm size is strong. In both the central and southern region one also finds districts with a highproportion of families drawing benefit. In rural Pogradec, for instance, almost 40 percent of families were receiving
-21-
Table 1.10: Trends in Social Assistance
Rural Urban Total Full Partialfamilies families payment payment
Share of population receiving assistance1994 19.1% 17.6% 18.6%
is less regional variation, but nevertheless still a north/northeast concentration of payments. At theregional level, urban incidence of ndhime receipt is only closely associated with the long-termunemployment rate.
1.42 Beyond these regional and district level observations, the absence of nationwide household datarender it is impossible to comment further on the efficiency of social assistance targeting.19 The analysisof urban household data suggests both inclusion and exclusion errors. However, given the widespreadnature of poverty in Albania, and the difficulties of differentiating the poor from the very poor, this isnot surprising.
1.43 The 1996 budget allocation for ndhime has been further reduced from its 1995 level. The numberof claiming families is thought also to be falling but the magnitude of the fall is likely small. Under thisscenario, there will be a further reduction is the average payment level, rendering ndhime less of aneffective poverty reduction instrument for families most in need. However, unless the number of familiesclaiming ndhime can be reduced substantially, the level of payment will necessarily remain low. Changescurrently under implementation in the administration of the program, whereby local authorities can use apart of the unallocated funds for community development projects (paying wages to workers in lieu ofassistance), may help limit the number of families assessed eligible for direct assistance, and therebyfacilitate larger payments to the most needy.
social assistance in 1994. In contrast, Devoll, also in the southern half of the country (and bordering Greece) makespayments to only 2.5 percent of families (0.9 percent in the rural areas). (By way of possible explanation for this,Devoll has one of the highest average farm sizes of all districts.)
19 The Albanian Ministry of Labour and Social Protection, together with a research grant from the WorldBank, is launching a study (which includes a household survey) later in 1996 to investigate the efficiency of socialassistance targeting. The study is designed to compare and contrast targeting efficiency under the former morecentralized administrative organization and recent (late 1995) amendments that give local authorities greaterautonomy in allocating funds.
-22-
Table 1.11: Regional Dimensions of Social Assistance, 1994
Share of population in receipt of social assistance (%) Rural pop. AverageTotal Rural Urban share (%) farm (ha.)
2.1 The Albanian economy has experienced enormous changes in the past five years that have had aprofound impact on rural incomes and welfare. Agriculture has been a central part of the reformprogram and, as such, has been the subject of a liberalization process affecting all aspects of theproduction and distribution process, and in particular, land privatization. Early consequences of the landreform have been political stability, agricultural output growth, increased yields in the more fertile areas,some diversified cropping and livestock patterns, and progress in food self-sufficiency. However,progress has been uneven, due in large part to population densities at the time of the land reform whichresulted in significant variation in land holdings. Some rural families have very small plots of land, fromwhich they can barely survive. Cash transfers and other sources of income are critical. While theagricultural sector has further growth potential, for a substantial part of the rural population off-farmemployment and business opportunities, short-term emigration, and cash transfers will be importantelements of a poverty alleviation strategy. For some rural households (perhaps a substantial number),their best chance will be to leave the rural areas and seek a new life in town. This chapter explores thesethemes.
An Overview ofAgriculture and Rural Poverty
2.2 With around 60 percent of the Albanian population living in the rural areas, and relying onagriculture as the mainstay of their existence, developments in agriculture are of great significance tooverall welfare. The agricultural sector has recovered well since the virtual collapse of production in1990-91, and output growth appears to be occurring across most farm sizes. In large part, output growthis a function of shifting cropping and livestock patterns, with farmers moving out of grains into foddercrops and livestock. Some of the growth is also due to yield increases, especially in the coastal plains.Livestock, in particular cattle, are an important part of household income especially for households withvery small farms (less than half hectare) and where the land is poor. Yet a large part of agriculturalproduction, including livestock and dairy products, remains for own-consumption. This reflects a nearabsence of marketing channels and the preoccupation of many rural households with food security -- areaction to the past when (near) famines were experienced.
2.3 The Government's land reform program of the early 1990s achieved its initial objective ofprivatizing cooperatives and state farms very quickly, with a reasonable degree of equity, and achievingpolitical and social stability. But because of overall population pressure and the lack of jobs elsewhere inthe economy, average farm sizes are very small (1.3 hectare). There is substantial variation in farm size,with larger average holdings on the more fertile plains, and smaller farms in the less fertile mountains.There is a significant number of farms that are too small to be economically viable. Moreover, farms (ofall sizes) are divided into fragmented holdings. A land market has yet to develop in Albania, althoughremaining legal and administrative barriers are soon to be removed. The next phase of land developmentthat can be anticipated will be consolidation, initially within holdings to reduce fragmentation, and in thelonger-run across holdings to increase average farm size.
2.4 An estimated one quarter of the rural population lives on a farm that is too small to sustain thosefamilies to a very modest level of subsistence from farming alone. The vast majority of these familieslive in the upland areas and the mountains, and have farms of less than half a hectare. The poorest decileof people live on an agricultural income of less than the equivalent of US$70 per annum, and are unableto meet even their staple food requirements year round. They are dependent on the provision ofsubsidized wheat/flour through the winter months (Box 1.4), and on cash transfers (pension and socialassistance). Poor families are also found in the foothills and the coastal plains, but their numbers are
-24-
fewer. Beyond these very poor families are others whose land holding is of an insufficient size (less thanone hectare) to produce a significant marketable surplus in the future. They too will need to supplementtheir agricultural income with other income.
2.5 Non-farm income is a critical source of income for many farming households. Althoughimpossible to quantify (because of absence of data), it is estimated that somewhere between 70 and 90percent of rural households have a source of income other than farming. This is clearly a critical part of asurvival/improvement strategy. Income comes from a number of sources: earned income is derived fromwage employment, non-farming business activities, and remittances from absentee family members(private transfers); un-earned income is primarily social cash transfers, in the form of pensions, socialassistance and unemployment benefit. In terms of incideiice the order is (from highest to lowest):pensions, wage employment, non-farming business, social assistance, remittances, and unemploymentbenefit. However, in terms of magnitude of income rendered to recipient families the order is:remittances, wage employment, non-farming business, unemployment benefit, social assistance andpension. In all likelihood it is non-farm earrned sources of income, especially remittances, thatdifferentiate the upper rural income deciles from each other niore than farm income.
The Importance of Land
2.6 Approximately 60 percent of the Albanian population lives in rural areas, although a high rate ofrural to urban migration is lessening that share. Following a land reform/land privatization program ofthe early 1990s, all rural families have some land, albeit very small plots. The bulk of agriculturalproduction is for own consumption, although the trend is towards more production for the market. Thestaple food crops are wheat and potatoes, while the most important marketed agricultural commoditieshistorically have been wheat, vegetables, meat, and milk.
2.7 Land Availability. Albania's land area is 27,400 km~ (out of a total area of 28,750 km2 ) or 2.9million hectares. Of this area only about 25 percent (702,000 hectares) is arable land. An additional 15percent or 425,000 hectares is suitable for use as pasture, while another 105,000 hectares is forested(Wheeler, 1996). The country is typically divided into three geographical zones: (a) the coastal plainwith 44 percent of arable land; (b) the hilly or foothill areas with 37 percent of arable land; and (c) thelow and high mountains with 19 percent of arable land. The coastal plain is the most fertile area and isgenerally regarded as having the most agricultural potential, although there are pockets of goodagricultural potential sprinkled throughout other areas of the country.
2.8 Although about 417,000 hectares (about 60 percent of arable land area) are irrigated -- withslightly more than half of the irrigated area (226,000 hectares) located in the coastal plain -- the area withoperational irrigation systems is considerably less. The combination of widespread violence (oftendirected at the physical infrastructure) that accompanied the political transforrmation of the early 1990sand the lack of maintenance in recent years has greatly reduced the number of operating irrigationsystems. In 1993, it was estimated that only about 80,000 hectares -- about 11 percent of arable land --had operating irrigation systems.
2.9 Land Reform. Prior to 1991, the majority of agricultural production took place within theframework of state farms and cooperatives. Following the fall of the communist government, a programof land privatization was approved by parliament (Land Law No. 7501, August 19, 1991). Under thislaw, the land controlled by the cooperatives was allocated to those families living in the villages of thecooperatives according to several criteria. These criteria stipulated that: (a) land was to be distributedproportionately to every family according to the number of family members as of August 1, 1991; (b)
I Plains are defined as having a slope of zero to five percent; hilly land or foothills have a slope of five to 25percent; and mountains have a slope of 25 percent or greater.
-25-
land was to be graded on the basis of irrigation, slope, and quality in order to make the distribution moreequitable; and (c) land planted to tree crops was also assigned a different value in the distributionprocess. In 1992, the privatization process was extended (under Decision 452 dated October 17, 1992) tothe land controlled by the state farms.
2.10 As of mid-1995, 365,000 families controlled 426,000 hectares of land formerly belonging tocooperatives. This area was divided into about 1.5 million parcels or plots with about 65 percent of theparcels having received official ownership certificates (tapis).2 As a result, the average holding onformer cooperative land measures slightly more than one hectare and is divided into four parcels. On theformer state farm land about 101,000 families have gained usufruct rights to 120,000 hectares of landdivided into 400,000 parcels. This indicates an average holding size of just over one hectare divided intofour parcels -- the same as on ex-cooperative land (Stanfield and Jazoj, 1995). About 106,000 hectaresof agricultural land has not been distributed because it is of marginal agricultural value or is planted withtree crops and has proved difficult to redistribute.
2.11 The sale of land was prohibited under the terms of Law 7501, but this restriction was removed inJuly 1995. It was stipulated, however, that land sales or purchases "shall only take place if the land inquestion is registered in the Registry office in the place in which the property is located." In addition, noland in a district could be sold as long as not every plot in the district was registered. Althoughregistration began in the second half of 1994, the process has been very slow. (Inter alia, because ofdelays in appointing a registrar and establishing land registry offices). As a result of thesecomplications, there have been no official land sales/purchases to-date.3
2.12 A major feature of the Albanian land reform process was the intention that land should not bereturned to those who owned the land before collectivization.4 The justification for this decision was thatland scarcity is so extreme that concentrating land ownership among the heirs of those who owned landprior to collectivization would create an unacceptably large number of landless houceholds. Morepractically, the old boundaries and documentation of ownership claims were virtually non-existent. Butthe decision to allocate land among the members of the cooperatives and state farms and to ignore theownership claims from the pre-collectivization period has not passed without problems.5
2 While the tapi is intended to signify land ownership rights, it is only the preliminary part of the land surveyand registration process.
3 Passing of a law to permit the sale of land was hotly debated in Albania. Opposition to the law was basedon two concerns: (a) in those areas where land holdings were small andlor the land of poor quality, people wouldvery soon give up their land and migrate to town, putting pressure on urban services; and (b) in the south of thecountry land would fall into the hands of Greek ownership.
4 The communist government that came to power in 1944 implemented a land reform in 1946 thatredistributed the large land holdings to small-scale private farmers as a means of consolidating its political power.The collectivization process that began in mid-1950s eliminated most small farms by creating collectives and statefarms, however, the collectivization process was gradual. As of 1950, about 80 percent of land was individuallyheld and less than 10 percent was held by state or collective farms. Over the next 15 years these shares werereversed.
5 In a small number of villages where land assigned by the village land committee had belonged to othervillage members before collectivization found, land assignments were contested. This set in place a conflictbetween those viewed as newcomers to the village (typically arriving in the village after collectivization) and thosefamilies who were resident in the village prior to the mid-1950s. In some instances, families who found themselveswith a contested land claim chose to leave the village.
-26-
However, these problems are of a much smaller magnitude than in the urban areas where restitutionclaims have been honored, or considered.
Box 2.1: Village Living Conditions6
In addition to the standard of living that can be afforded on the basis of income derived from agriculture and off-farm sources of income, the condition of rural infrastructure and access to services are important elements of life inrural Albania. Although villages differ in their accessibility to a larger village, town or city, they share a number ofcommon conditions -- extremely poor infrastructure (roads, water, electricity supply and telephones) and quiteinadequate services (health and education). These typically add to the picture of hardship and poverty.
Infrastructure Water availability (for both drinking and irrigation) and water quality are common problems.According to UNDP's Human Development Report (1995), only 47 percent of the rural population has access topiped water or a well, and only 5 percent of the rural population has piped water inside the house. It is not unusualfor women (responsible for fetching water) to have to walk for more than half an hour to their nearest safe watersource, and in summer months when water is more scarce, they often go in the middle of the night to avoid longdaytime queues.
During Hoxha's regime, households were wired to accommodate one electrical socket per room and about 22 wattsof electricity. In many villages, however, the supply of electricity is intermittent and the current low. This affectssmall businesses, like the local flour mill, as well as homes.
Off the main roads, which themselves are typically one lane and badly maintained, many rural roads are little morethan a dirt track, often steep and pitted. Less than a robust four-wheel drive vehicle or a heavy truck would findthem impassable. Many villages rely on donkeys and horses for day-to-day transportation, including for gettingproduce to market (often the road side). For emergencies, like a serious illness, villagers either call upon the onevehicle in the village to transport them to the hospital (often for the sum of a few hundred leks), or walk to the mainroad carrying the sick person and flag down a passing vehicle. Children walk to school, often some kilometers alongmuddy tracks and through snow in the winter. Farmers walk to their distant land parcels, or travel by donkey/horse.
Health Access to basic health services varies considerably from one village to another. Some villages enjoy a wellmaintained and well equipped clinic, with good nursing staff that does not charge for services. Yet other villageshave very badly maintained and poorly equipped facilities, medical staff that are not available on a regular basis andwhere an under-the-table payment is the norm. The better clinics arc typically ones that have benefited from donorfinancing -- even a small amount of help, like a few drugs, seems to make a huge difference in terms of the attitudeof both staff and clients.
Education Schools are typically in worse condition than health facilities. Many were destroyed, or badly damagedduring the 1990-1991 period, and still lack windows, parts of roofs and basic furniture (desks and chairs). Wintersare cold, and bar the odd wood stove, classrooms are unheated. Teachers are trying to find work in the less remoteplaces, and only stay in the villages if they have to:
"Ramazan, a young teacher of English, teaches two days a week in Elbasan, and -- onlybecause he cannot find full-time work in the city -- three da) s a week in the village. He isdissatisfied because he feels that the impoverished conditions of the village have reducedthe children's interest and capacity to learn. They walk up to two hours to school each way,and have little time to do their homework. Their parents don't push them, and most of thepupils lack interest, leaving at the age of 14 or 15, before completing the basic cycle,to help with agricultural work, take care of livestock or help make ends meet in other ways.The children lack winter coats and boots; many come to school hungry".
6 This section is drawn from one of the field reports commissioned under this study: "An ethnographicalstudy of the small-scale credit program in Tirana and Elbasan Districts", by Nora Dudwick, March 1996.
-27-
Box 2.2: Data Sources and Methodology
There are no national surveys on which to base an assessment of rural household income. Consequently,it is necessary to rely on the few sample surveys that examine different aspects of rural households. Itshould be stressed, however, that this approach is a second best option because the samples wereassembled using different methodologies, are often drawn from different districts, and intended to servedifferent purposes. The three sources of survey data that have been used in preparing this analysis are:
* Land Research Institute Sample Survey. This survey, carried out in 1995, was designed toinvestigate land use activities at the household level in five districts with particular emphasis onsubdivision of land, purchase/sale of land, and investment in agricultural land. The survey wasadministered in 50 villages and covered about 800 households and 3000 parcels of land.
* Special Agricultural Survey for 1994. This was the first in what is to become an annual survey ofagricultural production at the household level. The survey, which was conducted in November andDecember 1994, concentrates largely on production and marketing data from crops and livestock. Itis possible to use these data to estimate gross and net household income from agricultural activities.The survey covered 1095 households in 18 of Albania's 36 districts.
* Annual Agricultural Survey for 1995. This is a slightly modified version of the 1994 survey ofhousehold agricultural activity. Because of the inclusion of some new items (e.g. milk from sheep)data from the two years are not strictly comparable.
The main weakness of these data is that they do not provide information on sources of income other thanfrom agriculture. Recognizing that off-farm wage employment and business income, migrants'remittances, pensions, and social assistance are all important elements of household incomes makes theiromission from the surveys a serious shortcoming in the data. As a result, this report is not able toprovide details on total household income. As an alternative, the report presents a typology of ruralhouseholds based on the characteristics of the farm (e.g., size, location, land quality and fragmentation,and livestock holdings) and gross farm income. Finally, using a variety of information sources an effortis made to estimate the number and types of households that are most likely to have significant sourcesof off-farm income, and the orders of magnitude of those incomes.
Profile of Rural Households in 1994
2.13 The results from the 1994 Special Survey of Agriculture are organized around the location andamount of land that is available to households, and this will serve as the basis of the household typology.The salient points that emerge from 1994 survey data fall into three categories: (a) size andfragmentation of land holdings; (b) land use patterns; and (c) levels and composition of gross farmincome.
Size and Fragmentation of Holdings
2.14 Because of existing population densities at the time of the 1991 Land Reform, land holdings varyin size beyond family size. The survey results for five districts reported in Wheeler (1996) indicate thatabout 50 percent of households received less than one hectare of land and 25 percent gained access tomore than 1.5 hectares. Data from the 1994 Special Agricultural Survey confirm that there isconsiderable variation in holding size (Table 2.1). The average holding size7 across the sample and the
7 The survey uses two definitions of holding size, estimated and measured. Estimated holding size is basedon the respondents reply to a question about the size of the farm or holding. Measured holding is based on theholding size as measured during the land registration process. Since the latter data series is incomplete, allreferences in this report to holding and parcel size are based on the "estimated" variable.
-28-
country is about1.3 hectares, but there is significant variation in holdings within each of the stratum. Forexample, in the mountain stratum more than 50 percent of the sample households have less than half ahectare of land, while about 15 percent of households have access to more than 1.5 hectares of land. Incontrast, in the coastal stratum only five percent of the sample has access to less than a half a hectare ofland, while over half the coastal sample has access to more than 1.5 hectares.
Table 2.1: Profile of Agricultural Holdings, 1994
Region and Pet of Number of Avg Avg Area Number Avg Holding HoldingHolding Size Stratum Households Holding Cultivated of Parcels Parcel Size per Size per
Size Size capita AdultCoastal
<0.5 ha 5.0 19 0.3 0.25 2.6 0.12 0.15 0.15
0.5 - 1.0 ha 16.3 62 0.8 0.67 4.3 0.18 0.22 0.35
1.0- 1.5 ha 26.3 100 1.3 1.08 5.2 0.24 0.30 0.53
1.5 - 2.0 ha 20.3 77 1.8 1.51 5.6 0.31 0.34 0.60
> 2.0 ha 32.1 122 2.8 2.36 6.7 0.41 0.46 0.84
Total 34.7 380 1.73 1.47 5.5 0.35 0.34 0.60
Foothills
<0.5ha 1.9 25 0.3 0.25 2.2 0.13 0.07 0.10
0.5 - 1.0 ha 21.0 44 0.8 0.69 4.9 0.16 0.24 0.34
1.0 - 1.5 ha 23.8 50 1.2 1.14 6.2 0.19 0.24 0.40
1.5 - 2.0 ha 22.4 47 1.8 1.61 5.4 0.33 0.34 0.62
> 2.0 ha 21.0 44 2.7 2.53 6.5 0.42 0.38 0.62
Total 19.2 210 1.45 1.34 5.3 0.29 0.27 0.45
Upland
< 0.5 ha 30.7 122 0.3 0.25 2.8 0.10 0.06 0.10
0.5 - 1.0 ha 28.0 111 0.8 0.68 4.5 0.17 0.16 0.27
1.0- 1.5 ha 19.1 76 1.3 1.10 5.7 0.22 0.23 0.39
1.5 - 2.0 ha 12.6 50 1.8 1.57 6.7 0.26 0.30 0.54
> 2.0 ha 9.6 38 2.7 2.14 6.3 0.43 0.44 0.71
Total 36.3 397 1.02 0.88 4.7 0.24 0.19 0.32
Mountains
< 0.5 ha 53.7 58 0.2 0.20 2.8 0.08 0.05 0.09
0.5 - 1.0 ha 20.4 22 0.8 0.46 5.0 0.15 0.15 0.29
1.0- 1.5 ha 11.2 12 1.1 0.91 6.3 0.18 0.26 0.35
1.5 - 2.0 ha 8.3 9 1.8 1.35 5.9 0.30 0.34 0.60
> 2.0 ha 6.5 7 2.7 1.54 6.6 0.41 0.43 0.67
Total 9.9 108 0.71 0.51 4.1 0.16 0.14 0.24
All Areas
< 0.5 ha 20.5 224 0.3 0.24 2.7 0.10 0.06 0.10
0.5- 1.0 ha 21.8 239 0.8 0.66 4.6 0.17 0.19 0.31
1.0- 1.5 ha 21.7 238 1.3 1.09 5.6 0.22 0.26 0.45
1.5 - 2.0 ha 16.7 183 1.8 1.54 5.9 0.30 0.33 0.59
> 2.0 ha 19.3 211 2.8 2.33 6.6 0.42 0.44 0.76
All 100 1095 1.3 1.14 5.0 0.26 0.25 0.43
SOURCE: Calculated from the Special Agricultural Survey for 1994.
-29-
2.15 Perhaps the most striking outcome of the land privatization process was the highly fragmentedholdings that were created. Because the emphasis was on ensuring equity in the land holding pattern, atleast at the village and district levels, considerable effort was put into grading different types of land andensuring that households received small parcels of comparable land.8 As a result, the average number ofparcels per holdings is five. Even the smallest holdings (less than 0.5 hectare) are divided into at leasttwo parcels. Among the largest holdings, the average number of parcels is between six and seven. Thepattern of fragmentation is consistent across all strata with the result that average parcel size issurprisingly similar for holdings of the same size in the different strata. On the other hand, although thenumber of parcels increases with larger holdings, average parcel size is three to six times larger on thosefarms averaging over two hectares than those averaging less than a half hectare. Comparison of databetween 1994 and 1995 shows an increase in the number of land parcels, especially for the bigger landholdings. The reason for this is not clear, but it could be associated with marriage, inheritance or greaterintensity of land-use.9
Box 2.3: Land Use Patterns
Analysis of the 1994 data set provides some observations on the type of crops produced, livestock, and the volumeand value of marketed production and own consumption (See Annex 2, Tables I and 2). Points of interest are thefollowing:
* Major Crops: Wheat. In terms of hectarage, wheat production is the most important crop in virtually all strataand for all holdings. However, the value of wheat production (for both own consumption and sales) is rarelymore than a fifth of gross farm income and averages only 16 percent across the sample. In general, theimportance of wheat as a source of income is greater away from coastal areas and on the larger holdings.
. Major Crops: Fodder. Rivaling the importance of wheat are the two fodder crops (maize and alfalfa) whichtogether account for an average of about 16 percent of cropped area. The production of these crops are farmore important in the coastal stratum than the other areas of the country. No clear pattern emerges with respectto the production of fodder crops by holding size.
* Crop Marketing. The importance of cash crops to gross farm income is small. The share of wheat productionthat is sold averages just four percent across the sample. Holdings in the coastal areas sell the largest share ofwheat (positively correlated with farm size), but this does not exceed 10 percent of gross farm income. For thetwo fodder crops, the value of marketed production is trivial, only one percent of income with no discerniblepattern by stratum or holding size.
. Sources of Farm Income. The division between income derived trom crop and livestock production varies withrespect to holding size and location. Crop production is a more important component of income in coastal areasand on larger holdings, while livestock tends to be of greatel importance on smaller holdings and in themountain areas.
These land use patterns give rise to variation in land productivity (that is, value of agricultural production perhectare). Normalizing for holding size shows that small land holdings are worked more intensively than bigger landholdings: on average, holdings of less than one hectare generate a gross farm income per hectare twice that of farmslarger than one hectare (Annex 2, Table 3). There is less variation in the plains and foothills, and most variation inthe mountains. Mountain farms of less than 0.5 hectares are worked most intensively of all farms, yet mountainfarms of more than 1.5 hectares are farmed least intensively (the number of mountain farms of more than 1.5hectares in the sample is very small -- 16).
s Often, the fields of comparable land were simply divided into parcels so that each household in the villagereceived a parcel of a particular land type.
9 Annex 2, Table I shows the amount of fallow land. As a share of arable land, it was around 12 percent in1994 and 9 percent in 1995.
-30-
Levels and Composition of Gross Farm Income
2.18 The strong correlation between holding size (and in particular livestock/dairy) and gross farmincome, combined with the variation in land holding size, results in large variations in the levels of grossincome derived from agriculture. The poorest ten percent of households have a gross farm income that isless than one fifth of the mean and only 7 percent of that of the richest ten percent of households.'0 Thisvariation, in tum, affects the levels of own consumption and marketed output. The value of marketedoutput differs by a much larger factor between the lowest and highest deciles (about 60). It must benoted, however, that it is only the highest income group that has such a high share of marketed output.Far more typical is the share of marketed output characterizing the other deciles -- ranging betweenseven and twelve percent of gross farm income. The households in the highest decile market about 24percent of output, while the average for the sample is 14 percent.1 '
Table 2.2: Gross Farm Income by Deciles (1994)(Deciles calculated by gross farm income per equivalent adult)
Decile Gross farm Value of Value of Own Share of Share of OwnIncome Marketed Consumption Marketed Consumption
'° The Gini coefficient for gross farm income is 0.42 (1994).
" 1 This is a typical pattern found in other low income countries with a large agricultural sector. It is often thecase that the majority of marketed production in land constrained low-income countries is produced by the 10 to 20percent of households with the largest land holdings.
-31-
2.19 When gross farm incomes are calculated on an adult equivalency basis a similar pictureemerges. Gross farm income of the poorest decile of people (adult equivalents) is a mere 6,138 lek p.a.(US$65 at current exchange rates). Of this, only 6 percent is derived from the sale of agriculturalproduce. At the other extreme is the richest ten percent of persons (on an adult equivalency basis), wherethe average gross farm income is 120,472 lek p.a. (US$1,268), of which 20 percent is derived from sales.The value of own consumption of a person in the top decile is 16.5 times that of a person in the poorestdecile (Table 2.2).
2.20 The geographical distribution of income groups confirms the conventional wisdom that thepopulation living in the upland and mountainous areas of the country has less farm income than peopleliving in the foothills and plains.'3 For example, more than half of the population in the lower fiveincome deciles resides in the upland and mountainous areas, while three-fourths of the populationin the poorest decile live in these areas. By contrast, well over half of the households in the top 30percent of the (gross farm) income distribution live in the coastal plain and only about 18 percent of thetop three deciles live in the upland and mountain strata. It is also clear, however, that all strata containsignificant numbers of low-income households. Between 10 and 20 percent of the households in thelower half of the income distribution are found in the coastal plain.
The Incidence of Poverty on the Basis of Gross Agricultural Income
2.21 The absence of a representative household data set that includes information on all sources ofincome (or an expenditure survey which can proxy income) renders poverty analysis of Albania's ruralareas difficult. It is known from small-scale surveys , from qualitative interviews with households andfrom administrative data that many rural households have a source of income other than farming (Seebelow). But the household incidence and magnitude of non-farming incomes is not known. Therefore, asa second-best approach, poverty analysis is undertaken in this section with gross farm income data only.(Based on rough macroeconomic estimates of non-farm income and transfers, farm income may accountfor between 75 and 80 percent of rural sector incomes.)
2.22 In the absence of a country-defined or an official poverty line, and given the partial nature of theincome data, a relative poverty line (defined as on- half of mean gross farm income per adult equivalent)is used in this analysis.14 Applying this poverty line, a poverty incidence of 29 percent is observed(Table 2.3). The poverty gap is 14 percent. Poverty incidence and poverty gap disaggregated byagricultural strata show tremendous variation, reflecting the same patterns as mentioned above. Theincidence of poverty is highest in the mountains (54 percent) and lowest in the coastal plains (10 percent)(Table 2.3). The poverty gap is also highest in the mountains (26 percent) and lowest in the plains (6percent) suggesting that poverty is both pervasive and deep in the mountains (and, to a lesser extent inthe upJand areas), and less common and shallower in the coastal plains.
12 In the absence of detailed information on household size, an equivalency factor of 0.6 was used.
1 3 Because the 1994 survey was based on a representative sample, these distributions can be regarded asreflecting the actual distribution of the population.14 The mean of the distribution is 39,995 lek p.a. per adult equivalent. Thus, a poverty line set at half the
mean has a value of 19,998 lek. p.a. (US$210 p.a. per adult equivalent at current exchange rates). This compareswith a mean of 54,000 lek p.a. per adult equivalent for Tirana in 1994. and a poverty line at half the mean of 27,000lek (US$283). (Tirana household expenditure survey, INSTAT.)
-32-
Table 2.3: Poverty Incidence and Poverty Gap by Strata based on Agricultural Income, 1994(poverty line = half of mean gross farm income per adult equivalent)
Strata Poverty Incidence (%) Poverty Gap (%)Coastal 10.4 5.6Foothills 24.8 12.3Upland 39.6 18.9Mountains 54.4 26.3All 28.9 14.0SOURCE: Calculated from the Special Agricultural Survey for 1994.NOTE: Poverty incidence, or poverty headcount, is the percentage of peoplebelow the poverty line; poverty gap is the average shortfall of income per adultequivalent as a percentage of the poverty line
A Household Typology Based on Land and Livestock Holdings
2.23 Gross farm income is determined by three factors: the amount of cultivated land, the number ofcattle, and the stratum in which the holding is located. Consequently, the household typology thatdelineates the poor from the non-poor is based on these three variables (Table 2.4), but because farmingpatterns are different in the various strata, the typology emphasizes different variables in the variousstrata. For the coastal and foothill strata, the correlation between the number of cattle and cultivated areais ver7 high with the result that the construction of the household typology can rely on just one ofthese. In the upland and mountain strata, however, the correlation between land area under cultivationand the number of cattle owned is weaker and a more accurate typology is derived from using thenumber of cattle as the independent variable. Consequently, while the typology is based on areacultivated in the coastal and foothills strata and on the number of cattle (as a proxy for livestock) in theupland and mountain strata, it must be recognized that the relationship between land access and livestockis complementary and complicated. In all of the strata, households use a combination of land andlivestock to maximize farm income. This optimization process will be influenced by numerous othervariables including household labor, other sources of income, and local market conditions.
15 For these two strata, the better variable -- in terms of fitting the regression equation -- proved to be theamount of land cultivated by the household.
16 The explanation for the weaker correlation in the upland and mountain strata seems to be the combinationof smaller individual holdings and the availability of non-arable pasture land that can be used to support livestock.The survey data do not allow an assessment of access rights to pastures.
-33-
Table 2.4: Household Typology
Location and Household Description Agricultural Output Estimated Number ofLand/Livestock Assets Households
Needed to ExceedPoverty Line(a)
Coastal
Households in this stratum Households in this stratum Average non-poor households have About 90 percent of theneed at least 0.7 hectares that are above the poverty an gross farm income of 167,500 lek sample households in thein order to earn a gross line have an average of 1.9 compared to 93,000 for poor coastal stratum have morefarm income that exceeds hectares and 2 head of households. The major difference than 0.7 hectares of land.the poverty line. cattle. Those below the between the households in terms of The 10 percent under the
land threshold have access activities is that the non-poor poverty line have a landto 0.6 hectares and less households rely more heavily on holding not much lessthan two cows. crops as a source of income. than the minimum. Their
poverty can be consideredas shallow.
Foothills
Households in this strata Households in this strata Average non-poor households have About seventy fiveneed more than one that are above the poverty an gross farm income of 1 10,000 lek percent of the populationhectare to exceed the line also have an average compared to 73,000 for poor of this stratum have thepoverty line relying only of 1.9 hectares and 2 head households. Non-poor households necessary combination ofon gross farm income. of cattle. Those falling have slightly more marketed land and cattle to exceed
below the threshold have production, but otherwise the sources the poverty line. The 25access to 0.6 hectares of of income are similar. percent who do not areland and less than two some way below thecows. poverty line. They are in
deeper poverty.
Upland and Mountain
Households in these strata Households in this strata Average gross farm income for non- About fifty eight percentneed more than two cattle that are above the poverty poor households in this stratum is of the population of theseto exceed the poverty line line have an average of 84,000 lek. For the poor households strata have the necessaryrelying only on farm four head of cattle. Those average income is 55,000 lek. combination of land andincome. falling below the threshold cattle to exceed the
have access to less than poverty line. The 42one hectare of land and percent of people underless than two cows. the poverty line are in
quite deep poverty.
NOTE: (a) Poverty line is defined as half of mean gross farm income per adult equivalent.
2.24 On the basis of the above typology and the relative poverty line, it is possible to estimate thecarrying capacity of Albania's arable land area, and to estimate the surplus population currentlyattempting to live off the land. This calculation assumes that irrespective of changes in cropping patternsand technology, a minimum land holding of 0.7 hectares in the coastal plains, I hectare in the foothillsand 1.5 hectares elsewhere would be necessary to generate a sufficient incomefromfarming alone for anaverage size family to live above the poverty line. Also assumed in the calculation is that landconsolidation occurs only among the smallest land owners, thereby creating viable units out of existingnon-viable units. Such a calculation indicates that around 450,000 people (around 80,000 families), or 24percent of the rural population, are surplus to the carrying capacity of the land.
-34-
Non-Farm Sources of Income
2.25 As already indicated, however, farrn income is not the only source of household income for ruralhouseholds. Wheeler (op.cit.) reports on the main sources of household income by holding size for fivedistricts (Table 2.5). As expected, those households with larger holdings derive a larger share of totalhousehold income from agriculture and dairy. However, a relatively large number of households withvery little land (less than half hectare) also rely on agriculture as their main source of income. Incomefrom wage employment is of greater importance to households with less than one hectare than biggerland holdings, as is pension income. Remittances as the most important source of income apparently bearlittle relationship with size of land holding, and are more likely a function of household composition: ayoung man in the 20-34 age range who is not the head of household appears to be critical (Box 2.3). Insome instances, however, the male head of household is absent, leaving a de facto female household headto run the farm.
Table 2.5: Main Sources of Household Income by Holding Size, 1995
Main Source Share of Households Reporting Main Source of Income byof Income Holding Size
2.26 According to administrative data and data from the Albanian Development Fund, a very largeshare of rural households have a source of income other than farming. With regard to market income,around 30 percent of households derive income from wage employment (primarily public sector but alsosome private sector), around 25 percent benefit from remittances, and an estimated 15 percent havebusiness income other than farming. The value of these off-farm activities is very significant forbeneficiary families as the following figures show (all figures are lek per family per annum):
remittances 142,000public sector empl. 63,000non-farm business 25,000
pension 10,800social assistance 15,000
-35-
2.27 For the poorest decile, any source of earned non-farm income exceeds farm income. For theaverage rural family, having a family member working in wage employment in Albania makes animportant contribution to total household income, whereas remittances more than match farm income.These income comparisons go a long way in explaining the forces motivating farm families to participatein one or other of emigration or migration to find wage employment.
2.28 Social incomes, or cash transfers, are also of importance to farm families. Some 35 percent offarm families receive a pension income, and 19 percent receive means-tested social assistance (SeeChapter 4). According to Wheeler, pension income is the main source of income for around 18 percent ofrural households, and around 37 percent of households with less than half hectare of land. Average ruralpensions for former agriculture cooperative members are very low (10,800 lek p.a. in 1995, about $115)suggesting that households who depend on pension income are in extreme poverty. Average socialassistance (partial) payments are a little higher than the agricultural pension (15,000 lek per annum).Their payment level is designed to complement farm and other sources of income, rather than be asubstitute.
Box 2.4: Remittances in the Rural Economy
By far the largest single source of income in the villages is remittances from abroad, mainly Greece. Eleven of thethirty households we spoke with in one village had sent men from the families - usually adult sons - to Greece atleast once, and most had come back with several hundred dollars of earnings, $100 on up. In another village, thekommune center, we learned from the kryeplak that of the 320 families, at least 50 had men in Greece. Familiesused the remittances to purchase livestock, improve their houses, pipe water into their yards, pay for furniture,household items and clothes, and to repay loans. As one household head noted, over the last years, some familieshad become richer, others poorer, and the most salient difference was migration. Families with only one adult malewere at a disadvantage, because he would be expected to stay and take care of the family. Conversely, largefamilies with several adult sons had the best chance of getting ahead financially, as sons brought back hundreds, andsometimes thousands of dollars (Dudwick, 1996).
-37-
CHAPTER THREE
POVERTY IN ALBANIA: THE URBAN AREAS
3.1 Albania is the least urbanized country in Europe: only i40 percent of the population lives in urbanareas. In large part, this low level of urbanization is due to the policies of the former regime, whichprovided incentives to rural areas to increase farm and mining production, as well as controls on1 internalmigration to alleviate development pressures in cities. But cities continued to grow despite thegovemment's intentions. Between 1970 and 1980, the urban population increased by 2.8 percent (WorldDevelopment Report 1996). Since 1990, however, the rate of urban growth has dramatically increased.In greater Tirana alone, the population rose from 374,000 in 1990 to the present population of anestimated 545,000 people.
3.2 Living conditions in urban Albania have been poor fir decades, but the transition to a marketeconomy is posing new challenges for the urban population. While Albania's cities have grown, state-owned enterprises have continued to downsize or be liquidated, and many urban workers are withoutjobs. At the end of 1995, for example, around 30 percent of the urban labor force was registered asunemployed, of which 80 percent had been unemployed for more than one year.] For many urbanfamilies, therefore, obtaining enough money to buy food and other necessities means finding sources ofincome other than wages. In 1995, some 8 percent of urban families were in receipt of unemploymentbenefit, and about 18 percent in receipt of social assistance. Others have been receiving remittancesfrom family members living elsewhere, finding temporary jobs, borrowing money (from relatives,friends and moneylenders), or starting small businesses. Further, rapid and unplanned urban growth isoverwhelming the capacity of cities to provide adequate housing, ilfrastructture, and urban services.Most neighborhoods lack adequate streets and regular solid waste collection. Urban schools are over-crowded and public health facilities require payment for services
3.3 [low are urban households, particularly those at or below the poverty line, coping with theseconditions? This chapter attempts to assess the dimensions of urban poverty, encompassing both urbanand pern-urban areas (that is long-term urban residents and recent migrants to urban areas), to highlightthe characteristics of those most vulnerable to poverty, and to examine household strategies for copingwith evolving conditions. Following an overview of urban poverty, the remainder of the chapter isdivided into four parts. The first part looks at poverty incidence and depth in the four towns covered bythe study. The second part is the poverty profile -- a profile of the poor and their householdcharacteristics (household size and composition, labor market status, education, sources of householdincome, assets and expenditure patterns). Migration and location are also examined, as well as genderissues. Due to the methodological and data differences, tht lindings from the survey in the threemedium-sized cities are presented separately fi-om the findings on Tirana's pern-urban neighborhoods.The third part of the chapter looks at how the urban poor live, their physical, environmental and socialconditions, and their access to urban services. The fourth and final part extracts the priority problemsfacing urban households, and examines their coping strategies [he non-representativeness of the sampleshould be borne in mind throughout the chapter.
I Unemployment figures need to be interpreted with caution. On the one hand, official estimates might under-estimate unemployment since registration has little relevance once the period of unemployment benefit expires. Onthe other hand, some (many?) of those who are registered as unemploved are most likely working in the grey/blackeconomy.
-38-
An Overview of Urban Poverty
3.4 This chapter draws on a number of infornation sources, both qualitative and quantitative. Theseare discussed in Box 3.1 and in Annex 1. A central source of information is a household survey that wasconducted in Elbasan, Fier, and Lezha as well as the peri-urban areas of Tirana in January 1996, and apre-test of the survey instrument carried out in October 1995. (Box 3.1 provides some backgroundinformation on these towns.) Although providing important insights into household circumstances in theselected neighborhoods, the non-representativeness of the sample must be stressed.2
3.5 In the absence of a country-defined or official poverty line, one absolute and one relative povertylines are used in the analysis. Because of arbitrariness of the absolute line, however, most of the analysisrelies on the relative line. The absolute poverty line was set at the current exchange rate equivalent ofUS$1 per person per day. The relative poverty line is defined as 50 percent of mean expenditure. Thesetwo benchmarks effectively correspond to upper and lower poverty lines. Annex 3, Table I shows theexpenditure per capita and the corresponding adult equivalents for the poverty lines.
3.6 The incidence of poverty varies considerably between towns. Using a relative poverty line ofhalf of mean expenditure4, around 12 percent of the population of "old" Tirana (but 20 percent of peri-urban Tirana), 25 percent of the population of Lezha and Elbasan, and only 9 percent of the population ofFier are in poverty. Grossing up for all urban Albania suggests a poverty incidence of around 15 percent,or 185,000 people, but it should be repeated that the sample used here is not representative. With theexception of Tirana where poverty is apparently quite shallow, much of the urban poverty is deep: that isto say, the income shortfall of households under the poverty line is substantial, indicating that manyurban households are in extreme poverty. These poverty figures are closely associated withunemployment rates, levels of education, remittances and other economic opportunities. Urbanhouseholds spent approximately 70 percent of their income on food -- of which a large part is on bread --and a further 12 percent on electricity. Yet their ownership of consumer durables is surprisingly welldeveloped: 90 percent of households (75 percent of those below the poverty line) own a television, and78 percent (55 percent below the poverty line) own a fridge.5
3.7 Urban poverty has some distinct characteristics:
* poorest of all, both in terms of incidence and depth are households with an unemployedhead. These unemployed heads are typically male, in their early 40s, and with little or noformal education. They head families with 2 or more children. (A sub-group of theunemployed poor are those with more educated heads but who cannot escape poverty due tothe lack of job opportunities).
2 Analysis was also undertaken (in Albania) of the 1993 and 1994 Tirana Household Expenditure Surveys,surveys that are representative of Tirana. To-date this analysis has not been made available to the World Bank. Thefindings that are cited in this chapter come from published sources.
3 The more correct conversion procedure is to use purchasing power parity (PPP). However, no officialestimate exists for Albania at present. Based on international comparison, the PPP exchange rate would be higher bya factor of between 3 and 5, implying a much lower poverty line than commonly used in World Bank povertyanalysis.
The poverty line is 2,242 lek/month per adult equivalent for Tirana (1994) and 2,083 lek/month forElbasan, Fier, Lezha and peri-urban Tirana (1996). In US dollar terms, the amounts are $24 per month for Tiranaand $22 for the other towns. Poverty lines differ due to different data sets.
These are most likely purchased with remittances, or brought to Albania by returning migrants.
-39-
* next come three-generational households headed by a pensioner, often a woman who hassurvived her husband. While pensioners themselves are not among the poorest, the presenceof unemployed grown-up children and dependent grandchildren in their households makesthem poor. The monthly pension, $30 per month, is above the poverty line used in thisanalysis (half of mean expenditure), but not when shared among a household of 5 or 6persons.
* households headed by a low-wage earning man constitute the third largest group in poverty.These household heads are around 50 years of age, have little or no education and areemployed or self-employed in a low paying job. In these households, as in those householdsin the categories above, high unemployment among women compounds the lack of market-derived income.
* poverty is more prevalent among children and young adults than among prime-aged people.Families with 3 and more children are especially vulnerable to poverty. (This is a patterngenerally observed in more developed countries.)
* households that have no regular source of market income and rely on social cash transfersare typically very poor. The social assistance program, Ndhime Ekonomike, is playing a keyrole as the social safety net, but the program appears to suffer from inclusion and exclusionerrors, and payment levels are very low.
* private transfers, especially remittances from abroad, are a critical source of income andinvestment for urban households. Households regularly benefiting from remittances are morelikely to be non-poor, if not affluent.
3.8 While home and land ownership do rise with income, access to urban services do not differsignificantly for the poor compared to the non-poor. The bulk of the urban population receive largelyinadequate urban services and are exposed to unhealthy environmental conditions. In this way, the poorand the non-poor face equally badly. The poor differ from the non-poor in one important way: they areless able to pay for urban services and, in the case of health services for example, do not seek medicaltreatment because of the expense. Yet, despite the deficiency of urban services, these are not cited byeither the poor nor the non-poor as priority problems. People have been living with these problems fordecades and have learned to cope. On the other hand, economic insecurity is a new phenomenon. Highunemployment, falling real wages and job insecurity are all major problems.
Urban Poverty in 1996
Poverty Incidence and Poverty Gap
3.9 Approximately 15 percent of Albania's urban population (185,000) live below the poverty lineset at half of mean expenditure. At the higher poverty line of US$1 expenditure per day per adultequivalent, the figure doubles to around 30 percent (370,000 people). Although poverty incidence islowest in Tirana, because of its large population, the absolute number of urban poor is greatest there(70,000-150,000 depending on the choice of poverty line). Of the towns covered in this study, povertyincidence is highest in Elbasan and Lezha (Table 3.1). These same two towns have also the biggestpoverty gap, that is households who have expenditures (incomes) way below the poverty threshold.Poverty gap estimates show that the depth of poverty in the 3 medium-sized towns is about 35 percent ofthe relative line set at 50 percent of the mean expenditure. These poverty gaps are large by Central andSouthem European standards. However, in nominal amounts, the gaps are not so large. Based on therelative poverty line, an average poor individual needs 737 leks per month (US$7.76) to reach thepoverty line. The poverty gap is less for Tirana, averaging 16 percent of the poverty line (360 lek permonth).
-40-
Box 3.1: Data Sources and the Urban Sites
Data sources. Since only one data source (the Tirana Household Budget Survey) was available at the time of preparingthis report, much of the data and information that was needed to compile this chapter had to be gathered. There are fourdata/information sources used in the analysis, of which the first three were gathered specifically for purposed of thisreport:
* Background Poverty Study. The purpose of this study was to investigate how the population views poverty, bothbefore and after reform. This investigation included a review of the literature, and interviews.
* Urban Household Survey. A non-representative survey was conducted in three cities and peri-urban Tirana inJanuary 1996. A team of local interviewers administered 471 questionnaires in three medium-size cities (Elbasan,Fier, and Lezha), and another 52 questionnaires in four neighborhoods within or bordering the administrativeboundaries of Tirana, where there is a substantial migrant populatioii. (See below and Annex I)
* Qualitative Assessment of Poverty in Urban and Peri-Urban Areas Surrounding lTirana. In addition to the quantitativesurvey, a local team of interviewers conducted in-depth interviews with 40 households located in the Tirana Districtand peri-urban Shkodra. The interviews focused on the reasons for migrating to the cities, survival strategies,problems encountered in securing housing and urban services.
* The Household Budget Survey for Tirana. 1993 and 1994. This survey had been conducted by the Albanian Institutefor Statistics (INSTAT) in 1993 and 1994. The survey covered 3179 households, although income and expenditureinformation was collected only over a subsample of 807 households. The same sample was used in both 1993 and1994. Analysis of these data were undertaken by INSTAT. (this input is still awaited}
Urban household survey. In assessing urban poverty, it was important to select a (non-representative) sample ofhouseholds located in various urban settings in different parts of the country. To ensure a diversity of cities, the surveycovered Tirana's peri-urban neighborhoods and three medium-sized cities: Elbasan, a city with high unemployment; Fier,a city where the incidence of international migration is high; Lezha, a city in the northeast part of Albania which is thepoorest part of the country. Together these four cities account for around two-thirds of Albania's urban population.
* Elbasan is located in the central part of Albania in a plain near the banks of the Shkumbini River. Surroundedby mountains, the city has a population of about 110,000. While Elbasan was an imiportant industrial city in the past,many of its factories (most notably the steel works) have closed during the past few years. The closing of these factoriesled to massive unemployment -- in excess of 40 percent. Consequently, many people, especially young men, havemigrated to Greece, Italy, and other European cities to finds jobs. They remit money to their families.
* Fier is one of the most economically important cities in the southeast part of Albania. Having experiencedgrowth during the past 10 years, the city now has a population of OO,000. Because Fier is located near oil producingareas, many of the city's workers are employed by the oil wells or related enterprises such as oil production. Additionalworkers are employed by a chemical factory, thermo-power station, andl smaller factories. Numerous factories in Fier,however, have closed and unemployment is quite high, at around 20 percent. In comparison to Elbasan, Fier has a muchhigher incidence of international migration and homes receiving remittance income.
* Lezha is located in the northern part of Albania, and is a small city with a population of 15,000 people. About40 percent of the labor force works for the state; 15 percent are involved in business and private activities (for example,selling various items such as construction materials, cigarettes, clothing, food products), 10 percent have emigrated, and35 percent are unemployed. Environmental conditions are poor due to an inadequate water supply, lack of safe sanitaryfacilities, poor drainage, and poorly managed solid waste.
* Tirana as the capital of Albania, and the most prosperous town, is rapidly expanding as a result of migration.Rapid growth, which has occurred through the informal development of land, has overloaded the capacity of existinginfrastructure networks, and the informally developed areas lack adequate roads, water and sanitation, drainage,electricity, and solid waste services. Four neighborhoods (or quarters) located within these migrant areas were included inthe household survey.
Measuring poverty. In this analysis, household expenditure rather than household income is used because it isconsidered a more reliable indicator of welfare or current living standard. To account for differences in the size anddemographic composition of households, household expenditure is expressed in adult equivalent units. The OECD scaleis used with the corresponding weights of 1.0 for the first adult, 0.7 for the next adults, and 0.5 for children under 14 yearsof age. ___________________________.
-41-
Table 3.1: Poverty Incidence and Poverty Gap for Tirana and Three Other Towns, 1996
$1 (2850 lek/m) 50% Mean Expenditure"Poverty Incidence (headcount)'All Three Towns 38.4 19.6Elbasan 41.9 23.8Fier 22.3 9.4Lezha 50.3 25.0
NOTES:a. Nominal exchange rate.b. Means are 4,166 lek/m for combined Elbasan, Fier, Lezha and pen-urban Tirana 1996 data set, and 4,484 lek/m for
Tirana 1994 data set.c. Poverty incidence, or poverty headcount, is the percentage of people below the poverty line.d. Tirana household expenditure survey, 1994. (INSTAT) All other estimates are from World Bank Survey, January 1996.e. Poverty gap is the average shortfall of household expcnditure per adult equivalent as a percentage of the poverty line.
Poverty and Household Characteristics: the Poverty Profile
3.10 There are distinct socio-economic and demographic characteristics that are closely associatedwith urban poverty.
3.11 Nuclear households with 3 or more children are likely to be poor. Household size is closelylinked with poverty: the larger the number of children, the more likely the household will be poor.About 60 percent of households are nuclear in structure, with eight out of ten having 2 or more children.In these households, poverty incidence increases with the number of children (Table 3.2). Povertyincidence is highest among households with primary school children, aged 6 to 9 years old, based on therelative poverty line of 50 percent of mean expenditure. The poverty gap is also high among nuclearhouseholds with three or more children.
3.12 Extended households are more likely to be poor when they are headed by a woman. More thanone-third of families are extended, consisting largely of 3-generation families with I or 2 elderly parents,their children, and grandchildren. Poverty rates for extended households mirror the overall averageacross the different poverty lines, suggesting that extended households do not necessarily increase thelikelihood of poverty. The exception is situations where the household head is a woman. Thesehouseholds, comprising less than 10 percent of all households, have a poverty incidence twice that ofmale-headed extended households, and a higher poverty gap. Female household heads are typicallypoorly educated (primary or less), and heavily dependent on social cash transfers.
3.13 Pensioner household heads are typically not poor, but those that support other adult familymembers tend to be poor. Around 10 percent of households have an elderly member, age 60 years and
-42-
above. This group of individuals has one of the lowest rates of poverty, and the lowest poverty gap.This suggests that the old-age pension is an important social cash transfer that prevents or reducespoverty among the elderly population. Elderly individuals who live under conditions of poverty, roughly20 percent of pensioner heads, have the following characteristics. They have larger families than non-poor elderly individuals, with an average size of 5.7 members compared to 4.5 among non-poorhouseholds. They also have twice as many family members who are unemployed (that is, adultdependents). These adult dependents are mostly unemployed sons and daughters who seek refuge andfinancial security in an extended family arrangement.6
Table 3.2: Poverty Incidence, Poverty Gap and Household Characteristics, 1996
SI (2850 lek/m) 50% Mean ExpenditurePoverty Incidence Poverty Incidence Poverty Gap
Household CompositionOne adult only 20.0 20.0 37.5Couple only 9.1 0.0 n.a.Nuclearw/ I child 28.3 15.2 26.0Nuclear w/ 2 children 29.8 16.0 34.5Nuclear w/ 3+ children 38.6 19.8 43.1Extended, couple w/
children, elderly parents 35.2 17.2 30.0Extended, single
male parent + children 66.7 66.7 40.3Extended, single
female parent + children 74.1 29.6 42.4Couple + other adults 50.0 0.0 n.a.
No. of children (0-14 years)0 32.4 15.7 30.61 36.0 15.3 37.12 35.1 21.6 38.33 or more 48.9 25.5 41.8
No. of unemployed0 24.1 14.9 n.a.1 39.9 28.4 n.a.2 38.6 24.3 33.53 or more 49.4 40.5 36.0
Total 38.4 19.6 35.4
6 One family in the Old Selite neighborhood of Tirana consisted of an elderly couple and their married sonand his wife. The family came to Tirana 13 years ago. They purchased their home from the legal owner and havethe tapi for the house and the land on which it is situated. The family lives solely on the pension income of 2,500 lekper month. The house is in very poor condition with the ceiling in need of serious repair. The son is unemployed asis his pregnant wife. The family is now worrying about how they are going to pay for the costs of delivery andhaving another person to feed on such a meager income.
-43-
3.14 Unemployment is a significant determinant of poverty. The impact of job losses as a result ofeconomic restructuring continues to affect the lives of many urban Albanians. The 1996 householdsurvey found about one-third of working age individuals not formally employed, and the majority (two-thirds) of these people are young, between 15 and 35 years old. More than half have primary educationand about 44 percent have secondary education or vocational training. Regardless of the poverty lineused, the findings show that an individual's employment status is a strong predictor of poverty. Theincidence of poverty rises sharply as the number of unemployed members increases, especially for thosehouseholds with three or more adults that are unemployed (Table 3.2). Further, nearly everyunemployed member has been out of ajob continuously for more than one year. About 35 percent of theunemployed live in extended three-generation households and one in four are in nuclear households withmore than three children.
3.15 The link between poverty and unemployment is particularly evident among household heads.One out of every four household heads, average age of 41 years, is unable to support a family throughincome earned from work. Nearly all unemployed heads (97 percent) lost their jobs as permanentemployees in state-owned enterprises. Not only is poverty more widespread among unemployed headsbut they also suffer from deeper poverty. The majority of poor unemployed heads live in nuclearhouseholds with 2 or more children, many of who are under 14 years. Poor unemployed heads of nuclearhouseholds have neither the economic security of a regular wage income nor the added benefit ofextended family support, which, in a number of instances, can provide a diversified income base. Aboutthree-quarters of their income comes from social assistance and unemployment benefits.
3.16 Education makes a differencefor many, but not all. There is a strong correlation betweeneducation and poverty (Table 3.3). Among household heads, poverty incidence declines the higher thelevel of education. Almost half of household heads with no formal education fall below the poverty line.This inverse relationship between poverty and education also is reflected in the narrowing poverty gap asmore years of schooling is attained.
Table 3.3: Poverty Incidence, Household Expenditure and Education of Household Head, 1996
Education of Household HeadNone Primary Vocational Secondary University All heads
Average expenditure/adult equivalent(lek per month) 3075.7 3494.0 3746.7 4407.6 5598.4 4165.5
Poverty incidence' 46.2 19.3 17.9 15.8 6.7 19.6
NOTE: a. Below 50% of mean expenditure poverty line.
3.17 The education-poverty relationship works primarily through the labor market. While theeconomic restructuring in Albania affects working individuals across occupational groups, regardless ofeducational attainment, university-educated heads of households are less likely to be unemployed than allothers, thereby escaping poverty.
7 The level of education and employment status of household heads further explains why households in Fierare less likely to be poor. Fier has roughly twice as many households heads with university diplomas orpostgraduate degrees (31 percent) than in Lezha (16 percent) or Elbasan (11 percent). Consequently, the incidenceof unemployment is also lowest among household heads in Fier (14 percent) compared to Elbasan and Lezha (30and 35 percent, respectively).
-44-
3.18 Poverty status is afunction of the mix of sources of household income. There are importantdifferences in the composition of household income between the poor and the non-poor (Figure 3.1).One-half of households rely on wage income. The second most important income source for 40 percentof households is pension income. Among the poor, however, wage income is second to pensions as themost important income source, followed by social assistance (ndhime ekonomike) and unemploymentbenefits. Based on the lower relative poverty line (50 percent of mean expenditure), social incometransfers make up about two-thirds of the poor's average monthly income, compared to only one-third fornon-poor households. Non-poor households are also likely to have more than one source of earned-income. One out of five non-poor households receive remittances from a relative working abroad, and asimilar proportion earn additional income from a business activity. Less than 10 percent of poorhouseholds receive remittances and/or have businesses. Finally, the small proportion of householdsearning agriculture-based income also are more likely to be non-poor households.
Figure 3.1: Income Sources of Poor and Non-Poor Households(based on half of mean expenditure poverty line: Elbasan, Fier and Lezha)
Wagesr
Pensions
Unemployment benefits
Ndihme Ekonomike
Remittances (local and abroad)
* PoorBusiness
- - - - - - - - - -~~~~~~~~~~~ Non-poor
Other
0 10 20 30 40 50 60
% of households
3.19 Low asset ownership is positively correlated with poverty. Not only do poor households havelower incomes, they also have fewer assets that can be sold or traded to meet consumption needs in timesof an emergency or household crisis (Table 3.4). Based on a simple asset index, poor households have
8an average index of 2.6 compared to 4.2 for the non-poor . The consumer durables most commonlyowned by households are television, refrigerator, and radio. More than 50 percent of poor householdsown these items. (Households receiving remittances have the highest asset index (5.1) of all households.Also, they are twice as likely to own farmland.)
8 Each type of asset (consumer durable) owned by the household was assigned a score of 1. A total score ofassets per household was then calculated to arrive at an average index. (See Demery and Grootaert, 1993 formethodology.)
-45-
Table 3.4: Asset Ownership by Poverty Status and Remittances from Abroad (% of households)
Poverty Status' Remittance Income From Abroad All HouseholdsNon-poor Poor Non-recipient Recipient
b. Refers to average number of assets owned (consumer durables only).
3.20 While food is the largest expenditure item for both poor and non-poor households, the poorconsume less. Urban households spend a major share (70-75 percent) of their monthly householdbudget on food, followed by electricity (12 percent) (Figure 3.2). According to the survey data, the poorhave a smaller food expenditure share than the non-poor, but a very high expenditure share on electricityand heating. Those living below the lower poverty line spent, in the month of January, an average of 23percent of their monthly expenditure on electricity and heating (Annex 3, Table 8).
O _ - I -In -6I_ Food Electricity Health Other utilities Clothing Other*
These findings on food shares are unusual. They may be a function of inadequate information given in theinterviews. On the other hand, the survey was conducted in January, one of the coldest months of the year, andshort-term expenditure on electricity and heating might reduce expenditure on food.
-46-
3.21 The poor spend a very large part of their monthly food expenditure on bread alone. Theytypically consume less, about half of the average non-poor household's weekly consumption of meat,milk and yogurt, vegetables, and potatoes. In many instances, poor households modify their dietarypatterns by consuming inexpensive and less nutritious food. This has serious implications for the laborproductivity of working adults as well as the health and nutritional status of mothers and their youngchildren.10
Poverty and Household Conditions
3.22 The profile of urban poverty presented above is a snapshot of the poor based on their discreteposition with respect to an income benchmark that classifies them as either poor or non-poor. Thesestatistics, however, tell only part of the story. The following section discusses how the urbanl poor live,their physical, environmental and social conditions, and their access to urban services.
3.23 A starting hypothesis for this work was that those at or below any given poverty line would haveworse living conditions than those of the non-poor. For example, it was expected that the poor wouldhave significantly lower levels of home and land ownership, lower access to urban services, and greaterdifficulty meeting basic needs than those whose incomes fall above the poverty line.' The findings ofthe fieldwork and the data analysis reveal, however, that this is not necessarily the case. Those whoseincome are above the poverty line, however it is defined, can be just as disadvantaged as those identifiedas poor. Similarly, the migrants' responses to the survey questions indicated that their situation was notdramatically different from that of the non-migrants (Box 3.2). In general what emerges is that theconditions of the urban environment are hard for all inhabitants, and only gradually as some families areamassing resources are they able to make modest improvements to their immediate environment (i.e.their home). For the rest, urban infrastructure and services are beyond their control, and there is little thatcan be done individually to arrest the declining quality of public services (such as health, education,garbage collection) and make good the decades of under-investment in urban infrastructure. These arebroader community, local government and central government responsibilities.
3.24 Income level affects home and land ownership, but not to a large degree. IJrban housingconsists largely of single family homes and apartments. Most of the houses and apartments are verysmall, with the average household of four to six people squeezed into a 30 square meter space dividedinto two or three rooms. The houses and apartments are poorly insulated with evidence of substandardworkmanship and neglect of needed repairs. Whether they live in houses or apartments, however, mostof the families interviewed revealed that there is a high incidence of home and land ownership, evenamong a substantial proportion of migrants. However, a smaller percentage of the poor own their housesor apartments as well as the land. More specific findings are:
* In the 3 medium-size cities, most households (92 percent) own their housing unit with thenon-poor (93 percent) owning their unit somewhat more often than the poor (83 percent).Less than half of all households own the land on which their house is situated, with the non-poor reporting higher levels of land ownership than the poor (50 percent versus 32 percent).A smaller percentage of households in the Tirana neighborhoods own their home (69percent) but a higher proportion own the land (62 percent), with no significant differencebetween income groups.
10 During one household interview with a poor family in Mihal Grameno, the mother of a four-year old boyfed her son a piece of bread with butter for dinner.
I I In this section, all references to poverty are based on the lower relative poverty line of 50 percent of meanexpenditure per adult equivalent.
-47-
Box 3.2: Recent Migrants to Tirana
One out of every three households interviewed in peri-urban Tirana was a migrant family who had moved to Tiranawithin the past five years. Almost one-half came from another city in Albania and about one-third came from arural area. For the majority of families (60 percent), their decision to relocate was driven mainly by their desire tofind a job, to have better income opportunities or to improve their overall living conditions, while others (32percent) had hopes of finding better housing conditions.
Based on the sample of households interviewed, migrant families are broadly similar to the average native residentsof Tirana with respect to household structure and income. But there are some distinct characteristics observedamong the migrant households:
. Migrant heads of households are younger on average (42 years) than non-migrant household heads (52 years).
. None of the migrant households had a female head. Consequently, there also are no single parents among theheads of migrant households. Discussions with migrant household members revealed that the men in thehousehold, usually the father or the son, move to the city first to lay the groundwork for the rest of the family tofollow.
. Although migrant households have a slightly higher average number of unemployed members (2.3) than non-migrant households (1.6), their average expenditure per adult equivalent shows that they are not necessarilypoorer (4,277 leks/month compared to 4,587 leks/month for non-migrant).
* Next to wages, profits from businesses and other entrepreneurial activities is the second most important sourceof income for migrant households. Both of these sources constitute about one-third of the total householdincome. About 12 percent of income comes from agriculture which suggests that migrants, particularly thosewho came from the villages, are maintaining economic ties with the rural areas.
* Among migrant households, there is low asset ownership with an asset index of 3.5 versus 4.6 for non-migrants. They are less likely to own a washing machine, refrigerator, freezer, television, or a sewing machine.
With regard to home and land ownership, about the same percentage of migrants and non-migrants own theland on which their house is situated. But only 78 percent of the migrants have the necessary legaldocument (tapi) for the land, compared to 91 percent of non-migrants. Migrants receive more water thannon-migrants. Among the Tirana respondents, migrants are better off than non-migrants with respect tothe availability of piped water. With regard to priority household problems, a higher proportion of non-migrants than migrants mentioned economic problems and unernployment as their households' priorityproblems.
* Households that do not legally own their house or land encounter numerous hardships. Forexample, unregistered families cannot collect social assistance from, or obtain state sectorjobs in the city in which they are now living. They also do not have the legal right to enrolltheir children in local schools.
3.25 Overcrowding is an indicator of poverty in Lezha and Tirana. While the total house orapartment size of poor households may be larger than the non-poor, average housing density figuresshow that there is no significant difference between income groups. Within Lezha and Tirana, however,there is more overcrowding in poor households than in the non-poor households.
3.26 Both the poor and the non-poor receive largely inadequtate urban services and are exposed tounhealthy environmental conditions. While there are some differences in service levels that reflectincome -- for example, the location of the water tap and toilet (indoor versus outdoor) and the type of thetoilet available ("western versus eastern") -- the type and quality of most household services providedgenerally have little to do with income (Table 3.5).
-48-
Table 3.5: Household Services for the Poor and Non-Poor*(as a percentage of households with service)
*Based on a poverty line of 50 percent of mean expenditure per adult equivalent, i.e the lowest poverty line.
3.27 Both the poor and non-poor have similar access to water supply, and both the poor and the non-poor are exposed to unhealthy environmental conditions. While there are service level differences thatreflect income, the type and quality of the water supply service of most households are similar for bothgroups. For example, piped water from the public water supply is the main source of water for almost allof the households, regardless of income level. And most (82 percent) have indoor taps. Excluding thegroup that has water 24 hours a day (30 percent), households in these cities receive piped water onaverage 6.5 hours a day. While most households receive water on a daily basis, there was no significantdifference in daily water availability between the poor and the non-poor.
3.28 The poor and the non-poor receive the same level of service largely because higher incomehouseholds generally are located in the same neighborhoods and buildings, and on the same floors as thelower income households. In some cases, however, the poor have some disadvantages. In the 3medium-size cities, for example, a lower percentage of poor households (77 percent) have an indoor tapas their main water source than non-poor households (86 percent). Moreover, among the households thatreported leaky taps (24 percent of the total sample), poor households tend to have more leaks than thenon-poor.
3.29 Poor sanitation conditions affect all groups. All income groups have similar sanitationconditions. In the 3 medium-sized cities, 75 percent of the respondents reported that they are connectedto the central sewerage system, despite their income level. In Tirana, the survey revealed that a higherpercentage of the poor and migrants are connected to the sewerage system than the non-poor and non-migrants. Nonetheless, more poor households than non-poor households have an outdoor bathroomfacility consisting of a hole in the ground or some remnants of a squat plate inside a poorly constructedshack in their yards.
3.30 Infrequent solid waste collection affects the poor and non-poor. Most (93 percent) of therespondents dispose of their household waste simply by throwing it outside their home. Only slightlymore than half of the respondents in the 3 cities (54 percent) indicated that solid waste is regularlycollected, with no difference between the poor and the non-poor. In Tirana, however, migrants receive alower level of solid waste collection service than non-migrants.
3.31 Household location is more important than income in determining adequacy of publicservices. The general quality of urban services such as water supply, sanitation, and solid wastemanagement differs more by city than by income level. For example:
-49-
* Only 62 percent of the respondents of Fier have water every day, while 90 percent of therespondents of Elbasan and 85 percent of the respondents of Lezha receive water on a dailybasis. On average, most households in Lezha receive water 12 hours a day, while theaverage household in Elbasan and Fier receive water 6 and 5 hours a day, respectively.
* Tirana has the most inadequate sanitation system among the surveyed cities. In contrast tothe other cities, where over 70 percent of the households surveyed are connected to thecentral sewerage system, only about 35 percent of the sampled households in Tirana areconnected to the central sewerage system. Another 56 percent use septic tanks.
* Households in Tirana are receiving a lower level of solid waste collection service than thosein the other cities. Whereas 54 percent of the households in the other cities receive regularsolid waste collection, only 28 percent of the Tirana's households report that they haveregular solid waste collection service.
Priority Household Problems and Coping Mechanisms
3.32 Notwithstanding the many deficiencies in housing and urban services among the areas surveyed,most survey respondents did not mention these problems when asked to identify their households' mostimportant or priority concerns. As discussed below, income insufficiency in general, and unemployment,in particular, emerge as household priorities.
3.33 Unemployment is the biggest problem for both the poor and the non-poor. When asked toidentify their households' most important household problems, about half of the respondents mentionedlack of income (Figure 3.3). Both the poor and non-poor focus on these concerns, indicating that bothgroups are confronting similar problems, although the latter may have better mechanisms for coping withthese conditions. Thirty-two percent of the respondents were more specific about their economicproblem and mentioned unemployment as their household's priority problem. Again, there was nosignificant difference between the poor and the non-poor with respect to this problem. In fact, there wasa higher percentage of the non-poor than the poor who mentioned unemployment as a priority.
Figure 3.3: Priority Problems in Elbasan, Fier and Lezha
Economic problems l
Unemployment _ _ _ _I_:
Poor housing
Water supply problems
Other g Poor
d !Non-poorSewerage problems - ---
Solid waste problems
0 1 0 20 30 40 50 60 70
% of households
-50-
3.34 Both the poor and the non-poor adopt similar coping mechanisms. Because income generationcontinues to be, or has become even more difficult during the year prior to the interview, both the poorand the non-poor cope with their situations by finding new sources of income or by adopting otherstrategies. The various coping mechanisms are:
* Finding new sources of income, such as temporary jobs, setting up a small shop or business,receiving remittances from relatives abroad, receiving help from family and friends, andselling various items on the street. Many people now have two jobs, and in some cases the"extra job," is illegal (for example, working off the books for a private enterprise).
* To cope with a difficult life, families have either reduced or postponed certain expenditures,with virtually no difference between the poor and the non-poor. The main types ofexpenditures sacrificed include home repairs, furniture, and a combination of severalexpenditures. Around one quarter of families have consumed less bread during the past 12months, and 33 percent of the respondents said that they consumed less food items other thanbread, particularly meat and fish, and vegetables and fruits.
* Only 10 percent of the families interviewed operate garden plots either to grow their ownfood, and in some cases, sell produce. According to the survey, 9 percent of the non-poorhave a garden plot, while 13 percent of the poor own a plot of land. Poor families withfemale heads are more likely to own a garden plot than those with male heads, andhouseholds in Lezha are more likely to have a garden plot than those in Elbasan or Fier.
* During the past year, more than one third of families interviewed had to use their savings tomeet expenses, 30 percent had to fall behind in the repayment of debts (with 50 percent ofthe poor falling behind), and another relatively small percentage of respondents (21 percent)had to give less help to other family members. In Tirana, a significantly larger proportion ofhouseholds, particularly migrants, had to take money out of their savings.
* For many poor Albanians, getting enough food or necessary medical care will depend onhow much help is provided by family, friends, and neighbors. In the 3 cities, the majority(67 percent) borrowed from relatives or friends. In Tirana, 26 percent of the respondentssaid that they had to borrow to make ends meet (Box 3.3).
- While some of the unemployed who worked for state companies received unemploymentbenefit during the past 12 months, other respondents (38 percent) have applied for socialassistance. Among the poor, a little more than half said that they applied for this support.But they did not always receive the assistance, largely because the household did not qualify.
Box 3.3: Borrowing to Supplement Income
Many families borrow money to supplement their incomes to cover daily expenses, to cope with unexpectedexpenses such as hospitalizations, or to start or complete house construction. Despite the strong family networks,there appear to be clear distinctions between exchanges of money within the household, and between relatedhouseholds. For example, exchanges of money between working-age children are not referred to as loans; the onlytime a respondent indicated that he "borrowed" from a parent was when the children and parents lived in separatehouseholds. By contrast, exchanges of money between siblings, even cousins, take the form of loans, usually of nofixed term, and without interest. Similarly, the frequent small loans that pass between friends and neighbors, eventhe larger loans between close friends, are without interest. People also have been forced to borrow frommoneylenders, usually at around 5 percent monthly interest. And such indebtedness has become a major problemfor many poor families. In some cases, it threatens families with the loss of their homes, which they often put up forcollateral.
-51-
CHAPTER FOUR
PROSPECTS AND POLICIES FOR POVERTY REDUCTION
4.1 Significant progress in macroeconomic stabilization, sweeping structural reforms, massiveemigration and substantial inflows of concessional foreign aid have all contributed to the remarkablegrowth recovery in Albania over the last three years. Privatization of farm land has given the large ruralpopulation -- at a minimum -- a safety net, and in many cases a basis for more significant income growth.In the urban areas, private business opportunities, self-employment and remittances from emigrants havegiven the population a critical boost, and helped counterbalance huge public enterprise job losses. Bothrural and urban populations alike have benefited from the introduction of a social safety net, comprisingunemployment benefit and social assistance, but both have had to cope with very poor infrastructure anddeclining public and social services. But while the economic successes have raised the incomes of theAlbanian people, a large part of them remain poor -- indeed, very poor by European standards. Thisreflects the inheritance from the past, especially the last half century which did little to improve theliving standard of most of the population. Together, decades of economic mismanagement, rapidpopulation growth, a low per capita arable land area and mass loss of unviable jobs have all contributedto making Albania a very poor country with a large number of poor people. Many years of sustainedeconomic growth, well in excess of the annual population growth rate of close to 2 percent, will beneeded to bring Albanians close to the income level of people in other southern and central Europeancountries. This chapter discusses the policy framework that is needed to achieve this outcome.
4.2 This chapter is organized in the following way. It begins by recalling the essential elements ofthe poverty profile (within the serious confines of the data limitations) and their regional dimensions.The chapter then goes on to discuss two complementary sets of anti-poverty policies: those that arecritical to the perpetuation of a high growth rate that will benefit the bulk of the population, and thosespecifically targeted at the poor. The chapter attempts to offer both broad and more specific policyrecommendations wherever possible in both of these areas. However, it is not possible to providespecific recommendations everywhere due to lack of information. Subsequent Bank reports (such as theforthcoming Country Economic Memorandum: CEM) will address some of these voids, and provideadditional details.
4.3 Poverty incidence. The absence of nationwide, comprehensive household data render povertyanalysis difficult, and will continue to hanper the ability to develop an effective poverty reductionstrategy for Albania. Moreover, the situation is very fluid, with populations moving from rural to urbanlocations, in- and out-of country, and businesses springing up one day and failing the next. One of thekey recommendations of this report is that Albania launch a nationwide survey of household incomesand expenditures to help better quantify the extent of poverty, characterize the poor, understand betterthe importance of new sources of income, and aid public policy and program design. The bestestimates that can be derived from available information suggest that around 30 percent of the ruralpopulation (approaching 600,000 out of a total of 1.9 million), and around 15 percent of the urbanpopulation (185,000 out of an urban total of 1.3 million) are in poverty relative to the rest of thecountry's rural and urban populations.1 On the basis of these figures, around one-quarter of thepopulation nationwide is in relative poverty. (No absolute measure of poverty can be made.) Although
I The poverty lines are derived from two different data sets: one for the rural areas and one for the urbanareas. Both lines are relative lines, drawn at 50 percent of mean expenditure per adult equivalent. If the rural line isinflated by 25 percent to proxy non-farm income (the data set captures only agricultural incomes), the value of thetwo poverty lines is identical (25,000 lek p.a.). In this way, rural and urban poverty estimates can be reasonablycompared.
-52-
the orders of magnitude cannot be precise, all evidence suggests that poverty is more pervasive amongthe rural population than the urban population', but, generally speaking, poverty in the rural areas is lessdeep than in the towns. This reflects the role of land in the rural areas, providing a private safety net,whereas the unemployed urban populations have no such private safety net other than relatives -- theyare entirely dependent on the social safety net, which may or may not be reaching them. The maincorrelates of (income) poverty are very small farms, few animals and poor off-farm income earningopportunities in the rural areas, and unemployment due to mass public sector job destruction in the urbanareas.
4.4 Regional issues. All indicators suggest a regional dimension to poverty, which to some extentcuts across the rural-urban distinction. For example, coastal rural areas have a poverty incidence that islower than most towns. Poverty is most pervasive in the north/northeast, which is predominately ruraland mountainous, and where close to half of the population are in poverty.3 Here, average land holdingsare small (less than 0.5 hectare), farm incomes are low (especially cash incomes from marketedproduce), there are very limited opportunities for off-farm employment, the fertility rate and infantmortality rate are higher than elsewhere, and there is evidence of malnutrition in infants and young
4children. Even the towns of the north, e.g. Lezha, have a higher poverty incidence and depth than someother towns. Outside the north/northeast there are substantial pockets of poverty in both rural and urbanlocations. For example, very poor people can be found in the mountains around Pogradec and in thedistrict of Gramsh. With regard to the towns, those with the highest rates of unemployment, e.g. Elbasan,are particularly vulnerable to poverty, as are those whose rural hinterland is producing very little. Bycontrast, "old town" Tirana has a lower poverty rate.5
4.5 Access to public services. Most rural and urban populations are faced with poor physicalinfrastructure (roads, water supplies and sewerage systems) and deteriorating social services (health andeducation). This reflects both decades of under-investment, and declining fiscal revenues in recent years.There are some variations in quality and access to public services -- for example, Tirana has the mostinadequate sanitation system of all major towns, rural areas and emerging peri-urban settlementsgenerally have worse access to public health services and schools compared to established towns -- butthere is no obvious distinction between the poor and the non-poor since entire communities are thetypical service unit. This may, however, be changing as the notion of "user charge" or "fee for service" isbeing introduced for many public services, including health and education, thus imposing a direct cashcost on service use, a particular problem for people with little disposable cash incomes (e.g. subsistencefarmers).
Promoting Economic Opportunities for the Poor
4.6 Because of the pervasiveness of low incomes and continuing population growth, sustainedeconomic growth is the key to poverty reduction in Albania. Since most of the poor (and non-poor)depend on income from labor -- from work on their own land, from wages, or from self-employment --the optimal growth pattern is one that promotes broadly based rural development and urban employment
2 The predominance of the poor in the rural areas is a similar pattern to much of central and southern Europe,but it differs from FSU countries where poverty is more common in the urban areas.
3 These are the districts of Bulqize, Dibra, Has, Kukes, Mat, Mirdite, and Puka.
4 Within this region, however, there are important variations: for example, the districts of Mirdite and Pukehave the lowest average farmn sizes; Diber and Kukes have the highest incidence of social assistance payments; andHas and Bulquize have the highest infant mortality rates. Within districts, and constituent communes and villagesone would also find further variation.
5 Some of the emerging areas of Tirana, the peri-urban areas, have higher poverty rates.
-53-
and self-employment. This, together with emigration for work, is not dissimilar from the growth paththat Albania has followed in the past three years. But, from the initial low base and the correction ofinherited major distortions, rapid growth has, this far, come easily, especially in agriculture, construction,services and small businesses. Moreover, this growth was fueled by investments stemming fromremittances (private capital flows from abroad), and concessional aid -- capital sources that cannot bedepended oni for the future. While every effort should be made to promote the continuation of thesesources, new sources of capital will be needed to underpin a dependable and sustainable growth path forthe future. Recent improvements in private and public domestic savings augur well in this regard, andfurther measures that help create conditions for mobilizing domestic and foreign savings to sustain highlevels of investment are desirable. (For example, further reforms in the banking sector are needed tomobilize and intermediate private savings, greater effort at mobilizing revenues to raise public sectorsavings, as well as policies that continue to promote low inflation and a stable exchange rate.)
4.7 There are four basic elements to the "growing out of poverty" strategy:
* rural development: maximizing the growth potential of the agricultural sector, andpromoting up-stream and down-stream linkages with agriculture to develop off-farm ruralemployment;
* urban development: facilitating self-emplovment and private small- and medium-enterprisedevelopment in the urban areas;
- public expenditure: ensuring efficient public expenditure/public investment to underpinprivate sector growth in both rural and urban areas, and creating a healthy and well-educated,flexible labor force; and
* mobility and migration: facilitating the mobility of the population to move from areas oflow economic potential to areas of higher economic potential.
Rural Development
4.8 Agricultural growth will continue to be the driving force behind rural development, butincreasingly off-farm income-eaming opportunities will be kev. Although the coastal lowlands and theeastern plateau are particularly fertile and water abundant, Albania has limited arable land. Rapidpopulation growth has put tremendous pressure on the land. Moreover, agriculture is supporting agreater part of the labor force than hitherto (65 percent in 1995 compared to 22 percent in 1990).Following the land reform of the early 1990s, one-fifth of the rural population has a farm that is smallerthan half a hectare; two-fifths of the rural population live on farms of less than one hectare. Even thesmallest farms are divided into three parcels, often some distance apart.
4.9 At a minimum, consolidation of parcels needs to take place to facilitate more efficient use ofland and time, and for farmers to have greater security oxer crops and livestock. Beyond this,consolidation of very small plots into larger plots is a likely devclopment once the land market begins tooperate. To facilitate this, greater administrative effort is needed to finalize the titling of land in orderfor land sales to occur.
4.10 In the more immediate future, widespread ownership of small plots, critical to short-termpolitical and social stability, household food security and equitN goals, can probably be consistent withcontinuing growth in the agricultural sector. Thus far, output growth has occurred across all farm sizes,in the main largely due to a switch in production, out of wheat into higher value crops and livestock. 6Although the bulk of agricultural production remains for own consumption, trend analysis suggests that
6 A large part of the micro-credit program of the Albanian Development Fund has financed livestock.
-54-
more produce, especially livestock and dairy, is making its way to market, thereby giving farmers muchneeded cash incomes. At some point in time, because of their very small hectarage, many farms willreach the outer bounds of their growth potential, and subsequent growth in the sector is likely to beconcentrated among the larger (> 1.5 hectares) holdings in the coastal area and plains, where advancedtechnologies and cropping patterns can be introduced. Only part the population (i.e., the 35 percent thatcurrently occupies these holdings) will benefit directly from this phase of growth. Yet internationalexperience demonstrates the positive impact of a dynamic agricultural sector on the rest of the ruraleconomy: growth in demand for farm labor, up-stream and down-stream farm-related services, and forproducts of the rural non-farm sector is all to the benefit of the rural population at large. In particular,poor farmers with very small plots of land will have the opportunity to supplement their farm incomewith income from other rural activities.
4.11 Public policy should also be aimed at providing adequate conditions for high levels of privateinvestment in support services in the areas with greatest growth potentialfor the domestic market andfor export, i.e. the coastal plain. To this effect, a number of measures could be considered. First, credit,vital for production and investment, is severely constrained by the insufficiently developed financialsystem. The rehabilitation of the Rural Commercial Bank and the development of other avenues for ruralcredit beyond those provided under the ADF, should be a first priority. Bureaucratic and regulatoryimpediments to the growth of employment intensive businesses should be removed. The publicinvestment program should give appropriate weight to the requirements of rural and agriculturalinfrastructure, especially those elements that are likely to foster private investment in agriculture. Thesethemes will be taken up in the agriculture sector strategy part of the forthcoming CEM.
4.12 Non-farm income is already a critical source of income for many farming households, and itsimportance can only increase in the future. As discussed above, for much of the rural population (thosefamilies with less than one hectare of farm land), land and farming can at best be one prong of anincome-generating strategy. Progress with poverty reduction will depend on access to alternativeemployment and business opportunities either in-country or abroad. But for some -- the elderly, the sick,and women with young children7 -- taking on extra work and/or migrating to town is not an option. Forthese people, social transfers will be critical (See below).
Urban Development
4.13 Albania is currently the least urbanized country in Europe with only 40 percent of the populationliving in cities and towns. Rural-urban migration has already swelled the ranks of the urban populationand this trend can only gather momentum as the rural sector sheds people. A major concern for thosewho have migrated to the towns is the absence of secure land tenure. To address this problem thegovernment should consider (a) adopting a relatively low-cost and rapid means for clarifying landownership and registering properties, and (b) providing temporary registration that ensures that migranthouseholds have access to schools and health facilities, and can obtain business licenses. Rural-urbanmigration is puttin1g tremendous pressure on urban infrastructure and services, already poor andinadequate due to decades of under-investment. The pressure on jobs, small business opportunities aswell as housing, infrastructure and urban services is mounting. Thus far, people are finding new sourcesof income (other than public sector wage employment) which can be employment abroad, starting asmall business or selling on the street, or having two or more jobs, but other less-welcomed coping
7 The ADF's rural infrastructure program was launched with a public works philosophy as well asresponding to the need for rural infrastructure. It soon emerged that as a public works program, it would have littlesuccess since (a) there was a strong coincidence with the seasonality of agricultural labor demand, (b) surplus youngmale labor migrated out, and (c) the poorest households had no able-bodied labor to supply to the program. Themodus operandi of the program switched to one of hiring contractors to undertake the work.
-55-
strategies, such as consuming less food, including bread, and switching to cheaper foods, selling assets,dis-saving and borrowing, and as a last resort withdrawing children from school to help earn money, arealso evident.
4.14 Albania lost around 350,000 jobs in the years 1990-95, half of all jobs outside agriculture, a largeproportion of which were urban based. Despite some recent growth in employment, stemming from self-employment and small business development, urban registered unemployment is still around 30 percentof the labor force. In some towns, e.g. Elbasan, it is close to 40 percent. While over-stating the truesituation due to informal employment and illegal activities, urban unemployment and withdrawal fromthe labor force (discouraged workers) is of immense proportion. The average family now has only onewage earner as compared to two in the past. There is a strong association between unemployment andurban poverty. Employment promotion, including self-employment and small business opportunities, is,therefore, the essential precondition to a reduction in urban poverty.
4.15 Promoting self-employment and private small and medium-enterprise development in the urbanareas would be well-served by ensuring that the necessary legal, regulatory and institutional frameworkis conducive to small business growth (to be further discussed in the forthcoming CEM), by expandingthe scope of small business advice (especially), quality assurance and marketing, and providing small-scale urban credit and other financial sector reforms. The latter would complement remittance incomewhich for the past several years has had a significant impact on1 the rise of small business activity in theurban areas. The recently approved IDA credit in support of ADF micro-enterprise activities in urbanareas represents an important start in this respect, but like the rural program, a credit scheme catering forslightly larger enterprises is also needed. Progress with the privatization of public utilities, especiallyelectricity, in so far as it improves the regularity of power supplies to small businesses is essential, butthis must be predicated on full cost recovery principles.
4.16 Urban environmental problems are threatening Albania's cities, and as the urban populationgrows, the negative health and environmental effects normally associated with poor sanitation and wastemanagement will undoubtedly get worse unless the necessary urban services are upgraded. While majorinvestments in water supply and sanitation are under consideration in Elbasan, Fier, and Lezha, attentionalso should focus on additional urban services such as solid waste management and drainage. Indesigning these improvements in infrastructure and services, efforts should focus on standards ofservice and cost recovery that are appropriate to Albania's income level, together with fundedprovisions to provide life-line access to electricity, water and sanitation for the poorer urban households.Although the infrastructure and urban service requirements of the emerging peri-urban areas are easilyapparent, the needs of the more established inner-cities should not be disregarded.
Public Expenditure and Investment
4.17 Unlike many former centrally planned countries, the role of the state has been reduced rapidly inAlbania. Agriculture, accounting for 56 percent of GDP, is almost entirely in the hands of the privatesector. Construction, transport, trade and services, heavily financed by remittances from abroad are alsolargely within the domain of the private sector. Even industry, though not yet substantially privatized, isincreasingly dominated by emerging small private sector companies.
4.18 In 1995, between 25 and 30 percent of GDP passed through the budget. About a third ofexpenditure was on personnel, another third on transfer payments (e.g. pensions. unemployment benefit,and social assistance), and the balance was spent on operations and maintenance, interest payments andsubsidies (minor). The capital budget, approximately 10 percent of GDP in 1995, is primarily foreigndonor financed. In the past two years it was dominated by investments in agriculture, water supply,health and education, and housing.
-56-
4.19 The demands on the public budget for infrastructure, public utilities, social services, transferpayments and the civil service will continue to be vast, yet the revenue base of the country is unlikely toprovide the resources for all these competing demands. Some growth in revenues as a share of GDP isforeseen over the next 2-3 years, primarily resulting from the recently introduced VAT system, anddonor support is likely to continue, but these will only satisfy some of the country's needs. The AlbanianGovernment, therefore, will need to keep public expenditures broadly in line with revenues (running amodest fiscal deficit), and will have to be necessarily selective in the areas it finances, including the useof donor financing, and stress expenditure efficiency to maximize the benefit of public investment.Policies that encourage private investment, both domestically financed and foreign financed, can play animportant complementary role.
4.20 There will remain, of course, a number of functions and areas of responsibility that arelegitimately and appropriately the role of the state. From the perspective of poverty alleviation, there area number of areas that call out for public expenditure (investment). The most important ones are thefollowing: education and training, urban infrastructure and services (water, sanitation, and solid waste,along the lines discussed above), roads and agricultural support services in the high potentialagricultural areas, health, and small business services and credit programs. The 1996-98 publicinvestment program (PIP) may have to be revisited to ensure that these priorities, especially education,are accorded an appropriate weight.8
4.21 Education and Training. One of Albania's key resources is its people. As discussed above, theexport of labor to neighboring countries in the post-communist period has been one of the principalengines of economic growth, and labor emigration is likely to continue to be a critical feature ofAlbania's development path for years to come, as the pressure on the land and domestic job market willbe unabating. In addition, a low wage and well-educated labor force could prove central to foreigninvestment coming to Albania. The centrality of the labor torce in bringing prosperity to Albania and tothe Albanian people calls for a concerted effort to upgrade and update the skills of those workers whowould benefit most from education and training, and who can respond to new economic opportunities.Likewise, the next generation of workers warrants attention to ensure that they are equipped to succeedin the open and competitive world labor market. In th-ie post-1990 period, there has been somedeterioration in school enrollments, and there are growing concerns over the quality and relevance ofeducation. Although in large part a reflection of the general economic environment, some of thedeterioration can be traced to declining coverage and quality of school. This, in turn, can be related tofalling public expenditure on education. Urgent measures are needed to ensure an increase in publicspending on education and training.
4.22 Health. Falling public expenditure on health, and rising direct costs associated with seekinghealth care are also of concern as they begin to have serious health status consequences. There has been
some deterioration in the health status of the Albanian population -- for example, infant mortality andadult morbidity due to infectious diseases have increased. Although a large part of Albania's healthproblems stem from over-crowding and poor water and sanitation, difficult access to health facilities, and
poor health services often fail to arrest health problem once they emerge. Improvement in the overallstandard of living of the population and further improvements in health care infrastructure, hence, willundoubtedly bring progress in the health status of the population. But these are medium and long-termgoals. In the meanwhile, other short-term strategies can be adopted that would be effective in reducingthe infant mortality rate and the incidence of infectious diseases with particular attention to low income
S The PIP accords high priority to transport, infrastructure (water and sewerage), energy and agriculture,adding up to two-thirds of all investments (compared to around half in the past two years). In comparison, plannedinvestment in education is 6 percent of the investment budget. compared to 10 percent in 1994 and 1995, and healthdrops to 7 percent from 9 percent.
-57-
families (in the rural areas) and rural-urban migrant population groups. These are presented in Annex 4.A particular problem relates to the direct costs associated with seeking health care, which are keepingsome poor urban families, and particularly elderly women, from seeking health care. Improved workingconditions and real increases in wage levels of medical personnel, as part of an overall public servicereform program, would go some way to eliminating under-the-table co-payments, but other measuresmay be necessary to ensure that inability-to-pay does not prevent poor, elderly and sick people gainingaccess to health care.
4.23 Public expenditure on pensions, unemployment benefit and social assistance all remain central topoverty prevention and alleviation (see below), but caution needs to be exercised to ensure that theappropriate incentive systems remain in tact, that a dependency on the state does not develop, and thatemployment is not over-taxed to fund these transfers. (Private transfers, extended family supportsystems, and self-help are very much in evidence in present-day Albania and should be encouraged andnot undermined by state-funded support systems.)
Mobility and Migration
4.24 Large numbers of Albanians are already leaving the land and migrating to town, responding toboth the constraints of the rural areas and the attraction of the towns. Since restrictions on internalmigration were lifted, there has been substantial de-population of the mountainous north and north-east,areas artificially over-populated under the communist regime, where land holdings are especially small,off-farm employment opportunities are few, and the poorest part of the country. (Districts borderingGreece have also lost population.) People are moving primarily to Tirana, Durres, Kruja, Elbasan,Pogradec and Shkodra, locations where income generating opportunities are perceived to be better, andwhere access to social services is a little easier. Notwithstanding the pressure that migration is putting onurban infrastructure and services, population movement from areas of low economic potential to areas ofhigher economic potential leads to an increase in economic well-being, for the individuals concerned andthe nation as a whole. Policies that support population mobility should be encouraged. Removingadministrative and legal barriers to farm land sales (discussed above), thereby giving would-be migrantssome capital, and easing the mechanism for securing land in urban locations for home construction,would be well complemented by investments in education and training to provide the migrants, and theirchildren, with the skills necessary to be effective in a rapidly modernizing urban environment.
4.25 Emigration to Italy and Greece in search of work opportunities has been a critical part of thebetterment strategy for many Albanian families in the post-communist era. Remittances from Albanianmigrants have been the main source of savings for financing domestic investment, with much of theinvestment going into housing and small business development. The prospects for emigration andremittances have important implications for the future, especially for poverty reduction. In this regard,policies that increase the chance of successful emigration for work and encourage investment ofremittances are to be supported. In this regard too, education and training, are critical. However,emigration is a sensitive issue for recipient countries and for the EU as a whole, and the continuedsupport for Albanian emigrants cannot be guaranteed. The forthcoming CEM will analyze the presentsituation in some details, and examine prospects for further emigration from the perspective of receivingcountries.
Reaching Out to the Poor
4.26 The growth policies discussed in the preceding paragraphs should benefit the bulk of theAlbanian population, who will enjoy rising disposable incomes and improved welfare. However, therewill be segments of the population -- the elderly, the sick and less able-bodied, those with little or noeducation, and those in disadvantaged parts of the country -- who may not participate in the growth-generating activities, and find themselves peripheral to the income and welfare gains. For these people,
-58-
additional policies that target them and their particular circumstances are needed. The household datasuggest that rural poverty is more pervasive yet shallower (but with some notable regional variations)compared to urban poverty which is less widespread but more severe. These observations have importantimplications for policy design.
4.27 Focused poverty-reducing policies and programs should be targeted at four population groups,two rural and two urban:
* transitional rural poor: those whose land holding is of an insufficient size to generate asufficient income to sustain a family, who need some transitional income support (e.g. socialassistance) until they are able to supplement their income from other activities. These peoplemight need additional programs to launch them into other income-generating activities, suchas credit provided by the ADF, education and training;
* permanent rural poor: those rural people who will never be able to sustain themselvesfrom farming and other income-earning opportunities -- the elderly, the sick and those livingin the poorest rural areas. These people will need long-term income support (socialassistance, pensions and, possibly, feeding schemes);
* transitional urban poor: the urban unemployed, who need income maintenance(unemployment benefit followed by social assistance) until they are re-employed, or becomeself-employed. In order to regain employment/self-employment, certain active-labor marketprograms might play a role. In the event of income insufficiency from low-wageemployment, an income supplement (partial social assistance) may still be necessary, and theobjective should be for the family to be better-off in employment than entirely dependent onsocial assistance; and
- permanent urban poor: the urban elderly and sick who are unable to participate in the labormarket, and who will need long-term income support (pensions and social assistance).
4.28 For all these four groups, income supplements (cash social transfers) and programs thatencourage re-employment need to be complemented by health, nutrition and education services thatreach out to the poor, and their children, to enable them to participate in an active life.
Social Assistance -- Ndhime Ekonomike
4.29 Since its inception in 1993, this program has played a critical role in both the rural and the urbanareas. For small-scale farmers, especially in the north and north-east, and the long-term unemployed ithas been the difference between survival and starvation. At its peak close to 20 percent of families werereceiving assistance, at a cost to the budget in excess of 2 percent of GDP. In parts of rural Albania,benefit incidence is as high as 50 percent. General rural indicators, such as average farm size, showconsiderable success with program targeting, but other indicators, such as long-term unemploymentfigures, show less success. There has been some decline in the number of beneficiaries during the pasttwo years, but the real value of the ndhime budget has fallen more sharply. The effect of this is decliningindividual payments -- between 1993 and 1995, the value of a full ndhime payment fell by 20 percent inreal terms. For families dependent on social assistance this has presented major hardship.
4.30 The analysis of this report has also revealed that some households above the poverty line arereceiving social assistance, while some households under the poverty line are not receiving support. Thisis a particular problem in the urban areas where income can be "hidden" and eligibility is more difficultto assess. Perfect targeting is rarely achieved with such programs, but improvements can generally bemade.9 Measures adopted over the past year or so (abolition of the minimum payment, part-retention of
There comes a point, however, where the costs of better targeting outweigh the benefits.
-59-
program savings by local authorities, an assessment of living conditions, and the installation of aninspectorate: see para. 4.24) should reduce inclusion and exclusion errors, but by how much remains tobe seen. A critical development will be the trend in payment levels to the most needy families for whoman increase in the real value of assistance is desirable. However, given the overall fiscal situation, anyincrease in payments to the poorest should be counterbalanced by a decrease in payments elsewhere. Inthe longer run, household surveys should permit closer monitoring of the recipients of Ndhime as well asthe closer identification of household characteristics associated with poverty, thus facilitating furtherfine-tuning of the program. '
Helping the Unemployed
4.31 Unemployment developed very rapidly in Albania as the economy collapsed, large numbers ofstate-enterprise jobs were lost, and the introduction of unemployment benefits provided an importantcomponent of the social safety net. Nonetheless, unemployment -- especially among household heads --is the main correlate of urban poverty. At one year entitlement duration and with average benefits beingslightly higher than the minimum wage, the scheme could be considered quite generous. (Other transitioneconomies have reduced entitlement periods to 6-9 months, and lowered the replacement rate.) Inaddition, it is thought that a number of unemployment payment beneficiaries are working in the informaleconomy. At the same time, the phenomenon of long-term unemployment is developing (that is, peoplebeing out of work for more than a year). This is a worrisome development as people begin to lose touchwith the world-of-work and find it increasingly difficult to hold down a job as and when one emerges.Experience from other countries shows the association of long-term unemployment, poverty and inter-generational deprivation. In the light of these observations, three recommendations are appropriate: (a)set payment levels such that they are below the minimum wage, thereby giving the right incentive toreturn to work, albeit a low wage job; (b) concentrate more resources on active labor market programs(retraining, small business start-up, public works programs, etc.); and (c) target the long-termunemployed, using a combination of active labor market programs and income support schemes topromote re-employment with an income gain. Since many of the long-term unemployed lack schooling,some basic education programs may be necessary before other labor market programs could becomeeffective.
Pensions
4.32 Pension incomes are critical for many urban and rural residents. For urban pensioners, thepension is of a sufficient amount to meet minimum subsistence needs, and they are not found to beamong the poorest. However, many households comprise three generations and pensions are often one ofthe most important sources of income for a family of five or six (figure 3.1). When spread around somany people, the pension is barely adequate, and these families are indeed among the poorest. But it isnot the place of the pension to alleviate their poverty -- other interventions should be preferred.
4.33 For rural families, pensions are also an important source of income. Among households with lessthan half a hectare of land, almost 40 percent rely on pensions as their main source of income. Given thelow value of the agricultural pension, 900 lek/month, these households can be thought of as extremelypoor. The overall fiscal situation of the pension (social security) fund is such that it is not feasible torecommend any significant general increase in agriculture pensions. However, given the inequities inland holdings, which bear little relationship with any previous contribution to the economy, a case couldbe made for some incremental payments to elderly rural residents who have very little land. Whether the
'° The joint research program of the Ministry of Labor and Social Policy and the Bank, scheduled to start thissummer, is an important first step to study the effectiveness of social assistance using survey data and appropriatestatistical techniques.
-60-
pension is the appropriate mechanism, or whether social assistance or another instrument would bebetter, should be explored further.
- 61 -
REFERENCES
Canco, Galantina, et. Al. "Land Fragmentation and Some Alternatives for Land Consolidation inthe Future." Report prepared by the Soil Research Institute of Tirana. March 1995.
Dudwick, Nora. "Albania Poverty Assessment: An Ethnographic Study"Working paper. March 1996.
Lusho, Sherif and Dhimiter, Papa. "Land Fragmentation and Consolidation." 1995.
Stanfield, David and Ahmet, Jazoj. "Markets for Immovable Property in Albania: AfterPrivatization, What?" Draft Discussion Paper, May 1995.
Wheeler, Rachel. "A Profile of Land Holdings and Land Use Patterns in Albania" ProjectManagement Unit of the Immovable Property Registration System, Tirane, Albania. March1996.
World Bank. Staff Appraisal Report, Albania Irrigation Rehabilitation Project. Report No.12609-ALB, July 20, 1994.
World Bank. Staff Appraisal Report, Albania Rural Poverty Alleviation Pilot Project. ReportNo. 11405-ALB, February 2, 1993.
-62-
ANNEX 1: THE URBAN SURVEYS
1. Tirana Household Expenditure Survey
The first household survey to be conducted in Albania was administered to 3179households in Tirana between August and October 1993. The sample was drawn from a list ofhouses and apartments compiled from the 1989 Census, updated to include post-1989developments. On the basis of socio-economics variables (demographics, housing, employment,migration, and durable goods), a second questionnaire was administered to a stratified sub-sample of 807 families. The latter was a detailed household expenditure survey. A second surveywas carried out between May and July 1994, which involved returning to many of the samehouseholds, with both the broader socio-economic survey instrument and the detailed householdexpenditure questionnaire.I
Some of the main results from the 1993 survey are:
* annual expenditure was 35,244 lek per capita, or $29 per month. Of this, 72 percent wasspent on food. The poorest quintile of persons spent 16, 495 lek p.a. ($13.50 per month), ofwhich 84 percent was spent on food. Expenditure patterns reflect usual elasticities withrespect to income.
* bread dominated the consumption basket of all households, accounting for 10 percent of totalexpenditure.
* average household size was quite low, 3.6 persons. Two-thirds of families were nuclear instructure.
- educational attainment of the working age (15-60 years) population is high: 11.3 years ofaveraging schooling, with little variation between age cohorts and gender.
e according to the ILO's definition of unemployment, 16 percent of the labor force wasunemployed (compared to 35 percent on a registration basis). Unemployment was heavilyconcentrated in the 15-24 age group.
* 12 percent of families have members that have emigrated .* almost half of the families owned there own dwelling, the majority had a television and a
fridge, and 60 percent a washing machine -- in the most part purchased since 1991.
2. Survey of Three Towns and Peri- Urban Tirana
Survey Areas
The survey in the three medium-size cities (Elbasan, Fier and Lehza) was undertaken togenerate household and individual-level data for the Poverty Assessment and the Medium SizeCities Water Supply and Sanitation Project. Identifying enumeration areas, therefore, had to takeinto account (a) neighborhoods identified as poor through interviews with key informants in each ofthe survey sites; and (b) the geographic coverage of the water supply and sanitation project Thetotal sample size consisted of 471 households, roughly divided evenly among the 3 cities.
The Tirana survey, originally designed as a pre-test for a survey instrument to support thepreparation of the Albania Second Housing Project, was expanded in scope to include poverty
t Both survey instruments were revised to some extent on the basis of experience gained during thefirst survey.
-63-
issues, especially those related to migrants, in four peri-urban neighborhoods (Mihal Grameno, OldSelita, Kavaja Road, and Yzberish). The selection of survey sites was based on (a) their potentialinclusion in the housing project and (b) guidance provided by the Land Management Task Force,which is responsible for project preparation.
Selection of Households
The study team applied a three-stage sampling process in selecting households for thesurvey. While the sample was not intended to generate nationally representative results, the surveyteam considered it important to follow a systematic sampling procedure to ensure that a reasonablygood cross-section of the population was included in the sample. The sampling procedure involvedthree basic steps.
Area Mapping. In the absence of an appropriate sample frame or census list, the first stageof sampling required mapping enumeration areas within each city. Using available citymaps, the survey team divided each city into four sections. Guided by a local planner orengineer in each city, the survey team then identified neighborhoods within each section.These procedures ensured that adequate geographic representation of the population wasachieved in defining the sample. In Tirana, however, the survey areas already wereidentified by the Land Management Task Force.
Enumeration of blocks. The second step in the sampling process involved enumeratingblocks or rows of buildings or houses within neighborhoods. In identifying the blocks tobe surveyed in each quarter, the survey's main consideration was to ensure a balancedgeographic coverage.
Selection of Households. The third stage involved selecting apartments buildings andhouses in each neighborhood. Based on information relating to the proportion of multi-story apartment buildings and single-family houses in the three cities, about two-thirds ofthe households were selected from occupants of multi-story buildings, and about one-thirdconsisted of households living in single-familyhomes.
In selecting households within multi-story apartment buildings, households were chosenfrom each floor level because of the potential differences in water pressure and availability inhouseholds on different levels. In the case of two-family homes, moreover, the families werecounted as either one or two households depending on whether each family considered itself anindependent economic unit.
In Tirana, where the neighborhoods were identified by the Land Management Task Force,the process of selecting households differed slightly from the process applied in the other threecities. In the neighborhoods where the majority of housing units consisted of single-family homes,the interviewers administered a questionnaire in every third household, starting at the beginning ofa row or road. Where there was no discemible road and widely dispersed housing units, adequategeographic representation was taken into account in the random selection of households. The totalsample size for Tirana consisted of 52 households from the four neighborhoods.
-64-
Organization of Survey Team
At the start of the field work, a World Bank social scientist conducted a training session for20 local staff. The training focused on the purpose of the social assessment and specifically thehousehold survey, and the means by which the interviews should select households and administerthe questionnaire. The social scientist also identified supervisors and clarified their role in thesurvey. The survey team was then organized into 4 teams, each consisting of 4 interviewers and Isupervisor. Each supervisor was responsible for checking the completed questionnaires at the endof each interview day. After the supervisor checked the questionnaires to ensure that each questionwas completed correctly, s/he turned them over to two members of the field team responsible fordata entry. These data entry staff also received special training. This promoted an interactiveprocess of cross-checkingdata between the interviewers and the data entry operators, thus ensuringrapid processing and maintenance of data quality.
-65- ANNEX 2
Table 1: Profile of Land Use, 1994
Avg Share Avg Application Avg Share of Avg Share of Avg Share of Avg Share of Avg Share of Avg Share of Avg Share of Avg Share ofof Fallow of Fertilizer Wheat Wheat Fodder Fodder Potato Potatoes Grapes Grapes
Land (lek) Production Marketed Production Marketed Production Marketed Production MarketedCoastal
Holding Gross Net Crop Livestock Dairy Own Own Own ProductionSize Agricultural Agricultural Sales Sales Sales Consumption Consumption Consumption Costs
Income Income of Crops of Livestock of DairyCoastal<0.5 ha 100.00% 73.04% 0 5.92% 6.56% 46.00% 2.97% 38.55% 26.96%
* includes those with some years of secondary education
-78- ANNEX 3
Table 7: Characteristics of Water Supply in Elbasan, Fier and Lehzaby Poor and Non-poor
50% Mean ExpenditureNon-poor Poor All
Main source drinking water (%)Indoor tap 83.2 78.3 82.3Outdoortap 12.9 19.3 14.1Other * 3.8 2.4 3.6
Have water everyday (%)Yes 78.7 80.5 79No 21.3 19.5 21
If no, days/month piped wateris not available 10.5 11.1 10.6
Hours/day piped water isavailable 11.9 11.7 11.8
Do you store water (%)?Yes 66.9 57.1 65.2No 33.1 42.9 34.8
If yes, how much spent onstorage facility (lek/?) 1301 581.6 1195.5
*Other primary source includes water from indoor or outdoor tap of neighbor
-79-
ANNEX 4: DEVELOPMENTS IN HEALTH
Health Status
The health profile of the Albanian population shows a peculiar pattern in internationalcomparison: on the one hand, some indicators such as life expectancy are on par with more developedcountries of higher income and on the other hand, other indicators such as infant mortality and theincidence of infectious diseases are more typical for low income developling countries. This unusualhealth profile has evolved from a mixture of factors including demography, life-styles, socio-economicconditions, and the characteristics of the health services delivery system atypical both for developed andless developed countries.
The health status of the Albanian population shows wide regional variation. The remote areas ofthe north appear to have health status indicators significantly worse than the more open and prosperousdistricts of the south. The mountainous remote areas of the northeast (Has, Puka, Kukes, Dibra, Mirdite,Mat and Bulquize) and the districts of the south bordering (Greece (Vlore, Tepelena, Grijokaster, Delvine,Devoll and Sarande) stand out at the two extreme ends of the comparison. The number of birthsillustrate clear differentiation between the two regions: whereas there were 277 births per 10,000inhabitants in the northeast in 1993, there were only 147 in the south while the national figure amounts to209 per 10,000 inhabitants. The main discrepancies regarding health status indicators appear in infantmortality, the incidence of respiratory diseases in children, induced non-therapeutic abortions, andnutritional status. Although little numerical evidence exists, it is generally acknowledged that populationgroups living in crowded urban centers without access to proper hygiene - water and sanitation - facesignificant health hazard especially that of infectious disease transmission as illustrated by the increasedincidence of most communicable diseases over the last few years. This is a particular concern as thepace of rural-urban migration gathers.
Infant mortality. The infant mortality rate (IMR) in Albania was 36 per 1,000 live births in1994 according to the figures of the Ministry of Health. The IMR in Albania is significantly lower thanthat of other developing countries of the same income level but higher relative to other countries ofCentral and Eastern Europe. During the past 20 years, Albanian health policy was successful in bringinginfant mortality down from 98 per 1,000 live births in 1970 to 25 per 1,000 live births in 1988. This is aconsiderable achievement for a country at this stage of development. Further improvements in the infantmortality rate have been interrupted by the turmoil of the transition period which has resulted in anincrease of the IMR. This increase can be attributed entirely to an increase in post-neonatal IMR (7-365 days) which increased from 18.3 in 1988 to 27.5 in 1993 while neo-natal IMR (0-7 days) slightlydecreased. It can be inferred from these figures that capacity reductions and drug shortages during thetransition period did not impact on the survival chances of new borns for the first 7 days of their liveswhen they are under constant medical supervision. The substantial increase in post-neonatal mortality,however, indicates that once infants leave the health institutions in which they were born, their chancesfor survival become lower. This is most likely because seeking health services and treatment is moredifficult and limited, and domestic environmental conditions are not good.
I Independent sources have been questioning the validity of the official infant mortality data arguing thatsignificant omission in the number of neo-natal deaths occurred especially for infants less than one day old.(Hendrik Van Der Pol: "Some Aspects of Infant Mortality in Albania", 1992.) The argumentation is based on theanalysis of census data of 1989 based on the number of births a woman has had and the number of children stillalive. The conclusion of the analysis is that official data underestimates the infant mortality rate by one third. Thisreport, nevertheless, will use data obtained from official sources.
-80-
The territorial pattern of infant mortality is indicative that the (relatively) more prosperousdistricts, with better access to health services, and less isolation have lower IMR. The mountainousnortheast districts of Has, Puke, Kukes, Dibes, Mirdite, Mat, and Bulquize have an average IMR of 45per 1,000 live births which compares poorly with the southern districts (IMR= 19) or even the nationalaverage. The main cause of infant mortality is acute respiratory infections (ARI) which is the leadingcause of death among children in the developing world. The infant mortality rate due to respiratorydiseases in the northeast is double the rate of the south.
Figure 4.1: Infant Mortality Rate in Albania, 1970-1994
Adult mortality. Life expectancy at birth in Albania was 72.2 years in 1993 - 75.5 years forwomen and 69.3 years for men - which is significantly higher than that of developing countries withsimilar income level and even exceeds that of other former communist countries with significantlyhigher income. This health status indicator has been mostly attributed to life style factors such as healthyfiber rich diet, low fat consumption and walking in the absence of transportation vehicles.
The main cause of mortality in Albania is cardiovascular diseases, which is responsible for 36percent of all deaths. The next most frequent causes of mortality include chronic respiratory diseases(15.8 percent) and tumors (11.7 percent). Mortality due to infectious diseases - which is the leadingcause of death in the majority of all developing countries - is low, 1.8 percent in 1993. Regional variationof mortality is not observable.
2 It has been widely recognized that higher incidence and case fatality of ARI can be associated with lowsocio-economic status of families which is indicative of other risk factors such as crowding, low educational statusof parents, poor nutrition, low birth weight, reduced access to health services, and certain beliefs with regard tochild care practices. Although all of these risk factors exist in Albania, in households of low socio-economic statusand/or in households living in remote areas or temporary dwellings for migrants, several of these factors are likelyto coexist at the same time thereby multiplying the probability of death from ARI. SeeVan Der Pol: "Some Aspectsof Infant Mortality in Albania", 1992.
-81-
Adult morbidity. The adult morbidity pattern of Albania is similar to that found in other lowincome developing countries as indicated by high incidence of diseases of infectious origin includingrespiratory diseases, diarrheal diseases, hepatitis. Diseases of infectious origin constitute 28 percent ofall hospital admissions of which respiratory diseases make up 20 percent and other non-respiratorydiseases 7.4 percent. The incidence of infectious diseases has increased in the case of most categoriesduring the transition. This means that on the one hand, the prevalence of risk factors influencing theincidence of infectious diseases must have increased, and on the other hand, the disruption in theprovision of health services has reduced the ability of the system to prevent and cope with the spread ofinfections. The other main causes of adult illness include the diseases of the digestive system,complications of child birth and pregnancy, and accidents/injuries.
Figure 4.2: Causes of Death in Albania, 1993
Infectious 6% Other2%
Digestive sys. 4%
Nerve sys. 4% ulruatorysys.
Accidents 8%
Tumors 12 %\-
14%Senility
Respiratory
Reproductive health. The fertility rate has declined from 3.6 in 1980 to 3.1 in 1994. This isconsiderably higher than in other Central and East European countries but lower than in otherdeveloping countries. The fertility rate shows significant regional variation within Albania. In the lessprosperous northern districts, the number of births per 10,000 inhabitants is about 70 percent higher thanin the south. Eighteen percent of all births in the northern districts are carried out at home as opposed toonly 7 percent in the south. The large differential in the abortion rate also contributes to the north-southfertility gap. While the rate of spontaneous abortions is the same in the two regions, the number ofinduced non-therapeutic abortions is twice as high in the south of Albania. The overall abortion figurefor'Albania compares poorly with other countries of the region, indicating that the availability of moderncontraceptive methods and family planning education are lacking. Maternal mortality from abortion hasbeen showing a steady decline, however, from 21 in 1988 to 3 in 1993 (and up to 6 in 1994).
-82-
Table 4.1. Regional Differentials in Morbidity, Mortality, and Facility Utilization
DISTRICT live births %of at IMR abortions inicidence ol infectious respiratory visit to visit ofper 10.000 home per 1000 hepatitis per diseases as diseases as % PtIC per childreninhabitants deliveries live births 1(()()( % of total of total 10,000 (0-14) to
Nutritional status. Although no recent nation-wide survey on nutrition is available, severalorganizations have carried out smaller scale surveys. The most revealing information regarding thenutritional status of children has been provided by an Italian CiO - Comunite di S. Egiolio - workingwith the Institute of Public Health who has been collecting nutritional information in the northerndistricts of the country. Their analysis is based on a sample of close to 3,000 children. 3 They have
Figure 4.3: Prevalence of Low Anthropometric observed that 16 percent of the children wereMeasurement in Northern Albania underweight, and almost 20 percent were stunted,
wasted or both. Although the prevalence of
UJndemeighlt moderate malnutrition is similar both in rural andI6°/ _> urban areas, severe malnutrition appears more
Stunted& Wa.c,: dominantly in rural areas: while 13 percent of'0 _ \children from urban areas are severely
Wast7 malnourishled, 22 percent of children from rural
areas appear to be in the same condition. TheStunted _ -. ' . . . .............. |prevalence of malnutrition has considerably
9% -.
decreased since 1993 in the observed districts of_ - . S 'bB~~~~~Nrmal
northern Albania. This can be attributed to widerland ownership and consumption of animal(especially dairy) products. The highestprevalence of malnutrition exists in children in the
3 The original sample might be biased as it includes children who visited the participating health centers withsome kind of a symptom. Correction factors have been used.
-83-
age of 10-15 months when mothers stop breastfeeding. Thlis is a common pattern throughout thedeveloping world.
Access to Health Services
The transition period has had a negative impact on health services. The distruction of healthfacilities in 1992, the shortage of essential drugs and vaccines, and subsequent lack of adequate funds tofinance the health care system has caused a severe disruption in the health care delivery system. Therural areas have been worst affected since in addition to the previously mentioned factors, medicalpersonnel have migrated to urban locations where they can generate more under-the -table payments. Butrecent migrants to urban locations and poor urban dwellers are also facing severe problems. (Box 4. 1)
Financial access. Prior to 1995, access to health services was not limited by ability-to-paybarriers as the health care delivery system was fully financed from the state budget. Now pharmaceuticalco-payments, under-the-table gratuities, and health insurance contributions are the order of the day.Together these amount to around 1,850 lek/per person p.a. -- that is close to 9 percent of average percapita gross farm income and 4 percent of average per capita expenditure in the urban areas. Thesefigures do not include the cost of transport to a health facility, which can be as high as 2,000 lek perjourney in the remoter rural areas.
A switch to a national health insurance scheme occurred in 1995. Health Insurance contributionsare collected from active population groups at differential rates according to their employment status.4According to the preliminary assessment of the Health Insurance lnstitute (Hil), the introduction of thisscheme put a substantial burden on farmers since most of them have little cash income. (Chapter 2) Inaddition, they were not entitled to get a health card as long as they had outstanding arrears to the socialsecurity institute for pension and unemployment contributions.5 In principle, GPs were not allowed totreat anyone without a health card proving contributions. In practice, however, enforcement of thisregulation remained weak as GPs did not turn patients away for lack of a health card.
In addition to their health insurance contributions, individuals are required to partially pay fortheir drugs. The HII pays up to two-thirds of the total drug bill on average and patients' co-paymentcovers the remaining one third. In 1995, the amount covered by patients is expected to amount to around60 Leks per person. This, in itself, is not a substantial burden on households especially as children under1, cancer and tuberculosis patients, and hospitalized patients receive drugs free of charge.
Under-the-table payments are implicitly expected from patients upon outpatient consultation andinpatient care. Although gratuities have become more and more significant over the past few years, nosubstantial evidence has been found to demonstrate that demands for private payments have becomeexplicit on the part of doctors or that treatment is denied in case of non-payment. Similar to other EastEuropean countries, physicians have strong incentives to complement their meager salaries (5000Leks/month) by accepting gratuity payments. Independent sources have estimated gratuities at 100-200
6Leks per consultation.
Employees contribute 1.7 percent of their salary (1 10 lek monthly), and employers contribute an additional1.7 percent on behalf of their staff, self-employed contribute 7 percent of the minimum wage (230 lek per month),farmers contribute 3 percent of the minimum wage (100 lek per month). and the state budget contributes on behalfof exempted population groups such as pensioners.
This requirement has subsequently been dropped.
6 National Health Insurance Institute, Albania.
-84-
Box 4.1: Health Care and the Urban Poor
Public health care for both legal residents and illegal migrants in Albania's cities is increasingly available only tothose who can pay (under-the-table payments). While most urban resients will seek treatment when they are ill, thenon-poor are more likely to seek treatment than the poor. The two most important reasons for not seeking treatmentare that it is either too expensive or family members are treated at home. Among the urban poor 54 percent said thatthey do not seek treatment at a clinic because it is too expensive. According to one legally registered employedwoman in Tirana, it was necessary to pay both doctors and nurses to get any attention for her father who had justundergone major surgery. Even when her father literally collapsed on the floor, she could not get any help until herhusband was able to get to the hospital bringing not only money, but their own instrument for measuring bloodpressure. Another employed woman in Lezha experienced similar treatment when she underwent surgery. While inthe hospital, she had to administer her own oxygen. Both women confirmed that they had to pay hundreds ofdollars to obtain help that they should have received at no charge. When asked how the poor can afford to obtainhospital care, the woman from Lezha remarked that "they do not get help; the poor are left to die."
For those who may not be legally entitled to public health services, the situation can be worse. Families do not evenhave the right to request treatment at the local clinics. Some families dealt with this by paying several dollars underthe table for each examination. In some cases, their children received vaccinations, but in a few cases, youngchildren had not received the necessary vaccinations because they were not on the district list of children. Migrantscannot even be legally buried unless they pay a bribe. According to several respondents, there was a recent death ofa young man in Bathore whose family had to pay a $70 bribe for permission to bury him.
Geographical access. The number of primary care access points, including policlinics, healthcenters, and health posts, has significantly decreased since 1989. While there were 3,283 access pointsin 1989 which amounted to I per 975 inhabitants, 873 of them had been closed down by 1993 whichcorresponds to I access point per 1410 inhabitants. Although there is wide regional variation amongdistricts (from 66 per 10,000 population to 3 per 10,000), there is no regular pattern. The number ofaccess points per I 0,000 population is roughly the same in the remote northern districts as in the southerndistricts, and the number of total visits to primary care facilities shows that the lowest utilization in thecountry can be observed both in northern and southern districts.
Unlike in the case of primary care access points, the variation in the number of hospital bedsdemonstrates a clear regional pattern with the northern region having 30 beds per 10,000 inhabitants asopposed to the southern region with 36 beds per 10,000, or the national average 35 beds per 10,000. Theavailability of hospital beds has decreased during the transition. On the other hand, the number ofphysicians has not changed significantly since the onset of transition. There were about 4,400physicians in 1993, which gives I physician per 773 inhabitants. This ratio is worse than that inneighboring countries (e.g. Bulgaria) but significantly better than in other developing countries of thesame income level (e.g. Pakistan). Although during the communist era health personnel were quiteevenly distributed across the country by administrative means, the transition lifted all political controlover the location of employment. In addition, public employment regulations did not allow fordifferential wage policy to allocate higher wages to those working among more difficult conditions priorto the introduction of the health insurance scheme. As a result, migration of health personnel has beentaking place from sparsely populated rural areas to urban centers where working conditions are morefavorable and the opportunity to collect under-the-table gratuities are better. This has left villages andsmall towns with intermittent and/or inadequate health care.
Policy implications
Falling public expenditure on health, and rising direct costs associated with seeking health careare also of concern as they begin to have serious health status consequences. There has been somedeterioration in the health status of the Albanian population -- for example, infant mortality and adult
-85-
morbidity due to infectious diseases have increased. Although a large part of Albania's health problemsstem from over-crowding and poor water and sanitation, difficult access to health facilities, and poorhealth services often fail to arrest health problem once they emerge. Improvement in the overall standardof living of the population and further improvements in health care infrastructure, hence, willundoubtedly bring progress in the health statuLs of the population. But these are medium and long-termgoals. In the meanwhile, other short-term strategies can be adopted that would be effective in reducingthe infant mortality rate and the incidence of infectious diseases with particular attention to low incomefamilies (in the rural areas) and rural-urbani migrant population groups. These are presented in Table 4.2below. A particular problem relates to the direct costs associated with seeking health care, which arekeeping some poor urban families, and particularly elderly women, from seeking health care. Improvedworking conditions and real increases in wage levels of medical personnel, as part of an overall publicservice reforn program, would go some way to eliminating under-the-table co-payments, but othermeasures may be necessary to ensure that inability-to-pay does not prevent poor, elderly and sick peoplegaining access to health care.
Maternal health. The fertility rate has declined from 3.6 in 1980 to 3.1 in 1994, but it is stillhigh by Central and Eastern European standards, as well as West European standards. The fertility rateshows considerable variation within Albania, with northern districts having a rate almost twice that of thesouth. In part this is explained by the higher incidence of induced non-therapeutic abortions, the mainform of birth control, in the south. General economic development as well as the opening up of thecountry will lower the fertility rate in time -- a well documented trend from international experience. Thehigh level of literacy among the population, especially women, can also act as a catalyst to a falling birthrate. But what is critically missing at present is family planning, both information about child spacingand possible ways to control conception, as well as the availability of modern contraceptives. Theseshould be introduced as part of a primary health care program, and made available at all parimary careaccess points throughout the coun1try.
-86-
Table 4.2: Health Interventions to Combat Most Common Illnesses
Health issue Prevention and Domestic Case CommentsManagement
ARI . monitor infants with low birth weight* promote breastfeeding* provide vitamin A supplements* educate mothers of the symptoms and
possible domestic interventions* reducing crowding as possible and
increasing air circulation* separating sick individuals from the
rest of the familyTuberculosis . detection and isolation of infectious . screening of the whole population
sources at health institutions is costly, large target groups could* continue BCG vaccination with be considered: military recruits,
special attention to migrants health center visitors. BCG vaccination is proven to beeffective up to 15 years
Diarrheal diseases . increased use of soap . use of oral rehydration* improved food hygienic substantially reduces the need for* proper waste disposal later IV rehydration* promotion of breast feeding . UNICEF provides ORS packages* oral rehydration therapy (ORT) at very low cost* continued feeding . continued feeding helps to prevent
the diarrhea-malnutrition cycleHepatitis . immunization against hepatitis B with .
special attention to migrants* increased efforts to sterilize needles* test of blood donors and/or donated
blood* screening of pregnant women andtreatment of infants born to carriermothers
* promotion of personal hygiene inkindergartens to reduce transmissionhepatitis A
Nutrition . proper nutrition of mothers to avoid . adding iodine to salt is alow birth weight particularly cost-effective method:
* promotion of breast feeding it cost USD 0.04 per person per* food supplement targeted to pre- year in India in 1987.school children with special focus todisadvantaged remote areas
* nutrition education* fortification of iodine in salt* iodine supplement to pregnant women* vitamin A supplements to children
Reproductive health . promotion of birth control methodswith special attention to more remoteareas with higher fertility rate