Albedo variations and the impact of clouds on glaciers in the Chilean semi-arid Andes Jakob ABERMANN, Christophe KINNARD, y Shelley MacDONELL Centro de Estudios Avanzados en Zonas A ´ ridas (CEAZA), La Serena, Chile E-mail: [email protected]ABSTRACT. Albedo variations are presented at two on-glacier sites in the semi-arid Andes, Chile, with >3 years of continuous measurements. Although <2 km apart and at similar elevations, the sites show significantly different albedo cycles. Whereas Toro 1 exhibits a clear seasonal cycle, Guanaco reveals a more complicated pattern, as exposed ice can occur in any month of the year. Daily albedo values are as low as 0.18 for debris-covered Toro 1, while minima are higher on Guanaco (0.38). A method is presented to discern cloud-free from cloudy conditions using measured incoming shortwave radiation only. A cloud climatology is provided showing very low cloudiness values. We see that effective cloud cover relates inversely to cloud occurrence (i.e. either more but thin or fewer but thick clouds). The cloud-free diurnal albedo cycle is pronounced, with lowest values around noon. Clouds increase albedo by 0.04 as a median hourly value, and 0.20 for the 95% quantile. There is a positive relationship between effective cloud cover and resulting albedo rise. Calculations as to whether the diurnal albedo cycle or the effect of clouds on albedo should be considered in energy-balance estimations show that the former is necessary whereas the latter can be neglected in the semi-arid Andes. KEYWORDS: energy balance, glacier mass balance, glacier meteorology, ice/atmosphere interactions INTRODUCTION The shortwave radiation balance is the largest energy source of most glaciers (Male and Granger, 1981; Gardner and Sharp, 2010) and is determined by the magnitude of the incoming radiation and the albedo (the fraction of reflected to incoming shortwave radiation). Snow and ice albedo is known to change with time, from very high values immediately after a snowfall event (up to 0.98) to values as low as 0.46 for clean old snow and to 0.06 for dirty ice (Cuffey and Paterson, 2010). The reasons for this include snow metamorphosis and the concurrent increase in grain size, a change in water content and the exposure of dust particles at the surface. As soon as ice is exposed, the albedo remains constant on the scale of days to weeks (Oerlemans and Knap, 1998). However, it has been shown that long- term trends of decreasing ice albedo may occur as a result of a sequence of negative mass-balance years and the subsequent accumulation of dust on glacier surfaces (Oerle- mans and others, 2009). Other daily or sub-daily albedo variations can occur as a result of precipitation or cloud cover. Fresh snow, even if it is just a thin layer, increases albedo significantly (Oerlemans and Knap, 1998; Brock and others, 2000). Clouds have been shown to increase albedo for several reasons, including that they lead to an alteration in the effective zenith angle of the incident radiation due to an increase of its diffuse fraction (e.g. Cutler, 2006). Furthermore, clouds are more absorbent in the near-infrared spectrum, leaving radiation that is relatively richer in the shortwave part of the spectrum, where albedo is generally higher (Gardner and Sharp, 2010; Kuipers Munneke and others, 2011). The first effect (effective zenith angle) can lead to either an increase or a decrease of the albedo, depending on the incident angle of incoming solar radiation (e.g. Cutler, 2006). Generally, the limit of 508 is accepted as the boundary below which an increase of albedo is expected (as a result of an increased effective zenith angle), whereas above 508 a decrease of albedo occurs. The second effect (enrichment of the shortwave part of the spectrum) leads to an increase of surface albedo (e.g. Pirazzini, 2004; Gardner and Sharp, 2010). Jonsell and others (2003) found that the increase of albedo due to clouds is stronger for snow than for ice surfaces. They attributed this finding mainly to the lower albedo of ice causing the multiple reflections between the surface and the cloud to be less efficient at increasing albedo. Albedo measurements have to be interpreted carefully by taking into account the slope and aspect of the surface. Unattended automated weather stations (AWSs) generally have the radiation sensors levelled parallel to the horizon, whereas the actual surface may be slightly inclined. Incident radiation measured horizontally has to be corrected to obtain the true incident radiation at the surface. Assuming isotropic reflection and a plane surface, the measured or apparent albedo can be corrected to obtain the true albedo (Mannstein, 1985; Grenfell and others, 1994; Sicart and others, 2001). The surface microtopography plays another role, a topic that is rarely considered in the literature from a quantitative perspective because of the difficulties in measur- ing albedo at representative locations within the micro- topography. For example, Kotlyakov and Lebedeva (1974) reported a decreased albedo in the troughs of penitentes, which they attribute to increased humidity there. Pirazzini (2004) reviewed the literature on the effect of morphological features on albedo, focusing mainly on sastrugi in Antarctica. They concluded that generally two effects take place. Firstly, the effective zenith angle changes because direct radiation hits walls directed towards, or away from, the direct Journal of Glaciology, Vol. 60, No. 219, 2014 doi: 10.3189/2014JoG13J094 *Present address: Asiaq, Greenland Survey, Nuuk, Greenland. y Present address: De ´partement des Sciences de l’Environnement, Universite ´ du Que ´bec a ` Trois-Rivie `res, Que ´bec, Canada. 183
Transcript
Albedo variations and the impact of clouds on glaciers in theChilean semi-arid Andes
Jakob ABERMANN,� Christophe KINNARD,y Shelley MacDONELL
Centro de Estudios Avanzados en Zonas Aridas (CEAZA), La Serena, ChileE-mail: [email protected]
ABSTRACT. Albedo variations are presented at two on-glacier sites in the semi-arid Andes, Chile, with
>3 years of continuous measurements. Although <2 km apart and at similar elevations, the sites show
significantly different albedo cycles. Whereas Toro 1 exhibits a clear seasonal cycle, Guanaco reveals a
more complicated pattern, as exposed ice can occur in any month of the year. Daily albedo values are as
low as 0.18 for debris-covered Toro 1, while minima are higher on Guanaco (0.38). A method is
presented to discern cloud-free from cloudy conditions using measured incoming shortwave radiation
only. A cloud climatology is provided showing very low cloudiness values. We see that effective cloud
cover relates inversely to cloud occurrence (i.e. either more but thin or fewer but thick clouds). The
cloud-free diurnal albedo cycle is pronounced, with lowest values around noon. Clouds increase albedo
by 0.04 as a median hourly value, and 0.20 for the 95% quantile. There is a positive relationship
between effective cloud cover and resulting albedo rise. Calculations as to whether the diurnal albedo
cycle or the effect of clouds on albedo should be considered in energy-balance estimations show that
the former is necessary whereas the latter can be neglected in the semi-arid Andes.
KEYWORDS: energy balance, glacier mass balance, glacier meteorology, ice/atmosphere interactions
INTRODUCTION
The shortwave radiation balance is the largest energy sourceof most glaciers (Male and Granger, 1981; Gardner andSharp, 2010) and is determined by the magnitude of theincoming radiation and the albedo (the fraction of reflectedto incoming shortwave radiation). Snow and ice albedo isknown to change with time, from very high valuesimmediately after a snowfall event (up to 0.98) to valuesas low as 0.46 for clean old snow and to 0.06 for dirty ice(Cuffey and Paterson, 2010). The reasons for this includesnow metamorphosis and the concurrent increase in grainsize, a change in water content and the exposure of dustparticles at the surface. As soon as ice is exposed, the albedoremains constant on the scale of days to weeks (Oerlemansand Knap, 1998). However, it has been shown that long-term trends of decreasing ice albedo may occur as a result ofa sequence of negative mass-balance years and thesubsequent accumulation of dust on glacier surfaces (Oerle-mans and others, 2009).
Other daily or sub-daily albedo variations can occur as aresult of precipitation or cloud cover. Fresh snow, even if it isjust a thin layer, increases albedo significantly (Oerlemansand Knap, 1998; Brock and others, 2000). Clouds have beenshown to increase albedo for several reasons, including thatthey lead to an alteration in the effective zenith angle of theincident radiation due to an increase of its diffuse fraction(e.g. Cutler, 2006). Furthermore, clouds are more absorbentin the near-infrared spectrum, leaving radiation that isrelatively richer in the shortwave part of the spectrum, wherealbedo is generally higher (Gardner and Sharp, 2010; KuipersMunneke and others, 2011). The first effect (effective zenith
angle) can lead to either an increase or a decrease of thealbedo, depending on the incident angle of incoming solarradiation (e.g. Cutler, 2006). Generally, the limit of 508 isaccepted as the boundary belowwhich an increase of albedois expected (as a result of an increased effective zenith angle),whereas above 508 a decrease of albedo occurs. The secondeffect (enrichment of the shortwave part of the spectrum)leads to an increase of surface albedo (e.g. Pirazzini, 2004;Gardner and Sharp, 2010). Jonsell and others (2003) foundthat the increase of albedo due to clouds is stronger for snowthan for ice surfaces. They attributed this finding mainly tothe lower albedo of ice causing the multiple reflectionsbetween the surface and the cloud to be less efficient atincreasing albedo.
Albedo measurements have to be interpreted carefully bytaking into account the slope and aspect of the surface.Unattended automated weather stations (AWSs) generallyhave the radiation sensors levelled parallel to the horizon,whereas the actual surface may be slightly inclined. Incidentradiation measured horizontally has to be corrected to obtainthe true incident radiation at the surface. Assuming isotropicreflection and a plane surface, the measured or apparentalbedo can be corrected to obtain the true albedo(Mannstein, 1985; Grenfell and others, 1994; Sicart andothers, 2001). The surface microtopography plays anotherrole, a topic that is rarely considered in the literature from aquantitative perspective because of the difficulties in measur-ing albedo at representative locations within the micro-topography. For example, Kotlyakov and Lebedeva (1974)reported a decreased albedo in the troughs of penitentes,which they attribute to increased humidity there. Pirazzini(2004) reviewed the literature on the effect of morphologicalfeatures on albedo, focusing mainly on sastrugi in Antarctica.They concluded that generally two effects take place. Firstly,the effective zenith angle changes because direct radiationhits walls directed towards, or away from, the direct
Journal of Glaciology, Vol. 60, No. 219, 2014 doi: 10.3189/2014JoG13J094
*Present address: Asiaq, Greenland Survey, Nuuk, Greenland.yPresent address: Departement des Sciences de l’Environnement, Universite
du Quebec a Trois-Rivieres, Quebec, Canada.
183
radiation. Secondly, ‘light trapping’ occurs due to multiplereflections between the features. Both effects lead to areduction in albedo (Kuhn, 1974; Warren and others, 1998).Also, Corripio and Purves (2005) found through simulationsthat penitentes decrease albedo by 8% compared with flatsnow surfaces (see table 5 in Corripio and Purves, 2005).
In the semi-arid Andes the topic of snow and ice albedo iseven more important for glaciological studies than in otherregions for several reasons. The incoming shortwave radi-ation is very high because of small zenith angles and a verydry and clean atmosphere compared with higher latitudes.The study location is very high (>5200ma.s.l.) and theatmosphere is thin, another reason for high values ofincoming shortwave radiation. Furthermore, as we willshow, the albedo is generally low, which increases therelative importance of the net shortwave radiation as anenergy-balance component. The generally small diffusefraction of the incoming radiation means that the lightspectrum and the reflective properties of the surface arelikely to change more strongly when clouds occur.
The aims of this study are (1) to present albedo measure-ments on adjacent sites with different characteristics, (2) toquantify their long- and short-term fluctuations as well astheir drivers, (3) to present a reliable cloud quantificationscheme to (4) investigate the effects of cloud cover onalbedo variations, and (5) to investigate whether includingthe daily albedo cycle or the albedo change through cloudsin surface energy-balance calculations is important in thesemi-arid Andes.
LOCATION
Radiation data from two AWSs at nearby sites are presented.The study area is in the upper Huasco valley, in the semi-aridAndes of Chile’s Norte Chico region (27–338 S), in a very dryregion on the fringes of the Atacama Desert, with relativelylow temperatures at high elevations (e.g. Rabatel and others,2011; MacDonell and others, 2013a). Extremely highincident solar radiation occurs, such that maximum hourlyaverage values are up to 99% of the solar constant (Table 1),and very limited cloud cover occurs.
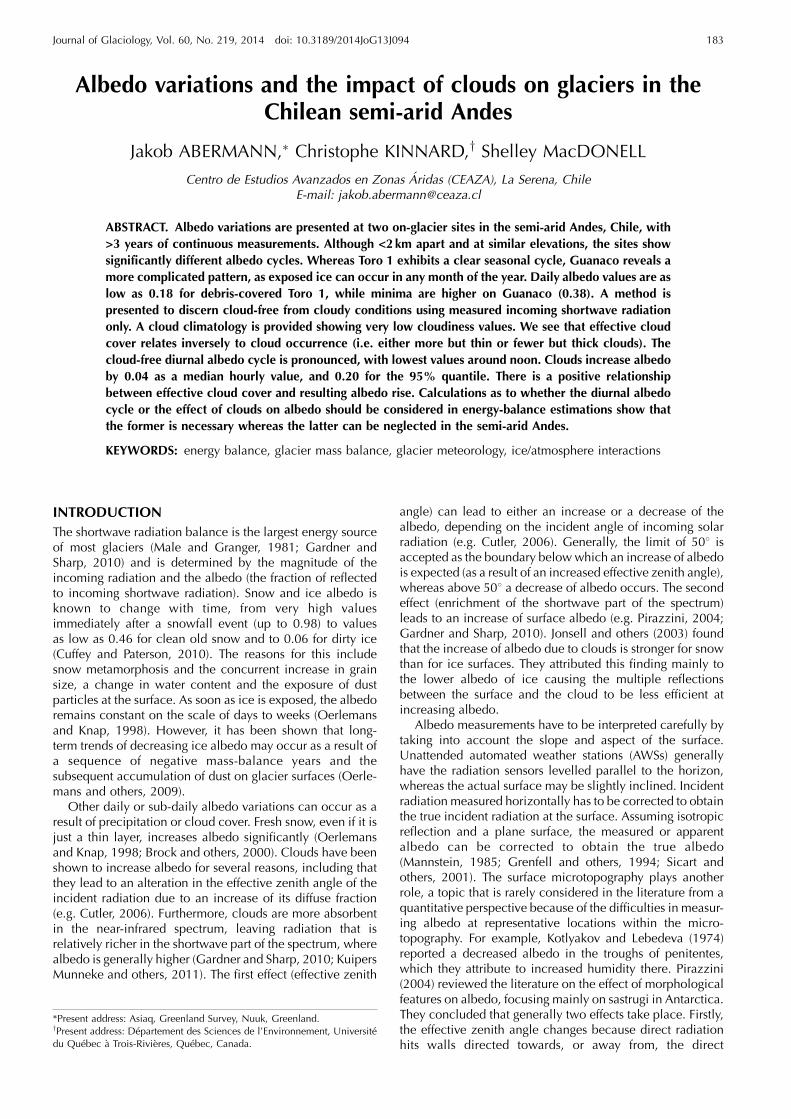
Above 4000m, 11% or 17 km2 of land area in the Huascobasin is glacier-covered (Nicholson and others, 2009;Gascoin and others, 2011). The Guanaco AWS is on theupper part of Guanaco glacier, which is relatively large forthe region (1.8 km2), whereas the Toro 1 AWS is on a0.06 km2 ‘glacieret’ (a small ice body on which no sign ofsurface motion is present; Cogley and others, 2011). Forsimplicity, for the remainder of the text we refer to both sitesas glaciers. Basic site characteristics, including the dataperiod used, are summarized in Table 1, and an overviewmap is provided in Figure 1. Despite their proximity, the sitesdiffer significantly in terms of accumulation processes,surface properties and precipitation amounts. Very little
snow accumulates at Guanaco AWS due to its proximity to acrest, and the strong wind and surface scouring related tothat. In contrast, Toro 1 is more wind-protected and receivesmore precipitation (MacDonell and others, 2013b). At bothsites, all precipitation falls in solid form. Surface propertiesalso vary significantly. At Guanaco there is either clean andsmooth ice or snow, whereas Toro 1 has a very dirty icesurface in summer (debris cover present) and the areaaround the AWS is covered with tall penitentes (up to 2mhigh), which typically start to form in December andbecome covered by snow in late April. In winter thepenitentes are snowed in entirely and the surface is smooth.
DATA AND METHODS
Shortwave radiation was measured at two AWSs withupward- and downward-looking Kipp & Zonen CM3pyranometers sampling every 10 s, with hourly averagesstored. Coordinates, time periods available and site char-acteristics are listed in Table 1. Slope and aspect are derivedfrom a 2005 digital elevation model (DEM) with 4m spatialresolution constructed from a stereo pair of Ikonos satelliteimages. The DEM was resampled to 20m cell size to obtaina representative slope and aspect value, which smoothsmicroscale surface roughness. Field measurements of theseparameters are difficult to obtain and limited to a point notnecessarily representative of the area. Nonetheless, manualslope measurements were carried out at three stakes aroundeach AWS at least once a year by placing a 1m longinclinometer on the glacier surface. These measurementsgave values within 28 of the DEM values.
Broadband albedo values derived from measured out-going shortwave radiation with values <60Wm–2 and zenithangles >658 (hourly means) are discarded as instrumentsgive unreliable responses for very low incoming shortwaveradiation values and high zenith angles (Jonsell and others,2003; Brock, 2004). High zenith angles occur only at thevery edges of the day and thus very likely lead tomisinterpretation (i.e. a fraction of the averaged hour mayreceive only incoming or outgoing radiation).
Correction of albedo
The hourly albedo values have been corrected according toGrenfell and others (1994), modifying the ‘apparently’measured albedo �app to obtain �true, the albedo for theinclined surface, which we consequently call � or the‘broadband albedo’,
�true ¼ �appcos ð�sunÞ
cos ð�sun þ �surf cos’Þ1
1� �surf2
� � ð1Þ
where �sun is the solar zenith angle, �surf is the slope of thesurface (rad) and ’ is the solar azimuth defined as zero whenthe sun is in the uphill direction from the slope. It was
Table 1. Site characteristics for the two AWSs. X, Y and Z are Universal Transverse Mercator (UTM) coordinates
Site X Y Z Data from Data until Aspect Slope Highest Sin hourly average
m m m 8 8 Wm-2
Guanaco 401510 6753608 5317 Oct 2008 Dec 2011 150 7.5 1356Toro 1 401085 6754794 5226 Jun 2008 Dec 2011 160 5.5 1342
Abermann and others: Albedo variations and clouds in the semi-arid Andes184
essential to apply this correction in order to remove strongasymmetries in the daily clear-sky albedo cycle due to thefact that the pyranometers are levelled horizontally over aslightly sloping surface (Table 1; Sicart and others, 2001). Agood estimate of slope and aspect of the site where albedo ismeasured is a crucial input for Eqn (1). Sicart and others(2001) performed a thorough error analysis on that topic andshowed that the results vary insignificantly if pixel averagesinstead of individual point measurements are taken todetermine slope and aspect. Assuming an error of �208 foraspect and �3.48 for slope, they found the error inindividual hourly albedo values to be up to �8%, butmostly between �5%.
As in Jonsell and others (2003), hourly albedo values of>0.9 have been set to 0.9, a typical value for fresh snow(Cuffey and Paterson, 2010). Daily albedo values werecalculated by dividing the total daily outgoing shortwaveradiation by the total daily incoming radiation.
Discerning cloudy from cloud-free days
In order to quantify the effective influence of clouds onalbedo it is first necessary to reliably discern cloudy fromcloud-free days. Several studies use theoretically calculated‘potential clear-sky’ radiation fluxes based on the solarconstant, the atmospheric turbidity and the solar incidentangle (e.g. Brock, 2004), and subsequent scaling with the
measured incoming shortwave radiation. This means thatincoming shortwave radiation is expressed as the fraction ofthe potential incoming shortwave radiation (effective cloudcover, neff). The disadvantage of theoretically calculatedpotential incoming radiation to derive neff is that turbidityvalues have to be either measured or assumed. Furthermore,handling data from unattended on-glacier AWSs over severalyears implies slight tilts in the radiation sensor or minor timeoffsets when the logger is reconfigured. Especially in anenvironment such as our study area, where incomingshortwave radiation values change very rapidly at the edgesof the day, these small deviations can lead to artifacts whencomparing with theoretical values. Taking advantage of thefact that the climate at the site is characterized by manyentirely clear-sky days, we developed a simple alternativemethod to discern cloud-free from cloudy days and obtain atime series of potential incoming shortwave radiation. Thisseries is later scaled to the incoming radiation measured oncloudy days to derive the diurnal cycle of the effective cloudcover neff.
Daily total incident radiation sums are taken as the start,including both cloudy and cloud-free days. Running means(window length 3 days because cloudy conditions areepisodic and generally of short duration) are calculatediteratively, such that after each iteration the values lowerthan the running mean are replaced with the running mean.
Fig. 1. Ikonos image (2005) of the upper Huasco river catchment showing the location of the AWSs (circles) on Guanaco and Toro 1 glaciers.Figure adapted from MacDonell and others (2013b).
Abermann and others: Albedo variations and clouds in the semi-arid Andes 185
The procedure is repeated until changes between iterationsconverge and become insignificant (stopping criterion0.03% change in the total value between successiveiterations after 43 iterations). The resulting time series isinterpreted as the total (potential) clear-sky daily incomingshortwave radiation. Days with total incoming radiationsums >90% of this potential daily sum (corresponding to theinstrument error; Table 2) are considered to be cloud-free(cl = 0), and the remaining days to be cloudy (cl = 1).
Quantification of cloud cover
Figure 2 shows an example of how neff is derived on an hourlyscale and later how the effect of clouds on increase in albedois quantified, once cloudy days have been discerned fromcloud-free days. The steps outlined above showed that, in thisexample, 2 and 7 October were cloud-free days (cl = 0),whereas 3–6October show cloud cover (cl = 1). The potentialincoming clear-sky radiation (Smax) on cloudy days (3–6 October) is then linearly interpolated from the incomingradiation (Sin) measured on the two closest cloud-free days (inthis case, 2 and 7October). The slightly decreasingmaximumvalue of Smax over this example of a few days illustrates theinterpolation between the cycle of the cloud-free days.However, the difference between 2 and 7 October is smalland within the measurement uncertainty, and can thereforenot be interpreted further. From these data the transmissivityis derived by simply dividing hourly Sin by Smax. The effectivecloud cover neff (blue line in Fig. 2) is then calculated as1 minus the transmissivity, and has values between 0 and 1.
The method to derive neff is different from previous studies inthe area. MacDonell and others (2013b) compared incomingshortwave radiation with the theoretical maximum at thesite, but their results showed artificial asymmetries at the startand end of each day (i.e. the theoretically calculatedpotential incoming radiation curve does not fit perfectlyover the measured incoming shortwave radiation). Forenergy-balance totals this is not significant and also thecloud climatology of this study (see below) does not deviatestrongly from figure 4 of MacDonell and others (2013b).However, as we are interested here in investigating indi-vidual hourly albedo changes to hourly cloud conditions, themethod of MacDonell and others (2013b) was not suitableand therefore the presented method has been applied. Otherstudies also use longwave radiation data to quantify cloudcover (e.g. Durr and Philippona, 2004; Kuipers Munneke andothers, 2011). Owing to data gaps in the longwave radiationdata of our records, and the focus on shortwave radiation inthis study, we did not include these approaches.
Quantification of the effect of clouds on albedo
Albedo time series for cases where neff > 0 are investigated tounderstand the relation between clouds, albedo rise andzenith angle. Data from an ultrasonic ranger (see Table 2 forspecifications), which measured the variations in surfaceelevation and hence the occurrence of snowfall events, wereused in order to distinguish cloudy days with snowfall fromcloudy days without snowfall. For the subsequent analysis wefocus on days without snowfall to examine the albedo rise
Table 2. Sensor specifications and accuracies. The same types of sensor were deployed on both AWSs
Variable Device Accuracy Additional information
Radiation Kipp & Zonen CNR1 �10% on daily totals Spectral range: 305–2800nmSnow height Campbell SR50 �1cm* –Time-lapse photographs Pentax K110D – Qualitative information on snow occurrence only
*For very rough surfaces this value may be higher according to the manufacturer (http://s.campbellsci.com/documents/us/manuals/sr50.pdf). We consider
�5 cm to be more realistic.
Fig. 2. An example of how neff and �no cl are derived showing data for 2–7 October 2009. Sin is the measured incoming shortwave radiation(black, solid), Smax is the maximal possible incoming shortwave radiation (black, dashed), neff is the effective cloud cover (blue, solid)derived from Sin and Smax, � is the measured and slope-corrected albedo (red, solid) and �no cl is the albedo without the cloud-inducedincrease (red, dashed). Note that 2 and 7 October are entirely cloud-free days (cl = 0), whereas 3–6 October showed almost continuouscloud cover.
Abermann and others: Albedo variations and clouds in the semi-arid Andes186
from clouds alone (i.e. independent of the effect of snowfall).Additionally, daily time-lapse photographs (between 12:00and 14:00) were used to qualitatively detect precipitationevents on the two glaciers. A comparison with the ultrasonicranger shows that there were several cases when noprecipitation was recorded by the sensor but traces of snowwere visible on the photographs. The reason for this is thatvery thin snowfalls frequently occur in this area and arebelow the measurement accuracy of the instrument, espe-cially given the roughness of the surface at the study sites(Table 2). The aim was therefore to employ a number ofmeasures that enable a conservative interpretation of albedorise due to cloud, as it is preferable to miss some cases whencloud but not precipitation occurred, as opposed tomisattributing an albedo rise to cloud when it is actually aconsequence of snowfall. Therefore, we do not analyzecloud-induced albedo rise at any station, in the event that atone of the stations precipitation was recorded. Furthermore,to be conservative, any day following a day of measuredprecipitation at any station is not considered. Finally, we rana manual check for every remaining day on which cloud butnot precipitation occurred. The previous day’s albedo cyclewas superimposed on the actual day’s cycle. If a significantdifference was visible (>0.05), we checked the database oftime-lapse photographs (Table 2), and in many cases a thinlayer of snow was visible. In such cases we removed the dayfrom the sample for both sites, as it is likely that amisinterpretation occurred. The remaining albedo cycleswere treated as follows (using Fig. 2 as an example): all daysshown in Figure 2 did not have snowfall; the solid red curvesare the measured and corrected hourly albedo values (�) asdescribed above. Now the daily cycles of � for the nearestcloud-free days (2 and 7 October) are used, and their hourlyvalues linearly interpolated for the intervening period whenclouds occurred (3–6 October). This is how the cloud-free
albedo (�no cl, dashed red curves) is derived. The differencebetween � and �no cl can now be interpreted as the albedorise that is due to cloud (��clouds). This approach is similar tothat of other studies using daily values (e.g. Cutler, 2006), anddiffers slightly from Brock (2004) who used the dailyminimum of albedo and scaled these minimal values withthe hourly means (fig. 4 of Brock, 2004).
RESULTS
Figure 3 shows the mean daily albedo for Guanaco and Toro1 (Fig. 3a) and the respective snow height (Fig. 3b).Generally, although the sites are relatively close to eachother, their results are very different. Toro 1 shows thestrongest seasonal cycle, which generally follows the snow-pack evolution. As soon as the snow disappears and the iceis exposed (e.g. January 2009, February 2010, March 2011),very low albedo values are recorded (as low as 0.2). With acontinuous thick snowpack, values of �0.65 are reached(e.g. September 2010), with spikes up to 0.9, which areattributable to fresh snowfall events (Fig. 3b) or clouds.Guanaco lacks distinct seasonal snowpack and albedocycles. Generally, its minimum albedo values are higher(�0.4) than those of Toro 1. The high-frequency variations(spikes due to snow or cloud) of both glaciers arequalitatively similar. Individual seasons differ strongly andno long-term trend is detectable at either station.
Monthly means of daily albedo cycles under cloud-freeconditions are presented in Figure 4. All days having neff = 0during the whole day are defined as cloud-free days (forGuanaco 69% and for Toro 1 59% of all days). From theresults of Figure 3 it is to be expected that albedo values andtheir evolution throughout the year will vary for theindividual glaciers, meaning that we would expect adifferent sequence of mean monthly daily cycles in Figure 4
Fig. 3. (a) Mean daily albedo and (b) mean daily snow height for Guanaco (blue) and Toro 1 (red) glaciers.
Abermann and others: Albedo variations and clouds in the semi-arid Andes 187
for each glacier. This is evident, with Guanaco showingcomparably little month-to-month variation and generallyhigher values in the later summer months (January–March)than in spring (e.g. September, October).
In contrast, Toro 1 shows a typical and very pronouncedalbedo evolution, with generally lower values in australsummer (e.g. December–February) when the surface is iceand/or debris is exposed. The highest values are experiencedin late winter (August, September) when the snowpack isthickest, all penitentes are covered and a smooth surface ispresent.
There is a pronounced daily cycle present on bothglaciers. Generally, albedo is higher in the morning andevening than at noon, and the daily cycle is stronger insummer months than in winter months. In late austral winterand early spring a decrease in albedo during the day isvisible on Toro 1. Generally speaking, daily cycles arepresent at both sites, and albedo can vary on a cloud-freeday by up to 0.15.
Figure 5 shows how cloud cover is distributed throughoutthe year. The fewest cloudy days occur in austral autumn(March–April) and throughout late spring and early summer(September–November), and the highest number occur inJune. Looking at the mean neff of the hours with clouds in amonth (grey curve in Fig. 5a), the spring and summer monthsclearly show thicker cloud cover than the winter months,
although clouds occur less frequently (bars). Figure 5b showsthe mean daily cycle of neff for each month individually. Theaustral summer months show a distinct rise in the earlyafternoon, indicating optically thicker clouds, whereas theother months have a more uniform daily cycle.
Figure 6 shows the quantification of the cloud-inducedalbedo rise and its relation to neff. A large scatter is visible forvalues of neff > 0.2. A nonlinear relationship is suspected.The red curve shows the cumulative relative frequency of��clouds (�) and can be interpreted as the fraction of the totalsample that is at or below a given value of ��clouds. As such,the median albedo rise due to clouds is 0.04, in 75% of thetotal it is <0.1, and in 95% it is <0.2. Only �1% of all hourlyvalues show an albedo rise of >0.3.
DISCUSSION
Generally, the significant diurnal cycle on both sites is relatedto the solar incident angle and a higher probability thatphotons can leave the snowpack if they hit the surface atgrazing angles (Gardner and Sharp, 2010). We found that onToro 1 the diurnal cycle is more pronounced than onGuanaco. This may be due to the growth of penitentes insummer on Toro 1. When the radiation hits the surface withpenitentes around noon, the troughs are reached directly andtheir moist and dusty surface reduces the overall albedo,
Fig. 4. Daily cycles of cloud-free albedo (corrected for aspect andslope) on (a) Guanaco and (b) Toro 1. Each curve represents themonthly mean of all albedo cycles under entirely cloud-freeconditions. Note that there may be months when the curves includeboth snow and ice albedo (Fig. 2).
Fig. 5. (a) Annual cycle of cloud distribution as a fraction of days(bars) and the mean neff of the cloudy hours only (thick grey curve)along with one standard deviation (thin grey curves) and (b) diurnalaverage evolution of neff for the individual months. Data from Toro1 AWS are shown as an example; however, the key features are thesame for Guanaco.
Abermann and others: Albedo variations and clouds in the semi-arid Andes188
whereas at high zenith angles (mornings and afternoons) thewalls of the penitentes increase the effective albedo inrelation to the noon albedo. The reduction of Toro 1 albedoin the afternoon of austral spring months coincides with thetiming of snow metamorphosis, and could be related to achange in snow grain size or water content, in line with otherstudies (e.g. Pirazzini, 2004). The more pronounced dailycycle in summer than in winter is likely due to larger diurnalranges of variation in the solar incident angle in summer.
We attribute the unusual annual evolution of the dailyalbedo cycle (Fig. 4) for Guanaco (higher values of albedo insummer than in winter) to the accumulation particularities ofthis site. Little snow accumulates throughout the year and itis the wind that determines whether the snow that falls inepisodic events can remain. Gascoin and others (2013) andMacDonell and others (2013a) show a clear seasonal cycleof wind speed at the Guanaco site, with lower wind speed insummer, which is the likely cause for comparably moresnow being accumulated there during these months, and thehigher albedo values between January and March than inwinter (fig. 2 of MacDonell and others, 2013a).
The inverse relationship between cloud frequency andeffective cloud cover as shown in Figure 5 is explained bydifferent cloud types that occur in the study area in differentseasons. Winter cloud cover is mainly of a frontal, advectivetype, which is generally thinner and can last on the scale ofdays, whereas in summer convective clouds dominate,which generally develop in the afternoon and reachsubstantially thickened dimensions in the evening butdissolve overnight.
For the albedo rise caused by clouds, Table 3 summarizesa comparison with values from previous studies. Proposedvalues vary strongly and lie between 0.02 and 0.24 as amaximum value for cloud-induced albedo change.
The values we present are generally within the suggestedmean values found in other studies; however, individualmaximum values exceed them. There are several possibleexplanations for this. Many of the studies mentioned abovewere conducted in the polar regions, but none of them inlow latitudes as in our study. High-latitude regions receivelarge zenith angles through which the zenith angle effect oncloud-induced albedo rise partly balances the spectral shift(e.g. Gardner and Sharp, 2010). Therefore the total albedorise is expected to be reduced. In contrast, at small zenith
angles, both the zenith angle effect and the spectral shift arepositive and lead to an increase in albedo, making thehigher numbers of our study plausible. Another peculiarityof our site is that under cloud-free conditions the diffusepart of the shortwave radiation is very low, as only a verysmall part of the incoming radiation is scattered orabsorbed. This is evident in the high values of incomingradiation (e.g. MacDonell and others, 2013b; Table 1). Alow fraction of diffuse radiation also suggests a spectrum atthe surface that is similar to the solar spectrum at the top ofthe atmosphere, which is relatively rich in the longerwavelengths of the shortwave spectrum (compared withincident radiation that is composed of a higher fraction ofdiffuse radiation; e.g. Pirazzini, 2004). This is again wherethe spectral albedo is lower, and helps to explain both thegenerally low albedo values encountered at our site (Fig. 3)and the fact that clouds cause a stronger spectral shift inincoming radiation, thereby leading to a stronger albedorise under such circumstances.
Our results make it possible to assess the significance ofincluding both the diurnal cycle of albedo and the albedorise due to clouds in surface energy-balance calculations.For this purpose we present a full year of data (1 October2010 to 30 September 2011) and calculate the correctedshortwave radiation balance with measured hourly albedovalues (Snet, I) and compare them with Snet, II, which is
Fig. 6. Hourly values of the cloud-induced albedo rise (��clouds) vsneff for both stations (points). The red curve is not a regression; itshows the cumulative relative occurrence �.
Table 3. Albedo rise as a result of cloud cover (maximum or meanvalues) according to various studies
Source ��clouds Value reported
Hubley (1955) 0.18 MaximumBolsenga (1977) 0.02 MaximumGrenfell and Maykut (1977) 0.14 MaximumWendler and Kelley (1988) 0.11 MaximumYamanouchi (1983) 0.08 MaximumCutler (2006) 0.12 MaximumGardner and Sharp (2010) �0.15 MaximumPirazzini (2004) 0.07 MeanBrock (2004) 0.12 MaximumVan den Broeke and others (2006) 0.08 MeanJonsell and others (2003) �0.24 MaximumThis study 0.04/0.2/0.42 Median/
0.95 quantile/maximum
Abermann and others: Albedo variations and clouds in the semi-arid Andes 189
calculated with the noon albedo value used for the entireday (e.g. Brock, 2004), i.e. not considering the daily cycle(Table 4). The overestimation of the shortwave balance (OESnet, II) is 14% for Guanaco and 13% for Toro 1. Consideringthe daily mean albedo instead of the noon albedo (i.e.dividing total outgoing by total incoming shortwave radi-ation) to calculate the net shortwave radiation (Snet, III), theoverestimation is reduced but still significant (OE Snet, III
13% for Guanaco, 9% for Toro 1). This result means that thediurnal albedo cycle should be included in surface energy-balance calculations. Arendt (1999) showed for a glacier inthe Canadian Arctic that the diurnal albedo cycle issignificant for the surface energy balance there, leading toa decrease of the net shortwave radiation of up to 16%.
Subtracting the albedo rise due to clouds from themeasured hourly slope-corrected albedo and then calcu-lating the net shortwave balance (Snet, IV) leads to anoverestimation (OE Snet, IV) of 0.4% compared with Snet, I forboth glaciers. Hence our study shows that at high-altitudearid sites such as ours the cloud-induced albedo rise can beneglected for energy-balance studies. This is surprising giventhe significant ��clouds values that have been shown above(Fig. 6). However, cloudy days are infrequent (Fig. 5) and,furthermore, the lower incident radiation on cloudy daysmakes them less significant for the annual shortwaveradiation balance. This conclusion is therefore valid forsimilar dry climates and should be re-evaluated for climaticconditions where cloudy days occur more frequently.
CONCLUSIONS
This study shows the complicated temporal evolution ofsnow and ice albedo at two adjacent sites in the semi-aridAndes of Chile. The site-specific complexity has to be takeninto account when it comes to calibrating spatial energy-balance models with point AWS albedo measurements. Therepresentativeness of individual sites should be carefullyevaluated for entire glaciers or catchments. There is asignificant diurnal cycle of albedo that generally follows thezenith angle. This has to be taken into account in surfaceenergy-balance calculations, whereas the effect of clouds onalbedo rise is insignificant in this respect. This is explainedby the infrequent occurrence of clouds in the very dryclimate of the semi-arid Andes and the low incomingradiation on cloudy days. Future work should focus onacquiring spatially distributed albedo maps as an input todistributed energy-balance models. Furthermore, remote-sensing approaches to derive albedo must take into accountthe small-scale variations in a heterogeneous study area suchas the semi-arid Andes.
ACKNOWLEDGEMENTS
This study was financed by Compania Minera Nevada(CMN). CMN did not interfere in the data interpretation andconclusions reached in this study. We thank the CMN forlogistical support, and the glaciology group at CEAZA forhelp in the field. S. MacDonell was supported byFONDECYT postdoctoral grant No. 3110053. We acknow-ledge the financial support of FONDECYT grant No.1130598. We also thank M. Kuhn and M. Petlicki for theircomments.
REFERENCES
Arendt A (1999) Approaches to modelling the surface albedo of ahigh Arctic glacier. Geogr. Ann. A, 81(4), 477–487
Bolsenga SJ (1977) Preliminary observations on the daily variationof ice albedo. J. Glaciol., 18(80), 517–521
Brock BW (2004) An analysis of short-term albedo variations atHaut Glacier d’Arolla, Switzerland. Geogr. Ann. A, 86(1), 53–65
Brock BW, Willis IC and Sharp MJ (2000) Measurement andparameterization of albedo variations at Haut Glacier d’Arolla,Switzerland. J. Glaciol., 46(155), 675–688 (doi: 10.3189/172756500781832675)
Cogley JG and 10 others. (2011) Glossary of glacier mass balanceand related terms. (IHP-VII Technical Documents in Hydrology86) UNESCO–International Hydrological Programme, Paris
Corripio J and Purves R (2005) Surface energy balance of highaltitude glaciers in the central Andes: the effect of snowpenitents. In De Jong C, Collins DN and Ranzi R eds. Climateand hydrology of mountain areas. Wiley, Chichester, 15–27
Cuffey KM and Paterson WSB (2010) The physics of glaciers, 4thedn. Butterworth-Heinemann, Oxford
Cutler PM (2006) A reflectivity parameterization for use indistributed glacier melt models based on measurements fromPeyto Glacier, Canada. In Demuth MN, Munro DS and Young GJeds. Peyto Glacier: one century of science. (NHRI ScienceReport 8) National Hydrology Research Institute, Saskatoon,Sask., 179–200
Durr B and Philipona R (2004) Automatic cloud amountdetection by surface longwave downward radiation measure-ments. J. Geophys. Res., 109(D5), D05201 (doi: 10.1029/2003JD004182)
Gardner AS and Sharp MJ (2010) A review of snow and ice albedoand the development of a new physically based broadbandalbedo parameterization. J. Geophys. Res., 115(F1), F01009(doi: 10.1029/2009JF001444)
Gascoin S, Kinnard C, Ponce R, Lhermitte S, MacDonell S andRabatel A (2011) Glacier contribution to streamflow in twoheadwaters of the Huasco River, Dry Andes of Chile. Cryo-sphere, 5(4), 1099–1113 (doi: 10.5194/tc-5-1099-2011)
Gascoin S, Lhermitte S, Kinnard C, Bortels K and Liston GE (2013)Wind effects on snow cover in Pascua-Lama, Dry Andes of
Table 4. Overview of results for October 2010–September 2011. Sin, hor is the total incoming radiation flux on the horizontal plane, Snet, I isthe total net shortwave radiation calculated with hourly albedo values, Snet, II is calculated with the noon albedo value applied throughoutthe day, Snet, III is calculated with the daily total albedo value (total Sout/total Sin) applied throughout the day, and Snet, IV is calculated bysubtracting the albedo rise due to clouds from the measured hourly albedo cycle. OE Snet, II, OE Snet, III and OE Snet, IV are the percentageoverestimations in the net shortwave balance for Snet, II, Snet, III and Snet, IV each referring to Snet, I
Sin, hor Snet, I Snet, II Snet, III Snet, IV OE Snet, II OE Snet, III OE Snet, IV
Abermann and others: Albedo variations and clouds in the semi-arid Andes190
Chile. Adv. Water Resour., 55, 25–39 (doi: 10.1016/j.advwatres.2012.11.013)
Grenfell TC and Maykut GA (1977) The optical properties of iceand snow in the Arctic Basin. J. Glaciol., 18(80), 445–463
Grenfell TC, Warren SG and Mullen PC (1994) Reflection of solarradiation by the Antarctic snow surface at ultraviolet, visible,and near-infrared wavelengths. J. Geophys. Res., 99(D9),18 669–18 684 (doi: 10.1029/94JD01484)
Hubley RC (1955) Measurements of diurnal variations in snowalbedo on Lemon Creek Glacier, Alaska. J. Glaciol., 2(18),560–563 (doi: 10.3189/002214355793702073)
Jonsell U, Hock R and Holmgren B (2003) Spatial and temporalvariations in albedo on Storglaciaren, Sweden. J. Glaciol.,49(164), 59–68 (doi: 10.3189/172756503781830980)
Kotlyakov VM and Lebedeva IM (1974) Nieve and icepenitentes: their way of formation and indicative significance.Z. Gletscherkd. Glazialgeol., 10(1–2), 111–127
Kuhn M (1974) Anisotropic reflection from sastrugi fields. Antarct. J.US, 9(4), 123–124
Kuipers Munneke P, Reijmer CH and Van den Broeke MR (2011)Assessing the retrieval of cloud properties from radiationmeasurements over snow and ice. Int. J. Climatol., 31(5),756–769 (doi: 10.1002/joc.2114)
MacDonell S, Kinnard C, Molg T, Nicholson L and Abermann J(2013a) Meteorological drivers of ablation processes on a coldglacier in the semi-arid Andes of Chile. Cryosphere, 7(5),1513–1526 (doi: 10.5194/tc-7-1513-2013)
MacDonell S, Nicholson L and Kinnard C (2013b) Parameterisationof incoming longwave radiation over glacier surfaces in thesemi-arid Andes of Chile. Theor. Appl. Climatol., 111(3–4),513–528 (doi: 10.1007/s00704-012-0675-1)
Male DH and Granger RJ (1981) Snow surface energy exchange.Water Resour. Res., 17(3), 609–627 (doi: 10.1029/WR017i003p00609)
Mannstein H (1985) The interpretation of albedo measurements ona snow-covered slope. Arch. Meteorol. Geophys. Bioklimatol.,36(1), 73–81 (doi: 10.1007/BF02269458)
Nicholson L, Marın J, Lopez D, Rabatel A, Bown F and Rivera A(2009) Glacier inventory of the upper Huasco valley, NorteChico, Chile: glacier characteristics, glacier change and com-parison to central Chile. Ann. Glaciol., 50(53), 111–118 (doi:10.3189/172756410790595787)
Oerlemans J and Knap WH (1998) A 1-year record of globalradiation and albedo in the ablation zone of Morteratsch-gletscher, Switzerland. J. Glaciol., 44(147), 231–238
Oerlemans J, Giesen RH and Van den Broeke MR (2009) Retreatingalpine glaciers: increased melt rates due to accumulation of dust(Vadret da Morterastch, Switzerland). J. Glaciol., 55(192),729–736 (doi: 10.3189/002214309789470969)
Pirazzini R (2004) Surface albedo measurements over Antarcticsites in summer. J. Geophys. Res., 109(D20), D20118 (doi:10.1029/2004JD004617)
Rabatel A, Castebrunet H, Favier V, Nicholson L and Kinnard C(2011)Glacier changes in the Pascua-Lama region,ChileanAndes(298 S): recent mass balance and 50 yr surface area variations.Cryosphere, 5(4), 1029–1041 (doi: 10.5194/tc-5-1029–2011)
Sicart JE, Ribstein P, Wagnon P and Brunstein D (2001) Clear-skyalbedo measurements on a sloping glacier surface: a casestudy in the Bolivian Andes. J. Geophys. Res., 106(D23),31 729–31 738 (doi: 10.1029/2000JD000153)
Van den Broeke M, Reijmer C, Van As D and Boot W (2006) Dailycycle of the surface energy balance in Antarctica and theinfluence of clouds. Int. J. Climatol., 26(12), 1587–1605 (doi:10.1002/joc.1323)
Warren SG, Brandt RE and Hinton OP (1998) Effect of surfaceroughness on bidirectional reflectance of Antarctic snow.J. Geophys. Res., 103(E11), 25 789–25 805 (doi: 10.1029/98JE01898)
Wendler G and Kelley J (1988) On the albedo of snow inAntarctica: a contribution to I.A.G.O. J. Glaciol., 34(116),19–25
Yamanouchi T (1983) Variations of incident solar flux and snowalbedo on the solar zenith angle and cloud cover at MizuhoStation, Antarctica. J. Meteorol. Soc. Jpn, 61(6), 879–893
MS received 13 May 2013 and accepted in revised form 6 December 2013
Abermann and others: Albedo variations and clouds in the semi-arid Andes 191