47
ALBERTA ACCOMMODATION OUTLOOK 2017 Summary of the CBRE presentation to the AHLA On April 11, 2017 Jasper, Alberta

A LBERTA ACCO MMO D ATIO N O UTLO O K 2017
Summary of the CBRE presentation to the AHLA
On April 11, 2017 Jasper, Alberta

• National Economic & Tourism Outlooks
• National Supply & Demand Outlooks
• Western Canada Outlooks
• Alberta Economic & Tourism Outlooks
• Alberta Supply & Demand Outlooks
• Provincial Forecasts
• Hotel Investment in Alberta
• Key Takeaways
PRESEN T A TIO N O UTLIN E

NATIONAL ECONOMIC & TRAVEL
OUTLOOKS

N A TI O N A L ECO N OM IC O U TLO O K 2016/17
$1.58 $1.54
$1.59
$1.63
$1.66
$1.70
$1.74 $1.76
$1.78 $1.82
-3.0%
-2.0%
-1.0%
0.0%
1.0%
2.0%
3.0%
4.0%
$1.45
$1.55
$1.65
$1.75
$1.85
$1.95
2008 2009 2010 2011 2012 2013 2014 2015 2016 2017p
% C
han
ge
1.0% 1.4%
2.0%
Source: Statistics Canada, Conference Board of Canada, Canadian Outlook Winter 2017, Scotiabank Group – Global Forecast Update
2017; CIBC World Markets – Monthly FX Outlook, 2017; RBC – Economic and Financial Market Outlook – March 2017
Source: CBRE Hotels

N A TI O N A L TRAV EL O U TLO O K 2016/1 7
KEEP YOUR TABLE WITH N THE GUIDES
Source: Canadian Tourism Research Institute, Conference Board of Canada, Autumn 2016
Source: CBRE Hotels
**2017 Federal Budget – Permanent Funding of $37.5 Million Per Year to Destination Canada
Overnight Travel I 2015 Estimate 2016 Forecast 2017 Forecast
Business travel domestic 0.6% 1.2% 2.4%
Pleasure travel domestic 2.6% 2.3% 3.2%
Total domestic travel 1.9% 2.0% 2.7%
U.S. Travel 7.7% 7.8% 3.9%
Overseas travel 5.5% 8.7% 6.4%
Total Overnight Travel 2.6% 3.0% 3.0%
National Accommodation Demand Growth
0.2% 1.5% 2.4%

NATIONAL SUPPLY & DEMAND OUTLOOKS
2017

N A TI O N A L S U PPLY & D EMA N D O U TLO O K
1.3% 1.1%
1.5%
0.2%
1.5%
2.4%
2015 2016 2017P 2015 2016 2017P
Supply Demand
Supply & Demand Growth
Source: CBRE Hotels
National
Occupancy 2015 Actual 64%
2016 Actual 64%
2017 Projection 64%

N A TIO N A L A DR, REVPA R & B O TTO M L IN E O U TLO O K
$11.8
Source: CBRE Hotels
$13.1
$13.9
2015 2016e 2017f
Adjusted Net Operating
Income/ Available Room
($000’s) 9.2%
10.2%
6.4%
ADR Growth
2015 Actual 4.8%
2016 Actual 3.3%
2017 Forecast 3.7%
RevPAR Growth
2015 Actual 3.6%
2016 Actual 3.6%
2017 Forecast 4.6%

N A TIO N A L TO P L IN E O U TLO O K
2015 2016 2017F 2016-2017P Change
Occupancy 64% 64% 64% No change
ADR $144 $149 $154 3.7%
RevPAR $91 $95 $99 4.6%

WESTERN CANADA OUTLOOKS

WESTER N CA N A D A S U PPLY & D EMA N D O U TLO O K
Supply & Demand Growth
2.1% 1.9% 2.0%
-2.1%
-1.2%
2.5%
Source: CBRE Hotels
Western Canada
Occupancy 2015 Actual 62%
2016 Actual 60%
2017 Projection 61%
2015 2016 2017P 2015 2016 2017P
Supply Demand
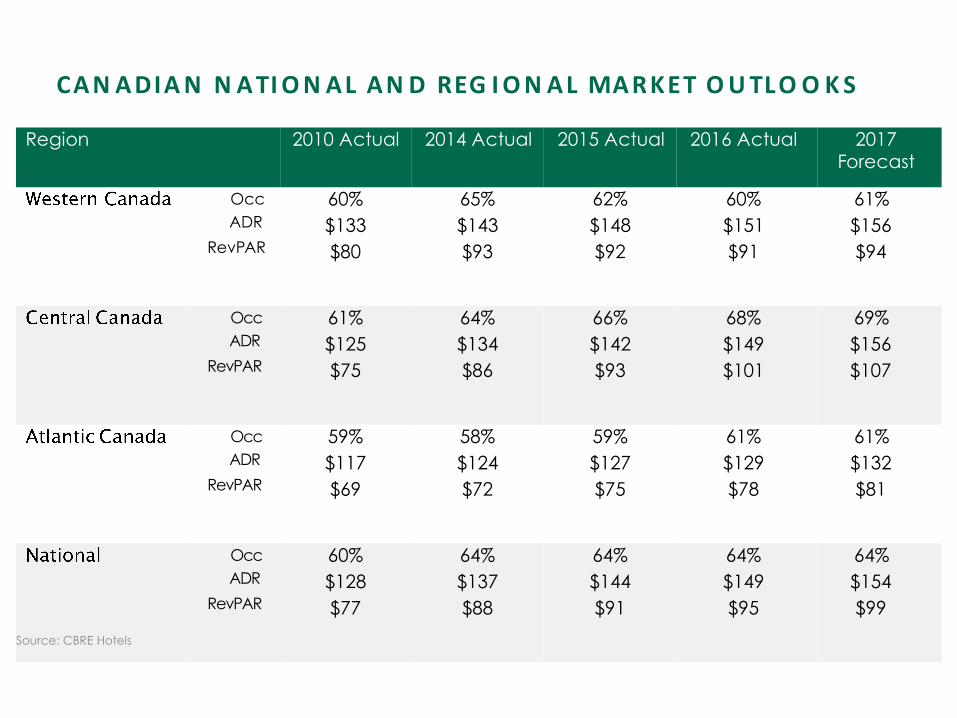
CA N A DIA N N A TI O N AL A N D REG I O N A L MA R KET O U TLO O K S
Region 2010 Actual 2014 Actual 2015 Actual 2016 Actual 2017 Forecast
Occ
ADR
RevPAR
60%
$133
$80
65%
$143
$93
62%
$148
$92
60%
$151
$91
61%
$156
$94
Occ
ADR
RevPAR
61%
$125
$75
64%
$134
$86
66%
$142
$93
68%
$149
$101
69%
$156
$107
Occ
ADR
RevPAR
59%
$117
$69
58%
$124
$72
59%
$127
$75
61%
$129
$78
61%
$132
$81
Source: CBRE Hotels
Occ
ADR
RevPAR
60%
$128
$77
64%
$137
$88
64%
$144
$91
64%
$149
$95
64%
$154
$99

WESTERN CA N A D A A DR, REVPA R & B O TTO M L IN E O U TLO O K
$14.7
$14.0
$14.7
2015 2016 2017P
Adjusted Net Operating Income/
Available Room ($000s)
1.3%
-5.1%
5.3%
ADR Growth
2015 Actual 3.8%
2016 Actual 1.8%
2017 Forecast 3.2%
RevPAR Growth
2015 Actual -0.5%
2016 Actual -1.3%
2017 Forecast 3.6%
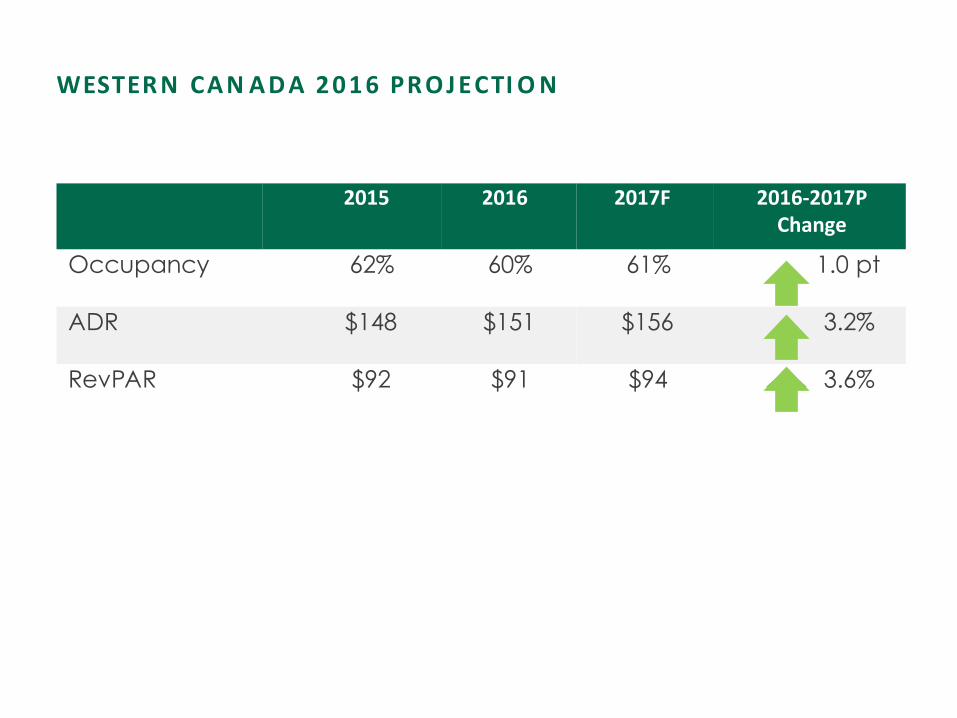
WESTER N CA N A D A 2 0 1 6 PR O J ECTI O N
2015 2016 2017F 2016-2017P Change
Occupancy 62% 60% 61% 1.0 pt
ADR $148 $151 $156 3.2%
RevPAR $92 $91 $94 3.6%

ALBERTA ECONOMIC & TOURISM
OUTLOOKS

A LB ERTA 2 0 1 7 G D P G ROWTH PR O J ECTI O N S
Source: ATB Financial – Alberta Economic Outlook – March 2017
Scotiabank Group, Global Forecast Update – March 7, 2017
RBC Economic and Financial Provincial Outlook – Alberta – March 2017
Conference Board of Canada, Provincial Outlook Winter 2017
2016
Estimate
2017
Forecast
2018
Forecast
ATB Financial -2.7% 2.2% 2.3%
Scotiabank Group -2.7% 2.4% 2.5%
RBC Economics -3.0% 2.1% 3.3%
Conference Board of Canada
-2.9% 2.8% 1.9%

2 0 1 6 - 1 7 REA L G D P G ROWTH B Y PR O V IN CE
3.1
%
-2.7
%
-0.6
%
2.1
%
2.0
% 2
.7%
2.4
%
1.7
%
1.8
%
0.5
%
0.7
%
1.3
%
1.4
%
1.2
%
1.3
%
0.1
%
1.4
%
2.3
%
2.4
%
1.7
%
-2.3
%
2.2
%
4.0%
3.0%
2.0%
1.0%
0.0%
-1.0%
-2.0%
-3.0% BC AB SK MB ON QC NB PE NS NL CAN
GD
P G
row
th
(%)
2016e 2017f
Source: Scotiabank Group, Global Forecast Update, March 2017

A LB ERTA TO URISM IN D ICA TO RS 2 0 1 6 V S. 2 0 1 5
Source: Alberta Tourism Market Monitor, Alberta Culture and Tourism
AIRPORT PASSENGER VOLUMES • Calgary 1.3% • Edmonton -3.5%
FOOD SERVICES & DRINKING
PLACES RECEIPTS (YTD NOV) • 0.3%
HISTORIC SITES & MUSEUM
VISITS • -12.9%
NATIONAL PARKS ATTENDANCE* • Banff 6.6% • Jasper 3.8% • Waterton 12.9%

A LB ERTA TRA VEL O U TLO O K
Source: Canadian Tourism Research Institute, Conference Board of Canada, Autumn 2016
Overnight Travel 2015
Estimate
2016
Forecast
2017
Forecast
Business Travel Overnight Domestic -6.3% -2.8% 2.1%
Pleasure Travel Overnight
Domestic 0.7% -1.8% 1.9%
U.S. Overnight Travel 3.8% 6.5% 4.5%
Overseas Overnight Travel 4.5% 7.6% 5.3%
Total Overnight Travel 0.3% -0.4% 2.2%

HISTORI C O I L PRICES (WEST TEX A S IN TERMEDIA TE)
Source: U.S. Energy Information Administration

K E Y FA CTO R S A FFECTIN G H O TEL PERFORM A N CE
Source: CBRE Hotels
• Oil prices not rising to levels that would generate substantial growth in
room night generating activity
• Favourable exchange rates helping to attract international overnight
leisure travel to Alberta
• Supply growth outside of Calgary and Edmonton has slowed
substantially
• Business Confidence Levels and Consumer Confidence Levels
• Room rate discounting continues
• Air capacities/route cutting

CA N A DIA N B U S I N ESS TRAV EL O U TLO O K 2 0 1 7 – K E Y FIN D I N G S
• Annual survey prepared by Conference Board of Canada and Association
of Corporate Travel Executives. Respondents are Canadian Corporate
Travel Managers/Executives
• Canadian business travel projected to decline by 0.7% in 2017
• Corporate business travel budgets are projected to decline by 0.5% in 2017
• 63% of respondents expect Canadian hotel room rates to increase in 2017.
They expect rates to increase by an average of 1.5%
• 12% of respondents currently permit the use of sharing economy
accommodation (37% of respondents permit use of sharing economy
ground transportation)
• “A significant share of companies are currently reviewing their corporate
travel policy on sharing economic suppliers”
Source: Source: Conference Board of Canada, Association of Corporate Travel Executives (ACTE) – Canadian Business Travel Outlook 2017 – Issued in April 2017

ALBERTA SUPPLY & DEMAND OUTLOOKS
2017

A LB ERTA TO P L IN E 2 0 1 6 PERFO RMAN C E
*Properties in Communities located
On or North of Highway 16
**Properties in Communities located
SOUTH of Highway 16
Edmonton
Calgary
Lethbridge
Red Deer
Alberta Resorts
Other Alberta North*
Other Alberta South**

A LB ERTA HISTORI C “TO P L IN E” RES U LTS
Source: CBRE Hotels
2008 2010 2014 2015 2016
Overall Alberta (excl.resorts)
Occ
ADR
RevPAR
69%
$134
$92
58%
$125
$73
68%
$143
$97
59%
$141
$83
52%
$132
$69
Red Deer Occ
ADR
RevPAR
58%
$99
$57
47%
$102
$48
62%
$112
$69
49%
$115
$57
41%
$109
$45
Lethbridge Occ
ADR
RevPAR
61%
$102
$62
56%
$101
$56
58%
$110
$64
53%
$112
$59
51%
$110
$56
Alberta Resorts
Occ
ADR
RevPAR
61%
$203
$124
53%
$191
$101
60%
$215
$129
62%
$230
$143
64%
$253
$162
Other Alberta
Occ
ADR
RevPAR
61%
$139
$85
51%
$118
$60
66%
$137
$91
51%
$134
$68
42%
$123
$51

A CCOM MO D A TI O N S UPPLY
• Estimated 1,300 new rooms to open province wide in 2017
• Majority in metro Calgary and Edmonton
• Virtually all are branded
• Some assets converting to brands
• No indication that construction costs have declined significantly

A LB ERTA S U PPLY & D EMA N D O U TLO O K
3% 5%
7%
3% 2% 1%
-6% -3%
3% -14% -13%
12,000,000
2%
4,000,000
2,000,000
0
8,000,000
6,000,000
10,000,000
14,000,000
16,000,000
18,000,000
2015 2016 2017P 2015 2016 2017P
Room N ig hts
Supply
Demand
Calgary/Edmonton Combined
Rest of Alberta
Supply & Demand Growth/Decline
Source: CBRE Hotels

CALGARY & EDMONTON
MARKET OUTLOOKS

CA LG A RY ECO N OM IC O U TLO O K
Source: Conference Board of Canada – Metropolitan Outlook Winter 2017
2014 2015 2016 2017F
GDP Growth (%)
5.2 -3.1 -1.7 1.8
Employment (% Change)
2.5 2.1 -2.0 1.4
Unemployment Rate (%)
5.0 6.4 9.1 9.4
Housing Starts (annual, 000’s of units)
17 13 9 9

CA LG A RY – PERFORM A N CE IN DIC A TO R S
KEY POINTS FOR 2017
• Accommodation supply growth of over 5% will outpace demand growth in 2017
• High office vacancy rates – particularly downtown
• Overnight corporate travel volumes continue to suffer
Source: CBRE Hotels

CA LG A RY TO P L IN E 2 0 1 6 PERFO RMAN CE B Y SU B - MA R KET

CA LG A RY A CCOM MO D A TI O N MA R K ET PERFORM A N CE
$1
46
$1
47
$8
5
$8
4
59% 57%
0%
10%
20%
30%
40%
50%
60%
70%
80%
$0
$20
$40
$60
$80
$100
$120
$140
$160
$180
2010 2011 2012 2013 2014 2015 2016 2017P
ADR RevPAR Occupancy
Source: CBRE Hotels

ED MO N T O N ECO N OM IC O U TLO O K
Source: Conference Board of Canada – Metropolitan Outlook Winter 2017
2014 2015 2016 2017F
GDP Growth (%)
4.9 -3.2 -1.7 2.1
Employment (% Change)
2.3 2.4 0.2 0.1
Unemployment Rate (%)
5.2 5.9 7.1 7.5
Housing Starts (annual, 000’s of units)
14 17 10 9
Source: CBRE Hotels
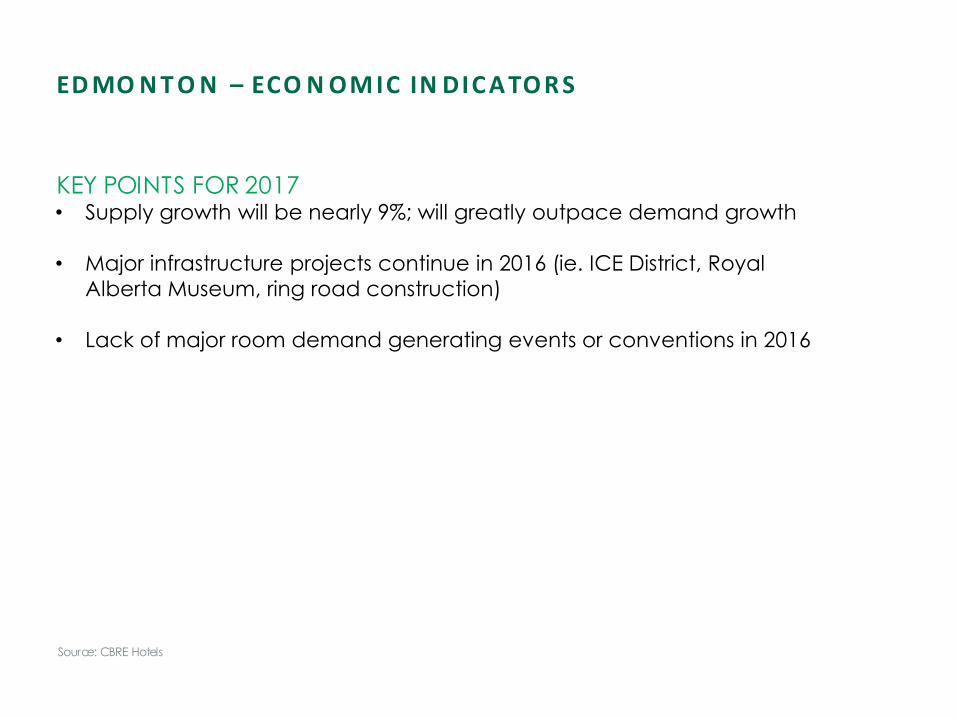
ED MO N T O N – ECO N OM IC IN DIC A TO R S
KEY POINTS FOR 2017 • Supply growth will be nearly 9%; will greatly outpace demand growth
• Major infrastructure projects continue in 2016 (ie. ICE District, Royal
Alberta Museum, ring road construction)
• Lack of major room demand generating events or conventions in 2016

ED MO N T O N TO P L IN E 2 0 1 6 PERFO RMA N C E B Y SU B - MA R KET

EDMO N TO N A CCOM MO D A TI O N MA R K ET PERFORM A N CE
Source: CBRE Hotels
$1
30
$1
28
$7
7
$7
2
59%
56%
0%
10%
20%
30%
40%
50%
60%
70%
80%
$0
$20
$40
$60
$80
$100
$120
$140
$160
2010 2011 2012 2013 2014 2015 2016 2017P
ADR RevPAR Occupancy

MA J O R MA R K ET O U TLO O K S REV PA R PR O J ECTI O N - 2 0 1 7
10.0%
8.0%
6.0%
4.0%
2.0%
0.0%
-2.0%
-4.0%
-6.0%
-8.0%
Mo
ntr
ea
l
Va
nc
ou
ve
r
Nia
ga
ra F
alls
Toro
nto
Ott
aw
a
Ha
lifa
x
Qu
eb
ec
City
Win
nip
eg
Sa
ska
too
n
Re
gin
a
St.
Jo
hn
's
Ed
mo
nto
n
Ca
lga
ry
> 5% RevPar Growth
0 - 5% RevPar Growth
Negative RevPar Growth
*”Major Markets” refer to Greater Metro Areas
Source: CBRE Hotels
2017P RevPAR Ranking
Vancouver $149
Montreal $129
Toronto $126
Ottawa $119
Niagara Falls $115
Quebec City $113
Halifax $96
St. John’s $87
Calgary $84
Winnipeg $84
Saskatoon $81
Regina $77
Edmonton $72

PROVINCIAL FORECAST
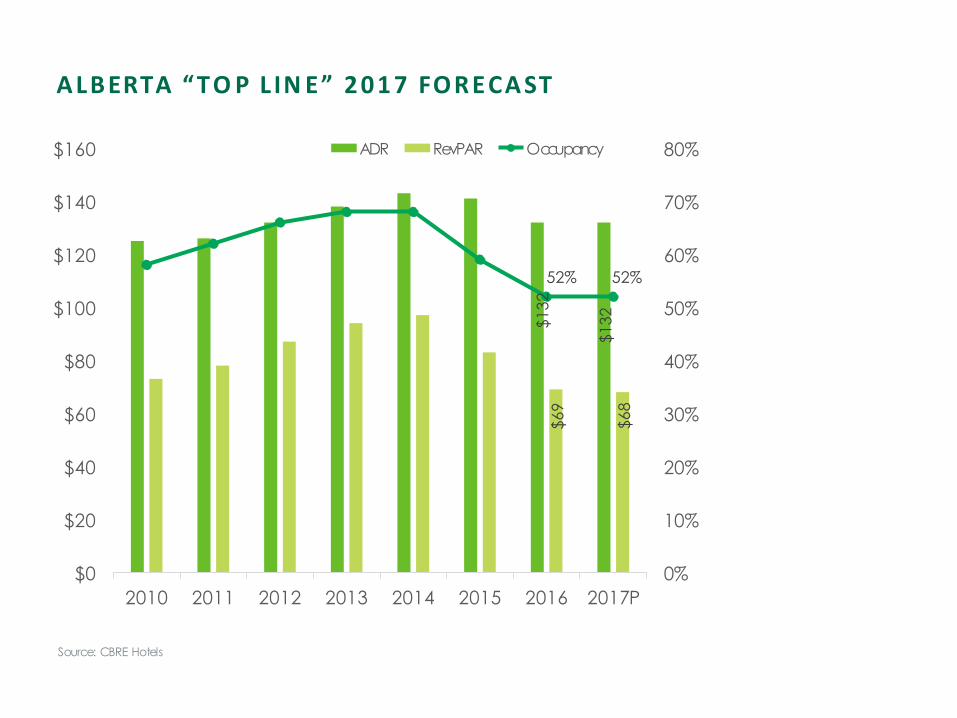
A LB ERTA “TO P L IN E” 2 0 1 7 FORECA ST
$1
32
$1
32
$6
9
$6
8
52% 52%
0%
10%
20%
30%
40%
50%
60%
70%
80%
$0
$20
$40
$60
$80
$100
$120
$140
$160
2010 2011 2012 2013 2014 2015 2016 2017P
ADR RevPAR Occupancy
Source: CBRE Hotels

A LB ERTA FIN A N CIA L FO RECA ST
$16.7
$18.7
$20.3
$15.7
$9.6 $8.8 $9.1 $9.6
$10.8 $11.8
$13.1 $13.9
$8
$6
$10
$12
$14
$16
$18
$20
$22
$24
2012 2013 2014 2015 2016 2017P
Ad
just
ed
Ne
t O
pe
ratin
g In
co
me
Pe
r A
va
ilab
le R
oo
m ($
00
0’s
)
AB NATIONAL
Source: CBRE Hotels
NOTE: Adjusted Net Operating Income is defined as income after property taxes, insurance, management fees,
franchise fees, and capital reserves; but before rent, interest, income taxes, depreciation and amortization.

Source: CBRE Hotels
HISTORI C EX PEN SE RATI O S – A LB ERTA FU LL SERVICE
YEAR 2015
Departmental Expenses $ Per Available Room % of Dept Revenue
Rooms $8,741 27.1%
Food & Beverage $12,636 68.5%
Other Operated Departments* $1,312 58.2%
Undistributed Expenses $ Per Available Room % of Total Revenue
Administration & General $3,721 6.9%
Information & Telecommunications
Systems
$754 1.4%
Sales & Marketing $3,430 6.4%
Property Op. & Maintenance $2,412 4.5%
Utilities $2,036 3.8%
Property and Other Taxes $1,780 3.3%
Insurance $302 0.6%

Source: CBRE Hotels
HISTORI C EX PEN SE RATI O S – A LB ERTA L IMITED SERVICE
YEAR 2015
Departmental Expenses $ Per Available Room % of Dept Revenue
Rooms $5,954 22.2%
Other Operated Departments* $214 45.6%
Undistributed Expenses $ Per Available Room % of Total Revenue
Administration & General $2,450 8.8%
Information & Telecommunications
Systems
$159 0.6%
Sales & Marketing $1,280 4.6%
Property Op. & Maintenance $1,782 6.4%
Utilities $1,103 3.9%
Property and Other Taxes $1,285 4.6%
Insurance $99 0.4%

INVESTMENT

H O TEL IN V ESTMEN T CYCLE
-15%
-10%
-5%
0%
5%
10%
$0
$500
$1,000
$1,500
$2,000
$2,500
2008 2009 2010
East
2011 2012 2013
National RevPAR Growth
2014 2015
West Central National GDP Growth

A LB ERTA TRA N SA CTIO N O VERVIEW
2% OF TOTAL TRANSACTION VOLUME IN CANADA IN 2016
Source: CBRE
Canada 2008 2009 2010 2011 2012 2013 2014 2015 2016
Total Transactions 96 74 89 102 103 131 136 135 234
Volume
($ Millions)
$1,090 $410 $730 $1,200 $1,090 $2,110 $1,400 $2,300 $4,000
Alberta 2008 2009 2010 2011 2012 2013 2014 2015 2016
Total Transactions 22 10 11 16 25 28 27 15 16
Volume ($ Millions) $344 $77 $111 $167 $335 $501 $293 $265 $78
% Volume of Total 32% 19% 15% 14% 31% 24% 21% 12% 2%

Source: CBRE Limited – Q4 2016 Canadian Cap Rates & Investment Insights
CA PITA LI ZA TI O N RATES
RESULTS FROM CBRE’S Q4 2016 CANADIAN CAP RATE SURVEY
Indicated Discount Rates (National): 9.0% - 13.5%
HOTEL PROPERTY TYPE NATIONAL CALGARY EDMONTON
Downtown Full Service 7.72% 7.75% - 8.75% 7.75% - 8.75%
Suburban Limited Service 9.03% 9.25% - 10.25% 10.0% - 10.5%
Focused Service 8.30% 8.25% - 9.25% 9.0% - 10.0%

K EY TA K EAWAYS
• Oil price uncertainty has significant impact on investment, economic
performance and ultimately accommodation performance
• Further declines in Top Line and Bottom Line performance for the
accommodation sector projected for 2017
• Resorts will continue to perform well, bolstered by both international and
domestic overnight travel
• Pace of new hotel construction slowing considerably, as capital is either
parked or developers looking elsewhere for opportunities
• Continue to search for new sources of room demand
• # of wells drilled in AB in 2017 forecast to be up vs. 2016 activity (PSAC
Forecast)
• Lower production costs for many firms enabling them to increase spending in
2017
• Efficiencies in drilling/production encouraging investment


