The recording of spatial distributions of infrared ra-diation has been done with materials, such as wax,1,2
oils,3,4 gelatin,5 gels,6 photoresist,7 and silicone.8These spatial distributions can be either thermal im-ages or interference patterns. The result of the in-teraction of infrared radiation with any one of thesematerials is the formation of a permanent or a tran-sient relief. Even though the materials mentionedabove show good characteristics, new materials withbetter characteristics are needed. In this paper wedescribe, to our knowledge for the first time, that arelief is formed when albumen films record distribu-tions of infrared light. In Section 2 the biomaterialand the method to fabricate albumen-recording filmsis described. In Section 3 the method to record ther-mal images is presented. In Section 4 the method torecord and test interference gratings is shown.Last, Section 5 describes the method to make micro-lenses.
2. Biomaterial
Egg white is called albumen.9 It consists of a groupof proteins called albumin. It is composed of approx-imately 75% of avalbumin, ovoconalbumin, ovomu-coid, ovomucin, ovoglobulin, lysozyme, and avidin.Proteins are biopolymers with molecular weights be-
S. Calixto �[email protected]� is with the Centro de Investi-gaciones en Optica, Apartado postal 1-948 Leon, GTO. C.P. 37000Mexico.
Received 10 June 2002; revised manuscript received 18 October2002.
tween 6000 to over 1 million. When a protein isexposed to conditions sufficiently different from itsnormal biological environment, a structural change,called denaturation, leaves the protein unable toserve its normal function. Relatively small changesin solution temperature, or pH, may cause this dena-turation. However, if these changes are strongenough an irreversible cross linking of the denatur-ated protein occurs. This state is called coagulation.Albumen coagulates at 61 °C.
Films capable of recording infrared patterns weremade of albumen obtained from chicken eggs. First,albumen was separated from the yolk. Then it wasplaced in a beaker and stirred for approximately 15minutes to homogenize the mixture. A portion waspoured over a level glass plate. No attempt wasmade to find the concentration of albumin proteins.
3. Recording Thermal Images
To record thermal images on albumen films the layout shown in Fig. 1 was used. A beam from a CO2laser �� � 10.6 �m� was focused with a germaniumlens onto a pinhole to obtain a diffraction-limitedbeam. This beam then illuminated a metallic plate�object� that had some character punched out. Asecond Ge lens, placed at 2f � f � focal length� fromthe object, was used to form the image of the object onthe egg-white film. At recording time this film wasin a colloid state and could flow. To prevent the filmfrom running, the infrared-beam path was folded 90°by a copper mirror so that the film could remainhorizontal during the recording.
One of the objects chosen consisted of two sets ofthree slits each. Three slits were vertical and theother three slits were horizontal. They were punchedout in a metallic sheet. In the recording configuration
the first set of three slits were uniformly illuminated.The second set was poorly illuminated.
After recording on the albumen film the relief im-age was studied with a microscope �Fig. 2�a��. Tomeasure the relief of the recorded image a surfaceanalyzer was used. In Fig. 2�a� an arrow indicatesthe direction that the analyzer needle followed. InFig. 2�b� a depth height of approximately 3.5 �m canbe seen. The thickness of the film was approxi-mately 3 �m.
To study the relation of the depth of the relief as afunction of the exposure time, keeping the beampower fixed, the following experiment was done. Aslit was punched out in a metallic sheet that was usedas an object as shown in Fig. 1. Its thermal image
recorded with an infrared camera can be seen in Fig.3�a�. Then several albumen films were preparedwith the same amount of albumen to ensure that theyall had the same thickness. After the recording anddrying process the film thickness was approximately3.5 �m. Exposure times were 1 min, 2.5 min, and 5min and the beam power was 125 mW. After expo-sure, the relief of the slit-recorded images was mea-sured with the surface analyzer and is shown in Fig.3�b�. Notice that when the exposure time increasesso does the depth of the relief.
4. Recording Interference Gratings
The phenomenon of wavefront reconstruction �holog-raphy� is mainly developed with visible light sources.However, some advantages are shown when infraredlight is used, for example: �a� materials which donot transmit visible light but do transmit infraredcould be studied, �b� interferometric configurationssensitivity to vibrations decreases when infraredlight is used, �c� large deformations could be studiedbetter because fewer interference fringes will appearin the field of view of the infrared interferometer.Here we present a study of the recording of infraredinterference patterns on albumen films.
Albumen’s ability to record straight-line infrared in-
Fig. 1. Recording configuration.
Fig. 2. �a� Photograph of the surface relief image, �b� cross section relief of the slits showed in �a�.
Fig. 3. �a� Graph showing the infrared intensity values of the image to be recorded, �b� profiles of three recordings. Parameter was theexposure time.
terference patterns �� � 10.6 �m� with different spa-tial frequencies was tested as follows: A two-beaminterference lay out with plane waves was set up.The intensity of each beam was studied by use of aninfrared camera that showed that the intensity of thecentral area was the highest. These two coherentbeams were then overlapped and an interferogramwas formed that consisted of a set of bright and darklines. These are shown in Fig. 4�a�. At the bottom ofthis figure one can see the pattern’s spatial intensityprofile. Note that the intensity minimum value is notzero in the central area. This interferogram was re-corded on an albumen film with a thickness of approx-imately 2.5 �m; the power at the recording area wasapproximately 300 mW. In Fig. 4�b� one can see aprofile of the recorded grating relief and the intensityvariations shown at the bottom of Fig. 4�a�. We cansee a resemblance between the two curves. It is notedthat during exposure time a He–Ne beam illuminatedthe recording area. This beam was diffracted by theevolving grating. Approximately 4 s after the start ofthe exposure time the diffracted orders could be seen.This tells us that a small relief or a change in refractiveindex was done by the coagulation of albumen by in-frared light. Absorbed energy at that stage was about1.2 J �300 mW � 4 s�. This amount of energy is closeto the value reported in Reference 7 when photoresistmaterial is used.
Among the gratings fabricated with low spatial fre-quency �1.6 l�mm� one was chosen to measure itsinfrared diffraction efficiency in reflection. To havegood infrared reflectance the grating was aluminizedin a vacuum chamber. A beam of light from a CO2laser was directed to its surface. Depending onwhere the beam illuminated the grating, values of theintensity distribution of the diffracted orders werechanged indicating that the modulation was not uni-form over the entire grating surface. This was pos-sibly due to the high intensity at the center of the
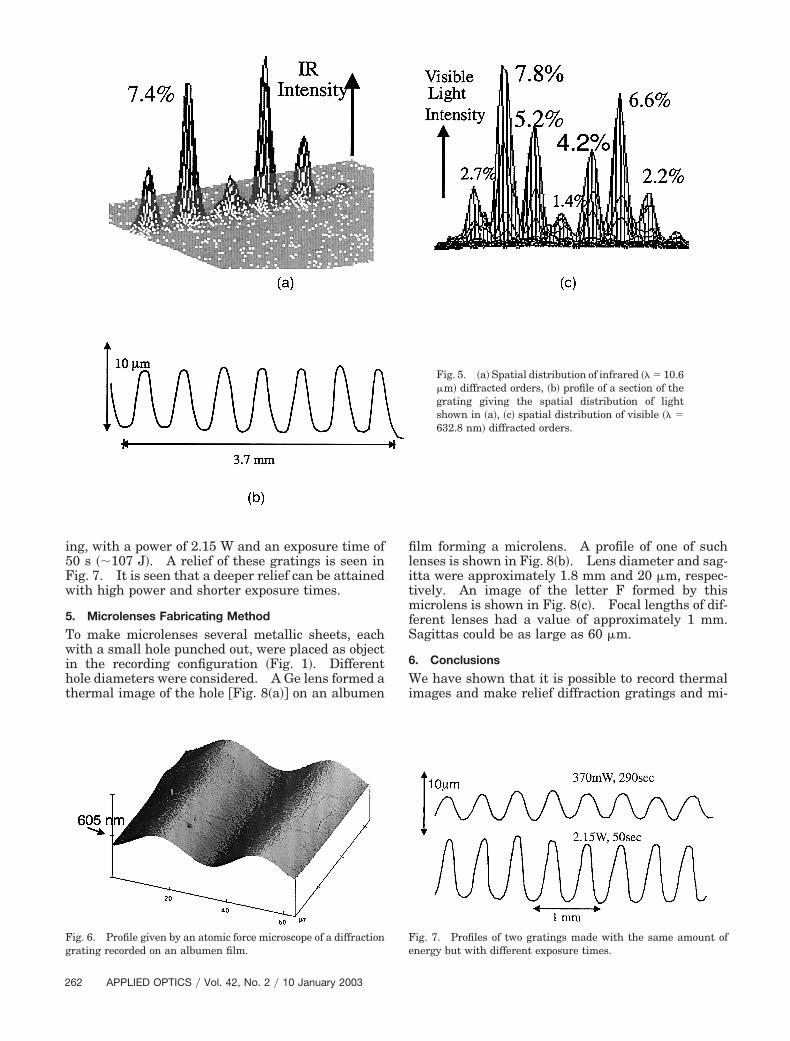
recording beams, as was mentioned previously. InFig. 5�a� it is seen that orders 1 and �1 have higherintensities than the zero order showing a diffractionefficiency of approximately 7.4% each. A profile ofsome area of this grating, measured with a surfaceanalyzer, is shown in Fig. 5�b�.
The second grating that was tested for diffractionefficiency had a spatial frequency of approximately4.3 l�mm. The diffraction efficiency was measuredin transmission for visible light �� � 632.8 nm�. Awedge was placed in contact with the substrate to avoidmultiple reflections. A graph showing the efficiencies ofseveral diffraction orders is shown in Fig. 5�c�.
Interference gratings with higher spatial frequen-cies were made including some with frequencies of 13l�mm, 28 l�mm, 37 l�mm, and 55 l�mm. Diffractionefficiencies for a grating with 37 l�mm was approxi-mately 0.37% and for 55 l�mm approximately0.055%. Gratings with 37 l�mm were measuredwith the surface analyzer showing a modulation ofapproximately 0.1 �m. Figure 6 shows the profile ofa grating �28 l�mm� when it was studied with anatomic force microscope. The limited response of al-bumen to spatial frequencies higher than approxi-mately 20 l�mm is also shown by most of thematerials mentioned in the references. At high spa-tial frequencies the distance between two close linesis small and owing to lateral heath conduction themodulation between lines is erased during exposuretime. To overcome this fact pulsed lasers have beenused.7 Because the relief of the low spatial fre-quency gratings recorded in albumen films can belarge these microelements show good infrared diffrac-tion efficiencies. The materials mentioned in thereferences do not show this characteristic.
To test for the effects of reciprocity two gratingswere made with the same amount of energy. Thefirst grating was made with a power of 370 mW andan exposure time of 290 s �107 J�: the second grat-
Fig. 4. �a� Photograph of the infrared interference pattern, �b� Intensity profile of the center of the pattern for comparison with the profileof the pattern recorded on an albumen film. Curves do not have the same scale of the spatial coordinate X.
ing, with a power of 2.15 W and an exposure time of50 s �107 J�. A relief of these gratings is seen inFig. 7. It is seen that a deeper relief can be attainedwith high power and shorter exposure times.
5. Microlenses Fabricating Method
To make microlenses several metallic sheets, eachwith a small hole punched out, were placed as objectin the recording configuration �Fig. 1�. Differenthole diameters were considered. A Ge lens formed athermal image of the hole �Fig. 8�a�� on an albumen
film forming a microlens. A profile of one of suchlenses is shown in Fig. 8�b�. Lens diameter and sag-itta were approximately 1.8 mm and 20 �m, respec-tively. An image of the letter F formed by thismicrolens is shown in Fig. 8�c�. Focal lengths of dif-ferent lenses had a value of approximately 1 mm.Sagittas could be as large as 60 �m.
6. Conclusions
We have shown that it is possible to record thermalimages and make relief diffraction gratings and mi-
Fig. 5. �a� Spatial distribution of infrared �� � 10.6�m� diffracted orders, �b� profile of a section of thegrating giving the spatial distribution of lightshown in �a�, �c� spatial distribution of visible �� �632.8 nm� diffracted orders.
Fig. 6. Profile given by an atomic force microscope of a diffractiongrating recorded on an albumen film.
Fig. 7. Profiles of two gratings made with the same amount ofenergy but with different exposure times.
crolenses on albumen films. This is due to the coag-ulation of albumen films by infrared radiation.Fabricated gratings work in transmission for visiblelight or by reflection for infrared and visible light.Also it is possible to read the evolving gratings, dur-ing the recording time, by sending a visible lightbeam.
At present we are developing more studies to findthe role in coagulation of each of the chemical com-ponents of albumen. This will enable us to havemore reproducible results. Additionally, we are try-ing albumen from other sources, such as rabbit, rat,and bovine, for example.
We thank Myrna Sabanero, Francisco Sanchez-Marin, and Orestes Stavroudis for productive discus-sions. The Mexican National Council of Science andTechnology supported part of this work.
References1. S. Kobayashi and K. Kurihara, “Infrared holography with wax
and gelatin films,” Appl. Phys. Lett. 19, 482–484 �1971�.
2. R. Bealieu, R. A. Lessard, M. Cormier, M. Blanchard, and M.Rioux, “Infrared holography on commercial wax at 10.6 �m,”Appl. Phys. Lett. 31, 602–603 �1977�.
3. M. Cormier, M. Blanchard, M. Rioux, and R. Beaulieu, “Holog-raphie en infrarouge sur des minces couches d’huile,” Appl. Opt.17, 3622–3626 �1978�.
4. J. Lewandowsky, B. Mongeau, and M. Cormier, “Real time in-terferometry using IR holography on oil films,” Appl. Opt. 23,242–246 �1984�.
5. S. Calixto, “Infrared recording with gelatin films,” Appl. Opt. 27,1977–1983 �1988�. See references therein.
6. S. Calixto, M. Salazar, and M. Servin, “Photosensitive elementfor an infrared to visible image converter,” Appl. Opt. 34, 3589–3594 �1995�.
7. R. Beaulieu, R. A. Lessard, and S. Ling Chin, “Resist recordingmedia for holography at 10.6 mm,” in Photopolymers and ap-plications in holography, optical data storage, optical sensors,and interconnects, R. A. Lessard, ed. Proc. SPIE 2042, 280–284�1994�.
8. S. Calixto, “Silicone microlenses and interference gratings,”Appl. Opt. 41, 3355–3361 �2002�.
9. J. E. Bailey and David F. Ollis, Biochemical Engineering Fun-damentals, �McGraw-Hill, New York, 1986�.
Fig. 8. �a� Spatial distribution of infrared light that formed athermal image of a microlens, �b� profile of a microlens made onalbumen film, �c� image of the letter F given by the microlens.