rda/ml/ap_school_reports 2/18/2009 Albuquerque High School 2008 AP Report The data in the following figures and table only pertain to Albuquerque High School. The data look at the trends for total school enrollment, as well as ethnic and gender participation in AP courses for the past five years. Lastly, enrollment in each AP course at the school for the past two years is shown. The school report supplements the AP District Report (available at rda.aps.edu) which also includes some school data. This short report is for informational purposes for the school. Figure 1 shows the growth in enrollment over the past five years. Figure 1 Growth in AP Enrollment (Albuquerque) 469 461 458 564 286 0 100 200 300 400 500 600 2003-04 2004-05 2005-06 2006-07 2007-08 School Year Enrollment
Transcript
rda/ml/ap_school_reports 2/18/2009
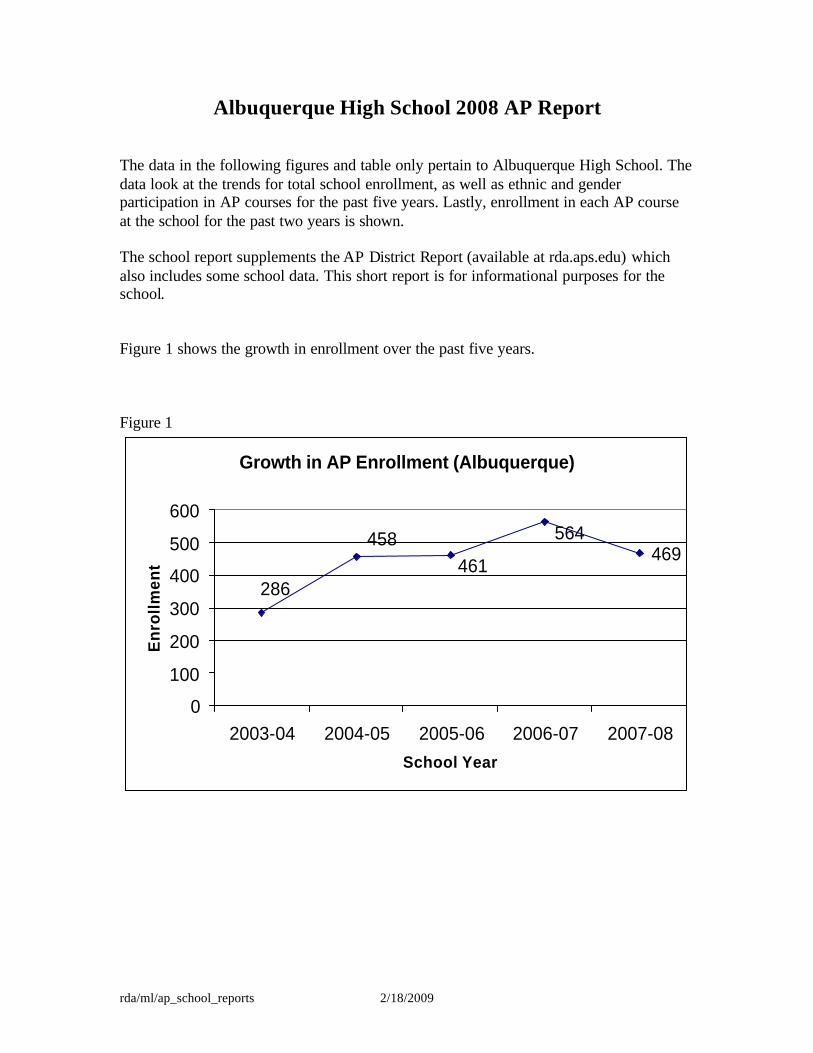
Albuquerque High School 2008 AP Report The data in the following figures and table only pertain to Albuquerque High School. The data look at the trends for total school enrollment, as well as ethnic and gender participation in AP courses for the past five years. Lastly, enrollment in each AP course at the school for the past two years is shown. The school report supplements the AP District Report (available at rda.aps.edu) which also includes some school data. This short report is for informational purposes for the school. Figure 1 shows the growth in enrollment over the past five years. Figure 1
Growth in AP Enrollment (Albuquerque)
469461
458 564
286
0
100
200
300
400
500
600
2003-04 2004-05 2005-06 2006-07 2007-08School Year
En
rollm
ent
rda/ml/ap_school_reports 2/18/2009
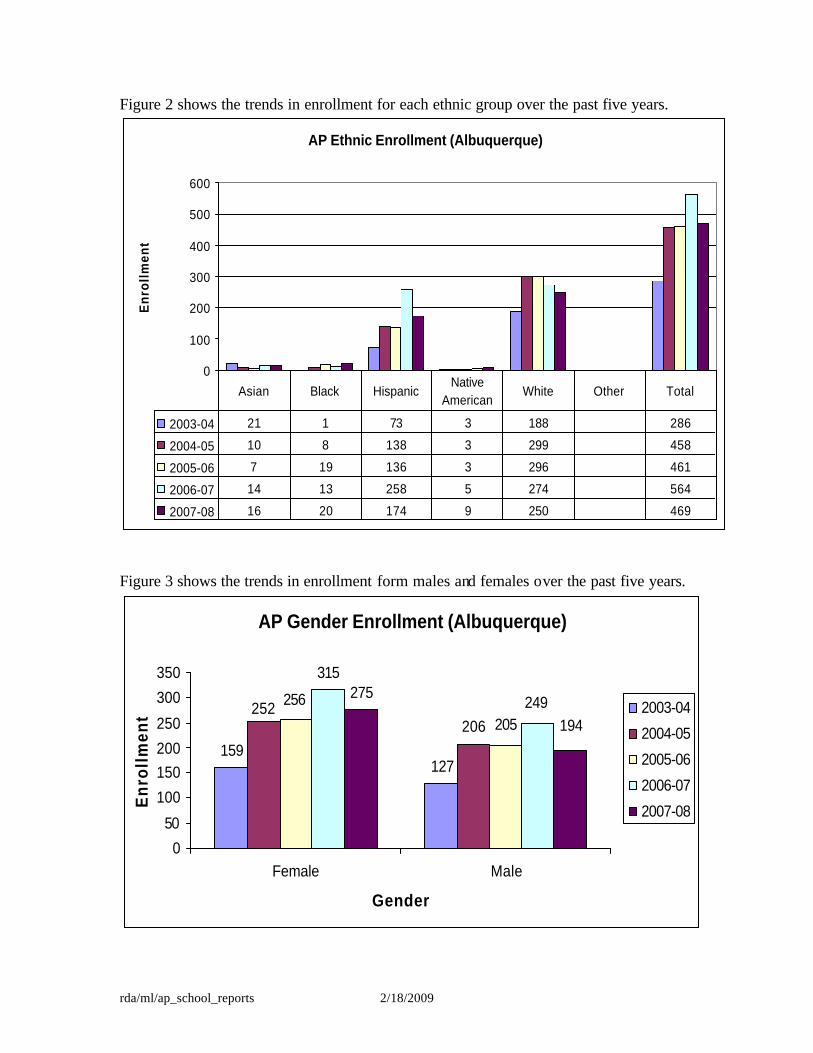
Figure 2 shows the trends in enrollment for each ethnic group over the past five years.
AP Ethnic Enrollment (Albuquerque)
0
100
200
300
400
500
600
En
roll
men
t
2003-04 21 1 73 3 188 286
2004-05 10 8 138 3 299 458
2005-06 7 19 136 3 296 461
2006-07 14 13 258 5 274 564
2007-08 16 20 174 9 250 469
Asian Black HispanicNative
AmericanWhite Other Total
Figure 3 shows the trends in enrollment form males and females over the past five years.
AP Gender Enrollment (Albuquerque)
159127
206
315275
252 256
205249
194
0
50
100
150200
250
300
350
Female Male
Gender
En
roll
men
t 2003-04
2004-05
2005-06
2006-07
2007-08
rda/ml/ap_school_reports 2/18/2009
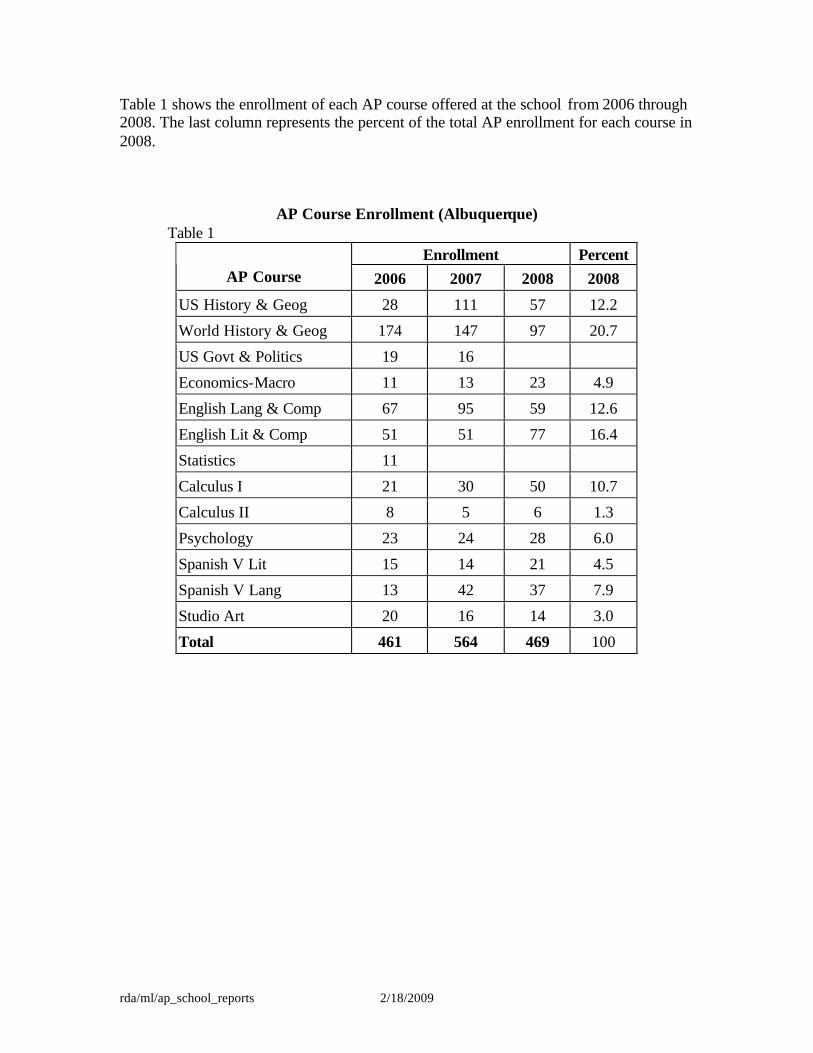
Table 1 shows the enrollment of each AP course offered at the school from 2006 through 2008. The last column represents the percent of the total AP enrollment for each course in 2008.
AP Course Enrollment (Albuquerque) Table 1
Enrollment Percent AP Course 2006 2007 2008 2008
US History & Geog 28 111 57 12.2
World History & Geog 174 147 97 20.7
US Govt & Politics 19 16
Economics-Macro 11 13 23 4.9
English Lang & Comp 67 95 59 12.6
English Lit & Comp 51 51 77 16.4
Statistics 11
Calculus I 21 30 50 10.7
Calculus II 8 5 6 1.3
Psychology 23 24 28 6.0
Spanish V Lit 15 14 21 4.5
Spanish V Lang 13 42 37 7.9
Studio Art 20 16 14 3.0
Total 461 564 469 100
rda/ml/ap_school_reports 2/18/2009
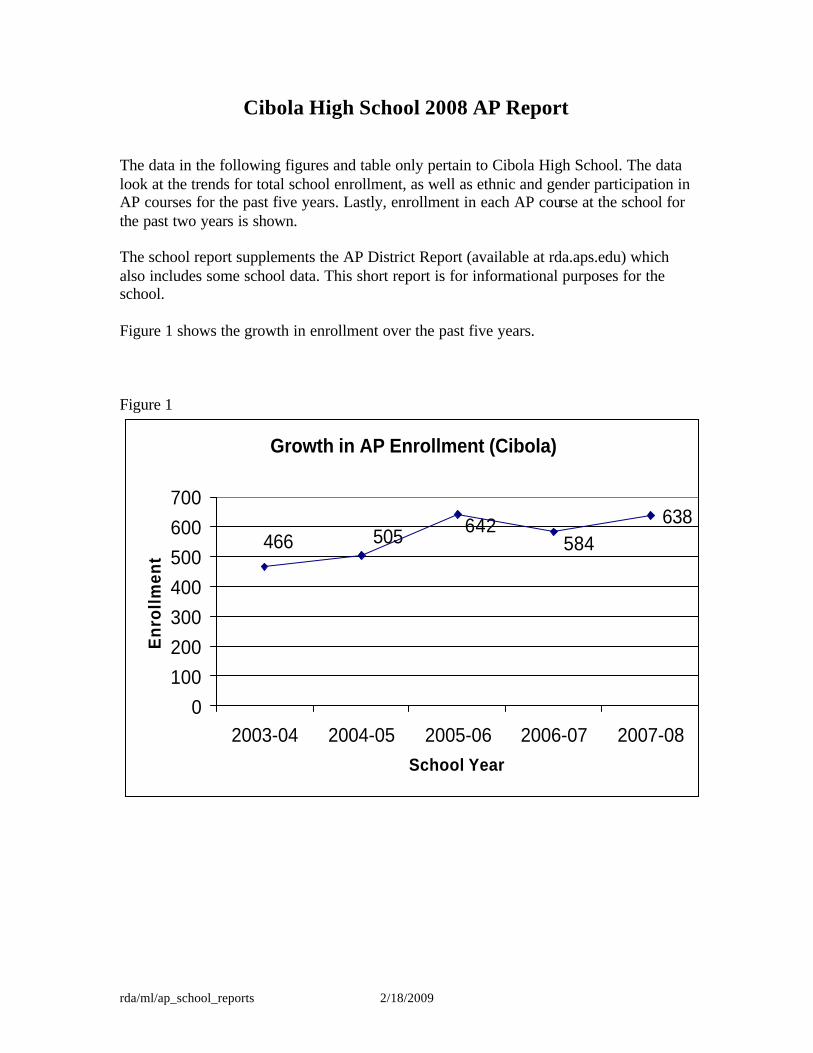
Cibola High School 2008 AP Report The data in the following figures and table only pertain to Cibola High School. The data look at the trends for total school enrollment, as well as ethnic and gender participation in AP courses for the past five years. Lastly, enrollment in each AP course at the school for the past two years is shown. The school report supplements the AP District Report (available at rda.aps.edu) which also includes some school data. This short report is for informational purposes for the school. Figure 1 shows the growth in enrollment over the past five years. Figure 1
Growth in AP Enrollment (Cibola)
638466 584505 642
0100200300400500600700
2003-04 2004-05 2005-06 2006-07 2007-08School Year
En
roll
men
t
rda/ml/ap_school_reports 2/18/2009
Figure 2 shows the trends in enrollment for each ethnic group over the past five years.
AP Ethnic Enrollment (Cibola)
0
100
200
300
400
500
600
700
En
rollm
ent
2003-04 14 12 111 7 315 7 466
2004-05 16 5 126 8 347 3 505
2005-06 22 13 153 12 442 642
2006-07 30 22 141 12 379 584
2007-08 38 23 174 12 391 638
Asian Black HispanicNative
AmericanWhite Other Total
Figure 3 shows the trends in enrollment for males and females over the past five years.
AP Gender Enrollment (Cibola)
261205 199
340375
306
392
250 244263
0
100
200
300
400
500
Female Male
Gender
En
roll
men
t 2003-04
2004-05
2005-06
2006-07
2007-08
rda/ml/ap_school_reports 2/18/2009
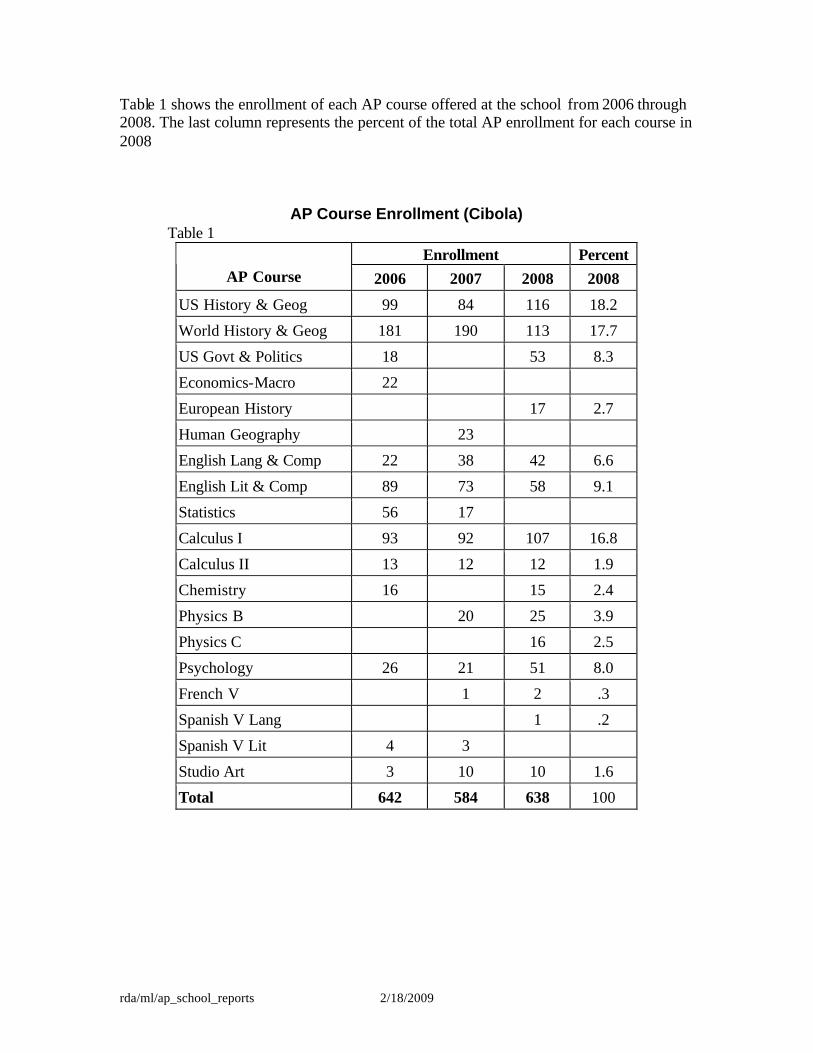
Table 1 shows the enrollment of each AP course offered at the school from 2006 through 2008. The last column represents the percent of the total AP enrollment for each course in 2008
AP Course Enrollment (Cibola) Table 1
Enrollment Percent AP Course 2006 2007 2008 2008
US History & Geog 99 84 116 18.2
World History & Geog 181 190 113 17.7
US Govt & Politics 18 53 8.3
Economics-Macro 22
European History 17 2.7
Human Geography 23
English Lang & Comp 22 38 42 6.6
English Lit & Comp 89 73 58 9.1
Statistics 56 17
Calculus I 93 92 107 16.8
Calculus II 13 12 12 1.9
Chemistry 16 15 2.4
Physics B 20 25 3.9
Physics C 16 2.5
Psychology 26 21 51 8.0
French V 1 2 .3
Spanish V Lang 1 .2
Spanish V Lit 4 3
Studio Art 3 10 10 1.6
Total 642 584 638 100
rda/ml/ap_school_reports 2/18/2009
Del Norte High School 2008 AP Report The data in the following figures and table only pertain to Del Norte High School. The data look at the trends for total school enrollment, as well as ethnic and gender participation in AP courses for the past five years. Lastly, enrollment in each AP course at the school for the past two years is shown. The school report supplements the AP District Report (available at rda.aps.edu) which also includes some school data. This short report is for informational purposes for the school. Figure 1 shows the growth in enrollment over the past five years. Figure 1
Growth in AP Enrollment (Del Norte)
405
124251137 284
0
100
200
300
400
500
2003-04 2004-05 2005-06 2006-07 2007-08
School Year
En
roll
men
t
rda/ml/ap_school_reports 2/18/2009
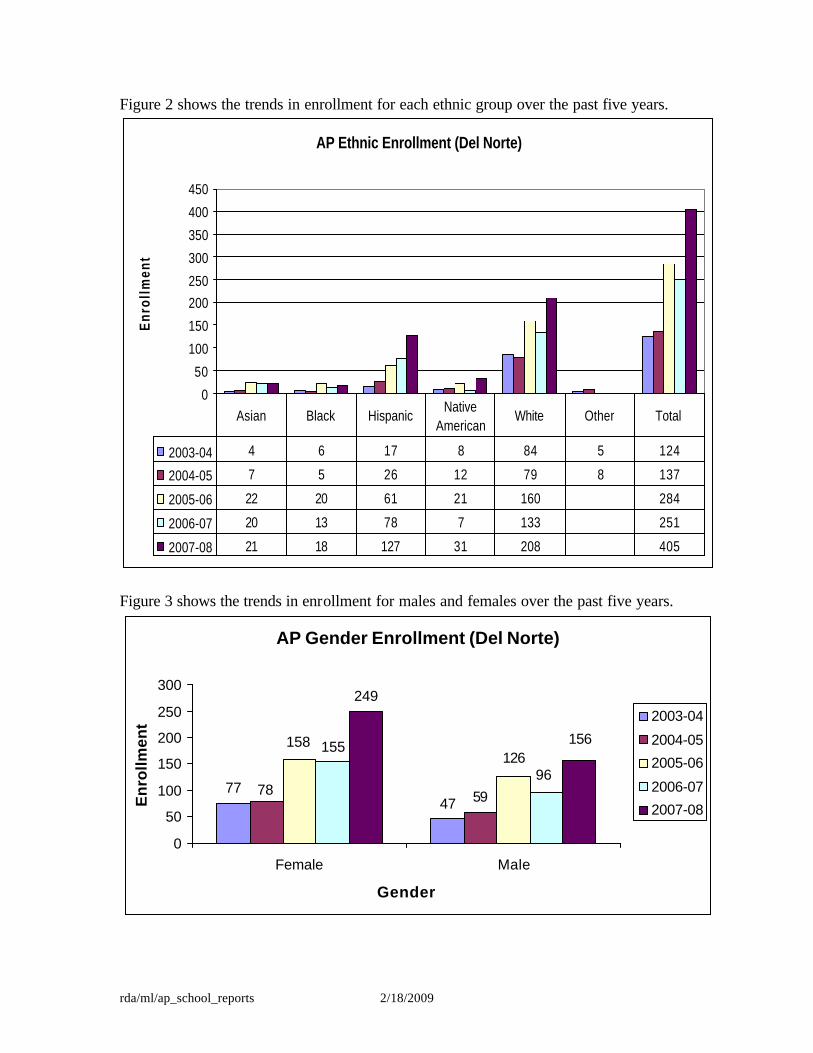
Figure 2 shows the trends in enrollment for each ethnic group over the past five years.
AP Ethnic Enrollment (Del Norte)
0
50
100
150
200
250
300
350
400
450
Enr
ollm
ent
2003-04 4 6 17 8 84 5 124
2004-05 7 5 26 12 79 8 137
2005-06 22 20 61 21 160 284
2006-07 20 13 78 7 133 251
2007-08 21 18 127 31 208 405
Asian Black HispanicNative
AmericanWhite Other Total
Figure 3 shows the trends in enrollment for males and females over the past five years.
AP Gender Enrollment (Del Norte)
7747 59
155
249
78
158126
96
156
0
50
100
150
200
250
300
Female Male
Gender
En
rollm
ent 2003-04
2004-05
2005-06
2006-07
2007-08
rda/ml/ap_school_reports 2/18/2009
Table 1 shows the enrollment of each AP course offered at the school from 2006 through 2008. The last column represents the percent of the total AP enrollment for each course in 2008. Table 1
AP Course Enrollment (Del Norte)
Enrollment Percent AP Course 2006 2007 2008 2008
US History & Geog 57 25 46 11.4 World History & Geog 72 42 60 14.8 US Govt & Politics 32 37 51 12.6 Economics-Macro 28 33 48 11.9 English Lit & Comp 46 71 71 17.5 English Lang & Comp 89 22.0 Calculus I 25 22 20 4.9 Physics B 20 18 17 4.2 German 4 2 .5 Spanish V Lit 2 1 .2 Spanish V Lang 1 Total 284 251 405 100
rda/ml/ap_school_reports 2/18/2009
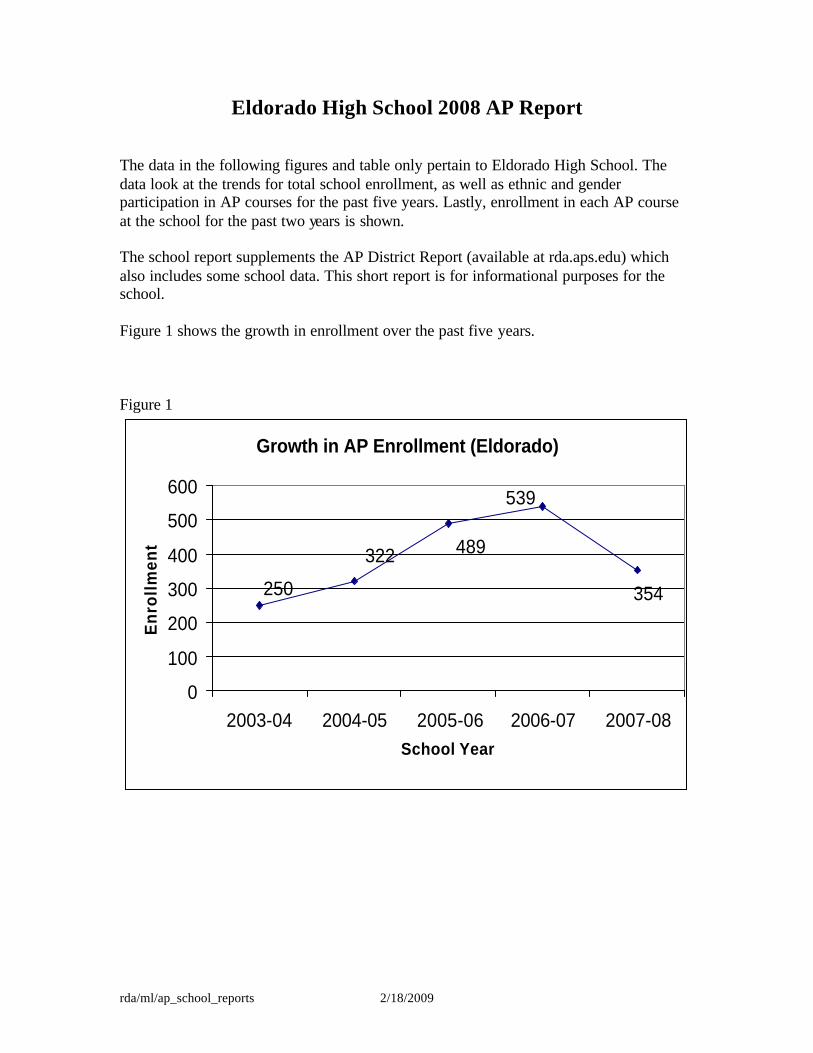
Eldorado High School 2008 AP Report The data in the following figures and table only pertain to Eldorado High School. The data look at the trends for total school enrollment, as well as ethnic and gender participation in AP courses for the past five years. Lastly, enrollment in each AP course at the school for the past two years is shown. The school report supplements the AP District Report (available at rda.aps.edu) which also includes some school data. This short report is for informational purposes for the school. Figure 1 shows the growth in enrollment over the past five years. Figure 1
Growth in AP Enrollment (Eldorado)
354250
539
322 489
0
100
200
300
400
500
600
2003-04 2004-05 2005-06 2006-07 2007-08School Year
En
roll
men
t
rda/ml/ap_school_reports 2/18/2009
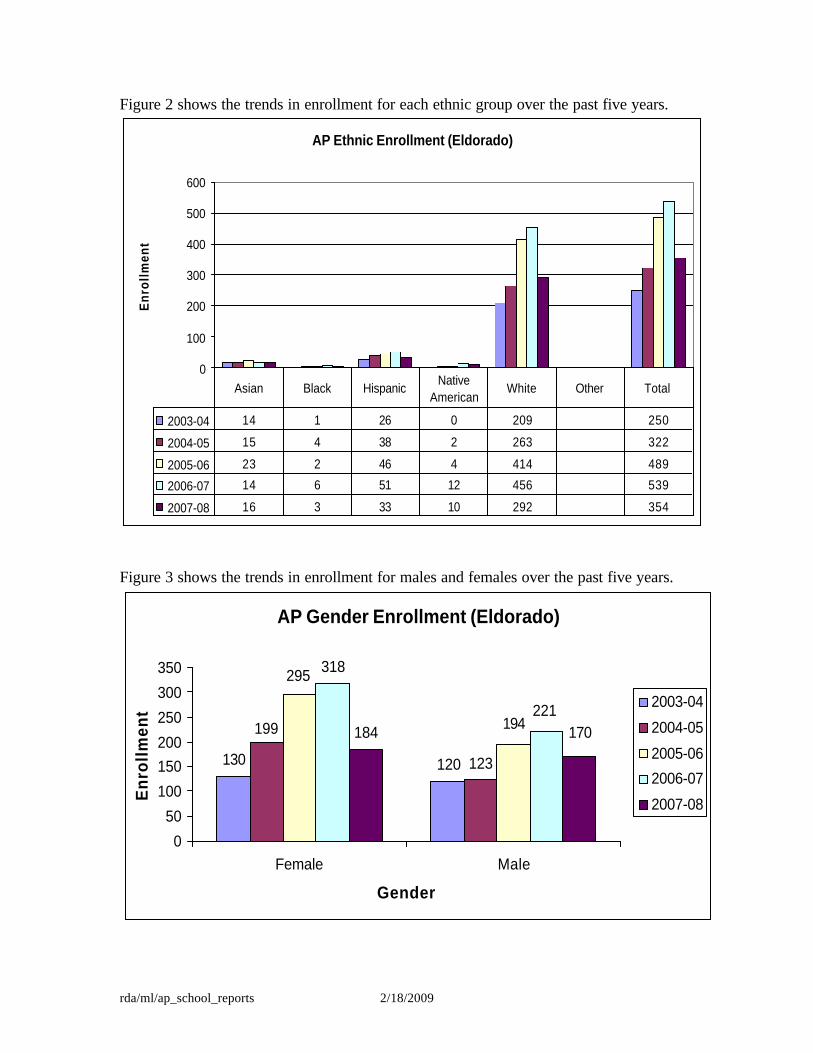
Figure 2 shows the trends in enrollment for each ethnic group over the past five years.
AP Ethnic Enrollment (Eldorado)
0
100
200
300
400
500
600
Enr
ollm
ent
2003-04 14 1 26 0 209 250
2004-05 15 4 38 2 263 322
2005-06 23 2 46 4 414 489
2006-07 14 6 51 12 456 539
2007-08 16 3 33 10 292 354
Asian Black HispanicNative
AmericanWhite Other Total
Figure 3 shows the trends in enrollment for males and females over the past five years.
AP Gender Enrollment (Eldorado)
130 120 123
318
184199
295
194221
170
0
50
100
150200
250
300
350
Female Male
Gender
En
roll
men
t 2003-04
2004-05
2005-06
2006-07
2007-08
rda/ml/ap_school_reports 2/18/2009
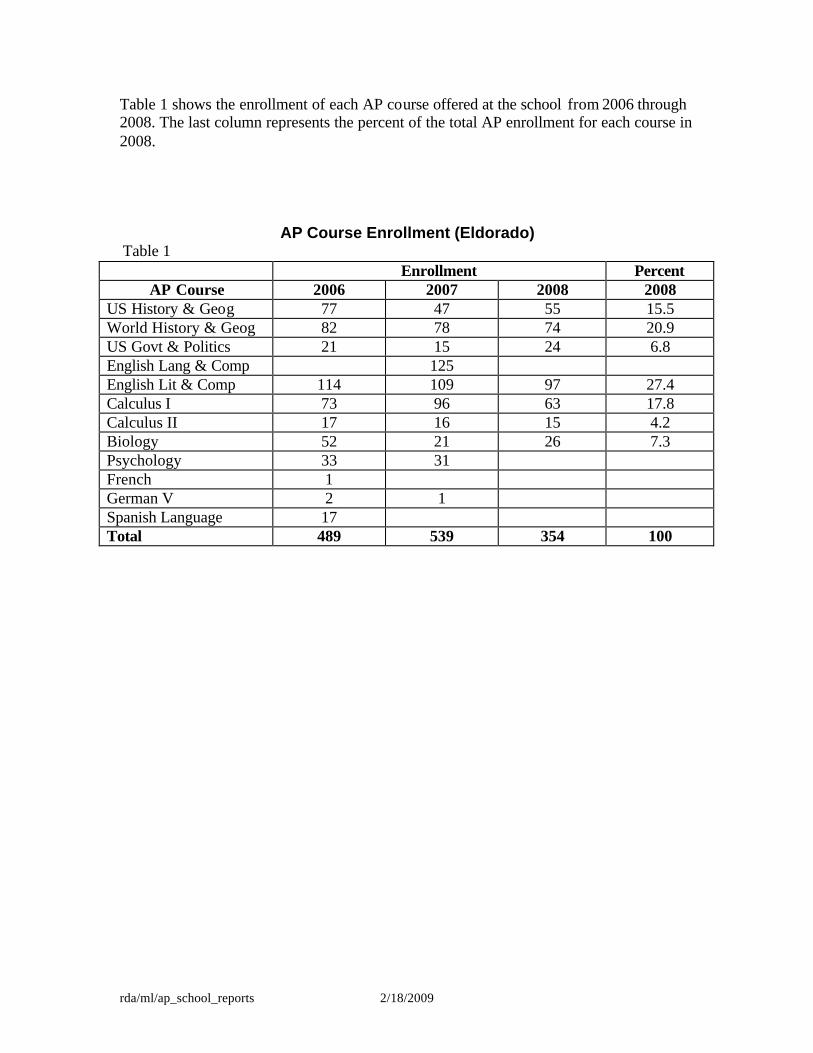
Table 1 shows the enrollment of each AP course offered at the school from 2006 through 2008. The last column represents the percent of the total AP enrollment for each course in 2008.
AP Course Enrollment (Eldorado) Table 1
Enrollment Percent AP Course 2006 2007 2008 2008
US History & Geog 77 47 55 15.5 World History & Geog 82 78 74 20.9 US Govt & Politics 21 15 24 6.8 English Lang & Comp 125 English Lit & Comp 114 109 97 27.4 Calculus I 73 96 63 17.8 Calculus II 17 16 15 4.2 Biology 52 21 26 7.3 Psychology 33 31 French 1 German V 2 1 Spanish Language 17 Total 489 539 354 100
rda/ml/ap_school_reports 2/18/2009
Highland High School 2008 AP Report
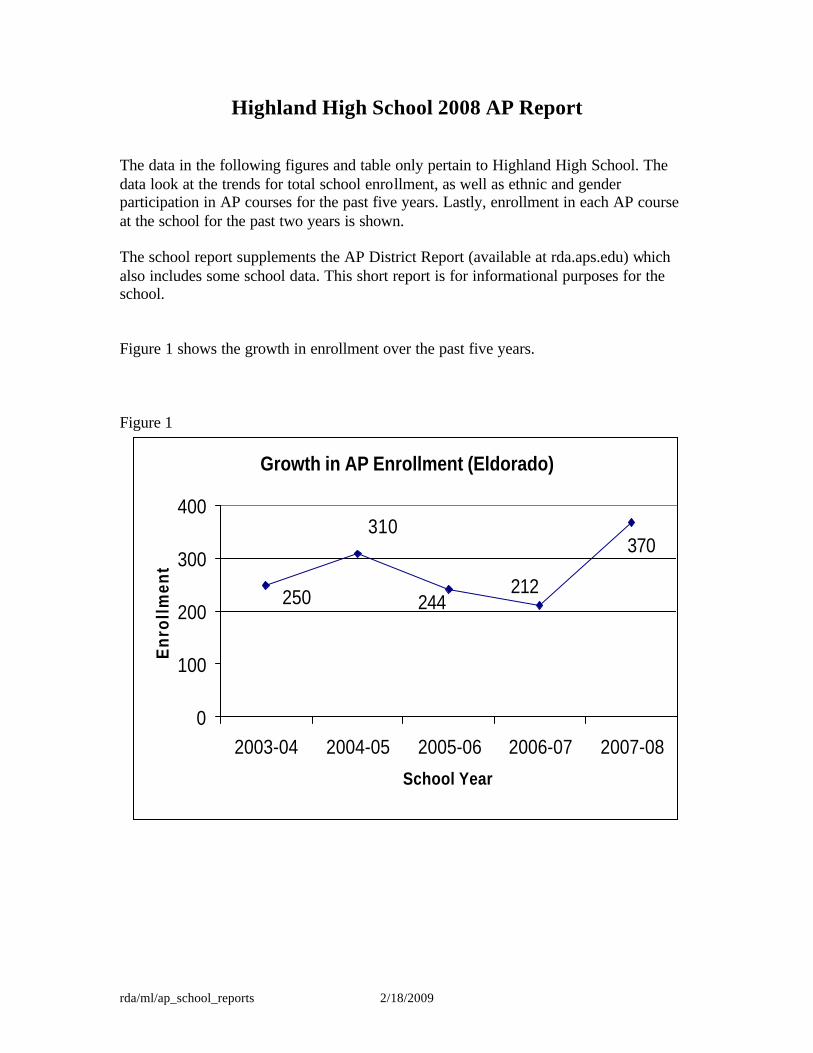
The data in the following figures and table only pertain to Highland High School. The data look at the trends for total school enrollment, as well as ethnic and gender participation in AP courses for the past five years. Lastly, enrollment in each AP course at the school for the past two years is shown. The school report supplements the AP District Report (available at rda.aps.edu) which also includes some school data. This short report is for informational purposes for the school. Figure 1 shows the growth in enrollment over the past five years. Figure 1
Growth in AP Enrollment (Eldorado)
370
250 212
310
244
0
100
200
300
400
2003-04 2004-05 2005-06 2006-07 2007-08
School Year
Enr
ollm
ent
rda/ml/ap_school_reports 2/18/2009
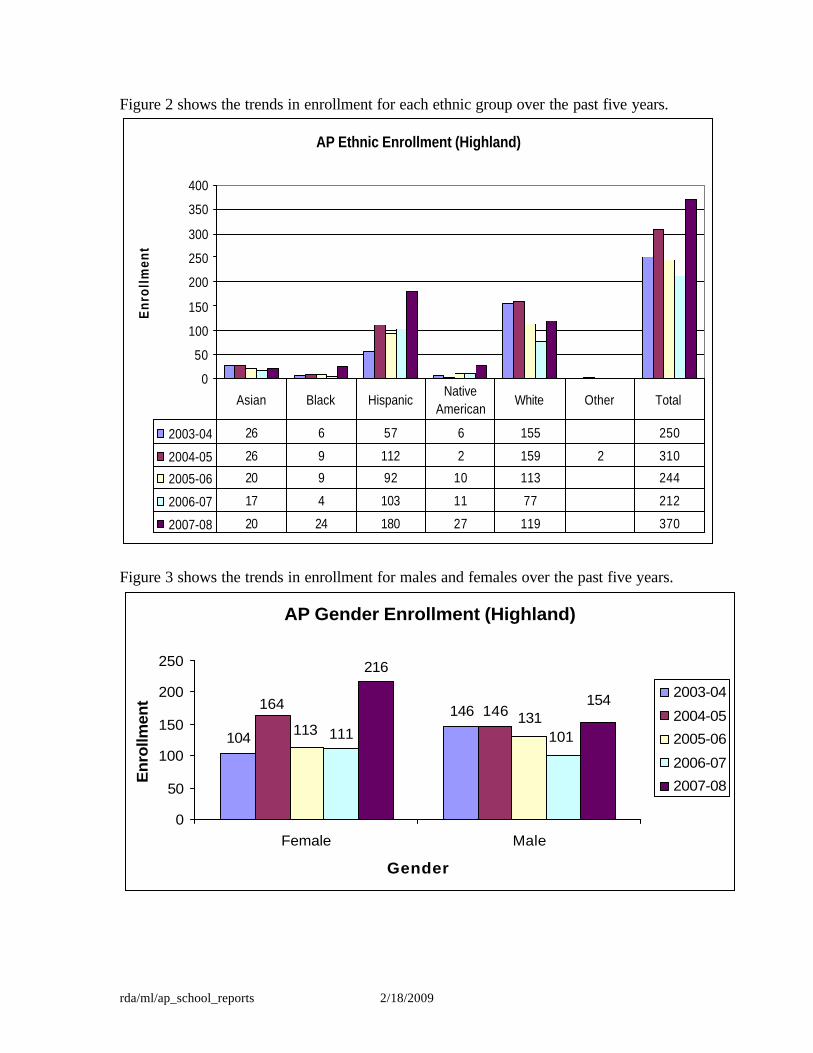
Figure 2 shows the trends in enrollment for each ethnic group over the past five years.
AP Ethnic Enrollment (Highland)
0
50
100
150
200
250
300
350
400
Enr
ollm
ent
2003-04 26 6 57 6 155 250
2004-05 26 9 112 2 159 2 310
2005-06 20 9 92 10 113 244
2006-07 17 4 103 11 77 212
2007-08 20 24 180 27 119 370
Asian Black HispanicNative
AmericanWhite Other Total
Figure 3 shows the trends in enrollment for males and females over the past five years.
AP Gender Enrollment (Highland)
104
146 146
111
216
164
113131
101
154
0
50
100
150
200
250
Female Male
Gender
En
rollm
ent 2003-04
2004-05
2005-06
2006-07
2007-08
rda/ml/ap_school_reports 2/18/2009
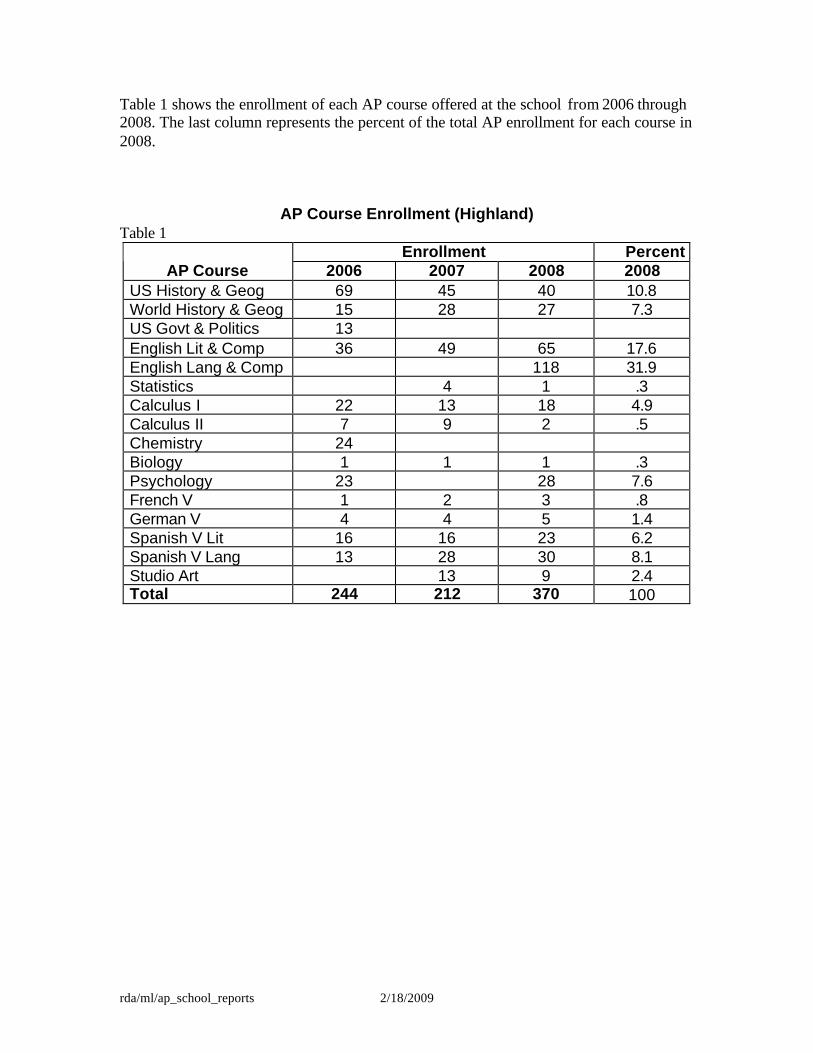
Table 1 shows the enrollment of each AP course offered at the school from 2006 through 2008. The last column represents the percent of the total AP enrollment for each course in 2008.
AP Course Enrollment (Highland) Table 1
Enrollment Percent AP Course 2006 2007 2008 2008
US History & Geog 69 45 40 10.8 World History & Geog 15 28 27 7.3 US Govt & Politics 13 English Lit & Comp 36 49 65 17.6 English Lang & Comp 118 31.9 Statistics 4 1 .3 Calculus I 22 13 18 4.9 Calculus II 7 9 2 .5 Chemistry 24 Biology 1 1 1 .3 Psychology 23 28 7.6 French V 1 2 3 .8 German V 4 4 5 1.4 Spanish V Lit 16 16 23 6.2 Spanish V Lang 13 28 30 8.1 Studio Art 13 9 2.4 Total 244 212 370 100
rda/ml/ap_school_reports 2/18/2009
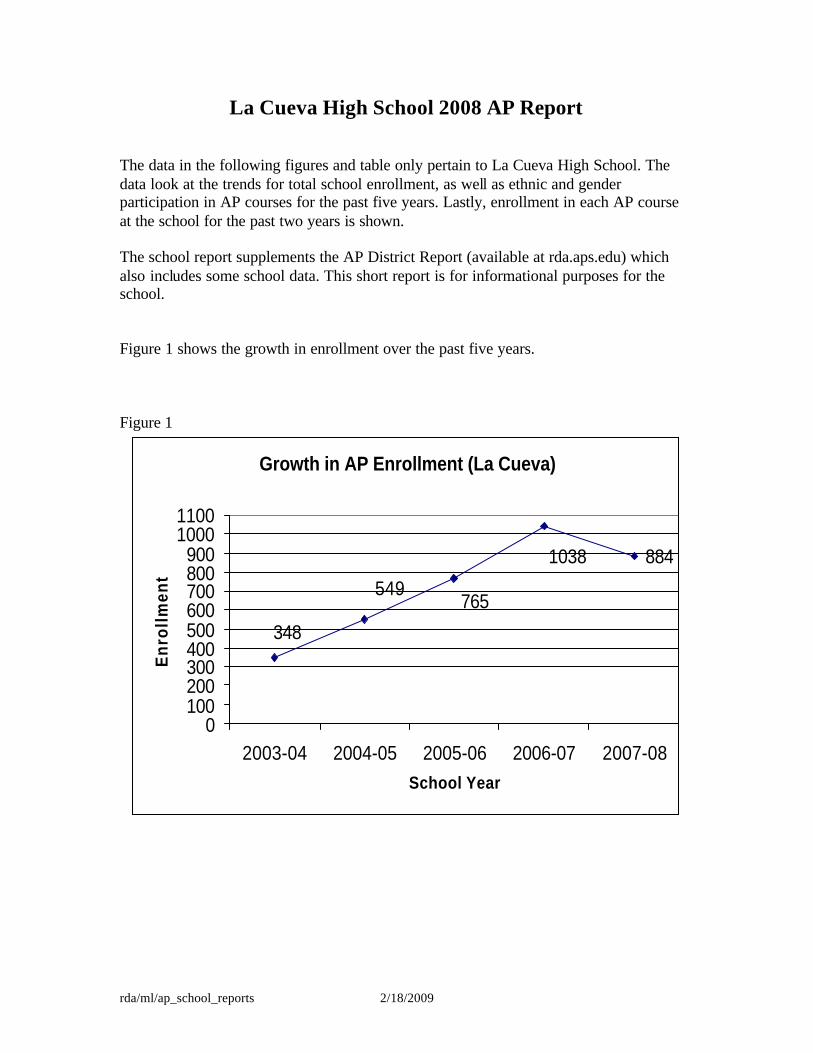
La Cueva High School 2008 AP Report The data in the following figures and table only pertain to La Cueva High School. The data look at the trends for total school enrollment, as well as ethnic and gender participation in AP courses for the past five years. Lastly, enrollment in each AP course at the school for the past two years is shown. The school report supplements the AP District Report (available at rda.aps.edu) which also includes some school data. This short report is for informational purposes for the school. Figure 1 shows the growth in enrollment over the past five years. Figure 1
Growth in AP Enrollment (La Cueva)
884
348
1038
549765
0100200300400500600700800900
10001100
2003-04 2004-05 2005-06 2006-07 2007-08School Year
Enr
ollm
ent
rda/ml/ap_school_reports 2/18/2009
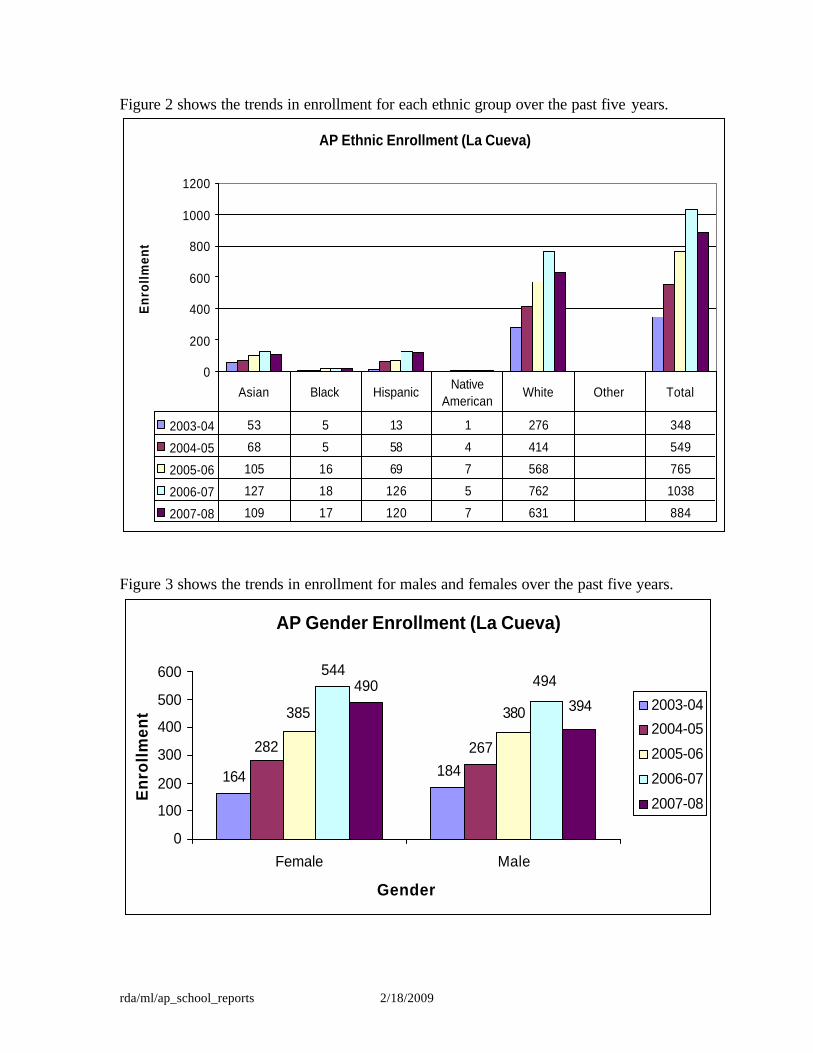
Figure 2 shows the trends in enrollment for each ethnic group over the past five years.
AP Ethnic Enrollment (La Cueva)
0
200
400
600
800
1000
1200
Enr
ollm
ent
2003-04 53 5 13 1 276 348
2004-05 68 5 58 4 414 549
2005-06 105 16 69 7 568 765
2006-07 127 18 126 5 762 1038
2007-08 109 17 120 7 631 884
Asian Black Hispanic Native American
White Other Total
Figure 3 shows the trends in enrollment for males and females over the past five years.
AP Gender Enrollment (La Cueva)
164 184267
544490
282
385 380
494
394
0
100
200
300
400
500
600
Female Male
Gender
En
roll
men
t 2003-04
2004-05
2005-06
2006-07
2007-08
rda/ml/ap_school_reports 2/18/2009
Table 1 shows the enrollment of each AP course offered at the school from 2006 through 2008. The last column represents the percent of the total AP enrollment for each course in 2008. Table 1
AP Course Enrollment (La Cueva) Table 1
Ernollment Percent AP Course 2006 2007 2008 2008
US History & Geog 124 116 89 10.1 World History & Geog 158 115 97 11.0 English Lang & Comp 189 155 17.5 English Lit & Comp 132 153 148 16.7 Statistics 24 66 53 6.0 Calculus I 51 67 51 5.8 Calculus II 26 25 20 2.3 Physics B 69 125 143 16.2 Biology 47 47 51 5.8 Chemistry 28 30 32 3.6 Physics C 29 27 12 1.4 Environmental Science 61 64 33 3.7 Spanish V Lang 16 14 Total 765 1038 884 100
rda/ml/ap_school_reports 2/18/2009
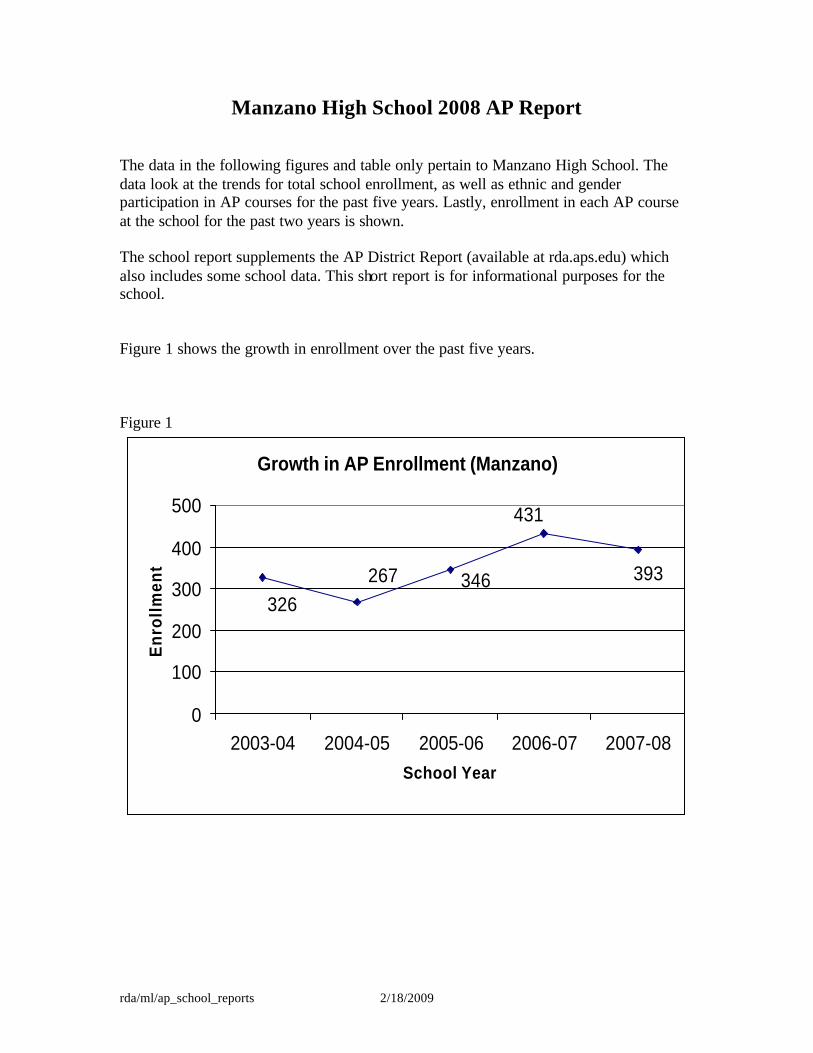
Manzano High School 2008 AP Report The data in the following figures and table only pertain to Manzano High School. The data look at the trends for total school enrollment, as well as ethnic and gender participation in AP courses for the past five years. Lastly, enrollment in each AP course at the school for the past two years is shown. The school report supplements the AP District Report (available at rda.aps.edu) which also includes some school data. This short report is for informational purposes for the school. Figure 1 shows the growth in enrollment over the past five years. Figure 1
Growth in AP Enrollment (Manzano)
393
326
431
267 346
0
100
200
300
400
500
2003-04 2004-05 2005-06 2006-07 2007-08School Year
Enr
ollm
ent
rda/ml/ap_school_reports 2/18/2009
Figure 2 shows the trends in enrollment for each ethnic group over the past five years.
AP Ethnic Enrollment (Manzano)
0
100
200
300
400
500
En
rollm
ent
2003-04 5 6 69 9 237 326
2004-05 13 3 68 0 182 1 267
2005-06 22 13 66 9 236 346
2006-07 30 8 68 6 319 431
2007-08 30 11 57 10 285 393
Asian Black HispanicNative
AmericanWhite Other Total
Figure 3 shows the trends in enrollment for males and females over the past five years.
AP Gender Enrollment (Manzano)
166 160126
197 190
141
188158
234203
0
50
100
150
200
250
Female Male
Gender
En
rollm
ent 2003-04
2004-05
2005-06
2006-07
2007-08
rda/ml/ap_school_reports 2/18/2009
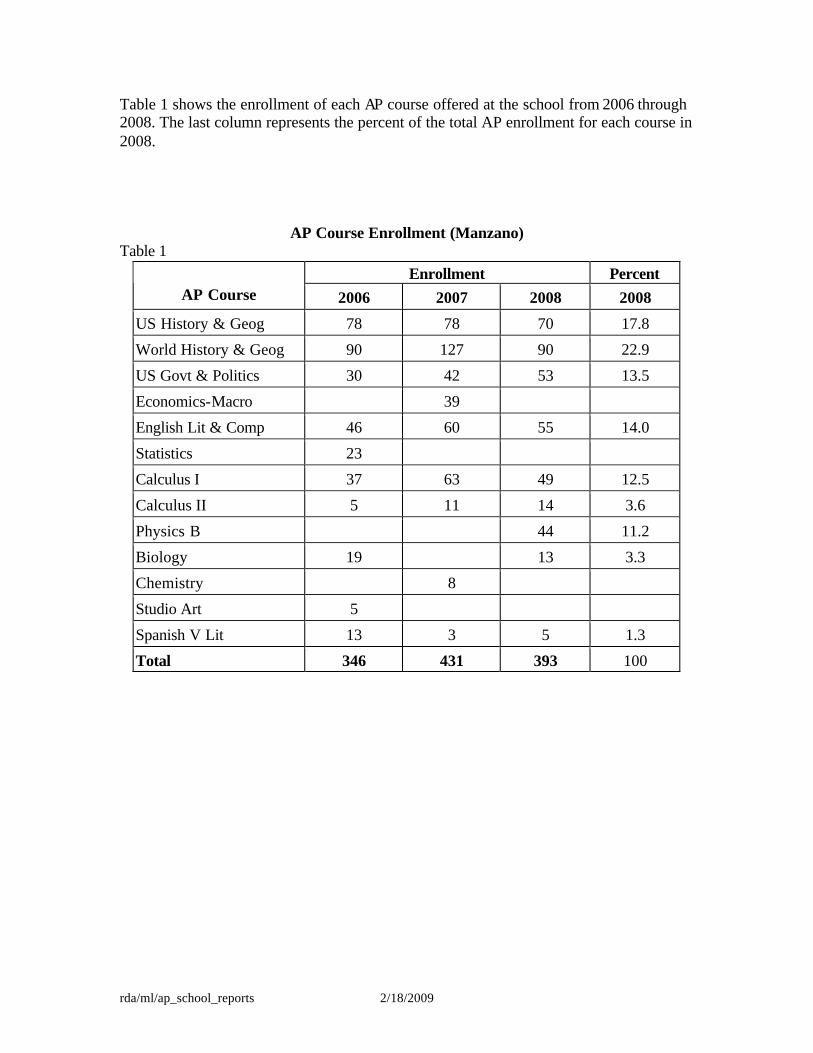
Table 1 shows the enrollment of each AP course offered at the school from 2006 through 2008. The last column represents the percent of the total AP enrollment for each course in 2008.
AP Course Enrollment (Manzano) Table 1
Enrollment Percent AP Course 2006 2007 2008 2008
US History & Geog 78 78 70 17.8
World History & Geog 90 127 90 22.9
US Govt & Politics 30 42 53 13.5
Economics-Macro 39
English Lit & Comp 46 60 55 14.0
Statistics 23
Calculus I 37 63 49 12.5
Calculus II 5 11 14 3.6
Physics B 44 11.2
Biology 19 13 3.3
Chemistry 8
Studio Art 5
Spanish V Lit 13 3 5 1.3
Total 346 431 393 100
rda/ml/ap_school_reports 2/18/2009
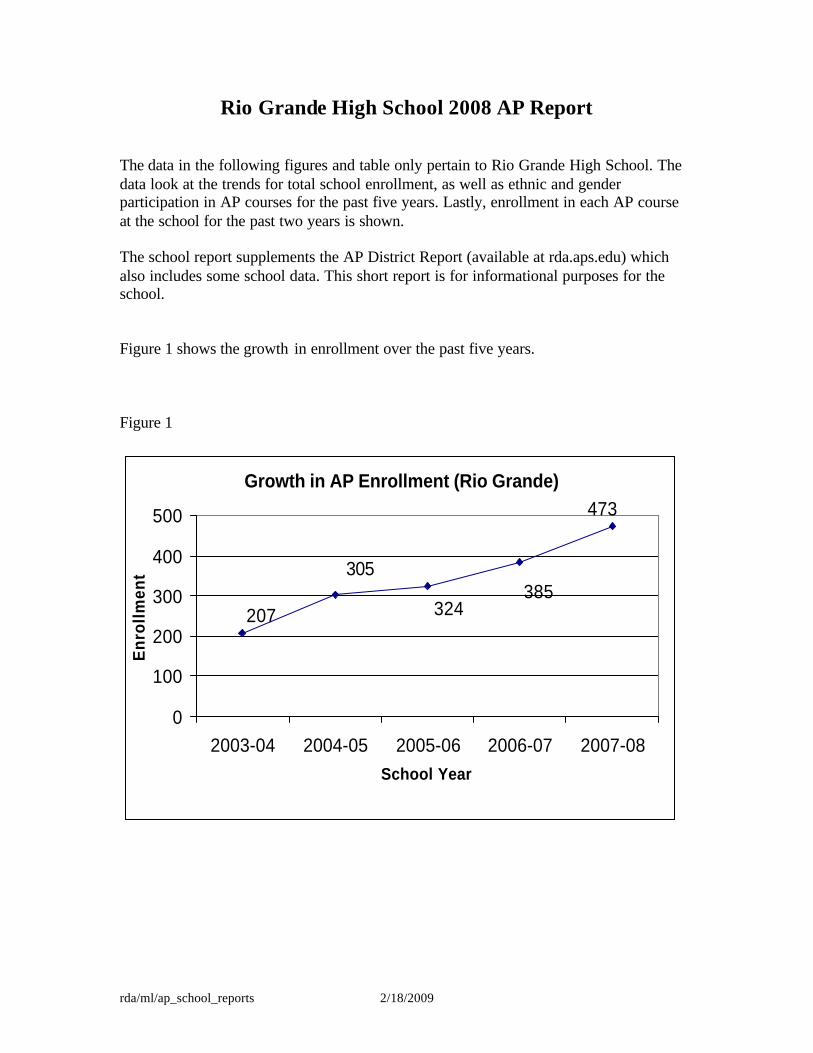
Rio Grande High School 2008 AP Report The data in the following figures and table only pertain to Rio Grande High School. The data look at the trends for total school enrollment, as well as ethnic and gender participation in AP courses for the past five years. Lastly, enrollment in each AP course at the school for the past two years is shown. The school report supplements the AP District Report (available at rda.aps.edu) which also includes some school data. This short report is for informational purposes for the school. Figure 1 shows the growth in enrollment over the past five years. Figure 1
Growth in AP Enrollment (Rio Grande)473
207385
305
324
0
100
200
300
400
500
2003-04 2004-05 2005-06 2006-07 2007-08School Year
Enr
ollm
ent
rda/ml/ap_school_reports 2/18/2009
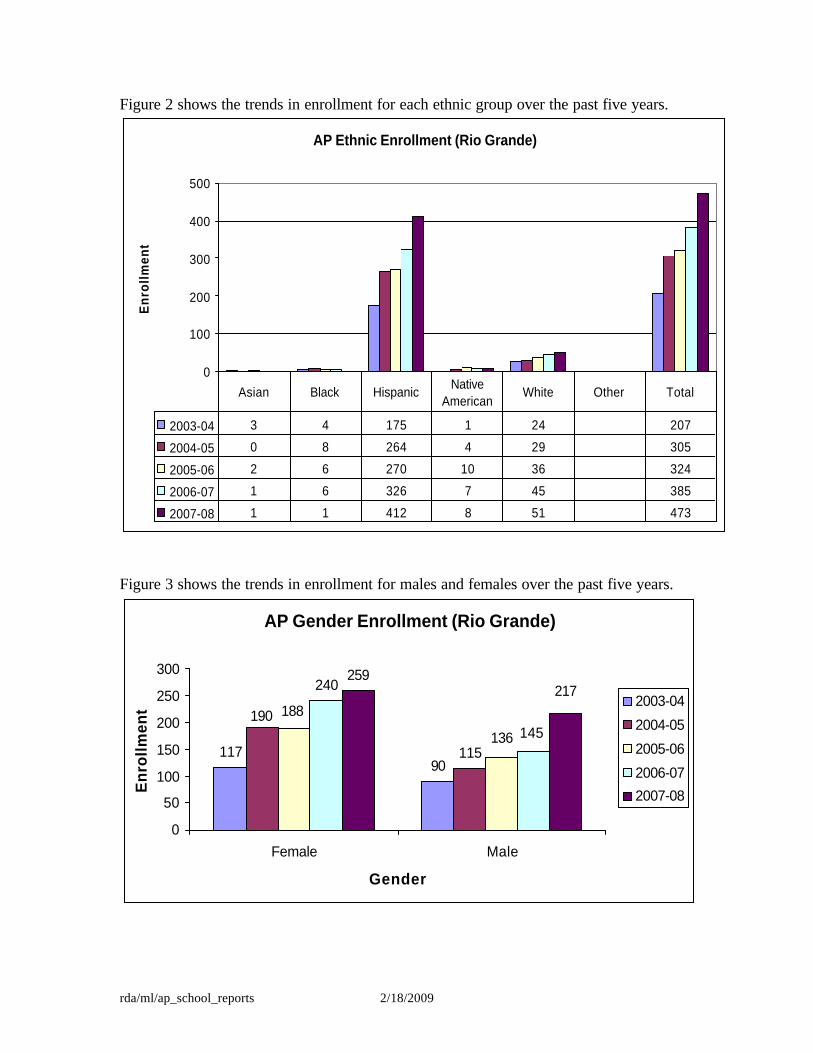
Figure 2 shows the trends in enrollment for each ethnic group over the past five years.
AP Ethnic Enrollment (Rio Grande)
0
100
200
300
400
500
Enr
ollm
ent
2003-04 3 4 175 1 24 207
2004-05 0 8 264 4 29 305
2005-06 2 6 270 10 36 324
2006-07 1 6 326 7 45 385
2007-08 1 1 412 8 51 473
Asian Black Hispanic Native American
White Other Total
Figure 3 shows the trends in enrollment for males and females over the past five years.
AP Gender Enrollment (Rio Grande)
11790
115
240259
190 188
136 145
217
0
50
100
150
200
250
300
Female Male
Gender
En
rollm
ent 2003-04
2004-05
2005-06
2006-07
2007-08
rda/ml/ap_school_reports 2/18/2009
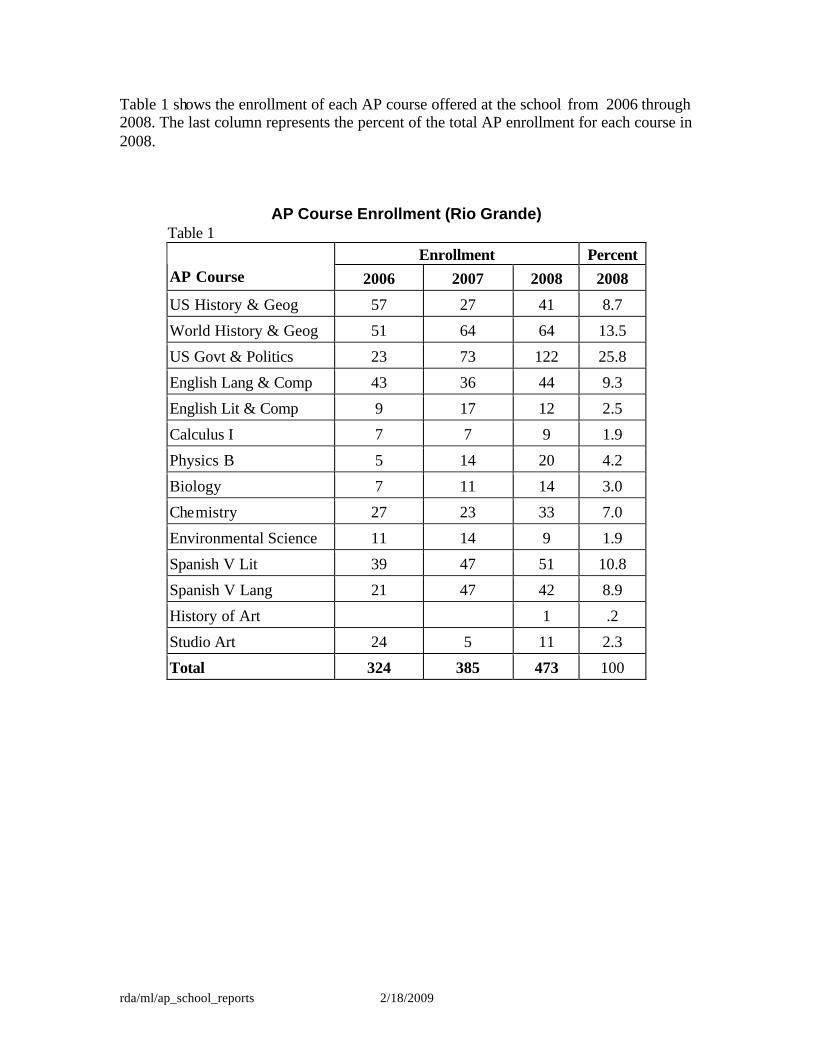
Table 1 shows the enrollment of each AP course offered at the school from 2006 through 2008. The last column represents the percent of the total AP enrollment for each course in 2008.
AP Course Enrollment (Rio Grande) Table 1
Enrollment Percent AP Course 2006 2007 2008 2008
US History & Geog 57 27 41 8.7
World History & Geog 51 64 64 13.5
US Govt & Politics 23 73 122 25.8
English Lang & Comp 43 36 44 9.3
English Lit & Comp 9 17 12 2.5
Calculus I 7 7 9 1.9
Physics B 5 14 20 4.2
Biology 7 11 14 3.0
Chemistry 27 23 33 7.0
Environmental Science 11 14 9 1.9
Spanish V Lit 39 47 51 10.8
Spanish V Lang 21 47 42 8.9
History of Art 1 .2
Studio Art 24 5 11 2.3
Total 324 385 473 100
rda/ml/ap_school_reports 2/18/2009
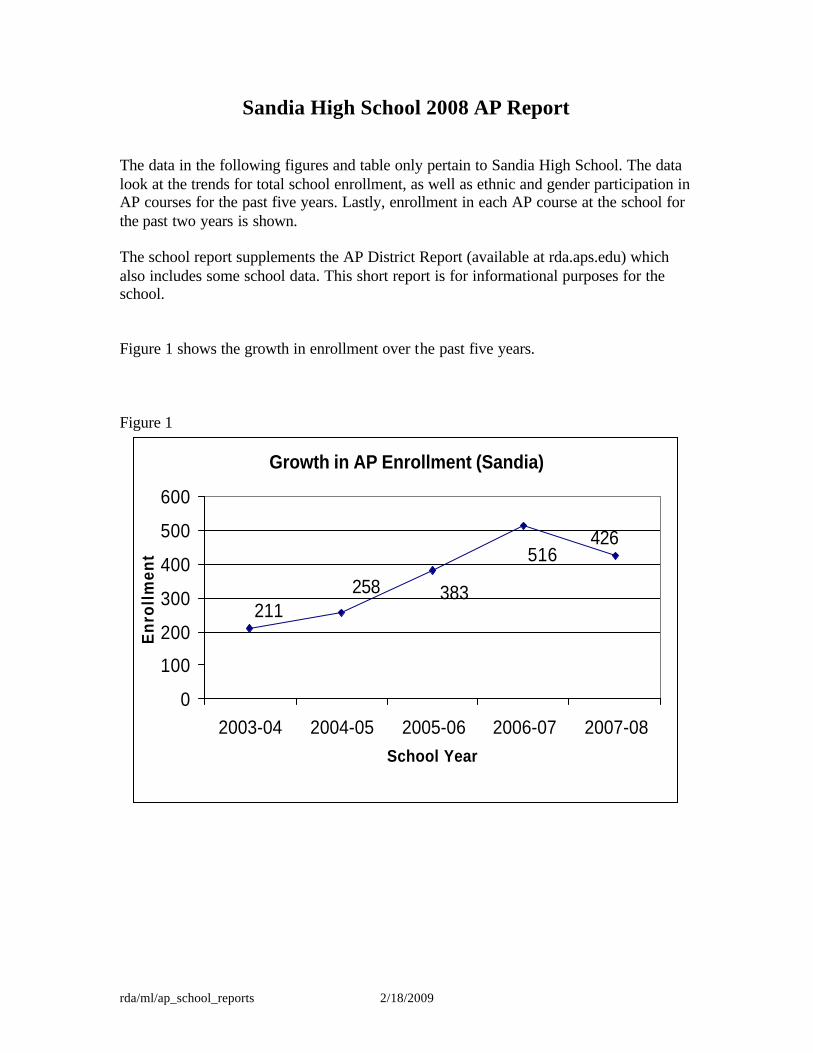
Sandia High School 2008 AP Report The data in the following figures and table only pertain to Sandia High School. The data look at the trends for total school enrollment, as well as ethnic and gender participation in AP courses for the past five years. Lastly, enrollment in each AP course at the school for the past two years is shown. The school report supplements the AP District Report (available at rda.aps.edu) which also includes some school data. This short report is for informational purposes for the school. Figure 1 shows the growth in enrollment over the past five years. Figure 1
Growth in AP Enrollment (Sandia)
426
211
516
258 383
0
100
200
300
400
500
600
2003-04 2004-05 2005-06 2006-07 2007-08School Year
En
roll
men
t
rda/ml/ap_school_reports 2/18/2009
Figure 2 shows the trends in enrollment for each ethnic group over the past five years.
AP Ethnic Enrollment (Sandia)
0
100
200
300
400
500
600
Enr
ollm
ent
2003-04 8 1 26 1 171 4 211
2004-05 26 4 31 7 186 4 258
2005-06 21 7 56 4 295 383
2006-07 12 19 108 10 367 516
2007-08 11 12 82 15 306 426
Asian Black HispanicNative
AmericanWhite Other Total
Figure 3 shows the trends in enrollment for males and females over the past five years.
AP Gender Enrollment (Sandia)
111 100 106
298255
152181
202 218171
0
50
100
150
200
250
300
350
Female Male
Gender
Enr
ollm
ent
2003-04
2004-05
2005-06
2006-07
2007-08
rda/ml/ap_school_reports 2/18/2009
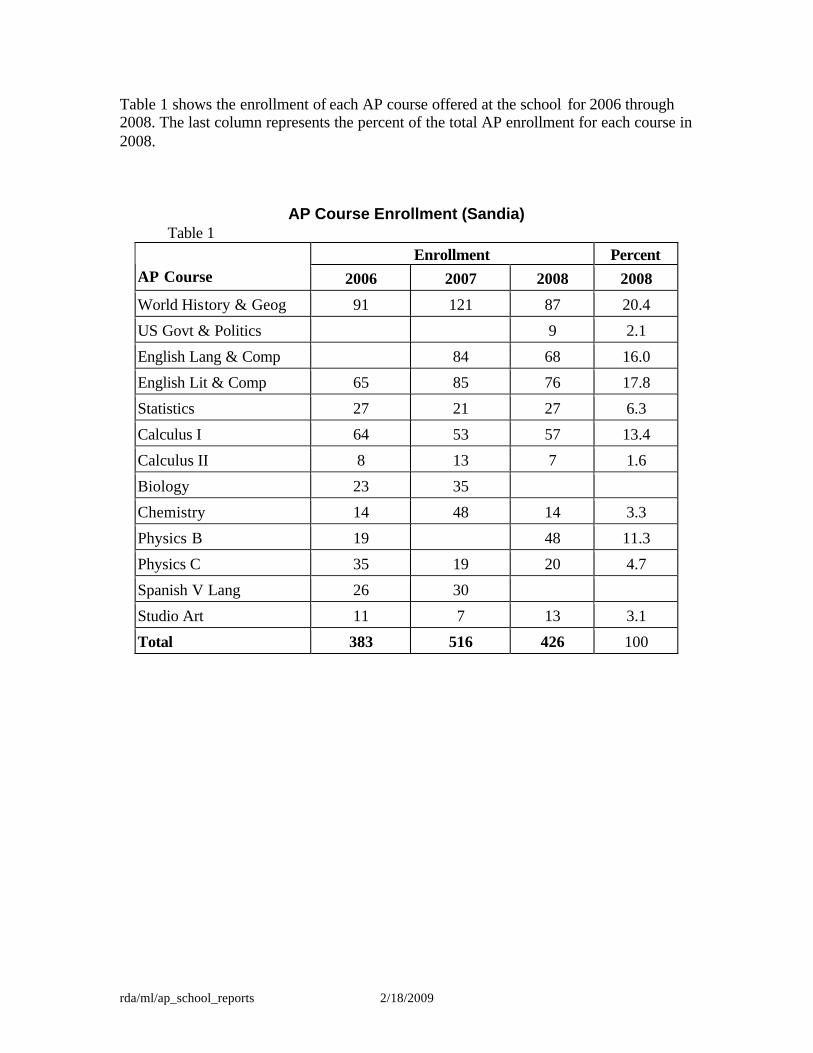
Table 1 shows the enrollment of each AP course offered at the school for 2006 through 2008. The last column represents the percent of the total AP enrollment for each course in 2008.
AP Course Enrollment (Sandia) Table 1
Enrollment Percent AP Course 2006 2007 2008 2008
World History & Geog 91 121 87 20.4
US Govt & Politics 9 2.1
English Lang & Comp 84 68 16.0
English Lit & Comp 65 85 76 17.8
Statistics 27 21 27 6.3
Calculus I 64 53 57 13.4
Calculus II 8 13 7 1.6
Biology 23 35
Chemistry 14 48 14 3.3
Physics B 19 48 11.3
Physics C 35 19 20 4.7
Spanish V Lang 26 30
Studio Art 11 7 13 3.1
Total 383 516 426 100
rda/ml/ap_school_reports 2/18/2009
Valley High School 2008 AP Report The data in the following figures and table only pertain to Valley High School. The data look at the trends for total school enrollment, as well as ethnic and gender participation in AP courses for the past five years. Lastly, enrollment in each AP course at the school for the past two years is shown. The school report supplements the AP District Report (available at rda.aps.edu) which also includes some school data. This short report is for informational purposes for the school. Figure 1 shows the growth in enrollment over the past five years. Figure 1
Growth in AP Enrollment (Valley)
255
143 216150203
0
100
200
300
2003-04 2004-05 2005-06 2006-07 2007-08School Year
En
roll
men
t
rda/ml/ap_school_reports 2/18/2009
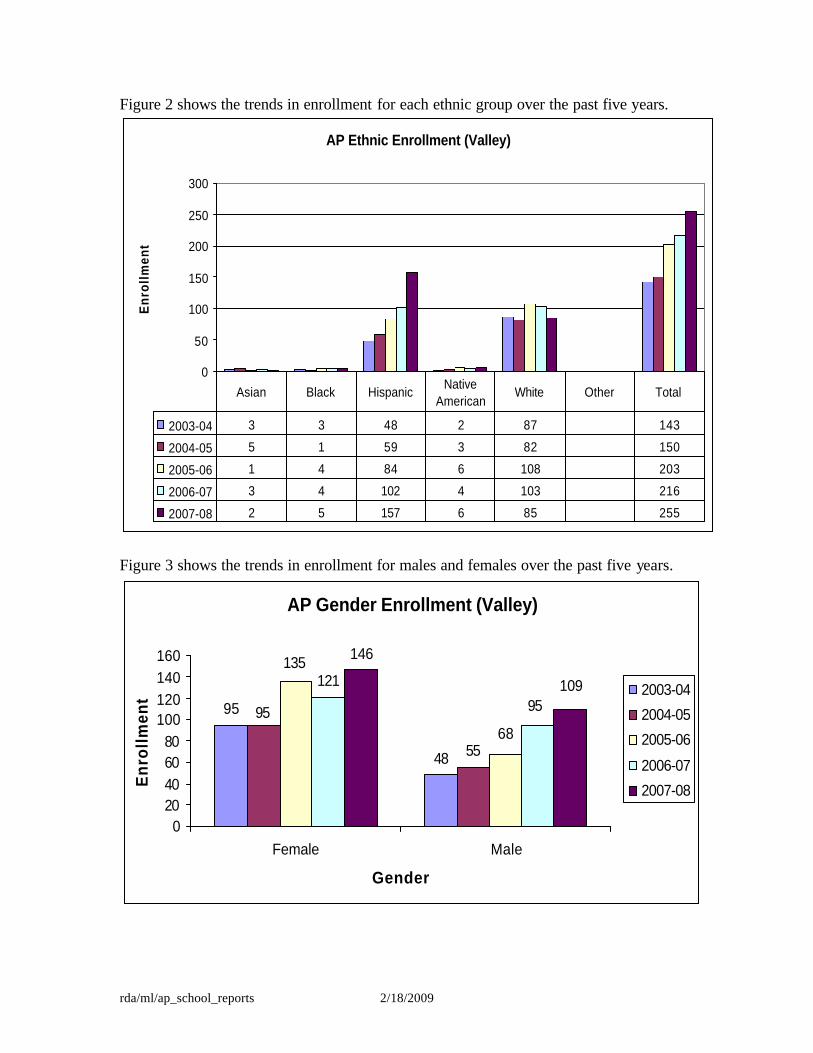
Figure 2 shows the trends in enrollment for each ethnic group over the past five years.
AP Ethnic Enrollment (Valley)
0
50
100
150
200
250
300
Enr
ollm
ent
2003-04 3 3 48 2 87 143
2004-05 5 1 59 3 82 150
2005-06 1 4 84 6 108 203
2006-07 3 4 102 4 103 216
2007-08 2 5 157 6 85 255
Asian Black Hispanic Native American
White Other Total
Figure 3 shows the trends in enrollment for males and females over the past five years.
AP Gender Enrollment (Valley)
95
48 55
121
146
95
135
68
95109
020406080
100120140160
Female Male
Gender
En
roll
men
t 2003-04
2004-05
2005-06
2006-07
2007-08
rda/ml/ap_school_reports 2/18/2009
Table 1 shows the enrollment of each AP course offered at the school from 2006 through 2008. The last column represents the percent of the total AP enrollment for each course in 2008.
AP Course Enrollment (Valley) Table 1
Enrollment Percent AP Course 2006 2007 2008 2008
US History & Geog 36 50 56 22.0
World History & Geog 56 97 38.0
English Lit & Comp 56 50 53 20.8
Statistics 22
Calculus I 23 28 18 7.1
Calculus II 2 6 13 5.1
Biology 30
Environmental Science 26
Psychology 34 18 7.1
Total 203 216 255 100
rda/ml/ap_school_reports 2/18/2009
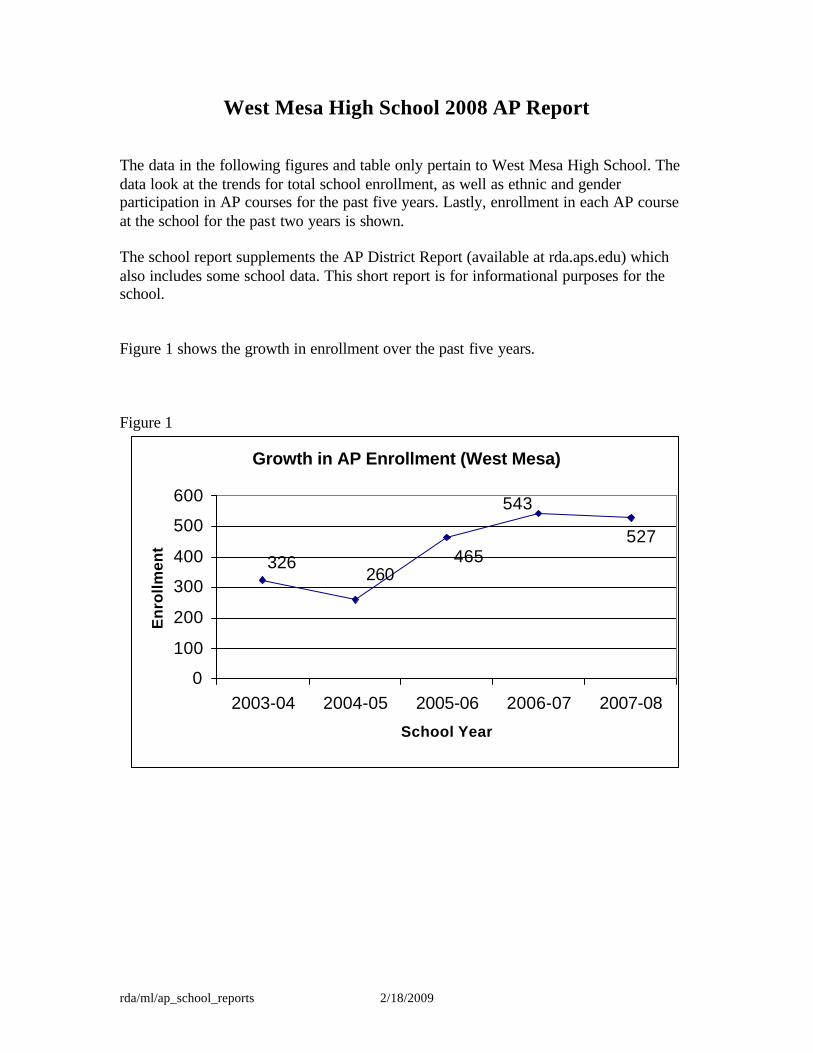
West Mesa High School 2008 AP Report The data in the following figures and table only pertain to West Mesa High School. The data look at the trends for total school enrollment, as well as ethnic and gender participation in AP courses for the past five years. Lastly, enrollment in each AP course at the school for the past two years is shown. The school report supplements the AP District Report (available at rda.aps.edu) which also includes some school data. This short report is for informational purposes for the school. Figure 1 shows the growth in enrollment over the past five years. Figure 1
Growth in AP Enrollment (West Mesa)
527326
543
260465
0
100
200
300
400
500
600
2003-04 2004-05 2005-06 2006-07 2007-08
School Year
En
rollm
ent
rda/ml/ap_school_reports 2/18/2009
Figure 2 shows the trends in enrollment for each ethnic group over the past five years.
AP Ethnic Enrollment (West Mesa)
0
100
200
300
400
500
600
Enr
ollm
ent
2003-04 18 9 227 9 63 326
2004-05 4 4 212 8 32 260
2005-06 12 15 335 30 73 465
2006-07 14 23 390 39 77 543
2007-08 11 20 405 32 59 527
Asian Black HispanicNative
AmericanWhite Other Total
Figure 3 shows the trends in enrollment for males and females over the past five years.
AP Gender Enrollment (West Mesa)
172 154130
306 312
130
250215
237 215
0
50
100
150
200
250
300
350
Female Male
Gender
En
rollm
ent 2003-04
2004-05
2005-06
2006-07
2007-08
rda/ml/ap_school_reports 2/18/2009
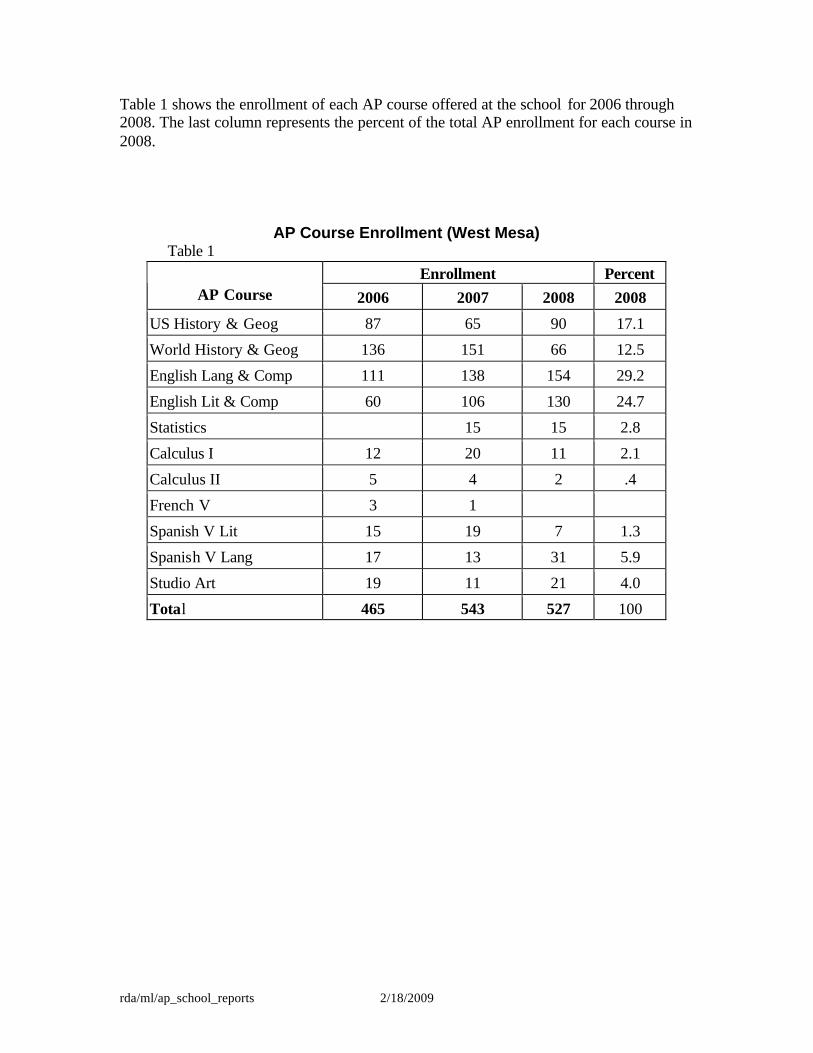
Table 1 shows the enrollment of each AP course offered at the school for 2006 through 2008. The last column represents the percent of the total AP enrollment for each course in 2008.