31
1 Alcohol Facts by National Draeger
1
Alcohol Facts
by
National Draeger
2
LIST OF CONTENTS Page Table of Contents………………………………………………………............................. 1-3 Density and Specific Gravity……………………………………………………………… 4 Units for Breath Alcohol Analysis………………………………………………………… 4 Metric System Prefixes……………………………………………………………………. 5 United States Customary Equivalents…………………………………………………….. 6 Henry’s Law…………………………………………………………………………......... 7 Definition…………………………………………………………………………. 7 Meaning…………………………………………………………………………... 7
Application to Breath Testing……………………………………………………. 7 Charles’ Law……………………………………………………………………………… 7 Definition…………………………………………………………………………. 7 Meaning…………………………………………………………………………… 7 Application to Breath Testing…………………………………………………….. 8 Example…………………………………………………………………………… 8 Alcohol Properties and Production……………………………………………………….. 9 Types of Alcohol…………………………………………………………………………. 9 Ethyl Alcohol…………………………………………………………………….. 9 Methyl Alcohol…………………………………………………………………... 9
Other Alcohols……………………………………………………………………. 9 Production of Alcohol…………………………………………………………………….. 10 Sources……………………………………………………………………………. 10 Fermentation……………………………………………………………………… 10
Distillation………………………………………………………………………… 10 Types of Beverages……………………………………………………………….. 10 Congeners…………………………………………………………………………. 10 Proof System………………………………………………………………………. 10
Physiology of Alcohol – Endogenous Alcohol……………………………………………. 12 Physiology Overview……………………………………………………………………… 12 Absorption…………………………………………………………………………. 12
Distribution………………………………………………………………………… 12 Elimination…………………………………………………………………………. 12
3
LIST OF CONTENTS – CONT’D Page Absorption Routes…………………………………………………………………………….. 14
Inhalation…………………………………………………………………………. 14 Injection…………………………………………………………………………... 14
Insertion…………………………………………………………………………... 14 Skin Contact………………………………………………………………………. 14 Absorption from Gastrointestinal Tract…………………………………………………… 14 Mouth……………………………………………………………………………... 14 Stomach……………………………………………………………………………. 14 Small Intestine……………………………………………………………………... 14 Absorption Rate……………………………………………………………………………. 14-15 Factors That Affect Rate of Absorption……………………………………………………. 15 Dilution…………………………………………………………………………….. 15 Food in Stomach…………………………………………………………………… 15 Distribution………………………………………………………………………………… 15
Route……………………………………………………………………………….. 15 Equilibrium………………………………………………………………………… 15 Distribution Ratios…………………………………………………………………. 15 Widmark’s R……………………………………………………………………….. 16
Formula…………………………………………………………………….. 16 Example & Solution……………………………………………………….. 16 Caution…………………………………………………………………….. 17 Elimination Method………………………………………………………………………… 17 Metabolism………………………………………………………………………… 17 Excretion…………………………………………………………………………… 17 Rate of Elimination………………………………………………………………… 17 Factors Affecting Rate of Elimination…………………………………………….. 17 Factors Affecting Height and Shape of the BAC Curve…………………………………… 17 Body Weight vs. Drinks Consumed……………………………………………….. 17-18 Empty Stomach vs. Full Stomach…………………………………………………. 19 Rate of Drinking and Quantity Consumed………………………………………… 19
4
LIST OF CONTENTS – CONT’D Page Pharmacology of Alcohol. ……………………………………………………………….. 23 Effects of the Central Nervous System…………………………………………… 23 Stages of Intoxication…………………………………………………….. ……… 23 Effects on Vision………………………………………………………………….. 23 Effects on Reaction Time and Coordination……………………………................ 23 Effects on Other Body Organs, Systems, and Tissues…………………………….. 23 Effects on Skin………………………………………………………………… 23 Effects on Circulation…………………………………………………………. 23 Effects on Kidney…………………………………………………………. …. 25 Effects on Liver……………………………………………………………….. 25 Symptoms of Alcoholic Influence………………………………………………………… 25 Alcohol Combined with Other Drugs……………………………………………………… 25 Stimulants…………………………………………………………………………. 25 Depressants………………………………………………………………………... 26 Narcotics…………………………………………………………………………... 26 Tolerance to Alcohol……………………………………………………………… 26 Theory of the Simulator……………………………………………………………………. 27-28 Preparation of Simulator Solutions………………………………………………………… 29 Exhibit B-4 ………………………………………………………………………………… 5 Exhibit B-5…………………………………………………………………………………. 6 Exhibit C-1…………………………………………………………………………………. 11 Exhibit C-2 ………………………………………………………………………………… 13 Exhibit C-3…………………………………………………………………………………. 15 Exhibit C-4…………………………………………………………………………………. 20 Exhibit C-5…………………………………………………………………………………. 21 Exhibit C-6…………………………………………………………………………………. 22
5
Exhibit C-7…………………………………………………………………………………. 24 EXHIBIT B-8 – DENSITY AND SPECIFIC GRAVITY DENSITY The mass of a unit volume of a material is called its density. Density may be expressed in terms of any consistent units of mass and volume as, for example, pounds per gallon, pounds per cubic foot, grams per cubic centimeter, or grams per milliliter. The most generally used unit is grams per milliliter. In general, an increase in temperature or a decrease in pressure results in a decrease in density. These effects are large for gases so that both the temperature and the pressure must be taken into account. The effect of moderate changes in pressure on the density of liquids or solids may be ignored, but the effect of temperature must always be taken into account,. SPECIFIC GRAVITY Specific gravity is the ratio between the density of a body and the density of some substance assumed as a standard. For liquids and solids the standard is distilled water at 4°C, the temperature at which water reaches its maximum density. Blood, which is heavier than water, has –for normal blood—a specific gravity of 1.055 at 20°C. Alcohol, which is lighter than water, has a specific gravity of 0.79 at 20 °C. (In nonscientific work, 0.8 is often used.) Since density can change with changes in temperature and pressure, as noted above, it is necessary to state these for complete accuracy. The standard pressure used is 760 mm. of mercury (29.92 inches barometric pressure), the average atmospheric pressure at sea level. In most cases the pressure makes so little difference that it is disregarded. Temperature is constant at 4°C, and the ratio is stated differently as the temperature of the substance being compared is charged. EXIBIT B-9 - UNITS FOR BREATH ALCOHOL ANLAYSIS Currently the results of a breath test for alcoholic influence are expressed in terms of blood alcohol concentration. It is sometimes important to differentiate between alcohol concentration data obtained directly from the analysis of blood samples and data obtained from the analysis of breath samples. Therefore, one may find in recent literature that the term “Blood Alcohol Concentration (B&C)” is being reserved for data obtained from the analysis of blood samples, and the results of breath alcohol analysis are expressed in terms of “Blood Alcohol Equivalents (BAQ).” Numerically the two terms are identical. Thus, when a person with a blood alcohol concentration of 0.10% is given a breath test, a reading of 0.10 BAQ should be obtained.

6
7
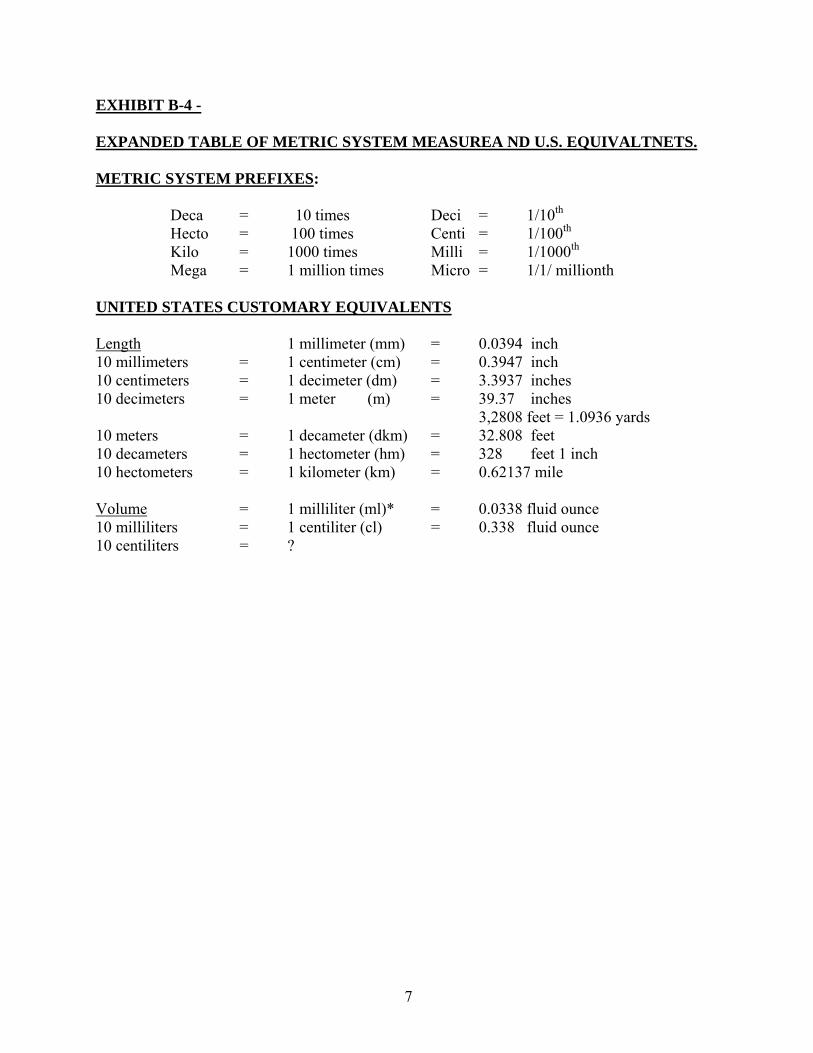
EXHIBIT B-4 - EXPANDED TABLE OF METRIC SYSTEM MEASUREA ND U.S. EQUIVALTNETS. METRIC SYSTEM PREFIXES: Deca = 10 times Deci = 1/10th Hecto = 100 times Centi = 1/100th Kilo = 1000 times Milli = 1/1000th Mega = 1 million times Micro = 1/1/ millionth UNITED STATES CUSTOMARY EQUIVALENTS Length 1 millimeter (mm) = 0.0394 inch 10 millimeters = 1 centimeter (cm) = 0.3947 inch 10 centimeters = 1 decimeter (dm) = 3.3937 inches 10 decimeters = 1 meter (m) = 39.37 inches 3,2808 feet = 1.0936 yards 10 meters = 1 decameter (dkm) = 32.808 feet 10 decameters = 1 hectometer (hm) = 328 feet 1 inch 10 hectometers = 1 kilometer (km) = 0.62137 mile Volume = 1 milliliter (ml)* = 0.0338 fluid ounce 10 milliliters = 1 centiliter (cl) = 0.338 fluid ounce 10 centiliters = ?
8
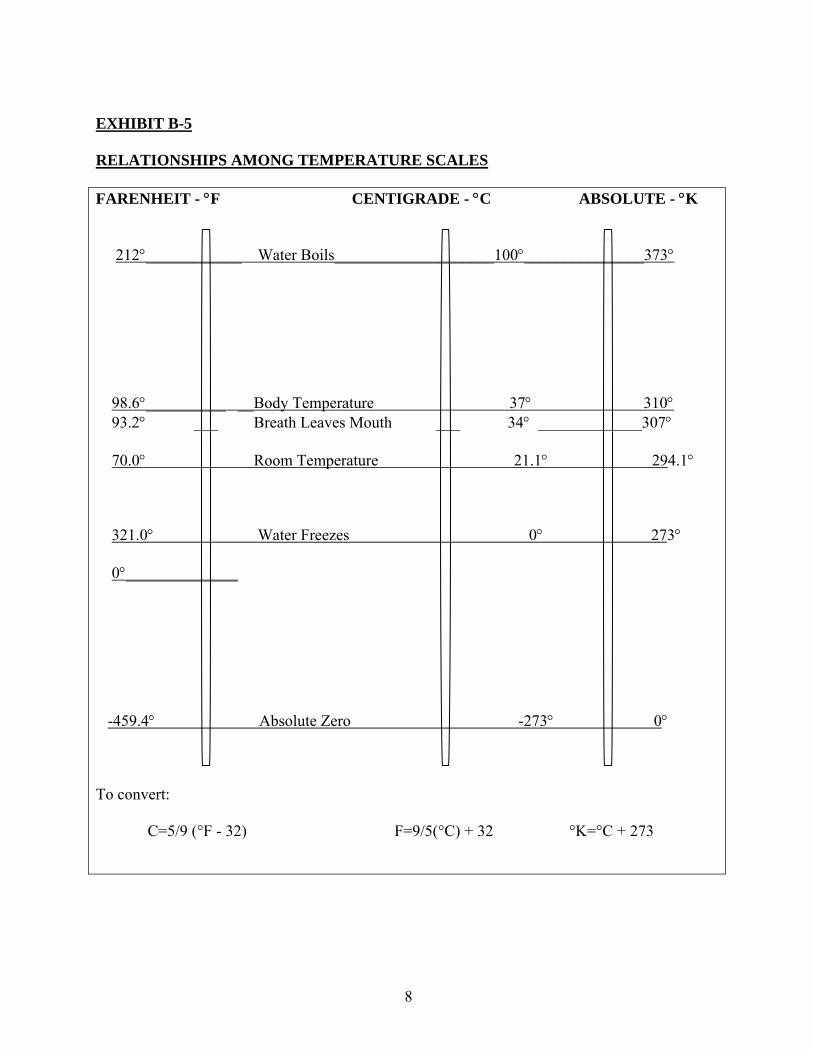
EXHIBIT B-5 RELATIONSHIPS AMONG TEMPERATURE SCALES FARENHEIT - °F CENTIGRADE - °C ABSOLUTE - °K 212°____________ Water Boils____________________100°_______________373° 98.6°__________ __Body Temperature 37° 310° 93.2° ___ Breath Leaves Mouth ___ 34° _____________307° 70.0° Room Temperature 21.1° 294.1° 321.0° Water Freezes 0° 273° 0°______________ -459.4° Absolute Zero -273° 0° To convert: C=5/9 (°F - 32) F=9/5(°C) + 32 °K=°C + 273

9
EXHIBIT B-6 HENRY’S LAW DEFINITION The weight of any gas that dissolves in a definite volume of liquid is directly proportional to the vapor pressure that the gas exerts above the liquid. This proportion, is different for different temperatures. MEANING If one shakes a closed bottle containing an alcohol solution and air, the amount of alcohol in the air will build up to a certain point and stop. This point is what chemists call equilibrium. At equilibrium for any given temperature and pressure, there will be a definite ratio between the amount of alcohol in the air and in the water. This ratio will be the same for any given temperature and atmosphere pressure; the higher the temperature, the more alcohol will be in the air. This ratio can be expressed as follows. Wgt of alcohol per vol of air = K (a constant) Wgt of alcohol per vol of water Thus, if one knows the value of the constant (K) and one of the other values, the third value can easily be calculated. APPLICATION TO BREATH TESTING Alcohol in alveolar air comes into equilibrium with alcohol in the blood. Thus, if the constant is known and the amount of alcohol in the breath can be measured, the amount of alcohol in the blood can be determined. The temperature at which the breath leaves the mouth is 34° centigrade. Therefore, the ratio between the concentration of alcohol in blood and alveolar air with which it is in equilibrium must be determined at 34° centigrade. This ratio was found to be approximately 2100:1. Thus, 1 milliliter of blood will contain the same weight of alcohol as 2100 milliliters of the alveolar air with which it has come to equilibrium. EXHIBIT B-7 – CHARLES’ LAW DEFINITION The volume of a certain amount of dry gas varies directly with the Kelvin temperature, provided pressure remains constant. MEANING All gasses expand or contract at the same rate with changes in temperature, provided the pressure is unchanged; the higher the temperature, the larger the volume of gas. The change in volume amounts to 1/273rd of the original volume at 0°C is the equivalent of 273°K.
10
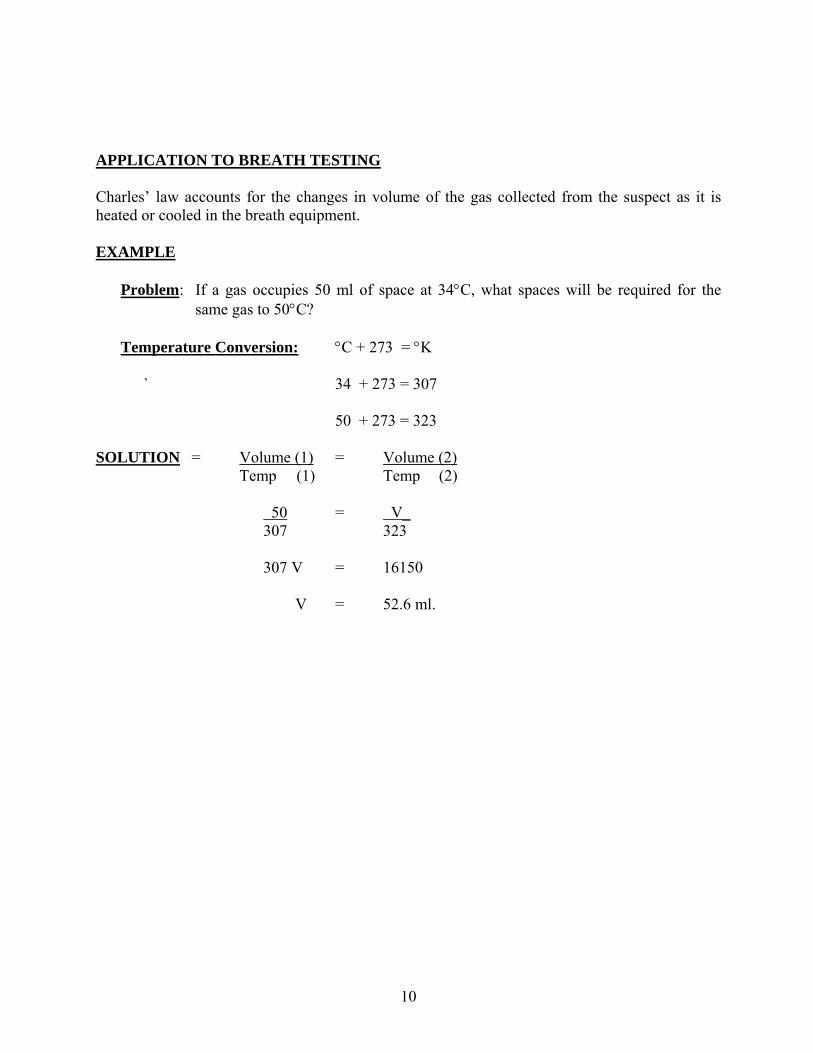
APPLICATION TO BREATH TESTING Charles’ law accounts for the changes in volume of the gas collected from the suspect as it is heated or cooled in the breath equipment. EXAMPLE
Problem: If a gas occupies 50 ml of space at 34°C, what spaces will be required for the same gas to 50°C?
Temperature Conversion: °C + 273 = °K ` 34 + 273 = 307
50 + 273 = 323 SOLUTION = Volume (1) = Volume (2) Temp (1) Temp (2) 50 = V_ 307 323 307 V = 16150 V = 52.6 ml.
11
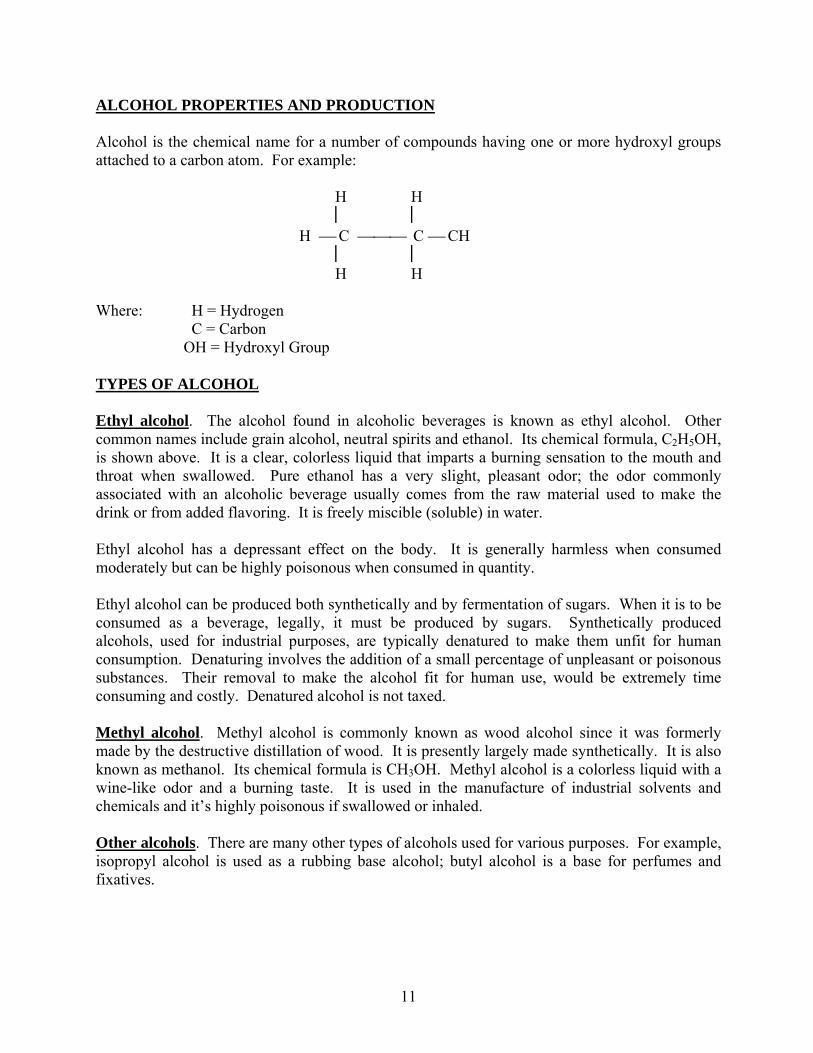
ALCOHOL PROPERTIES AND PRODUCTION Alcohol is the chemical name for a number of compounds having one or more hydroxyl groups attached to a carbon atom. For example: H H ⎮ ⎮ H ⎯ C ⎯⎯⎯ C ⎯ CH ⎮ ⎮ H H Where: H = Hydrogen C = Carbon OH = Hydroxyl Group TYPES OF ALCOHOL Ethyl alcohol. The alcohol found in alcoholic beverages is known as ethyl alcohol. Other common names include grain alcohol, neutral spirits and ethanol. Its chemical formula, C2H5OH, is shown above. It is a clear, colorless liquid that imparts a burning sensation to the mouth and throat when swallowed. Pure ethanol has a very slight, pleasant odor; the odor commonly associated with an alcoholic beverage usually comes from the raw material used to make the drink or from added flavoring. It is freely miscible (soluble) in water. Ethyl alcohol has a depressant effect on the body. It is generally harmless when consumed moderately but can be highly poisonous when consumed in quantity. Ethyl alcohol can be produced both synthetically and by fermentation of sugars. When it is to be consumed as a beverage, legally, it must be produced by sugars. Synthetically produced alcohols, used for industrial purposes, are typically denatured to make them unfit for human consumption. Denaturing involves the addition of a small percentage of unpleasant or poisonous substances. Their removal to make the alcohol fit for human use, would be extremely time consuming and costly. Denatured alcohol is not taxed. Methyl alcohol. Methyl alcohol is commonly known as wood alcohol since it was formerly made by the destructive distillation of wood. It is presently largely made synthetically. It is also known as methanol. Its chemical formula is CH3OH. Methyl alcohol is a colorless liquid with a wine-like odor and a burning taste. It is used in the manufacture of industrial solvents and chemicals and it’s highly poisonous if swallowed or inhaled. Other alcohols. There are many other types of alcohols used for various purposes. For example, isopropyl alcohol is used as a rubbing base alcohol; butyl alcohol is a base for perfumes and fixatives.
12
PRODUCTION OF ALCOHOL Sources. Any material can serve as the basic material for alcohol as long as it contains 12-15% sugar. Such materials might be fruit juices, malt or cereal grain extract, vegetable pulp (potato, cactus), and molasses. Fermentation. Fermentation is the process by which all drinking alcohols are produced. Yeast from the air, or added as a pure culture, produces alcohol and carbon dioxide by fermenting the sugars in fruit juice, cereal grain mash, or other raw material. Maximum alcohol content of a fermented beverage is 14-15% by volume; higher alcohol contents are produced by a further process of distillation. Distillation. Whisky, gin, rum, brandy, etc., attain high alcohol contents through the process of distillation. Alcohol boils at 78.3°C (173°F) and water at 100°C (212°F). When a mixture of alcohol and water is heated, the alcohol boils at a lower temperature. The resultant steam is caught and cooled. By repeating the process, nearly pure ethanol can be obtained. Types of beverages. The sources, method of production and approximate alcoholic content of various beverages are shown in Exhibit C-1. Congeners, In addition to alcohol and water, alcoholic beverages contain numerous compounds or impurities known as congeners. These typically impart a characteristic flavor and odor to the beverage. They constitute a very small proportion of the total volume of the beverage. There is no evidence that congeners contribute in any discernible degree to the depressant effect of alcoholic beverages. Proof system. In the United States, the proof of an alcoholic beverage is twice the percentage of alcohol by volume. Thus, an 86-proof bottle of whiskey contains 43% of alcohol by volume. Most alcoholic beverages have a maximum of approximately 50% alcohol by volume; the remainder consists of water and flavoring agents (cogeners). For example, beer has a relatively low alcoholic content and is approximately 90% water.

13
EXHIBIT C-1 Beverage
Source, method of production and approximate alcoholic content of beverages* Most Common Method of Raw Material Production
Approximate Alcohol Content – Percent (v/v)
Red Wine White Wine Sweet Wine Dry Wine Champagne Cider Beer Ale Porter Whiskey Gin Rum Brandy Vodka Fortified Wine Port & Sherry Cordials & Liqueurs Cocktails
Red skinned grapes White skinned Grapes Grapes Grapes Grapes Apples Cereals – as rye Cereals Cereals Cereals (rye, corn. Barley, etc.) Cereals, etc. Molasses Fruit Juices Rye, other grain, potatoes, vegetables Grapes, etc. Grapes, etc. (See next column) Dependent on component beverages
Fermentation Fermentation Fermentation – process stopped at about 10% alcohol, leaving some sugar in basic juice Fermentation continues until process ceases naturally Grape juice in process of fermentation bottled at 10-14% alcohol, fermentation continues producing carbon dioxide, hence bubbles or sparkling wine Fermentation Brewing-fermentation stopped at desired alcohol content (Same as Beer) (Same as Beer) Distillation Ethanol + water + flavoring Distillation Distillation Distillation Fermentation-addition of brandy during fermentation (Same as Fortified Wine) Mixture of ethanol or brandy with flavoring and sugar Mixture of 2 or more alcohol beverages, also sometimes fruit or vegetable juices
Up to about 14 Up to about 14 10 ----- About 14 8-10 3.5-6 6-8 6-8 15-50 50 50 50 50 14-30 23 10-40 Average has about1/2 fluid ounce alcohol
*From: Shipley, C.V. Chemical tests manual for Kentucky, Traffic Safety Institute, Eastern Kentucky University, 1970, page 2.
14
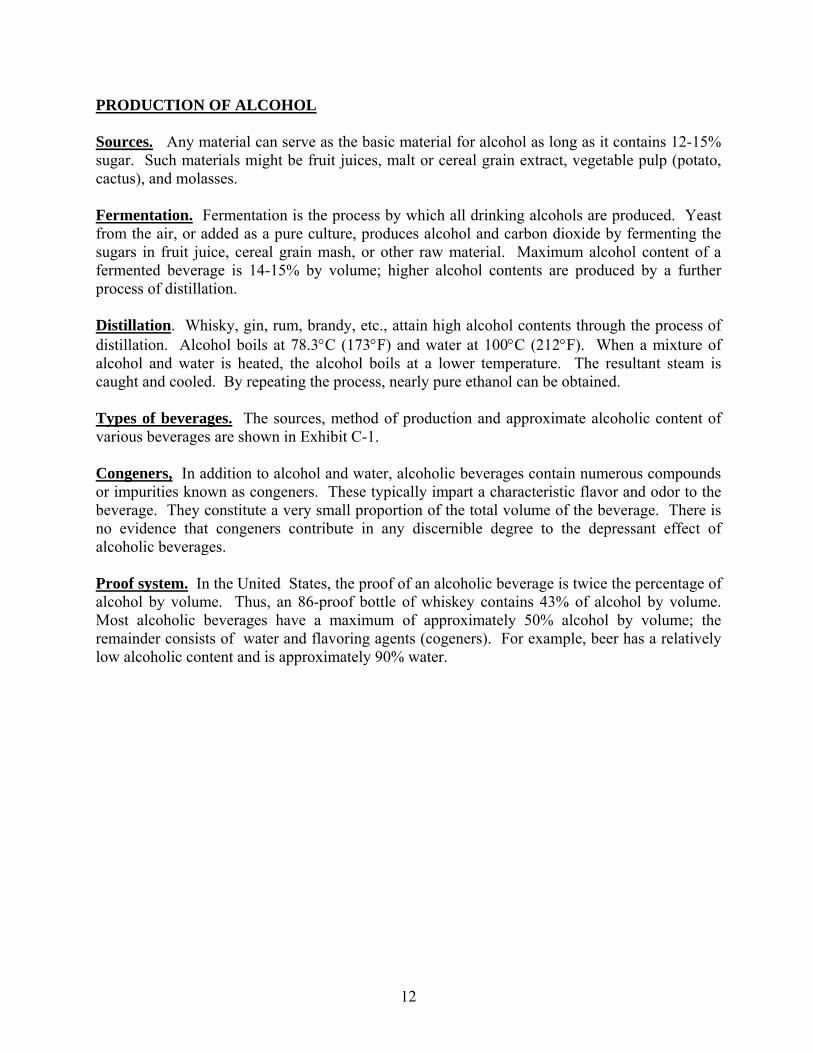
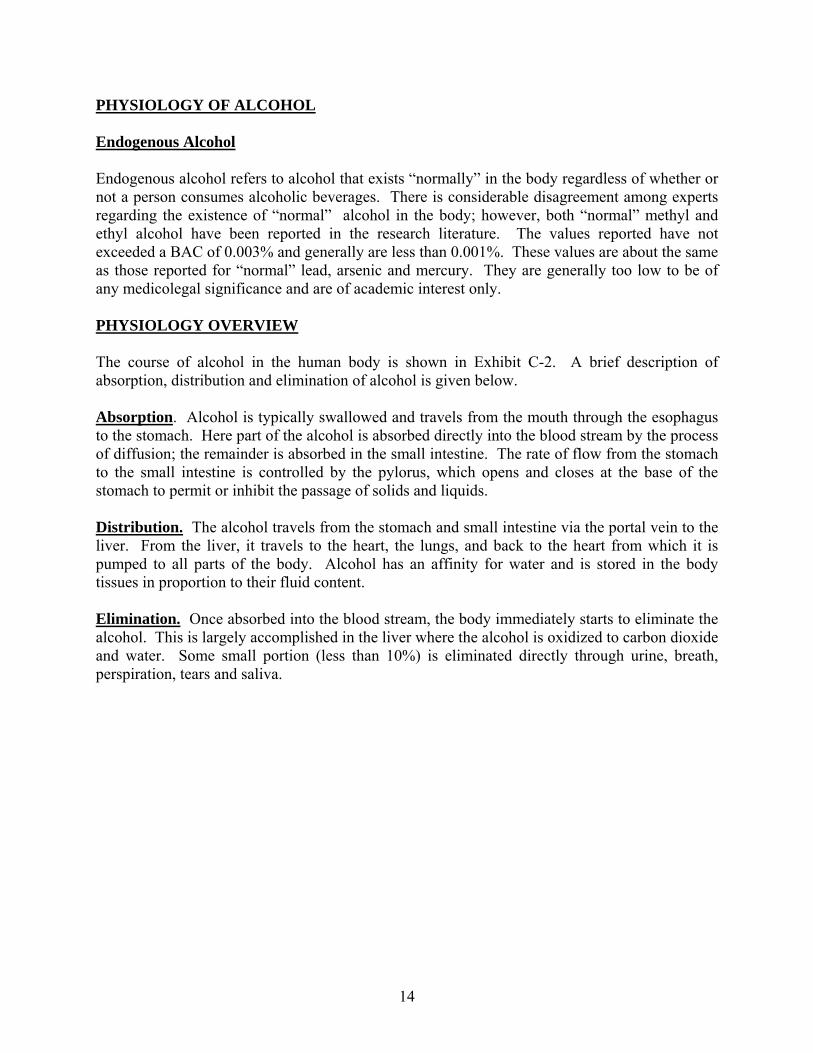
PHYSIOLOGY OF ALCOHOL Endogenous Alcohol Endogenous alcohol refers to alcohol that exists “normally” in the body regardless of whether or not a person consumes alcoholic beverages. There is considerable disagreement among experts regarding the existence of “normal” alcohol in the body; however, both “normal” methyl and ethyl alcohol have been reported in the research literature. The values reported have not exceeded a BAC of 0.003% and generally are less than 0.001%. These values are about the same as those reported for “normal” lead, arsenic and mercury. They are generally too low to be of any medicolegal significance and are of academic interest only. PHYSIOLOGY OVERVIEW The course of alcohol in the human body is shown in Exhibit C-2. A brief description of absorption, distribution and elimination of alcohol is given below. Absorption. Alcohol is typically swallowed and travels from the mouth through the esophagus to the stomach. Here part of the alcohol is absorbed directly into the blood stream by the process of diffusion; the remainder is absorbed in the small intestine. The rate of flow from the stomach to the small intestine is controlled by the pylorus, which opens and closes at the base of the stomach to permit or inhibit the passage of solids and liquids. Distribution. The alcohol travels from the stomach and small intestine via the portal vein to the liver. From the liver, it travels to the heart, the lungs, and back to the heart from which it is pumped to all parts of the body. Alcohol has an affinity for water and is stored in the body tissues in proportion to their fluid content. Elimination. Once absorbed into the blood stream, the body immediately starts to eliminate the alcohol. This is largely accomplished in the liver where the alcohol is oxidized to carbon dioxide and water. Some small portion (less than 10%) is eliminated directly through urine, breath, perspiration, tears and saliva.
15
EXHIBIT C-2 - ALCOHOL IN THE HUMAN BODY. According to concentration in the brain, alcohol first impairs judgment, then causes muscular incoordination, stupor and finally unconsciousness. Course of Alcohol. Mouth Esophagus Stomach Small Intestines Portal Vein Blood To all parts of the body where it is stored in the water until returned by the blood to the liver to be oxidized.
Primary Lobule of the Lung diameter of circle=1/50th inch. Blood vessels in the lungs end in networks of capillaries in the walls of the alveoli. Alcohol from the blood is imparted to the alveolar breath. Alveolar breath contains 1/2100th f Direction of Flow as much alcohol as the blood. • Alcohol ☼ Alcohol being Oxidized
16
ABSORPTION. Routes. Alcohols are typically swallowed and the most common route of absorption is through the gastrointestinal tract. However, it may also be absorbed by inhalation, injection and direct insertion into the bladder or rectum. Whether or not absorption takes place by direct skin contact with alcohol is unknown.
Inhalation. Ethyl alcohol is readily absorbed by lung tissue, and both children and animals have become severely i8ntoxicated by breathing alcohol fumes in confined spaces. Approximately 62% of the inhaled alcohol will be absorbed into the blood regardless of the concentration in the air or the rate of ventilation. However, a concentration of alcohol high enough to produce a significant rise in blood levels is very irritating. Investigators have shown that inhalation of a 0.l9% alcohol-air mixture (about the highest tolerable limit) will produce a BAC of 0.045% only with forced respirations of 3 to 4 hours duration. Such conditions would not be obtained by industrial exposure to alcohol solvents.
Injection. Alcohol is detectable in the blood within 5 to 15 minutes after injection into a muscle or skin.
Insertion. When given as an enema, alcohol is readily absorbed by the large intestines (colon). Less than 10% of alcohol inserted in the bladder will be absorbed; alcohol passes more readily from the blood to the urine than from the urine to the blood.
Skin Contact. In experimental situations, no detectable blood levels have been obtained from alcohol rubs when care was taken that the subject did not inhale the alcohol. If absorbed via this route, apparently the rate of absorption is less than the rate of elimination.
Absorption from gastrointestinal tract. Alcohol is absorbed by various parts of the gastrointestinal tract as follows.
Mouth. Alcohol can be absorbed through the mouth lining; however, the amount is normally insignificant since fluid leaves the mouth rapidly. The mouth of a non-drinker rinsed with liquor will be free of alcoho9l after about 15 to 20 minutes.
Stomach. About 25% of the alcohol is absorbed directly into the blood stream through the stomach wall. The exact amount is variable and influenced by the emptying time of the stomach. In contrast, no other substances (even liquids) are absorbed from the stomach.
Small intestine. The remainder is absorbed from the small intestine; very little gets past the duodenum (the first 8 to 10 inches of the small intestines).
Rate. The rate of absorption varies somewhat from person to person and for the same person at different times depending on the condition of his body. However, alcohol begins to pass into the
17
blood stream within 1 to 2 minutes after it is consumed, most alcohol is absorbed within 15 minutes, nearly 90% is absorbed within 1 hour, and nearly all is absorbed in 1.5 hours. Three hours may be required for complete absorption. Factors that affect rate of absorption. Absorption through the stomach wall is slow and represents only a portion of total alcohol intake. Absorption through the small intestine is rapid. Therefore, anything that increases emptying time of the stomach increases absorption rate; anything that delays emptying time slows absorption rate. Both dilution of the alcoholic beverage and food in the stomach affect rate of absorption.
Dilution. Absorption is slow in dilute and strong beverages. It is fastest for a 20% water solution. Apparently very strong solutions irritate the gastrointestinal walls and inhibit absorption.
Food in the stomach. Food in the stomach delays absorption. Absorption is slowed since stomach emptying time is delayed. This applies to eating while drinking and to eating before drinking.
DISTRIBUTION
Route. Alcohol is absorbed into the blood through the walls of the stomach and small intestine, travels via the portal vein to the liver, and thence travels via the circulatory system to the heart, lungs and back to the heart. It is then pumped from the heart to all parts of the body. Equilibrium. Alcohol has an affinity for water and distributes itself throughout the body organs and tissues in proportion to their fluid content. Blood circulates through the body at a rate of 3 to 4.5 liters per minute. Organs such as the brain, liver and kidney, which have a large blood supply, initially receive a disproportionately large quantity of circulating blood. When absorption and distribution are complete, equilibrium is achieved, that is, alcohol is proportional to fluid content. Distribution ratios. The distribution ratios given below are for the amount of alcohol in tissues and body fluids compared to that in whole blood, which has been assigned a value of 1.00. The values given are averages; for example, the actual ratios between urine and blood have ranged from 1.12 top 1.51. Urine 1.35 Brain 1.17 Blood Plasma 1.16 Saliva 1.12 Liver 0.91 Blood Clot 0.77 Whole body: men 0.68 Whole body: Women 0.55 Fat 0.019
18
Widmark’s R. E.M.P. Widmark, a Swedish scientist and pioneer in alcohol research, developed a formula for estimating the amount of alcohol in a person’s body that would produce a given BAC. It is based on the distribution of alcohol in the body as a whole compared to blood. Formula. The formula is. WRCT A= .08 Where: A = ethyl alcohol in milliliters- (ML) W = body weight in grams (g) R = distribution ration ▬ .68 for men; .55 for women CT = chemical test (decimal equivalent of % BAC) .8 = specific gravity of alcohol (approximately) (See Section B for definition of specific gravity.) Example. How many fluid ounces of 100-proof whiskey are in the body of a 200-pound man who has a BAC of 0.15%? Solution. Pertinent equivalents: 1 lb = 454 g 30 ml (approx.) = 1 oz (Fluid) 100-proof whiskey = 0.50 alcohol W = 200 x 454 g = 90,800 g R - .68 (distribution ratio for men) CT - .0015 (decimal equivalent of BAC of 0.15%) Therefore: WRCT A= 0.8 90,800 x .68 x .0015 A= 0.8 92.626 A= 0.8 A= 115.77 ml 115.7 A= ml = 3.85 fl oz pure alcohol 30
3.85 = 7.70 fl oz 100-proof whiskey .50
19
Caution. Widmark’s R is based on averages. It actually provides a means of estimating the amount of alcohol in the body at the time of chemical testing. It should not be consider5ed as a means of specifying actual amount consumed.
ELIMINATION Method. Alcohol is eliminated from the body both by metabolism and by direct excretion.
Metabolism. Most alcohol (between 90 and 98%) is oxidized to carbon dioxide and water. The oxidation process takes place in the liver. Since oxidation provides the body with calories, alcohol must be considered a food although it has no direct fool value.
Excretion. A small amount of alcohol is excreted directly through breath, urine, tears, saliva, perspiration, etc. The amount thus excreted is generally about 2% and rarely exceeds 8% of the quantity absorbed.
Rate of Elimination, As soon as alcohol is absorbed into the blood system and travels to the liver, the body immediately starts to eliminate it. The average rate of elimination is reported as 0.015 to 0.018% per hour and varies between 0.01 and 0.025% per hour. At very low BAC’s, the average rate of elimination is about 0.01% per hour. For a man weighing 150 pounds, the quantity eliminated in one hour is about 7g or 2/3 oz. of 100-proof whiskey. Although there is some controversy in the literature, the preponderant evidence indicates that the rate of elimination is essentially linear; that is, for any given person at a given time, the rate of alcohol elimination per hour will be essentially constant.
Factors Affecting Rate of Elimination. In general, the rate of elimination is not affected by stimulants, diseased states or exercise. Where changes in rates have been noted, they are too small to be of any practical value. Because of the small quantity excreted directly, any attempt aimed at eliminating alcohol through increasing breathing rate, urine or perspiration has little or no effect.
FACTORS AFFECTING HEIGHT AND SHAPE OF THE BAC CURVE
Many factors affect the height and shape of the BAC curve. Some of these are discussed below.
Body Weight vs. Drinks Consumed. In general, a heavier person can consume more alcoholic beverages than a lighter one to attain the same BAC level. A chart of BAC values for different body weights and drinks consumed is shown in Exhibit C-3.
The example in the exhibit uses an average elimination rate of 0.015% as a means of accounting for the factor of “time since first drink” in estimating BAC. It should be noted again that this rate of elimination is an average rate and, therefore, should be used with caution in making such estimates.
20
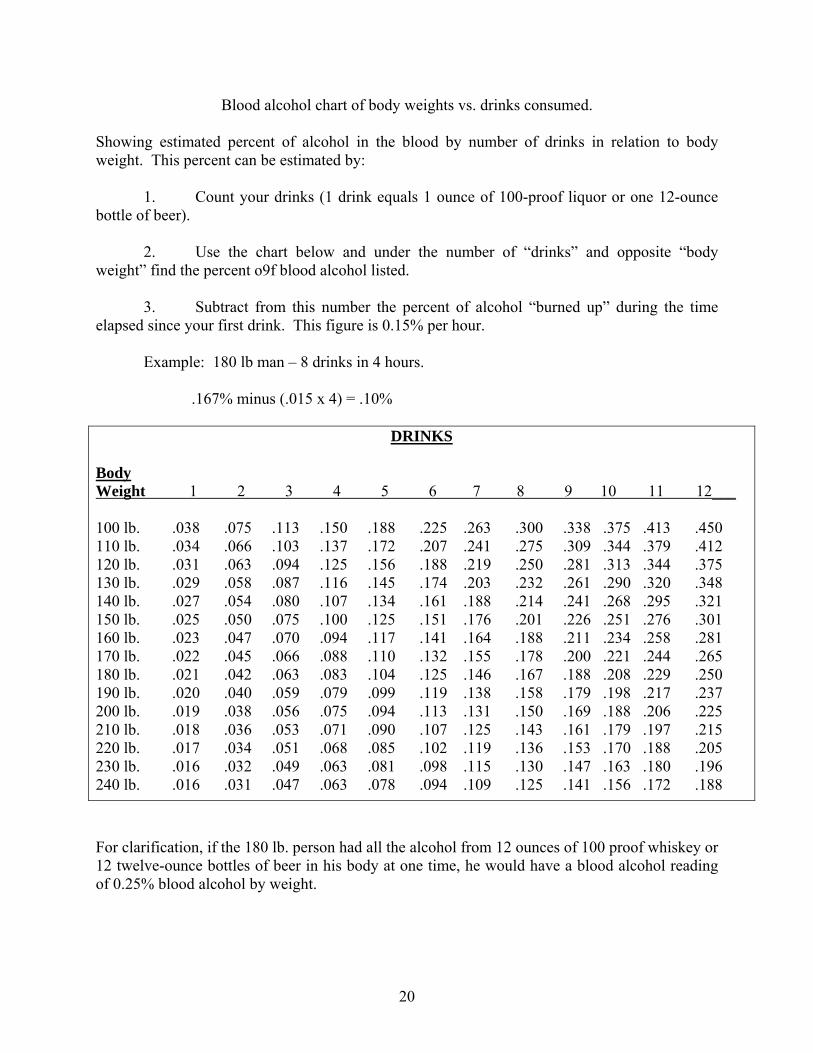
Blood alcohol chart of body weights vs. drinks consumed. Showing estimated percent of alcohol in the blood by number of drinks in relation to body weight. This percent can be estimated by:
1. Count your drinks (1 drink equals 1 ounce of 100-proof liquor or one 12-ounce bottle of beer).
2. Use the chart below and under the number of “drinks” and opposite “body weight” find the percent o9f blood alcohol listed.
3. Subtract from this number the percent of alcohol “burned up” during the time elapsed since your first drink. This figure is 0.15% per hour.
Example: 180 lb man – 8 drinks in 4 hours. .167% minus (.015 x 4) = .10%
DRINKS Body Weight 1 2 3 4 5 6 7 8 9 10 11 12___ 100 lb. .038 .075 .113 .150 .188 .225 .263 .300 .338 .375 .413 .450 110 lb. .034 .066 .103 .137 .172 .207 .241 .275 .309 .344 .379 .412 120 lb. .031 .063 .094 .125 .156 .188 .219 .250 .281 .313 .344 .375 130 lb. .029 .058 .087 .116 .145 .174 .203 .232 .261 .290 .320 .348 140 lb. .027 .054 .080 .107 .134 .161 .188 .214 .241 .268 .295 .321 150 lb. .025 .050 .075 .100 .125 .151 .176 .201 .226 .251 .276 .301 160 lb. .023 .047 .070 .094 .117 .141 .164 .188 .211 .234 .258 .281 170 lb. .022 .045 .066 .088 .110 .132 .155 .178 .200 .221 .244 .265 180 lb. .021 .042 .063 .083 .104 .125 .146 .167 .188 .208 .229 .250 190 lb. .020 .040 .059 .079 .099 .119 .138 .158 .179 .198 .217 .237 200 lb. .019 .038 .056 .075 .094 .113 .131 .150 .169 .188 .206 .225 210 lb. .018 .036 .053 .071 .090 .107 .125 .143 .161 .179 .197 .215 220 lb. .017 .034 .051 .068 .085 .102 .119 .136 .153 .170 .188 .205 230 lb. .016 .032 .049 .063 .081 .098 .115 .130 .147 .163 .180 .196 240 lb. .016 .031 .047 .063 .078 .094 .109 .125 .141 .156 .172 .188 For clarification, if the 180 lb. person had all the alcohol from 12 ounces of 100 proof whiskey or 12 twelve-ounce bottles of beer in his body at one time, he would have a blood alcohol reading of 0.25% blood alcohol by weight.

21
Empty Stomach vs. Full Stomach. Food in the stomach will delay absorption and result in a lower BAC than would be obtain4ed if the stomach were empty. Instead of decreasing immediately, a plateau at that BAC will be maintained for a longer period of time that if the stomach were empty. The amounts of 80-proof liquor required to reach various BAC’s under conditions of both full and empty stomachs may be estimated from the charts in Exhibit C-4. Rate of Drinking and Quantity Consumed. The BAC curve varies in height and shape depending on quantity of alcoholic beverages consumed and the rate of drinking. Variations in curve shape as a function of quantity consumed and time are shown in Exhibits C-5 and C-6. In general, it may be commented that maximum BAC’s are usually reached 20 to 30 minutes after consuming a single drink on an empty stomach. When drinks are consumed successively over time, the BAC rises with ach drink, reaches a maximum 15 to 20 minutes following ingestion of the last drink and starts to decline from this maximum. (See Exhibit C-5.) When several drinks are consumed in a very short period of time, peak BAC’s may not appear until 45 minutes to 1-1/4 hours after ingestion of the last drink. (See Exhibit C-6.)
22
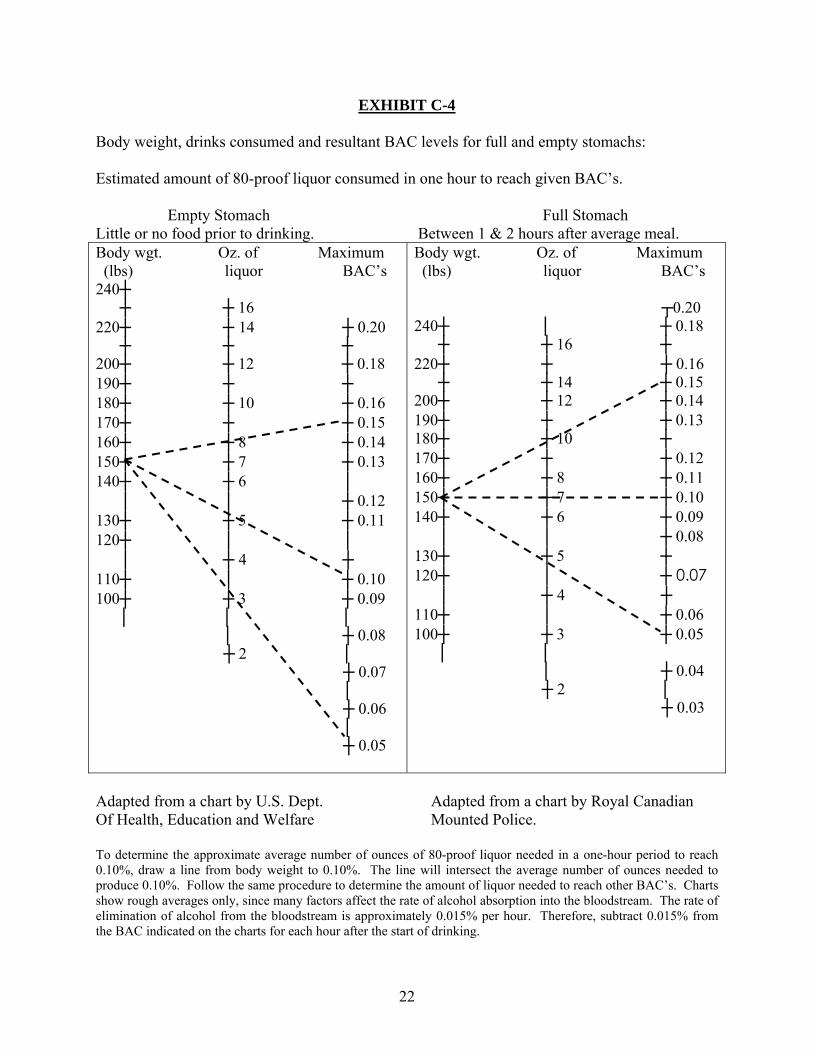
EXHIBIT C-4 Body weight, drinks consumed and resultant BAC levels for full and empty stomachs: Estimated amount of 80-proof liquor consumed in one hour to reach given BAC’s. Empty Stomach Full Stomach Little or no food prior to drinking. Between 1 & 2 hours after average meal. Body wgt. Oz. of Maximum (lbs) liquor BAC’s 240┼ ┼ ┼ 16 220┼ ┼ 14 ┼ 0.20 ┼ ┼ ┼ 200┼ ┼ 12 ┼ 0.18 190┼ ┼ ┼ 180┼ ┼ 10 ┼ 0.16 170┼ ┼ ┼ 0.15 160┼ ┼ 8 ┼ 0.14 150┼ ┼ 7 ┼ 0.13 140┼ ┼ 6 │ │ │ ┼ 0.12 130┼ ┼ 5 ┼ 0.11 120┼ │ │ │ ┼ 4 ┼ 110┼ │ ┼ 0.10 100┼ ┼ 3 ┼ 0.09 │ │ │ │ ┼ 0.08 ┼ 2 │ ┼ 0.07 │ ┼ 0.06 │ ┼ 0.05
Body wgt. Oz. of Maximum (lbs) liquor BAC’s ┬0.20 240┼ │ ┼ 0.18 ┼ ┼ 16 ┼ 220┼ ┼ ┼ 0.16 ┼ ┼ 14 ┼ 0.15 200┼ ┼ 12 ┼ 0.14 190┼ ┼ ┼ 0.13 180┼ ┼ 10 ┼ 170┼ ┼ ┼ 0.12 160┼ ┼ 8 ┼ 0.11 150┼ ┼ 7 ┼ 0.10 140┼ ┼ 6 ┼ 0.09 │ │ ┼ 0.08 130┼ ┼ 5 ┼ 120┼ │ ┼ 0.07 │ ┼ 4 ┼ 110┼ │ ┼ 0.06 100┼ ┼ 3 ┼ 0.05 │ │ │ ┼ 0.04 ┼ 2 │ ┼ 0.03
Adapted from a chart by U.S. Dept. Adapted from a chart by Royal Canadian Of Health, Education and Welfare Mounted Police. To determine the approximate average number of ounces of 80-proof liquor needed in a one-hour period to reach 0.10%, draw a line from body weight to 0.10%. The line will intersect the average number of ounces needed to produce 0.10%. Follow the same procedure to determine the amount of liquor needed to reach other BAC’s. Charts show rough averages only, since many factors affect the rate of alcohol absorption into the bloodstream. The rate of elimination of alcohol from the bloodstream is approximately 0.015% per hour. Therefore, subtract 0.015% from the BAC indicated on the charts for each hour after the start of drinking.
23
0.00
0.02
0.04
0.06
0.08
0.10
0.12
0.14
0.16
0.18
0.20
1 2 3 4 5 6 7 8
10 Male Subjects2 0z./hr/150 lb
24 Male Subjects1 oz./hr/150 lb
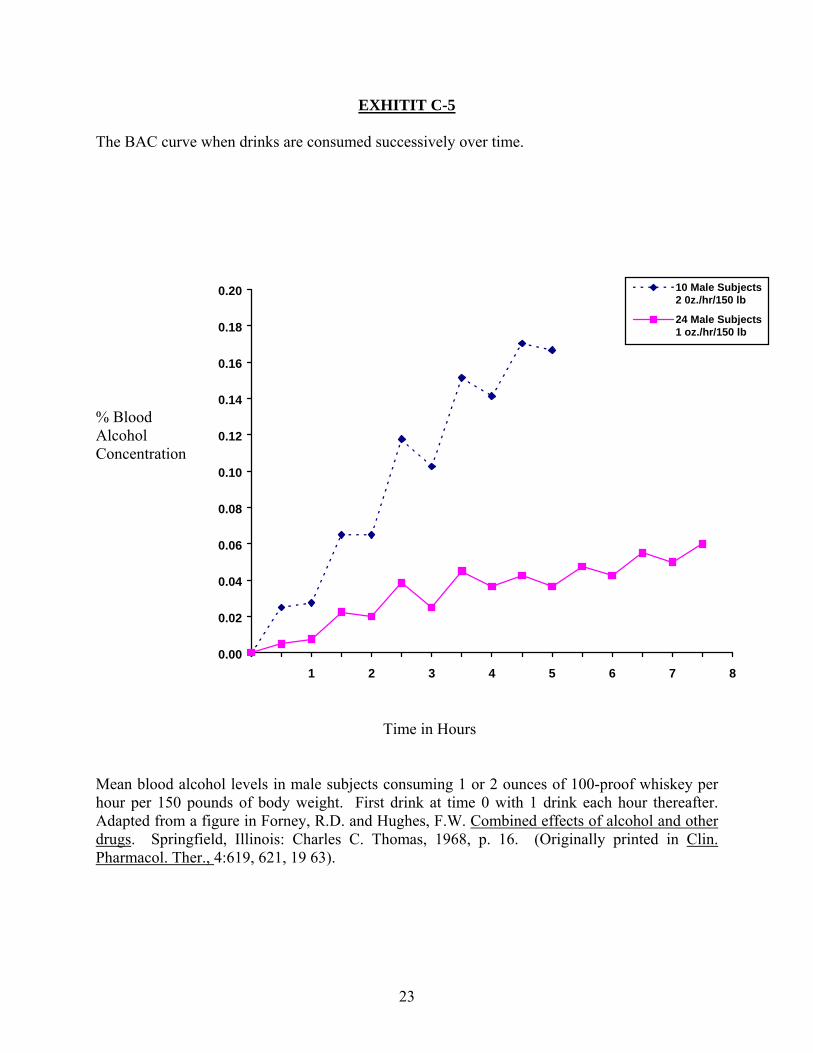
EXHITIT C-5 The BAC curve when drinks are consumed successively over time. % Blood Alcohol Concentration
Time in Hours
Mean blood alcohol levels in male subjects consuming 1 or 2 ounces of 100-proof whiskey per hour per 150 pounds of body weight. First drink at time 0 with 1 drink each hour thereafter. Adapted from a figure in Forney, R.D. and Hughes, F.W. Combined effects of alcohol and other drugs. Springfield, Illinois: Charles C. Thomas, 1968, p. 16. (Originally printed in Clin. Pharmacol. Ther., 4:619, 621, 19 63).
24
0.00
0.05
0.10
0.15
0.20
0 1 2 3 4 5 6 7 8 9 10 11 12
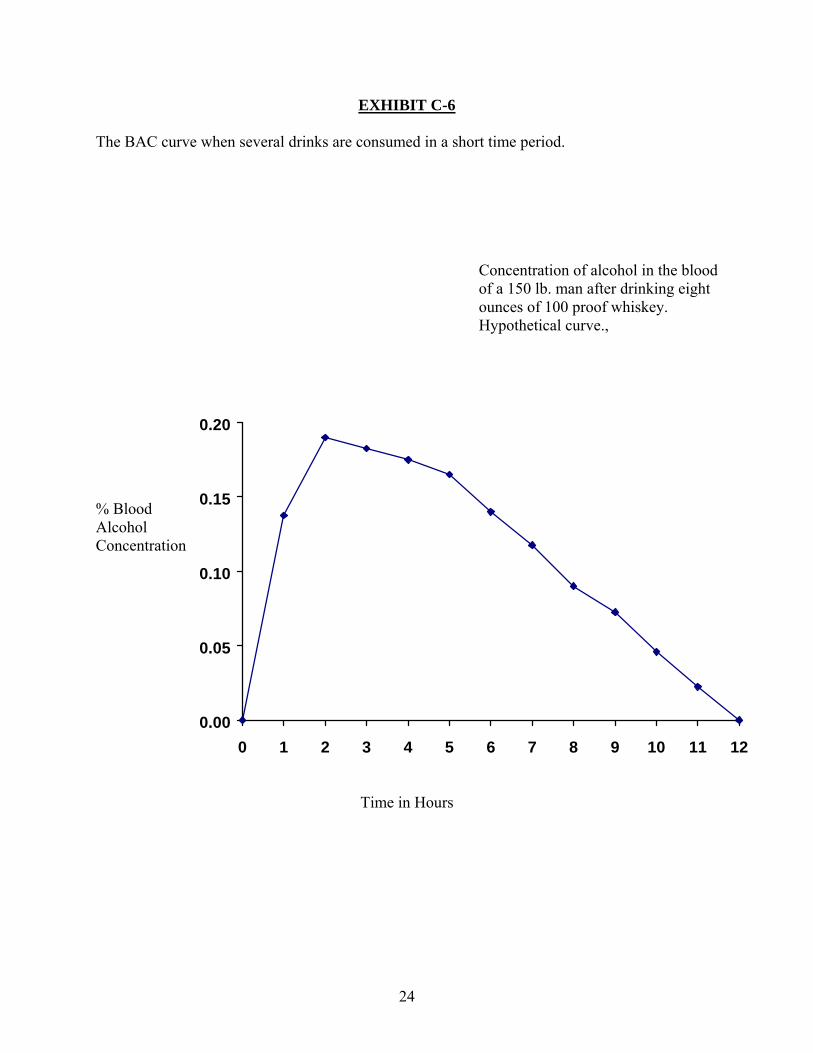
EXHIBIT C-6 The BAC curve when several drinks are consumed in a short time period.
Concentration of alcohol in the blood of a 150 lb. man after drinking eight ounces of 100 proof whiskey. Hypothetical curve.,
% Blood Alcohol Concentration
Time in Hours
25
PHARMACOLOGY OF ALCOHOL
Effects on the Central Nervous System Alcohol is a depressant and not a stimulant. Many people think it is a stimulant since its first effect is to reduce tension and give a mild feeling of euphoria or well being. It affects the most recently developed part of the brain first—that part controlling a person’s judgment and morals. Its last effect is on the oldest part of the brain—that part controlling a person’s automatic body functions so that the individual completely loses control of himself, passes into a coma and ultimately can die if the respiratory center in the brain ceases functioning. In between, there is a progression of deterioration that affects a person’s speech, vision and equilibrium.
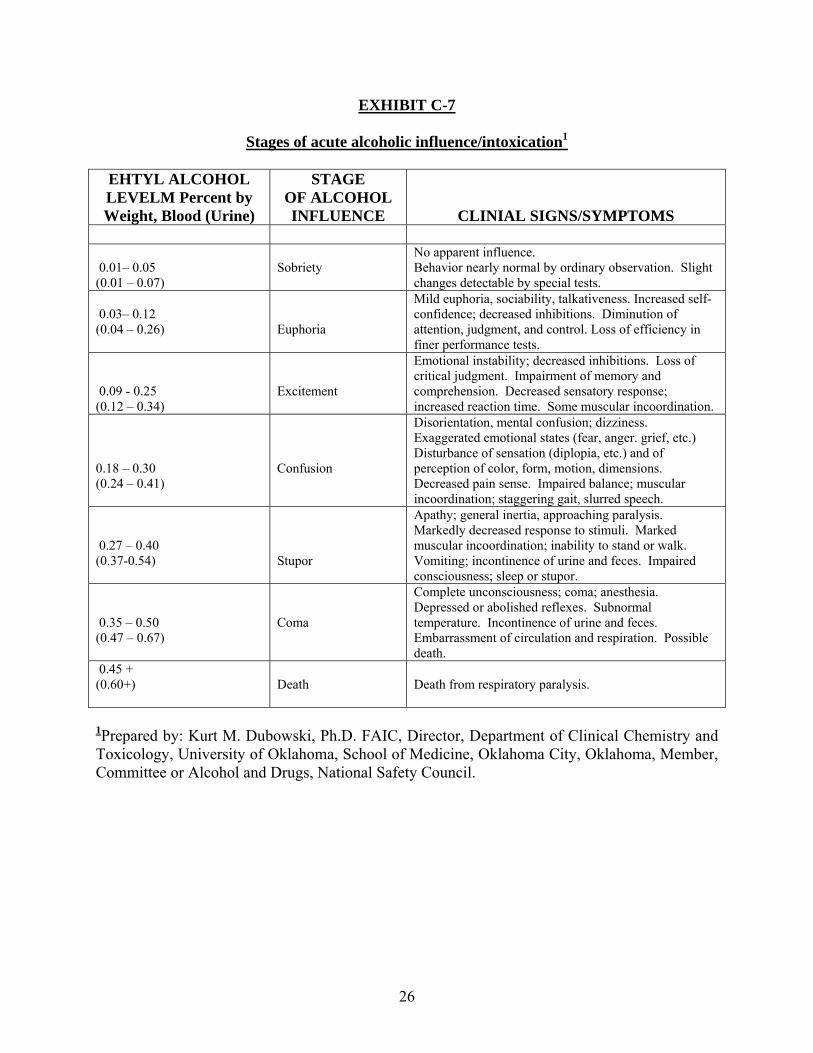
Stages of Introduction. The stages of alcoholic influence are shown in Exhibit C-7. The BAC ranges given in the Exhibit indicate that not all people are affected the same at the same BAC. In addition, there are no precise BAC’s that define each stage. One merges into another as the effects of alcohol become more severe.
Effects on Vision. Pupils of the eye generally dilate (enlarge) and reaction to light becomes sluggish. At BAC’s of 0.10% people are unable to completely fuse the vision of each eye into a single image. Glare is more bothersome and distance judgment is impaired. The time to adjust from far to near vision may be increased from 0.10 to 0.20 seconds at a BAC of 0.06%.
Effects on Reaction Time and Coordination Alcohol causes an impairment in muscular coordination; the threshold of impairment has been demonstrated to be as low as a BAC of 0.02%. Reaction time is increased. Each person appears to have a threshold BAC at which impairment begins; then small additional doses of alcohol produce large losses in coordination. Motor tasks which require coordination or complex discrimination are impaired at BAC’s of 0.05%.
Effects On Other Body Organs, Systems, And Issues
Effects on Skin. Alcohol has antiseptic properties. It absorbs heat upon evaporation and, therefore, imparts a cool and soothing feeling when rubbed on fevered skin. Following absorption, alcohol enlarges the blood vessels of the skin and permits an increase in the amount of blood circulating in the skin; this accounts for the flushed face of the drinker.
Effects on Circulation. Low BAC’s have very little effect on circulation except to enlarge blood vessels of the skin as discussed above. There is no evidence that alcohol improves circulation; on the contrary; it appears to impair circulation. At a BAC of 0.45% or greater, death may result from respiratory or cardiac arrest.
26
EXHIBIT C-7
Stages of acute alcoholic influence/intoxication1
EHTYL ALCOHOL LEVELM Percent by Weight, Blood (Urine)
STAGE OF ALCOHOL INFLUENCE
CLINIAL SIGNS/SYMPTOMS 0.01– 0.05 (0.01 – 0.07)
Sobriety
No apparent influence. Behavior nearly normal by ordinary observation. Slight changes detectable by special tests.
0.03– 0.12 (0.04 – 0.26)
Euphoria
Mild euphoria, sociability, talkativeness. Increased self-confidence; decreased inhibitions. Diminution of attention, judgment, and control. Loss of efficiency in finer performance tests.
0.09 - 0.25 (0.12 – 0.34)
Excitement
Emotional instability; decreased inhibitions. Loss of critical judgment. Impairment of memory and comprehension. Decreased sensatory response; increased reaction time. Some muscular incoordination.
0.18 – 0.30 (0.24 – 0.41)
Confusion
Disorientation, mental confusion; dizziness. Exaggerated emotional states (fear, anger. grief, etc.) Disturbance of sensation (diplopia, etc.) and of perception of color, form, motion, dimensions. Decreased pain sense. Impaired balance; muscular incoordination; staggering gait, slurred speech.
0.27 – 0.40 (0.37-0.54)
Stupor
Apathy; general inertia, approaching paralysis. Markedly decreased response to stimuli. Marked muscular incoordination; inability to stand or walk. Vomiting; incontinence of urine and feces. Impaired consciousness; sleep or stupor.
0.35 – 0.50 (0.47 – 0.67)
Coma
Complete unconsciousness; coma; anesthesia. Depressed or abolished reflexes. Subnormal temperature. Incontinence of urine and feces. Embarrassment of circulation and respiration. Possible death.
0.45 + (0.60+)
Death
Death from respiratory paralysis.
1Prepared by: Kurt M. Dubowski, Ph.D. FAIC, Director, Department of Clinical Chemistry and Toxicology, University of Oklahoma, School of Medicine, Oklahoma City, Oklahoma, Member, Committee or Alcohol and Drugs, National Safety Council.
27
Effects on Kidney. Aside from the fact that alcohol is a mild diuretic, that is, it increases urine output, moderate use of alcohol does not appear to cause any kidney damage. Effects on Liver. Alcohol causes an accumulation of fat in the liver, a condition referred to as fatty liver. It may result in an inflammation of the liver, commonly called cirrhosis. However, cirrhosis appears to be more a result of the poor diet of the alcoholic rather than a direct result of alcohol. Moderate use of alcohol does not appear to have a harmful effect on the liver of healthy, well-nourished people. Symptoms of Alcoholic Influence. Common symptoms of alcoholic influence are:
- Odor of alcoholic beverages on the breath - Swaying or unsteadiness—staggering - Poor muscular coordination - Confusion - Sleepiness - Disorderly appearance - Speech impairment, such as slurred, confused, thick tongue - Dizziness - Nausea - Unusual actions, such as very talkative - Visual disorders—fixed stare—glassy eyes - Flushed skin
The list is not all-inclusive nor does any one symptom or combination of symptoms mean that the person is intoxicated. Numerous illnesses/injuries can produce the same symptoms as alcoholic influence. Several of these are listed in Exhibit C-8 which is given at the end of this section. The trainee should, therefore, examine and question the suspect carefully in order that his possible need for medical attention will not be ignored. It might be pointed out that a chemical test can protect both law enforcement groups and the public by providing an alert to the need for medical attention. An unusually low BAC can serve to indicate that the suspect’s abnormal behavior is due to some illness or injury other than alcohol, and appropriate procedures can be undertaken to assure that the suspect receives needed medical attention. An unusually high BAC also indicates the need for medical attention in order that the danger of respiratory or cardiac arrest can be avoided. Alcohol Combined with Other Drugs, Alcohol combined with other drugs can cause special problems. As stated previously, medical care should be obtained for any individual who has a low BAC but appears to be markedly under the influence. The effects of alcohol combined with stimulants and other depressants, are discussed below.
- Stimulants. (caffeine, amphetamine, etc.) Stimulants do not counteract the
depressing effect of alcohol. They are only temporarily effective with regard to the grosser aspects of drunkenness. They may be used for temporary arousal in severe intoxication, but the arousal effect is brief.
28
- Depressants. (analgesics, antihistamines, tranquillizers, etc.) The depressant effects of alcohol and other drugs will be added together and, in some instances, the resultant effect will be greater than the expected combined effect of the two drugs. Since such depressants are used widely and indiscriminately by the public, their use with alcohol could cause a serious problem for the driver.
- Narcotics. (opium, morphine, cocaine, marijuana, LSD, heroin, etc). Animal studies
have indicated additive and supra-additive effects of narcotics and alcohol, human studies are understandably lacking. In examining the drunk driver suspect, the trainee should be alert to the possibility that the individual’s behavior may be due to a narcotic or to a narcotic or to a combination of narcotic and alcohol.
- Tolerance to Alcohol. It is well known that people react differently to liquor, that is,
some are better able to “hold” their liquor than others. Different individuals at the same BAC react differently. Although it may be said that the heavy drinker has learned to compensate for the effects of liquor tolerance has been noted in the person with no previous exposure. Individuals with the same weight can attain different BAC’s from the same amount of alcohol. It is the opinion of most investigators that tolerance is limited and occurs most frequently at BAC’s of 0.10% or less.
The exact reasons for differences in tolerance to alcohol are unknown but the following reasons have been proposed:
- Delayed absorption - Decreased penetration in the central nervous system - Increased elimination - Increased water content of the body - Increased tissue tolerance - Variation in the ability of individuals to respond to stress
29
THEORY OF SIMULATOR The principles that the simulator incorporates in its design have been accepted concepts for many years. The basic law involved with the theory of this system was discovered in 1803 by William Henry, a British Chemist. Henry’s law is stated as follows:
“When the water solution of a somewhat volatile chemical compound is brought to equilibrium with air, there is a fixed ratio between the concentration of the compound in the air and its concentration in the water, and this ratio is constant for a given temperature and atmospheric pressure.”
This same physical law applies to the human body between the concentration of alcohol in the blood and its counterpart in the breath. The simulator was designed to simulate this effect and give the breath test field a tool for instrument calibration. The temperature of the simulator is elevated to 34°C ± .2°C which is directly related to the temperature of a breath sample as it leaves the mouth of the subject. So by heating the solution up to this specific temperature and maintaining it there, and by knowing the concentration of alcohol which is in the solution, we can pre-calculate the amount of alcohol which will be in the head space above the solution. By introducing a direct alcohol-free breath sample into the simulator and forcing the head space air into the Breathalyzer, we can predetermine what the reading of the instrument should be. The first device which was widely used for this purpose was known as the Equilibrator, invented by Dr. Polla N. Harger in the 1930s. The same concept and principles hold for this device as we are using currently with the simulator except for one change. The Equilibrator did not maintain a constant temperature and was operated at room temperature. Room temperature varies greatly from minute to minute. The temperature had top be closely monitored so a calculation could be made to alter the results to the equivalent of 34°C. The Equilibrator was attached to a Breathalyzer and room air was pumped through the solution. The temperature would be monitored at that time. The Breathalyzer would go through its procedures and indicated a result. The result would then go through a mathematical equation to calculate back to the equivalent of 34°C. The Simulator eliminates a lot of work on the part of the technician or operator, makes the process much more accurate and expedites the entire process. The solution which is placed in the simulator can be of a varying concentration. At no time should the concentration be greater than 0.40% because the system is designed to measure only up to the maximum scale limit of 0.40%. The accuracy of any analysis completed over 0.40% would greatly increase re-establishing a balance. If we take a look at the concentration of alcohol in the aqueous phase and the concentration of alcohol in the vapor phase, we will find that there is a difference. This difference is dependent upon the ratio which is controlled by a specific temperature and atmospheric pressure. For example, if we prepared a solution which would deliver a 100 milligrams percent (0.10%) vapor sample, the concentration of the aqueous phase must be 120 milligrams percent )0.12%). This
30
relationship holds true throughout the entire spectrum of concentrations. If you are ever questioned about this situation, you must explain that you are measuring the vapor concentration of ethyl alcohol, and not directly measuring the concentration of solution.
31
PREPARATION OF SIMULATOR SOLUTIONS The easiest way for a technician to prepare Simulator working and stock solutions is by first acquiring a number of laboratory materials: 500 milliliter volumetric flask 1000 milliliter volumetric flask 10 milliliter graduated pipette 75 milliliter pipette 2 milliliter volumetric pipette Approximately 80 milliliters of absolute ethyl alcohol The first solution to be prepared is called a “Stock” solution. This solution is so named because it is the basis for preparations of the working solutions. With the following calculations it is extremely easy to prepare working solutions after the initial stock solution has been prepared. Preparing A Simulator Stock Solution. Take one liter volumetric flask and add 100 ml of distilled water. Rinse the flask, drain and repeat this procedure at least once more. Once the flask is clean, add approximately 500 ml of distilled water to the flask. Fill a 75 ml volumetric pipette with absolute alcohol so that the bottom of the meniscus is just above the volume line of the pipette. Once the pipette is filled, allow it to drain into the flask. Pipette 2 ml of ethyl alcohol into one liter flask. After this is completed, you have added 77 ml of absolute alcohol, finish filling the flask with distilled water so that the meniscus of the solution in the flask is just above the volume line. Stopper the flask and invert it 3 or 5 times to assure a proper solution mixture. Always be sure to label the flask “STOCK”. Briefly, what we have done is half filled a 1 liter volumetric flask, introduced 77 milliliters of absolute alcohol to that, and then brought the total volume up to 1 liter. Preparing a Simulator Working Solution. To prepare a working solution, rinse a 500 ml volumetric flask using the same procedures we discussed for the stock solution. After rinsing, half fill the flask with distilled water. Add one milliliter of stock solution for each 0.01% desired. After adding the proper amount of stock solution, finish filling the flask with distilled water so the meniscus is just above the volume line on the flask. Invert 3 or 4 times to assure proper mixture. Be sure to label the flask with the proper solution concentration.


