58
International Traffic Safety Data and Analysis Group Research Report Alcohol-Related Road Casualties in Official Crash Statistics

International Transport Forum 2 rue André Pascal 75775 Paris Cedex 16 France T +33 (0)1 45 24 97 10 F +33 (0)1 45 24 13 22 Email : [email protected] Web: www.internationaltransportforum.org 20
15-1
0 -
Phot
o cr
edit
: Kri
vosh
eev
Vita
ly /
Shu
tter
stoc
k
Alcohol-Related Road Casualties in Official Crash Statistics
This study examines how improving insights regarding the real number of alcohol-related road casualties worldwide can help to save lives. Every year 1.25 million people die in road crashes according to the World Health Organization. It is widely recognised that drink driving is an important risk-increasing factor and contributes to many road deaths. With great certainty, the real number of alcohol-related road casualties is higher than reported in the official statistics. Better insights into reporting procedures is of the utmost relevance to arrive at comparable and reliable data.For this study, a total of 45 countries were surveyed with the help of an online questionnaire. The survey was facilitated through the members of the International Transport Forum’s permanent working group on road safety, known as the International Traffic Safety Data and Analysis Group (IRTAD), the Ibero-American Road Safety Observatory (OISEVI) and the International Center for Alcohol Policies (IARD, formerly ICAP), London
International Traffic SafetyData and Analysis Group
Research Report
Alcohol-Related Road Casualties in Official Crash Statistics
Why Does Road Safety Im
prove When Econom
ic Times Are Hard?
Research Report
2015

International Traffic SafetyData and Analysis Group
Research Report
Alcohol-Related Road Casualties in Official Crash Statistics


The International Transport Forum
The International Transport Forum is an intergovernmental organisation with 57 member countries. It acts as a think tank for transport policy and organises the Annual Summit of transport ministers. ITF is the only global body that covers all transport modes. The ITF is politically autonomous and administratively integrated with the OECD.
The ITF works for transport policies that improve peoples’ lives. Our mission is to foster a deeper
understanding of the role of transport in economic growth, environmental sustainability and social inclusion and to raise the public profile of transport policy.
The ITF organises global dialogue for better transport. We act as a platform for discussion and pre-
negotiation of policy issues across all transport modes. We analyse trends, share knowledge and promote exchange among transport decision-makers and civil society. The ITF’s Annual Summit is the world’s largest gathering of transport ministers and the leading global platform for dialogue on transport policy.
The Members of the ITF are: Albania, Armenia, Argentina, Australia, Austria, Azerbaijan, Belarus, Belgium, Bosnia and Herzegovina, Bulgaria, Canada, Chile, China (People’s Republic of), Croatia, Czech Republic, Denmark, Estonia, Finland, France, Former Yugoslav Republic of Macedonia, Georgia, Germany, Greece, Hungary, Iceland, India, Ireland, Israel, Italy, Japan, Korea, Latvia, Liechtenstein, Lithuania, Luxembourg, Malta, Mexico, Republic of Moldova, Montenegro, Morocco, the Netherlands, New Zealand, Norway, Poland, Portugal, Romania, Russian Federation, Serbia, Slovak Republic, Slovenia, Spain, Sweden, Switzerland, Turkey, Ukraine, the United Kingdom and the United States.
International Transport Forum 2, rue André Pascal
F-75775 Paris Cedex 16 [email protected]
www.itf-oecd.org
Any findings, interpretations and conclusions expressed herein are those of the authors and do not necessarily reflect the views of the International Transport Forum or the OECD. Neither the OECD, ITF nor the authors guarantee the accuracy of any data or other information contained in this publication and accept no responsibility whatsoever for any consequence of their use. This document and any map included herein are without prejudice to the status of or sovereignty over any territory, to the delimitation of international frontiers and boundaries and to the name of any territory, city or area.

4 − ACKNOWLEDGEMENTS
ALCOHOL-RELATED ROAD CASUALTIES IN OFFICIAL CRASH STATISTICS — © OECD/ITF 2017
Authors of the report
This report was prepared by Mr Luuk Vissers (SWOV, the Netherlands), Mr Sjoerd Houwing (SWOV, the Netherlands) and Mr Fred Wegman (Delft University of Technology).
Acknowledgements
This study is carried out with the indispensable help of others. We gratefully acknowledge the help from both the IRTAD and the OISEVI Secretariats. We especially thank Veronique Feypell, for her advice in and the distribution of the questionnaire to all the IRTAD-members. Also the help of Corina Puppo and Virginia Alvarez in translating the survey into Spanish and distributing and collecting the questionnaire and responses for the OISEVI-members is highly appreciated. Klaus Machata, David Silcock, Kathy Stewart and Pilar Zori are also gratefully acknowledged for their recommendations on the initial draft of the survey. We also thank the reviewers of the final draft of this paper, Horst Schulze and once more Kathy Stewart for their critical and helpful review. Finally our acknowledgements go to Hansje Weijer of SWOV for her help in making this report well readable.
IRTAD
Since 1988, the International Traffic Safety and Analysis Group (IRTAD) has been a permanent working group of the Joint Transport Research Centre of the OECD and the International Transport Forum (ITF). It is composed of road safety experts and statisticians from renowned safety research institutes, national road and transport administrations, international organizations, universities, automobile associations, the automobile industry, and others from OECD and non-OECD countries. IRTAD is both a working group and a database. Its main objectives are to:
• Be a forum of exchange on road safety data collection and reporting systems, and on trends in road safety development and road safety policies.
• Collect accident data and conduct data analysis to contribute to the work of the ITF/OECD, as well as to provide advice on specific road safety issues.
• Contribute to international co-operation on road accident data and its analysis.
IRTAD currently includes more than 70 organizations from 37 countries which all have a direct interest in road safety. It is the ambition of IRTAD to be a world leader in road safety by building and maintaining a high quality database on road safety information, by being a network for road safety specialists, by monitoring and analysing road safety developments in its member states, and by carrying out road safety data-related research. IRTAD has the aspiration to further expand its coverage by making more countries an active member of IRTAD. IRTAD offers a mechanism for the integration of prospective member countries while assisting with improvement of road safety data collection systems, where needed. The IRTAD Group co-operates with other international organizations, such as the World Bank to involve low- and middle-income countries in the work of the IRTAD Group.

TABLE OF CONTENTS − 5
ALCOHOL-RELATED ROAD CASUALTIES IN OFFICIAL CRASH STATISTICS — © OECD/ITF 2017
Table of contents
Executive summary ............................................................................................................................... 7
Chapter 1. Introduction ....................................................................................................................... 9 The underreporting issue ..................................................................................................................... 10 Defining an alcohol-related crash ........................................................................................................ 11 Content of the report ........................................................................................................................... 11 References ........................................................................................................................................... 13
Chapter 2. Research method .............................................................................................................. 15 Description of the work ....................................................................................................................... 16 Data collection and participants .......................................................................................................... 16 Questionnaire ...................................................................................................................................... 16
Chapter 3. Results of the survey ........................................................................................................ 19 Description of respondents .................................................................................................................. 20 Legislations, definitions and official statistics .................................................................................... 20 Data collection methods and sources .................................................................................................. 33 Quality of the data ............................................................................................................................... 34 Expert best estimate on the real number of alcohol-related road casualties ........................................ 35 Main results ......................................................................................................................................... 36 References ........................................................................................................................................... 38
Chapter 4. Methods for adjusting the official number of alcohol-related road casualties for underreporting ..................................................................................................................................... 39
Methods for adjusting the official number of alcohol-related road fatalities ...................................... 40 Methods for adjusting the official number of alcohol-related serious road injuries............................ 41 References ........................................................................................................................................... 42
Chapter 5. Conclusions and recommendations ................................................................................. 43 Conclusions ......................................................................................................................................... 44 Recommendations ............................................................................................................................... 45 References ........................................................................................................................................... 47
Annex A. Changes in legislation on blood alcohol concentration .................................................... 48
Annex B. Questionnaire ...................................................................................................................... 51
Figures
Figure 3.1. Share of alcohol-related road fatalities in 2000, 2005 and 2010 ........................................ 29
Figure 3.2. Share of alcohol-related serious road injuries in 2000, 2005 and 2010 .............................. 32

6 – TABLE OF CONTENTS
ALCOHOL-RELATED ROAD CASUALTIES IN OFFICIAL CRASH STATISTICS — © OECD/ITF 2017
Tables Table 3.1. Response of countries by organisation membership in percentage ..................................... 20
Table 3.2. Organisation type of the respondents ................................................................................... 20
Table 3.3. Unit of measurement ............................................................................................................ 21
Table 3.4. Legal limits on blood alcohol concentration levels definition of an alcohol-related road fatality .................................................................................................................................................... 22
Table 3.5. Definition of an alcohol-related road fatality ....................................................................... 25
Table 3.6. Definition used for alcohol-related serious road injuries ..................................................... 26
Table 3.7. Share of alcohol-related road fatalities in countries with a present legal limit of 0.0 g/l from official statistics ..................................................................................................................................... 26
Table 3.8. Share of alcohol-related road fatalities in countries with a present legal limit of 0.2 g/l from official statistics ............................................................................................................................ 27
Table 3.9. Share of alcohol-related road fatalities in countries with a present legal limit between 0.3 g/l and 0.4 g/l from official statistics ..................................................................................................... 27
Table 3.10. Share of alcohol-related road fatalities in countries with a present legal limit of 0.5 g/l from official statistics ............................................................................................................................ 27
Table 3.11. Share of alcohol-related road fatalities in countries with a present legal limit of 0.8 g/l From official statistics ........................................................................................................................... 28
Table 3.12. Countries publishing official statistics on alcohol-related serious road injuries ................ 30
Table 3.14. Conditions to carry out an alcohol test .............................................................................. 33
Table 3.15. Reasons for the police not to carry out alcohol tests.......................................................... 34
Table 3.16. Comparison of expert best estimate with official statistics on alcohol-related data on alcohol-related road casualties ............................................................................................................... 35

EXECUTIVE SUMMARY − 7
ALCOHOL-RELATED ROAD CASUALTIES IN OFFICIAL CRASH STATISTICS — © OECD/ITF 2017
Executive summary
What we did
This study examines how improving insights regarding the real number of alcohol-related road casualties worldwide can help to save lives. Every year 1.25 million people die in road crashes according to the World Health Organization. It is widely recognised that drink driving is an important risk-increasing factor and contributes to many road deaths. With great certainty, the real number of alcohol-related road casualties is higher than reported in the official statistics. Better insights into reporting procedures is of the utmost relevance to arrive at comparable and reliable data.
For this study, a total of 45 countries were surveyed with the help of an online questionnaire. The survey was facilitated through the members of the International Transport Forum’s permanent working group on road safety, known as the International Traffic Safety Data and Analysis Group (IRTAD), the Ibero-American Road Safety Observatory (OISEVI) and the International Center for Alcohol Policies (International Alliance for Responsible Drinking (IARD), formerly ICAP), Washington..
The questionnaire looked at drinking and driving legislation and at definitions of alcohol-related road fatalities and serious injuries. Based on the information provided, the methods of recording alcohol-related road casualties and the quality of the data were reviewed, with specific attention to the issue of underreporting.
What we found
Previous research found large differences in the share of alcohol-related road fatalities for different countries, ranging between 2% and 38% of the total. This is confirmed by this study, which found a share of alcohol-related fatalities ranging from approximately 5% to 35%. The official data of the countries surveyed for this study show that a weighted average of 21.8% among road deaths are alcohol-related. This proportion remains constant over the years (2000-2010). Accepting this figure as a reasonable estimate for all countries in the world and based on 1.25 million annual road fatalities worldwide, the alcohol-related deaths among fatally injured road users can be put at around 273 000 people every year.
There are indications, however, that this number underestimates the problem, because official statistics are affected by underreporting of alcohol-related crashes and casualties. As a result, the actual number of alcohol-related fatalities is probably higher still. (Serious injuries are even more prone to underreporting). The vast majority of countries surveyed (89%) still base their official data upon only a single data source. In most cases these are the police records (87.5%) for which this study found evident shortcomings. These deficiencies in data collection negatively influence the accuracy and reliability of the official data regarding alcohol-related road casualties, which complicates meaningful international comparisons. Official statistics do not give a complete picture of alcohol-related fatalities and serious injuries if only based police records of fatal crashes.
Furthermore, different countries use different definitions of what constitutes a road crash casualty. Definitions regarding alcohol-related serious road injuries in particular differ substantially between countries. This reinforces the distortions created through inaccurate recording of crash data when

8 − EXECUTIVE SUMMARY
ALCOHOL-RELATED ROAD CASUALTIES IN OFFICIAL CRASH STATISTICS — © OECD/ITF 2017
comparing countries. Therefore relying on official statistics will often be misleading. To enable more accurate analyses with a few to addressing the problem, improvements are needed.
What we recommend
Review how data on alcohol-related road crashes is collected
In order to come to more reliable and comparable data on alcohol-related serious road injuries and fatalities, countries should begin by assessing their current status on the recording of data on alcohol-related road fatalities and serious injuries. In this assessment we suggest to check for compliance with the following good-practices:
Aim for a systematic alcohol testing of every road user actively involved in a serious crash
Ideally, 100% of active road users that are involved in a road crash that resulted in death or serious injury should be tested for alcohol. If a systematic alcohol testing at this level is not possible, countries should apply additional methods for adjusting the official numbers of alcohol-related road fatalities and serious road injuries.
Use statistical analysis methods to better estimate the number of alcohol-related road fatalities
Additional statistical analysis methods as described in this study can help to obtain better estimates of alcohol-related serious road crashed. Methods should be developed and applied that align with the legal system and data collection framework of individual countries, rather than harmonise methods internationally.
Harmonise definitions of alcohol-related road casualties
To make official country statistics comparable, definitions of alcohol-related road casualties should be harmonised. A number of European countries have already adopted the definition proposed by the 2009 SafetyNet project, as “any death occurring within 30 days as a result of a fatal road crash in which any active participant was found with a blood alcohol level above the legal limit”. A similar approach should be used to define a person seriously injured in an alcohol related crash, based for example on the severity level of 3+ on the Maximum Abbreviated Injury Scale (MAIS3+), so that it would be defined as “any serious injury at MAIS3+ that occurred as a result of a road crash in which any active participant was found with a blood alcohol level above the legal limit”. If countries are unable to apply these recommended definitions, developing algorithms to allow for conversion of these definitions is recommended.
Conduct future research on how to measure alcohol-related road crashes involving pedestrians and cyclists
In order to make sure pedestrians and cyclists are also counted as any active participant in the definitions on alcohol-related fatalities and serious injuries further research is needed regarding the possibilities of measuring blood alcohol concentration for pedestrians and cyclists involved in road crashes.

1. INTRODUCTION − 9
ALCOHOL-RELATED ROAD CASUALTIES IN OFFICIAL CRASH STATISTICS — © OECD/ITF 2017
Chapter 1. Introduction
According to the Global Status Report on Road Safety 2015 of the World Health Organization (2015), every year 1.25 million road deaths occur worldwide. This is an estimate based on a survey amongst WHO member countries completed by using a modelling technique when reliable data was not available. In comparison to 2007, when an earlier report was published, this number did not change much despite global and national efforts to reduce the amount of road traffic deaths. One important road safety issue is drink driving. It is well documented that drink driving increases risks (Keall et al., 2004; Blomberg et al., 2005; Hels et al., 2011). However, it is not possible to indicate precisely how much, because the exact number of alcohol-related casualties is unknown. Official national statistics on road fatalities related to impaired driving differ considerably. Some countries attribute a relatively small proportion of road fatalities to alcohol use whereas official data in other countries attributes almost half of all road traffic deaths to alcohol-related accidents.
The official percentages of alcohol-related road fatalities in different countries for the year 2010 range between 2% and 38% of all road traffic deaths (WHO, 2013; WHO, 2015). How can this range be so wide and does it correctly reflect reality?

10 − 1. INTRODUCTION
ALCOHOL-RELATED ROAD CASUALTIES IN OFFICIAL CRASH STATISTICS — © OECD/ITF 2017
The underreporting issue
Several countries, particularly those in which the official road crash registration is mainly based on police crash reports, face serious data quality problems. The police are not informed about every crash, and if they are informed, they do not always fill out a crash form or make a report. This phenomenon is called “underreporting” and from a data perspective this is a widespread and unfortunate problem (Derriks and Mak, 2007). Because certain crash types tend to be underreported more than others, the resulting statistics are biased. Additionally, some doubts are expressed about the quality of official statistics concerning the number of people killed or seriously injured attributed to drinking and driving. Many studies suggest that the official numbers of alcohol-related road casualties do not seem reliable due to the problem of general underreporting of road crashes (Derriks and Mak, 2007; ETSC, 2010; ITF, 2011), or due more specifically to underreporting in alcohol-related road casualties (Assum and Sørensen, 2010; COWI et al., 2014). This issue is often not mentioned in official documents, which makes it difficult to know whether these official statistics on alcohol-related road casualties are reliable (COWI et al., 2014).
While developing a safety performance indicator for drinking and driving, Assum and Sørensen (2010) conclude that the validity of such an indicator is poor and improvements in reporting of drink-drivers are necessary to establish a reliable and valid safety performance indicator (SPI).
Not all countries systematically test blood alcohol concentration (BAC) on all road users involved in road crashes. In some countries, such as Belgium and the Netherlands, drivers who are killed on the spot are not tested for alcohol, which contributes to underreporting (COWI et al., 2014). Assum and Sørensen (2010) state that all drivers involved in fatal crashes, including those who are killed and those not considered to have caused the crash, should be tested to get complete data. This is the only way to obtain a comprehensive picture of the share of alcohol-related road casualties.
The legal requirements for reporting crashes to and by the police vary between countries. Furthermore, police officers do not always understand the importance of data collection. Data collection is sometimes associated with a lot of paperwork and seen as just an administrative burden (ITF, 2011). In addition, recordings of alcohol tests results sometimes get lost in the process of registration and changes in the registration process can also affect the reliability of the data (Derriks and Mak, 2007). Finally, Gundy and Verschuur (1986) found that police officers at the scene of the road crash have a tendency to underestimate high BAC. They found that at least a quarter to one-third of the drivers with a BAC above the legal limit are not breath tested and therefore not recorded.
To address this issue of underreporting of alcohol-related road crashes in the police registration, many countries use hospital data on road casualties to supplement the police data (ITF, 2011; WHO, 2013). In a number of countries a substantial number of road casualties are admitted to hospitals without being known to the police. The issue of drinking and driving should not be limited to road fatalities and police data only. Hospital data can contribute to a more comprehensive picture of alcohol-related serious injuries. Thus, for a better understanding of both the injury severity and the total number of alcohol-related road casualties, the use of hospital data in addition to police data is highly important and contributes to better international comparisons (ITF, 2011). However, hospitals in many countries do not perform a standard alcohol test on casualty admissions and often they are only tested when the use of alcohol leads to complications during surgery. The issue of underreporting not only characterises police registration, but also hospital data. When linking records in both databases the problems related to underreporting can be by-passed by using the capture-recapture approach to estimate the total number of subjects (ITF, 2011).

1. INTRODUCTION − 11
ALCOHOL-RELATED ROAD CASUALTIES IN OFFICIAL CRASH STATISTICS — © OECD/ITF 2017
Attempts have been made to make a more reliable and realistic estimate on the issue of alcohol-related road casualties. A study commissioned by the European Commission (COWI et al., 2014) uses additional surrogate sources to come to better estimates of real numbers of drinking and driving related fatalities and injuries. Sources such as epidemiological studies, expert estimates, data on alcohol use in the general population, the results from police enforcement activities and self-reported use of alcohol in traffic were used in this attempt to come to a European estimate. This study concludes that an estimated 20-28% (25% average) of all road fatalities in Europe was related to alcohol use. However, the official statistics for the same group of countries, suggest that on average 12.9% of all road fatalities were due to alcohol consumption. Keeping in mind that official figures tend to underestimate the share of road fatalities related to alcohol (Assum and Sørensen, 2010) the authors report that the actual share is closer to the higher end of the estimate (28%) than to the lower end (20%).
Defining an alcohol-related crash
So far we learned that the procedures and methods that seem to be normal practice in many countries today, lead to underreporting. Another problem concerns the definitions and registration methods and their differences between countries. These differences complicate meaningful international comparability of official data on alcohol-related road casualties. The World Health Organization states in their Global Status Report on Road Safety (2015) that much needs to be improved to further harmonise the data collection on road fatalities and serious injuries. The European SafetyNet project recommended a definition for an alcohol fatality: “Any death occurring within 30 days as a result of a fatal road crash in which any active participant was found with a blood alcohol concentration level above the legal limit”. IRTAD has adopted this definition. However, this definition does not guarantee that pedestrians and cyclists are considered as ‘any active participant’, because probably in most countries a legal limit on blood alcohol concentration for these groups does not exist. This would imply that pedestrians as well as cyclists are not recorded as an alcohol-related casualty as long as a legal limit for these groups is missing. This contributes to the issue of underreporting mentioned earlier. If such a definition is accepted internationally, correction factors need to be developed to make possible meaningful comparisons that consider differences in legal limits. As yet, not many countries use this definition, and for the countries who do, data on alcohol-related road casualties can vary substantially due to other factors. For example, Gjerde et al. (2014) compared the use of alcohol among drivers in Brazil and in Norway and found that drink driving is more common in Brazil, although both countries use the same legal alcohol limit. This study concludes that differences in the history of legislation, enforcement and penalties may also be of influence on the dissimilarities in the prevalence of alcohol-related road casualties.
In the present study we aim to set out the current size of the drink driving problem based on the official statistics on both road fatalities and serious road injuries. Furthermore, we want to get insight into the definitions and the recording methods used by countries to arrive at their official statistics. By reviewing registration methods we aim to get a good understanding of the quality of official statistics on alcohol-related fatalities and serious road injuries. This study also aims to get insight into the methods and procedures that countries use to improve the quality of their alcohol-related casualty statistics. Our findings will be used as a basis for recommendations on how to make high quality estimates of drink driving in official statistics.
Content of the report
Chapter 2 describes the research method used in this study. Chapter 3 presents the results of the survey regarding the respondents, the official statistics, the registration methods of alcohol-related casualties and the quality of the data. Chapter 4 provides an overview of methods that can be used to

12 − 1. INTRODUCTION
ALCOHOL-RELATED ROAD CASUALTIES IN OFFICIAL CRASH STATISTICS — © OECD/ITF 2017
adjust the official statistics of alcohol-related road casualties. Chapter 5 presents our conclusions and recommendations.

1. INTRODUCTION − 13
ALCOHOL-RELATED ROAD CASUALTIES IN OFFICIAL CRASH STATISTICS — © OECD/ITF 2017
References
Assum, T. and Sørensen, M. (2010), “Safety Performance Indicator for alcohol in road accidents -International comparison, validity and data quality”. Accident Analysis & Prevention, Vol. 42/2, pp. 595-603.
Blomberg, R.D., R.C. Peck, H. Moskowitz, M. Burns and D. Fiorentino (2005), Crash risk of alcohol involved driving: A case-control study. Stamford, Dunlap and Associates, Inc.
COWI, SWOV and ADV consultancy and research (2014), “Study on the prevention of drink driving by the use of alcohol interlock devices”. Rotterdam. Ecorys.
Derriks, H. and P. Mak (2007), Underreporting of Road Traffic Casualties. IRTAD special report, Organisation for Economic Cooperation and Development, International Transport Forum, Paris http://www.itf-oecd.org/sites/default/files/docs/repndl2007.pdf
ETSC (2010), “Road safety target in sight: making up for lost time; 4th road safety PIN report”. ETSC, Brussels.
Hels, T., I.M Bernhoft, A. Lyckegaard S. Houwing M. Hagenzieker, S.-A Legrand, C. Isalberti, T. Van der Linden, and A. Verstraete (2011), Risk of injury by driving with alcohol and other drugs DRUID Driving under the Influence of Drugs, Alcohol and Medicines, D2.3.5.
ITF (2012), Road Safety Annual Report 2011, OECD Publishing, Paris. DOI: http://dx.doi.org/10.1787/irtad-2011-en
ITF (2011). Reporting on Serious Road Traffic Casualties. Combining and using different data sources to improve understanding of non-fatal road traffic crashes. Organisation for Economic Cooperation and Development. Paris. International Transport Forum. Accessible at: http://www.itf-oecd.org/sites/default/files/docs/road-casualties-web.pdf
Keall, M., W. Frith, and T. Patterson (2004), “The influence of alcohol, age and number of passengers on the night-time rate of driver fatal injury in New Zealand”, Accident Analysis & Prevention, Vol. 36, pp. 49-61.
Gjerde H., T.R. Sousa, R. De Boni, A.S. Christophersen, R.P. Limberger, I. Zancanaro, E.L. Oiestad, P.T. Normann, J. Mørland, F. Pechansky (2014), “A comparison of random drug use by random motor vehicle drivers in Brazil and Norway”. The International Journal on Drug Policy, Vol. 25/3, pp. 393-400.
Gundy, C. M., and W.L.G. Verschuur (1986), “Police enforcement of drinking and driving laws: A field study of police decisions for requiring a roadside breath test”. In: Proceedings 10th International Conference on Alcohol, Drugs and Traffic Safety. Amsterdam, 9-12 September 1986. Exerpta Medica, International Congress series 721, Elsevier Science Publishers B.V. (Biomedical Division) pp. 417-420.
SafetyNet (2008), “Building the European Road Safety Observatory”. Deliverable 1.15. Final report on task 1.5, SafetyNet, 2008. http://ec.europa.eu/transport/wcm/road_safety/erso/safetynet/fixed/WP1/D1.15_Estimation_real_number_of_road_accident_casualties_final%20report_3.pdf .

14 − 1. INTRODUCTION
ALCOHOL-RELATED ROAD CASUALTIES IN OFFICIAL CRASH STATISTICS — © OECD/ITF 2017
World Health Organization (2013), Global Status Report on Road Safety 2013. World Health Organization, Geneva.
World Health Organization (2015), Global Status Report on Road Safety 2015. World Health Organization, Geneva.

2. RESEARCH METHOD − 15
ALCOHOL-RELATED ROAD CASUALTIES IN OFFICIAL CRASH STATISTICS — © OECD/ITF 2017
Chapter 2. Research method
To collect the data required for this study, a questionnaire was circulated to several countries, through their members in the IRTAD Group, the Ibero American Road Safety Observatory (OISEVI) and the International Center for Alcohol Policies (ICAP). This chapter describes the research method.

16 − 2. RESEARCH METHOD
ALCOHOL-RELATED ROAD CASUALTIES IN OFFICIAL CRASH STATISTICS — © OECD/ITF 2017
Description of the work
To collect all relevant data for the study we developed and distributed an online questionnaire using the online questionnaire application LimeSurvey (v2.05). Respondents could complete the questionnaire by following a web link. This open source program makes it possible to download the complete data file in Excel format. We therefore used Excel to analyse the data; this is discussed in Chapter 3.
Data collection and participants
The IRTAD database includes crash and casualty data, but no data about crash causation factors, including drink driving. With the help of the secretariats of IRTAD and OISEVI, 50 respondents were selected, based on membership in one of the two organisations. Both organisations include institutions which have a direct interest in road safety. For each country, we contacted one road safety expert with an invitation letter which contained a web link to the online questionnaire. The initial questionnaire was pre-tested with five road safety experts who did not respond to the final questionnaire. Based on their remarks some questions were added and some were reformulated.
The first group of respondents are IRTAD members whose responses were collected between March and June 2014. After approximately six weeks a reminder was sent to non-responders. The second and final reminder was sent one month after the first one.
The second group of respondents are members of OISEVI and are from Spanish speaking countries. Therefore the questionnaire was translated in Spanish with the help of the OISEVI secretariat. This second group of respondents was approached in mid-April 2014. Their responses were collected between mid-April and mid-June and a reminder was sent by the OISEVI secretariat after one month.
A third group of respondents consisted of representatives from six countries participating in a project of the International Center for Alcohol Policies (ICAP1). Two of these countries, Colombia and Mexico, are also member of the OISEVI group.
A total of 54 countries therefore received an invitation to participate.
Questionnaire
Our objective was to collect not only accurate national data on alcohol-related road casualties, but also to collect background information on national methods and procedures used to obtain national statistics. The questionnaire (Annex B) distinguishes four main topics:
• General background information on the respondent (see Section Description of respondents).
• Legislation on maximum authorised blood alcohol concentration (BAC), definitions of alcohol-related road casualties, and official casualty data (see Section Legislations, definitions and official statistics).
o Definitions used as a basis for the official figures on alcohol-related road fatalities and serious road injuries.
o Definitions of road fatalities and serious road injuries attributable to drink driving. o Unit of measurement for the legal limit of blood alcohol concentration. o Existence of differentiated legal limits for the general driving population and other driver
groups such as novice or professional drivers.

2. RESEARCH METHOD − 17
ALCOHOL-RELATED ROAD CASUALTIES IN OFFICIAL CRASH STATISTICS — © OECD/ITF 2017
o Changes in national legislation regarding drinking and driving in the period 2000 to 2010.
o Official statistics on the number of road fatalities and serious road injuries related to alcohol in 2000, 2005 and 2010 thus covering a time period of ten years. It was a predetermined choice not to ask for official numbers on more recent years since often these numbers are not yet (completely) available.
• Method of recording alcohol-related crashes by police and medical institutions (see Section Data collection methods and sources).
o Procedures used to produce police reports on road crashes. o Conditions and protocol for carrying out alcohol tests on the scene of crashes. o Conditions and protocol for carrying out alcohol test at hospitals. o Availability of standard tests. o Process for registering results of alcohol tests. o Linkage procedure to link hospital and police data.
• Quality of the data and the respondent’s expert estimate on alcohol-related road casualties (see
Chapter 3). o Existence of procedures to link and combine police data and hospital data on serious
road injuries to correct for underreporting. o Conditions for post-mortem testing. o Experts’ best estimate of the proportion of road traffic deaths and serious road injuries
attributable to drink driving. o Experts’ comments on differences between the reported official data and their personal
best estimate. o Drug related fatalities and injuries with a distinction between illicit and prescribed drugs.
The questionnaire mainly consists of closed questions, mostly with more than one possible answer.
In August 2014, six countries (Hungary, Iceland, Japan, Lithuania, Spain and Sweden) were again approached via e-mail for some additional follow-up questions regarding their responses. In December 2014, some more countries (Canada, France, Norway, the United Kingdom, the United States of America and Sweden) were approached via e-mail to inquire about additional methods used in these countries to improve data on road casualties related to alcohol.
In Autumn 2015, in response to the peer reviews, and in order to come to a more complete picture of the official numbers of alcohol-related fatalities and serious road injuries, additional information was asked for and received from Australia, Greece, Ireland, Italy, Jamaica, Sweden and the United States.
Note
1 Since 1-1-2015 the name of ICAP is changed into International Alliance for Responsible Drinking (IARD).


3. RESULTS OF THE SURVEY − 19
ALCOHOL-RELATED ROAD CASUALTIES IN OFFICIAL CRASH STATISTICS — © OECD/ITF 2017
Chapter 3. Results of the survey
This chapter presents the main results of the survey regarding the respondents, the definitions, official statistics, the registration methods of alcohol-related casualties and the quality of the data.

20 − 3. RESULTS OF THE SURVEY
ALCOHOL-RELATED ROAD CASUALTIES IN OFFICIAL CRASH STATISTICS — © OECD/ITF 2017
Description of respondents
First, this section presents the details of the respondents in the countries included in this study.
Table 3.1. Response of countries by organisation membership in percentage
Response No response Total
IRTAD (34) 34 63.0% 0 0.0% 63.0% OISEVI (16) 8 14.8% 8 14.8% 29.6% ICAP (4) 3 5.6% 1 1.9% 7.4%
Total 45 83.3% 9 16.7% 100%
Note: Colombia and Mexico are members of both OISEVI and ICAP. In this table they are included under OISEVI.
In total, 54 countries were approached to participate in this survey: 34 countries are members of IRTAD, 16 countries are members of OISEVI and 4 countries participate in a drink driving programme organised by ICAP. A total of 45 countries filled out the questionnaire. This results in a response rate of 83 %, with a 100% response rate from IRTAD countries.
Table 3.2. Organisation type of the respondents
Organisation Frequency Road Safety / Transport Research Institute (16) 35.6% Ministry (Transport/Infrastructure/Interior) (8) 17.8% National Road Safety Authority (10) 22.2% National Statistics Bureau (2) 4.4% National Police (2) 4.4% Other (University / Council / ICAP) (7) 15.6% Total (45) 100.0%
The country representatives are all road traffic (safety) experts. Almost 38% of the respondents
work for national research institutes, a quarter for the national road safety authority and approximately 20% for the Ministry of Transport. The majority of respondents are researchers or statisticians (44%) and managers or directors (36%).
Legislations, definitions and official statistics
Unit of measurement of blood alcohol concentration
Countries use various units of measurement for the blood alcohol concentration in their legislation on drink driving.

3. RESULTS OF THE SURVEY − 21
ALCOHOL-RELATED ROAD CASUALTIES IN OFFICIAL CRASH STATISTICS — © OECD/ITF 2017
Table 3.3. Unit of measurement
Unit Frequency
g/dl (6) 13.3%
Australia, Jamaica, Korea, Malaysia, Nigeria and the United States g/l (23)
51.1% Argentina, Austria, Cambodia, Chile, Colombia, Costa Rica, Ecuador, France, Greece, Hungary, Ireland, Israel, Italy, Japan, Lithuania, Luxemburg, Nicaragua, Peru, Poland, Portugal, Serbia, Spain and Sweden g/kg (3)
6.7% Germany, Slovenia and Switzerland Other (13)
28.9% Belgium (mg/UAL), Bolivia (mg/L), Canada (mg), Czech Republic (‰), Denmark (‰), Finland (mg/l), Great Britain (mg/100 ml), Guatemala (mg/ml), Iceland (‰), Netherlands (mg/ml), New Zealand (mg/100 ml), Norway (mg/UAL) and Russia (mg/UAL)
Total (45) 100.0%
More than half of the countries use gramme per litre as unit of measurement (51%) compared to g/dl (13%) and g/kg (6.7%). Thirteen countries use other units of measurement such as mg/ml, mg/l or mg/UAL (exhaled alveolar air). This variety should not have a negative effect on the comparability of official data on alcohol-related road casualties when definitions on road casualties are equal, as conversion factors can be applied to make comparison possible.
Legal limits of blood alcohol concentration
With regard to the legal limits of blood alcohol concentration (BAC), 43 countries (96%) have a legal alcohol limit. Bolivia and Guatemala are the only countries in this study without such a limit.
When converted in g/l, the highest BAC limit is 0.8 g/l and is found in Canada, Great Britain, Jamaica, Malaysia, New Zealand and the United States. It should be noted that provinces in Canada and states in the United States can set their own limits and that these legal limits may be lower than 0.8 g/l.
22 countries (49%) have a differentiated legal limit for young or novice drivers, 23 countries (53%) have a differentiated legal limit for professional drivers and 19 countries (42%) have differentiated legal limits for both young or novice drivers and professional drivers. The Czech Republic and Hungary have a legal limit of 0.0 g/l for all road users. See Table 3.4 for the legal BAC limits per driver group per country.

22 − 3. RESULTS OF THE SURVEY
ALCOHOL-RELATED ROAD CASUALTIES IN OFFICIAL CRASH STATISTICS — © OECD/ITF 2017
Table 3.4. Legal limits on blood alcohol concentration levels definition of an alcohol-related road fatality
Country General population
Young novice drivers
Professional drivers
Definition of alcohol-related road fatalitySafetyNet definition: “Any death occurring within 30 days as a result of a fatal crash in which any active participant was found with a BAC above the
legal limit” Argentina 0.5 g/l 0 g/l SafetyNet definition
Australia 0.5 g/l 0.2 g/l 0 g/l SafetyNet definition
Austria 0.5 g/l 0.1 g/l 0.1 g/l SafetyNet definition
Belgium 0.5 g/l 0.2 g/l Driver under the influence of alcohol and drivers who refuse to be tested. Drivers killed on the spot might not be tested
Bolivia Deaths occurring at the scene of road accident where with a BAC above the legal limit
Cambodia 0.5 g/l SafetyNet definition
Canada 0.8 g/l 0 g/l 0.8 g/l SafetyNet definition
Chile 0.3 g/l SafetyNet definition
Colombia 0.2 g/l No definition
Costa Rica 0.5 g/l 0.2 g/l 0.2 g/l Any death (driver, pedestrian or cyclist) occurred in a road accident with a BAC above the legal limit
Czech Republic 0 g/l SafetyNet definition
Denmark 0.5 g/l 0.5 g/l 0.5 g/l Any death occurring within 30 days as a result of a fatal road crash in which any motor vehicle driver was found with a blood alcohol level above the legal limit, or where the reporting officer suspected alcohol was a contributing factor
Ecuador 0.3 g/l 0.1 g/l SafetyNet definition
Finland 0.5 g/l SafetyNet definition
France 0.5 g/l SafetyNet definition
Germany 0.5 g/l 0 g/l SafetyNet definition
Great Britain 0.8 g/l SafetyNet definition
Greece 0.5 g/l 0.2 g/l 0.2 g/l SafetyNet definition
Guatemala No definition

23 − 3. RESULTS OF THE SURVEY
ALCOHOL-RELATED ROAD CASUALTIES IN OFFICIAL CRASH STATISTICS — © OECD/ITF 2017
Country General population
Young novice drivers
Professional drivers
Definition of alcohol-related road fatalitySafetyNet definition: “Any death occurring within 30 days as a result of a fatal crash in which any active participant was found with a BAC above the
legal limit”
Hungary 0.0 g/l Any death occurring within 30 days as a result of a fatal road crash in which at least one of the participants at fault was tested with a BAC above the legal limit (0.0 g/l)
Iceland 0.5 g/l SafetyNet definition
Ireland 0.5 g/l 0.2 g/l 0.2 g/l SafetyNet definition
Israel 0.5 g/l 0.1 g/l 0.1 g/l SafetyNet definition
Italy 0.5 g/l 0 g/l 0 g/l No definition. Has not published official statistics on alcohol-related road fatalities since 2009.
Jamaica 0.8 g/l 0.8 g/l 0.8 g/l SafetyNet definition
Japan 0.3g/l Only the number of fatal crashes due to drink driving regardless of legal limit is reported
Lithuania 0.4 g/l 0.2 g/l 0.2 g/l SafetyNet definition
Luxembourg 0.5 g/l 0.2 g/l 0.2 g/l SafetyNet definition
Malaysia 0.8 g/l SafetyNet definition
Netherlands 0.5 g/l 0.2 g/l SafetyNet definition
New Zealand 0.8 g/l 0 g/l Any death occurring within 30 days as a result of a fatal crash in which any active participant was found with a BAC above the legal limit or suspected to be under the influence of alcohol.
Nicaragua 0.5 g/l No definition
Nigeria 0.5 g/l 0.5 g/l Any death occurring as a result of a fatal crash which was found with a BAC above the legal limit
Norway 0.2 g/l SafetyNet definition
Peru 0.5 g/l Any death occurring as a result of a fatal crash in which the driver of a motor vehicle was found with a BAC above the legal limit
Poland 0.2 g/l Any death occurring within 30 days as a result of a fatal crash in which any driver/cyclist was found with a BAC above the legal limit
Portugal 0.5 g/l 0.2 g/l 0,2 g/l SafetyNet definition
Russia 0.35 g/l 0.35 g/l 0.35 g/l Any death occurring within 30 days as a result of a fatal road crash in which any active participating driver or pedestrian was found with a blood alcohol level above the legal limit
Serbia 0.3 g/l 0.0 g/l 0.0g/l SafetyNet definition
Korea 0.5 g/l SafetyNet definition
Slovenia 0.5 g/l 0 g/l 0 g/l Any death occurring within 30 days as a result of a fatal road crash in which at least one of the participants at fault was tested with a BAC above the legal limit.
24 − 3. RESULTS OF THE SURVEY
ALCOHOL-RELATED ROAD CASUALTIES IN OFFICIAL CRASH STATISTICS — © OECD/ITF 2017
Country General population
Young novice drivers
Professional drivers
Definition of alcohol-related road fatalitySafetyNet definition: “Any death occurring within 30 days as a result of a fatal crash in which any active participant was found with a BAC above the
legal limit”
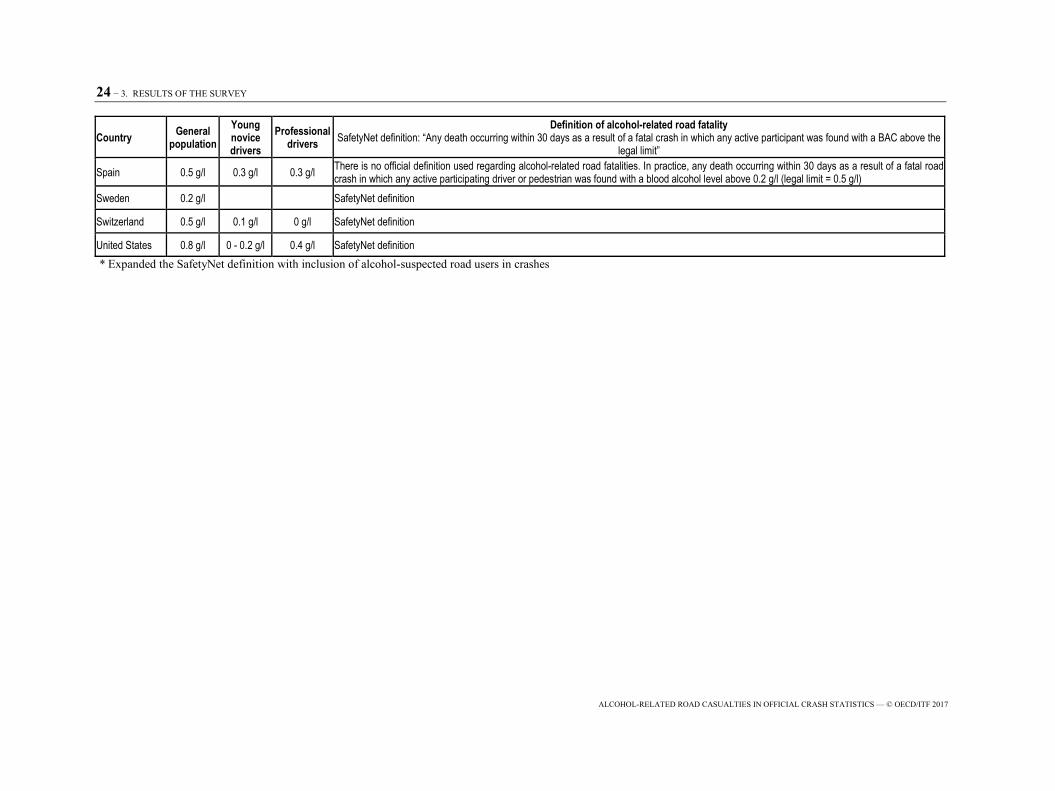
Spain 0.5 g/l 0.3 g/l 0.3 g/l There is no official definition used regarding alcohol-related road fatalities. In practice, any death occurring within 30 days as a result of a fatal road crash in which any active participating driver or pedestrian was found with a blood alcohol level above 0.2 g/l (legal limit = 0.5 g/l)
Sweden 0.2 g/l SafetyNet definition
Switzerland 0.5 g/l 0.1 g/l 0 g/l SafetyNet definition
United States 0.8 g/l 0 - 0.2 g/l 0.4 g/l SafetyNet definition * Expanded the SafetyNet definition with inclusion of alcohol-suspected road users in crashes

3. RESULTS OF THE SURVEY − 25
ALCOHOL-RELATED ROAD CASUALTIES IN OFFICIAL CRASH STATISTICS — © OECD/ITF 2017
It would be desirable to have harmonised definitions of alcohol-related road fatalities and serious road injuries to enable meaningful, reliable, international comparisons. However, countries have different BAC limits and define differently an alcohol-related crash, a young or novice driver, and professional drivers. Most countries define novice drivers as those who have had their licenses for less than two, three or five years. Young drivers are defined as younger than a certain age (17, 18, 20, 21 or 25 years old). Professional drivers are mainly truck, van, bus and taxi drivers; four countries (Israel, Luxembourg, Portugal and Spain) also include drivers of emergency vehicles in this group. National legislations for young novice drivers are obviously not harmonised, which complicates meaningful international comparisons. Therefore an algorithm should be developed to make these definitions between countries comparable.
All respondents were also asked for recent changes in legislation in their country. Since 2000, twenty-two of the countries that publish official data on alcohol-related road fatalities have carried out change in legislation regarding BAC limits. We found a tendency towards lower legal limits on alcohol for the general driving population (31%) as well as for the young novice drivers group and the professional drivers (17%). Canada, Germany, Italy, New Zealand, Serbia and Slovenia even have a zero-tolerance legislation (0.0 g/l) for young novice drivers (See Annex A Table A1 for detailed information on changes in national legislation).
However, despite the tendency towards lower legal limits on drink driving, the share of alcohol-related road fatalities has not shown a decrease (See the Official statistics on alcohol-related fatalities paragraph).
Definitions of road casualties
As shown in Table 3.4, several countries define an alcohol-related fatality as “any death occurring within 30 days as a result of a fatal road crash in which any active participant was found with a blood alcohol level above the legal limit.” This definition was also adopted and proposed by the SafetyNet project. The choice of 30 days is based on the international definition of a road crash fatality (UNECE 2009; ITF 2012; WHO, 2013). Table 3.5 shows the number of countries using the “SafetyNet definition”.
Table 3.5. Definition of an alcohol-related road fatality
Frequency
SafetyNet definition (28) 62.2%
Argentina, Australia, Austria, Cambodia, Canada, Chile, Czech Republic, Ecuador, Finland, France, Germany, Great Britain, Greece, Iceland, Ireland, Israel, Jamaica, Lithuania, Luxembourg, Malaysia, Netherlands, Norway, Portugal, Serbia, Korea, Sweden, Switzerland and the United States
Other definition (12) 26.7%Belgium, Bolivia, Costa Rica, Denmark, Hungary, Japan, New-Zealand, Nigeria, Peru, Poland, Russia and Slovenia
No definition at all (5) 11.1%Colombia, Guatemala, Italy, Nicaragua and Spain
Total (45) 100%
28 of the participating countries (62.2%) apply this definition and 5 countries do not have any definition on alcohol-related road fatalities. Denmark and New Zealand expand the commonly accepted definition with inclusion of road fatalities that are suspected to be alcohol-related. The United States is

26 − 3. RESULTS OF THE SURVEY
ALCOHOL-RELATED ROAD CASUALTIES IN OFFICIAL CRASH STATISTICS — © OECD/ITF 2017
the only country that does not use ‘any active participant above the legal limit’ in their definition, but only includes drivers and motorcyclist. This country does not have legal limits on alcohol for pedestrians and cyclists and the SafetyNet definition would therefore not apply for these groups (see also section 1 ‘Defining an alcohol-related crash’). Ten countries use other definitions which in most cases do not include a time period. Some definitions concern crashes but not fatalities, or are unclear regarding the category of road users included.
There is no generally accepted definition of alcohol-related serious road injuries. In our study we distinguish between a complete and an incomplete definition presented in Table 3.6.
Table 3.6. Definition used for alcohol-related serious road injuries
Frequency Complete definition 24.4% (11) Incomplete definition 11.1% (5) No definition 64.5% (29) Total 100% (45)
Note: A complete definition includes both a definition on the severity of the injury and a definition on the alcohol-related crash. An incomplete definition lacks one of these definitions.
Only eleven countries have a complete definition which includes both a definition on serious road
injuries as well as whether or not the crash is alcohol-related. However, these definitions still vary considerably. Five countries do not specify the severity of an injury (severe or slight) and the majority (29 countries) do not have any definition at all.
Official statistics on alcohol-related casualties
Alcohol-related fatalities
Tables 3.7 to 3.11 present the development in time of the official statistics on alcohol-related road fatalities for countries with the same current legal limit on blood alcohol concentration:
• Table 3.7 for countries with a legal limit of 0.0 g/l. • Table 3.8 for countries with a legal limit of 0.2 g/l. • Table 3.9 for countries with a legal limit between 0.3 and 0.4g/l. • Table 3.10 for countries with a legal limit of 0.5g /l. • Table 3.11 for countries with a legal limit of 0.8 g/l.
Data were collected for 2000, 2005 and 2010 thus covering a time period of ten years. It was a
predetermined choice not to ask for data on more recent years since often these numbers are not yet (completely) available.
Table 3.7. Share of alcohol-related road fatalities in countries with a present legal limit of 0.0 g/l from official statistics
Country 2000 2005 2010 Remark Czech Republic 8.5% 5.5% 13.5% -Hungary 10.7% 12.8% 8.2% -

3. RESULTS OF THE SURVEY − 27
ALCOHOL-RELATED ROAD CASUALTIES IN OFFICIAL CRASH STATISTICS — © OECD/ITF 2017
Table 3.8. Share of alcohol-related road fatalities in countries with a present legal limit of 0.2 g/l from official statistics
Country 2000 2005 2010 RemarkNorway 13.0% (0.5 g/l) 24.0% 21.0% In 2001 the legal limit reduced from 0.5 g/l to 0.2
g/l Poland 11.9% 9.7% 7.9% -Sweden 18.5%* -* The numbers in Sweden are based on a study on alcohol-related road fatalities above the legal limit between 2005 and 2013 (VTI, 2015).
Table 3.9. Share of alcohol-related road fatalities in countries with a present legal limit between 0.3 g/l and
0.4 g/l from official statistics
Country 2000 2005 2010 RemarkChile (0.3 g/l) 17.0% (0.5 g/l) 23.0% (0.5 g/l) 18.0% (0.5 g/l) In 2012 the legal limit reduced from 0.5 g/l to
0.3 g/l. Japan (0.3 g/l) 14.9% (0.5 g/l) 10.8% 6.2% In 2002 the legal limit reduced from 0.5 g/l to
0.3 g/l. Serbia (0.3 g/l) 4.3% (0.5 g/l) 4.9% (0.5 g/l) 5.5% In 2009 the legal limit reduced from 0.5 g/l to
0.3 g/l. Russia (0.35 g/l) 10.8% 7.4% (0.3 g/L) Up to 2010 the legal limit was 0.3 g/l. It was 0.0
g/l from 2010 to 2013. Since 2013, it is 0.35 g/l. Lithuania (0.4 g/l) 13.0% 14.0% 18.0% -
Table 3.10. Share of alcohol-related road fatalities in countries with a present legal limit of 0.5 g/l from
official statistics
Country 2000 2005 2010 RemarkAustralia 30%¹ -Austria 6.8% 7.3% 5.8% -Belgium 5.1% 3.5% 5.8% -Cambodia 15.4% -Costa Rica 17.3% (0.75 g/l) In 2012 the legal limit reduced from 0.75 g/l
to 0.5 g/l Denmark 18.0% 20.0% 22.0% -Finland 17.5% 22.2% -France 30.6% 28.8% 30.8% -Germany 13.6% 11.2% 9.4% -Greece² 39.4% 34.2% 33.7% -Iceland⁴ 15.5% 31.6% 37.5% -Ireland 36.5% (0.8 g/l)³ 28.3% (0.8 g/l) 15.5% (0.8 g/l) ⁵ In 2009 the legal limit reduced from 0.8 g/l
to 0.5 g/l Israel 1.9% 4.3% 3.7% -Italy 22.6%⁶ -Luxembourg 16% (0.8 g/l) 6% (0.8 g/l) 34.0% In 2007 the legal limit reduced from 0.8 g/l
to 0.5 g/l Netherlands 8.3% 8.3% 4.8% -Nicaragua 8.0% 7.0% 7.0% -Portugal 2.7% 4.7% 7.0% -Korea 11.9% 14.3% 14.2% -Slovenia 36.3% 19.8% 35.5% -Spain 36% (0.8 g/l) 34.1% 30.9%Switzerland 19.3% 19.3% 19.3% In 2005 the legal limit reduced from 0.8 g/l
to 0.5 g/l -Notes: ¹ The number of Australia is based on the National Road Safety Action Plan (2010).

28 − 3. RESULTS OF THE SURVEY
ALCOHOL-RELATED ROAD CASUALTIES IN OFFICIAL CRASH STATISTICS — © OECD/ITF 2017
² The numbers of Greece are based on ELSTAT and NTUA.
³ This number is based on the Population Health Directorate of the Health Service Executive (2006) and is the official proportion for the year 2003. ⁴ The shares of Iceland are based on very low numbers of fatalities: 2000 N=5, 2005 N=6 2010 N=3. ⁵This number is based on a report of the Research Department of the Road Safety Department (2011) and is the official proportion for the year 2007. ⁶ This number is based on the DRUID project on prevalence of alcohol and other psychoactive substances in drivers killed and injured (Isalberti et al., 2011).
Table 3.11. Share of alcohol-related road fatalities in countries with a present legal limit of 0.8 g/l From official statistics
Country 2000 2005 2010 RemarkCanada 30.2% 29.9% 33.6% -Great Britain 16.0% 17.0% 13.0% -Malaysia 1.3% 0.9% 5.0% -New Zealand 22.0% 26.0% 32.0% -United States of America
32.0% 31.0% 31.0% -
Note: Argentina, Bolivia, Ecuador, Guatemala, Nigeria and Peru did not provide data on alcohol-related road fatalities
Looking at the development over the years, 16 countries have an increased proportion of
alcohol-related fatalities. In 2010, the share of alcohol-related fatalities ranged from approximately 5% to 35% and in ten countries more than 30% of road fatalities were alcohol-related. Japan and Ireland are the only two countries with a substantial decrease in the proportion of alcohol-related fatalities between 2000 and 2010. In general, the share of alcohol-related fatalities has remained stable over the years. The weighted average in 2000 was 21.95% and in 2010 this remained on the same level with a weighted average of 21.80% (see Figure 3.1).
On the basis of an average share of 21.95% of alcohol-related fatalities, and taking into account the total number of road deaths of 1.25 million road fatalities worldwide (WHO, 2015), the alcohol-related road toll among fatally injured road users was around 273 000 persons in 2010.

3. RESULTS OF THE SURVEY − 29
ALCOHOL-RELATED ROAD CASUALTIES IN OFFICIAL CRASH STATISTICS — © OECD/ITF 2017
Figure 3.1. Share of alcohol-related road fatalities in 2000, 2005 and 2010 from official statistics
0.0%
5.0%
10.0%
15.0%
20.0%
25.0%
30.0%
35.0%
40.0%
45.0%

30 − 3. RESULTS OF THE SURVEY
ALCOHOL-RELATED ROAD CASUALTIES IN OFFICIAL CRASH STATISTICS — © OECD/ITF 2017
Alcohol-related serious injuries
26 of the respondent countries have official data on alcohol-related serious road injuries (see Table 3.12).
Table 3.12. Countries publishing official statistics on alcohol-related serious road injuries
Frequency
Official statistics 57.8% (26)
No official statistics 42.2% (19)
Total 100% (45)
Table 3.13 illustrates the evolution in time of the share of alcohol-related serious road injuries.

3. RESULTS OF THE SURVEY − 31
ALCOHOL-RELATED ROAD CASUALTIES IN OFFICIAL CRASH STATISTICS — © OECD/ITF 2017
Table 3.13. Share of alcohol-related serious road injuries 2000, 2005 and 2010 From official statistics
Note: Argentina, Bolivia, Cambodia, Colombia, Costa Rica, Ecuador, Finland, Guatemala, Ireland, Italy, Jamaica, Lithuania, Malaysia, Nigeria, Norway, Peru, Spain, Sweden and the USA did not provide numbers on alcohol-related serious injuries.
The average share (mean) remained quite stable between 2000 (12.3%) and 2010 (11.3%). The highest shares of alcohol-related serious road-injuries are found in New Zealand (23%) and Greece (23%) and the lowest share is reported in Japan (1.6%). Figure 3.2 summarises these figures for the years 2000, 2005 and 2010.
Country 2000 2005 2010
Australia 9.0%
Austria 8.3% 9.9% 8.2%
Belgium 8.6% 7.0% 11.0%
Canada 19.7% 17.7% 18.0%
Chile 13.0% 13.0% 15.0%
Czech Republic 15.0% 8.9% 11.1%
Denmark 15.0% 13.0% 13.0%
France 12.6% 15.1%
Germany 11.1% 10.4% 8.0%
Great Britain 7.0% 7.0% 5.0%
Greece 36.7% 20.6% 23.0%
Hungary 13.3% 14.0% 12.2%
Iceland 9.5% 3.1% 4.4%
Israel 1.8% 1.9% 2.8%
Japan 4.7% 2.7% 1.6%
Luxembourg 25.0% 23.0% 15.0%
Netherlands 9.3% 10.5% 8.7%
New Zealand 21.0% 20.0% 23.0%
Nicaragua 5.0% 7.0% 1.0%
Poland 11.5% 10.9% 9.3%
Portugal 4.6% 12.8% 17.3%
Serbia 5.3% 5.0% 9.3%
Russia 10.3% 6.8%
Korea 10.8% 13.5% 12.9%
Slovenia 21.0%
Switzerland 14.0% 12.9% 12.7%

32 − 3. RESULTS OF THE SURVEY
ALCOHOL-RELATED ROAD CASUALTIES IN OFFICIAL CRASH STATISTICS — © OECD/ITF 2017
Figure 3.2. Share of alcohol-related serious road injuries in 2000, 2005 and 2010 from official statistics
0.00%
5.00%
10.00%
15.00%
20.00%
25.00%
30.00%
35.00%
40.00%

3. RESULTS OF THE SURVEY − 33
ALCOHOL-RELATED ROAD CASUALTIES IN OFFICIAL CRASH STATISTICS — © OECD/ITF 2017
Data collection methods and sources
Source of data on alcohol-related road casualties
Similarly to the findings of the World Health Organization (Global Status Report on Road Safety, 2013), our survey revealed that the vast majority of countries (80%) use police records as their primary data source for statistics of alcohol-related fatalities (80%) and serious road injuries (87.5%). Only six countries (Cambodia, Iceland, Serbia, Russia, Sweden and the United States) make use of another data source in addition to the police records and base their official data on a combination of data sources.
Cambodia, Serbia and Russia base their official data on alcohol-related road fatalities and serious road injuries on both police and hospital data. Argentina bases its official data on alcohol-related road fatalities only on hospital records. Argentina does not have official data on serious road injuries. Cambodia, Russia, Poland and Serbia carry out standard testing when serious road injuries are admitted to the hospital. In Russia the results of the test are filed in the hospital records as well as in the police database but the indicator alcohol=yes does not imply that the BAC of the road user was above the legal limit. The United States and Sweden base their official data on alcohol-related road fatalities also on forensic records in addition to police records.
Conditions to perform alcohol tests
Table 3.14 summarises the results from the survey regarding conditions when the police carry out an alcohol test in the case of a road crash.
Table 3.14. Conditions to carry out an alcohol test
FrequencyIn all road crashes the police attend 22.2% (10)
Belgium, Bolivia, Cambodia, Czech Republic, Finland, Hungary, Jamaica, Portugal, Serbia and Sweden
In all road crashes the police attend and the physical state of the involved road users makes it possible to perform a test 2.2% (1)
Spain
In road crashes with (serious) injuries or fatalities 40.0% (18)
Argentina, Austria, Chile, Colombia, Costa Rica, Ecuador, France, Greece, Guatemala, Ireland, Israel, Luxembourg, Malaysia, New Zealand, Nicaragua, Peru, Poland and Switzerland
In road crashes where the police has suspicion of the presence of alcohol among the involved road users 22.2% (10)
Canada, Denmark, Germany, Great Britain, Iceland, Japan, Lithuania, Netherlands, Norway and Russia
Other 13.4% (6)Australia, Italy, Nigeria, Korea, Slovenia and the United States.
Total 100% (45)
In ten countries the police carry out alcohol tests in all the road crashes they attend. In Spain, the police carry out alcohol tests in all the road crashes they attend, but only when the physical state of the involved road users makes it possible to perform a test. In most countries (40%) the police only perform

34 – 3. RESULTS OF THE SURVEY
ALCOHOL-RELATED ROAD CASUALTIES IN OFFICIAL CRASH STATISTICS — © OECD/ITF 2017
alcohol tests in road crashes with (serious) injuries or fatalities. In ten countries, the suspicion of alcohol consumption among the involved road users is a condition for police officers to test for alcohol.
25 countries indicate that the main reason for the police not to carry out alcohol tests is when there is no suspicion of alcohol consumption among the involved road users (see Table 3.15).
Table 3.15. Reasons for the police not to carry out alcohol tests
Frequency
No suspicion of alcohol consumption 52.1% (25)
Argentina, Austria, Cambodia, Canada, Chile, Costa Rica, Denmark, Ecuador, Germany, Great Britain, Iceland, Italy, Jamaica, Japan, Lithuania, Luxembourg, Malaysia, Nicaragua, Norway, Peru, Russia, Slovenia, Korea, Sweden and Switzerland
When cause and/or guilt already evident 8.3% (4)Argentina, Cambodia, Great Britain and Guatemala
Impossible due to physical condition of the road user(s) 18.8% (9)
Czech Republic, France, Israel, Netherlands, New Zealand, Portugal, Serbia, Spain and United States.
Alcohol tests are always performed 10.4% (5)Bolivia, Finland, Greece, Hungary and Poland
Other reasons 10.4% (5)
Australia, Belgium, Colombia, Ireland and Nigeria
Total 100% (48*)
* Three countries (Argentina, Cambodia and Great Britain) declared no suspicion, as well as clarity of cause and guilt, as reasons not to perform alcohol tests.
A second reason not to perform alcohol tests on the involved road users is the police officers’ view on the cause of a crash or on the guilty party (Argentina, Cambodia, Great Britain and Guatemala). Another reason given is the impossibility of testing because of the physical conditions of the road users involved. Another five countries give other reasons such as a lack of good equipment or hit and run of the involved road users. Five countries indicate that there is no reason not to perform an alcohol test and that tests are always performed.
When the alcohol test cannot be carried out at the scene of the road crash, for example when the physical condition of the casualties does not permit it, 62% of the countries report that the alcohol test is performed at a later point in time, usually by a doctor in a medical institution (68%), or in a forensic institute (28%). However, in some countries (Argentina, Nigeria, Spain, Sweden and Switzerland) tests are not performed later. In some cases later testing is performed randomly (Belgium, Iceland, New Zealand and Norway), or may depend on the request of the state attorney (Austria), or conducted on suspicion of drink driving (Japan and Lithuania).
Quality of the data
This section presents the results of the survey regarding practice with linking different databases and the national legislations in relation with post-mortem testing.

3. RESULTS OF THE SURVEY − 35
ALCOHOL-RELATED ROAD CASUALTIES IN OFFICIAL CRASH STATISTICS — © OECD/ITF 2017
Data linking on alcohol-related crash data
Cambodia, Serbia and Russia report linking police data on alcohol-related serious road injuries with hospital data. Russia is the only country, however, where these two types of data are reported to be combined to correct for possible underreporting of alcohol use amongst serious road injuries. The United States and Sweden combine police records with forensic records (toxicology reports) and the United States, in addition, use a statistical method to estimate BAC levels when they are not reported in the crash record (Rubin et al., 1998).
Post-mortem testing
Another method to limit underreporting in the number of alcohol-related road fatalities is post-mortem testing. In 32 countries (71%) legislation allows post-mortem tests on alcohol consumption. In six countries (13%) (Argentina, Cambodia, Chili, Ecuador, Malaysia and Korea), the possibility of a post-mortem test depends on the permission of the relatives of the deceased person. In Austria, Belgium and Switzerland post-mortem tests are only carried out upon request of the prosecutor and in New Zealand the coroner may also take family concerns into account. In contrast with other countries the legal systems in the Netherlands and Nigeria prohibit post-mortem testing which is therefore never carried out.
Expert best estimate on the real number of alcohol-related road casualties
In addition to the official data on alcohol-related serious road injuries and fatalities the respondents were asked for their own (experts’) best estimate. 40% of the country respondents indicate that the official data on alcohol-related road casualties is the best estimate (see Table 3.16).
Table 3.16. Comparison of expert best estimate with official statistics on alcohol-related data on
alcohol-related road casualties
FrequencyOfficial number = best estimate 40.0% (18)
Australia, Austria, Cambodia, Canada, Chile, Costa Rica, Czech Republic, Finland, France, Germany, Hungary, New Zealand, Nicaragua, Norway, Poland, Slovenia, Switzerland and the United States
Official number < best estimate 11.2% (5)
Great Britain, The Netherlands, Serbia, Russia and Switzerland
Official number > best estimate 4.4% (2)Chile and Nicaragua No comparison possible 44.4% (20)
Argentina, Belgium, Colombia, Denmark, Ecuador, Greece, Guatemala, Iceland, Ireland, Israel, Italy, Jamaica, Japan, Lithuania, Luxembourg, Malaysia, Nigeria, Peru, Portugal and Spain
Total 100% (45)
Note: Countries with no comparison possible either do not have official statistics or a best estimate.
11% of the respondents make a best estimate which is higher than the official data of their country (Great Britain, The Netherlands, Serbia, Russia and Switzerland). Two respondents (4.4%) make a personal best estimate that is actually lower than the official figure on alcohol-related road casualties

36 – 3. RESULTS OF THE SURVEY
ALCOHOL-RELATED ROAD CASUALTIES IN OFFICIAL CRASH STATISTICS — © OECD/ITF 2017
(Chile and Nicaragua). Unfortunately, the largest share of respondents (44%) either does not have official data or a best estimate, therefore making comparison impossible. More respondents provide best estimates on fatalities than on serious injuries, which is in line with the general availability of data.
The highest expert estimates on the share of alcohol-related fatalities and injuries are found in the response of Argentina (20% for both fatalities and injuries), which is based on hospital data from the Secretariat for the Prevention of Drug Abuse and Drug Trafficking and in the response of Italy where the respondent-expert bases his estimate on the results of the European study DRUID (Driving Under the Influence of Drugs, Alcohol and Medicines). These 20% estimates are also made in Guatemala and Slovenia, without further explanation. The lowest expert estimates are found in Nicaragua (4.6%) and Russia (7.3%). Austria, Canada, the Czech Republic, France, Germany, Great Britain, Iceland and Spain also present their official data on alcohol-related serious road injuries as the best estimates. Austria, Germany and Spain state that even in case of underreporting, the official data provides the best possible estimate. Countries like Denmark, Greece, Hungary and Israel indicate that it is not possible to provide a best estimate because of the lack of additional (estimation) measures. Belgium states that if the testing rate is too low for an estimate, one should refrain from calculating shares of casualties as the data would be too misleading. Portugal indicates having an underreporting issue and is currently working on a better estimation method.
Eighteen respondents indicate that their best estimate is similar to the official statistics on alcohol-related road fatalities. Some of these respondents are aware of the shortcomings of their official method but also indicate that this is the best method available (Argentina, Austria, Costa Rica, Germany, Israel, Spain and Switzerland). The other respondents state that their country’s official data is rather reliable and therefore the best estimate (Cambodia, the Czech Republic, Hungary, Iceland, Lithuania, New Zealand and Poland) or due to additional measures and statistical analysis (Canada, France and the United States of America).
We also find best estimates that differ from the official data. Great Britain provides a provisional estimate of another year (2012; 17%) and the Netherlands refers to a study (Houwing et al., 2014) which makes a best estimate of 11-24% which is much higher than the official number of 4.8%. Norway (Unknown; 13%) and Sweden (Ahlner, Holmgren and Jones, 2014; 21%) refer to (in-depth) studies for their estimate.
Main results
The survey revealed that there are no harmonised definitions of alcohol-related road fatalities and serious road injuries between countries. Also some countries do not have definitions at all. The share of alcohol-related road fatalities and serious road injuries remained stable between 2000 and 2010. The share of alcohol-related fatalities is higher than that of serious injuries. Regarding legislation, there is a variety of units of measurement for blood alcohol concentration and various definitions on young novice and professional driver groups are found. Nearly all countries have legal limits on blood alcohol concentration and more than half of these countries also have legal limits for novice and professional drivers. Regarding maximum authorised blood alcohol concentration level, we found a trend towards stricter legislation on drink driving.
It can be concluded that, in line with previous research, the majority of the countries base their official statistics on police records. Unfortunately the police do not always perform alcohol tests for all road crashes. Important reasons to carry out a test are serious injuries or fatalities involved and suspicion of alcohol consumption among the road users. At the same time, lack of suspicion is the main reason for the police not to carry out an alcohol test. In more than one-third (38%) of the countries alcohol tests are

3. RESULTS OF THE SURVEY − 37
ALCOHOL-RELATED ROAD CASUALTIES IN OFFICIAL CRASH STATISTICS — © OECD/ITF 2017
not performed at a later point in time when testing at the scene of the crash is not possible. If tests are carried out later, this is done in most cases in a medical institution. However, in only four countries the official data is based on hospital data in addition to police records.
Countries participating in this study can be divided into four groups concerning the quality of the data on alcohol-related road casualties. Firstly, the largest share of countries either do not have official data or cannot provide a best estimate on drink driving casualties, therefore making a comparison between the best estimate of the expert and the official statistic not possible. The second largest group indicates that their official data is the best estimate the country expert can provide. One part of this group states that their country’s official data is quite reliable and thus the best estimate. The other part (third group) of the group indicates that the quality of the official data of their country is not as good as they want it to be, but do not have a better method available. The respondents of two countries actually indicate that their official data is an overestimate. The fourth group includes countries that indicate that their country’s official data is not reliable and actually lower than the expert’s best estimates.
38 – 3. RESULTS OF THE SURVEY
ALCOHOL-RELATED ROAD CASUALTIES IN OFFICIAL CRASH STATISTICS — © OECD/ITF 2017
References
Ahlner J., A. Holmgren and A.W. Jones (2014), “Prevalence of alcohol and other drugs and the concentrations in blood of drivers killed in road traffic crashes in Sweden”. Scandinavian Journal of Public Health, Vol. 2014/42, pp. 177-183.
Houwing, S., F.D. Bijleveld, J.J.F. Commandeur, L.Vissers (2014), Het werkelijke aandeel verkeersdoden als gevolg van alcohol. Aanpassing schattingsmethodiek. SWOV, Den Haag.
Isalberti, C., T. Van der Linden, S.-A. Legrand, A. Verstraete, I.M. Bernhoft, T. Hels, M.N. Olesen, S. Houwing, M. Houtenbos and R. Mathijssen (2011), “Prevalence of alcohol and other psychoactive substances in injured and killed drivers: DRUID Driving under the Influence of Drugs”, Alcohol and Medicines, D2.2.5, http://www.druid-project.eu/
ITF (2012), Road Safety Annual Report 2011, OECD Publishing, Paris. DOI: http://dx.doi.org/10.1787/irtad-2011-en
UNECE, Eurostat and ITF (2009), “Illustrated glossary for transport statistics”. UNECE, Geneva.
Road Safety Authority (2011), Review of Pre-crash Behaviour in Fatal Road Collisions. Report 1: Alcohol. Research Department RSA, Ballina.
Rubin, D.B., J.L. Schafer, R. Subramanian (1998), “Multiple imputation of missing blood alcohol concentration (BAC)”, in FARS: Report DTNH22-94-D-07005, National Highway Traffic Safety Administration, Department of Transportation.
SafetyNet (2008), Building the European Road Safety Observatory. Deliverable 1.15. Final report on task 1.5. SafetyNet; 2008.Accessible at: http://ec.europa.eu/transport/wcm/road_safety/erso/safetynet/fixed/WP1/D1.15_Estimation_real_number_of_road_accident_casualties_final%20report_3.pdf (accessed 6 April 2010).
World Health Organization (2013), Global Status Report on Road Safety 2013, World Health Organization, Geneva.
World Health Organization (2015), Global Status Report on Road Safety 2015, World Health Organization, Geneva.

4. METHODS FOR ADJUSTING THE OFFICIAL NUMBER OF ALCOHOL-RELATED ROAD CASUALTIES FOR UNDERREPORTING − 39
ALCOHOL-RELATED ROAD CASUALTIES IN OFFICIAL CRASH STATISTICS — © OECD/ITF 2017
Chapter 4. Methods for adjusting the official number of alcohol-related road casualties for underreporting
As described in Chapter 1, underreporting is a serious issue in recording the numbers of drink driving fatalities and seriously injuries. In a recent study (COWI et al., 2014) the share of drink driving fatalities in the EU was estimated between 20% and 28%, whereas the European average based on the official recordings was 12.9%. Some countries use methods to overcome underreporting. This chapter provides a short overview of methods that can be used for adjusting the official number on alcohol-related fatalities and alcohol-related serious injuries.

40 − 4. METHODS FOR ADJUSTING THE OFFICIAL NUMBER OF ALCOHOL-RELATED ROAD CASUALTIES FOR UNDERREPORTING
ALCOHOL-RELATED ROAD CASUALTIES IN OFFICIAL CRASH STATISTICS — © OECD/ITF 2017
Methods for adjusting the official number of alcohol-related road fatalities
Some countries test, on a systematic basis, road fatalities for alcohol consumption. This is mainly done by post-mortem research. Information on the number of alcohol-related fatalities is generally collected by combining the results of these post-mortem tests by coroners with police records. However, in some countries, post-mortem test is not possible or not conducted in a systematic manner (see Section Quality of the data). Based on our research we have identified some methods to improve estimates of alcohol-related road casualties at a national level.
The “gold standard” is a systematic alcohol testing of all active road users involved in a fatal crash, whether they are killed or not. If this is not possible, it is recommended to conduct, on a systematic basis, post-mortem tests on killed road users. In practice, this is not always possible, as some casualties may die several hours or days after the crash; in that case post-mortem alcohol testing will not provide usable data.
To make a better estimate of alcohol-related road fatalities, it is recommended to use a strict quality control procedure for recording fatal crashes. This is the case for instance in France (French Road Safety Observatory ONISR, 2012), where the quality and the completeness of the registration of crash records are verified. Feedback of the results (from those who carry out registration “on the field” and produce police reports) is one of the components of this quality improving procedure. In France, this procedure concluded that BAC tests are conducted in approximately 80% of the fatal crashes that are registered in the crash database; it is assumed that 80% is representative for all crashes, including those that have not been registered. In Ireland a better estimate of the proportion of alcohol-related fatalities is made through the use of witness statements and the opinion of the police officer at the scene to indicate if alcohol was a contributory factor (RSA, 2016). This is done in case it was not possible to test the suspected driver for alcohol because of reasons such as the driver leaving the scene.
If the share of tested road users is considered too low, it is recommended to correct the number of alcohol-related road fatalities using imputation techniques. These techniques are for example used in the United States (Klein, 1986; Rubin, Schafer & Subramanian, 1998) and in the United Kingdom (DfT, 1989). Although the methods of imputation and the underlying assumptions differ strongly between these two countries, the principle is the same and can be described as a “matching technique”: analyse the BAC distribution by different variables for data that is available (for example age, gender, date/time of a crash) and use this information to estimate the BAC distribution for a whole dataset.
An alternative is to collect representative data on BAC-levels in traffic as a safety performance indicator. By combining the trend on alcohol use in traffic with information on the risks of fatal injury for different BAC-levels, estimates could be made for the total share of drink driving fatalities.
If no information is available on BAC-levels of road fatalities, but information is available for seriously injured road users, the development for alcohol use among seriously injured could be used for estimating the alcohol-related road toll among fatally injured road users. In case information on seriously injured road users is only available for a limited number of years, additional information on the development of drink driving among non-injured drivers could be used to provide an estimate. This procedure is performed in the Netherlands (Houwing et al., 2014). This estimate will not give a “measured” result but an indication about developments in time based on alcohol use for different BAC-levels. The assumption here is that the trend lines for alcohol fatalities, alcohol injuries and non-injured drivers who are positive for alcohol have the same shape. In other words, the alcohol-related risk for different BAC-categories does not change over the years.
4. METHODS FOR ADJUSTING THE OFFICIAL NUMBER OF ALCOHOL-RELATED ROAD CASUALTIES FOR UNDERREPORTING − 41
ALCOHOL-RELATED ROAD CASUALTIES IN OFFICIAL CRASH STATISTICS — © OECD/ITF 2017
Methods for adjusting the official number of alcohol-related serious road injuries
Twenty-six countries (60%) publish official data on alcohol-related serious injuries. This information is very important for policy making, especially in countries where alcohol testing on road casualties is not carried out systematically, or cannot be carried out due to legal constraints. However, the problem with the use of serious injury as a measure is that in most countries underreporting of serious injury is much higher than that of fatal injury. This issue of underreporting is even more considerable when we take into account that the BAC is not routinely measured in all recorded crashes. In this study we find that in some countries the police can have several reasons not to perform alcohol tests (see Section Data collection methods and sources and Table 3.12).
As for road fatalities, the “gold standard” for serious injury crashes is that all active road users in a serious injury crash are tested for alcohol. If this is not possible, we recommend that all seriously injured road users be systematically tested for alcohol consumption to establish their BAC-level when they enter the emergency room of the hospital. However, there may be legal and medically ethical restrictions in some countries to carry out these tests.
Another option is to conduct in-depth studies in hospitals to get more information on the share of alcohol-related traffic injuries and the development over time. Such studies were conducted in several European countries within the European DRUID project (Isalberti et al., 2011) which found that between 16% (in Lithuania) and 38% (in Belgium) of road traffic serious injuries were alcohol-related (BAC above 0.5 g/l).
If the possibilities for conducting hospital studies are limited, an alternative is to collect representative data on alcohol consumption in traffic as a safety performance indicator. By combining the trend of alcohol use in traffic with information on the risks of serious injury for different BAC levels, estimates could be made for the total share of drink driving injuries. However, it is recommended to include one or more hospital studies in the method for estimating the drink driving problem to validate the results of the estimate and correct the method where necessary. This is currently performed in the Dutch method (Houwing et al., 2014).
If no information is available on alcohol consumption among serious road injuries, but information is available for fatal casualties, the trend for fatal injuries could be used for estimating the alcohol-related road toll among seriously injured road users. This procedure is performed in the United Kingdom.
In Canada the trend of drink driving injuries is based on a surrogate measure (Traffic Injury Research Foundation of Canada, 2010). For serious injury crashes, information on alcohol use is not always available from police reports in Canada. To overcome this problem, the following surrogate measure is used: a driver is identified as having been involved in an alcohol-related serious injury crash if the crash, in which someone was seriously injured, was a single vehicle crash, occurred at night between 9:00 pm and 6:00 am, or if, in the case of a non-single-vehicle-night time serious injury crash, the police reported alcohol involvement – i.e., they noted that at least one of the involved drivers in a crash had a BAC above the legal limit.
Surrogate measures have been shown to correlate strongly with more objective measures of the alcohol-crash problem and provide a reasonably reliable estimate of developments in alcohol-related serious injury crashes. However, as a single estimate they seem to under-represent the magnitude of the problem, since not all drinking drivers are identified (Mayhew et al., 1997).

42 − 4. METHODS FOR ADJUSTING THE OFFICIAL NUMBER OF ALCOHOL-RELATED ROAD CASUALTIES FOR UNDERREPORTING
ALCOHOL-RELATED ROAD CASUALTIES IN OFFICIAL CRASH STATISTICS — © OECD/ITF 2017
References
Department for Transport (1989) Road Accidents Great Britain (RAGB). UK Department for Transport, London.
French Road Safety Observatory ONISR (2012), Road safety in France; 2012 annual report. French Road Safety Observatory (ONISR), Paris.
Houwing, S., F.D. Bijleveld, J.J.F. Commandeur, L.Vissers (2014), Het werkelijke aandeel verkeersdoden als gevolg van alcohol. Aanpassing schattingsmethodiek. SWOV, Den Haag.
Isalberti, C., T. Van der Linden, S.-A. Legrand, A. Verstraete, I.M. Bernhoft, T. Hels, M.N. Olesen, S. Houwing, M. Houtenbos and R. Mathijssen (2011), “Prevalence of alcohol and other psychoactive substances in injured and killed drivers: DRUID Driving under the Influence of Drugs”, Alcohol and Medicines, D2.2.5, http://www.druid-project.eu/
Klein, T.M. (1986). A method for estimating posterior BAC distributions for persons involved in fatal traffic accidents. Report DOT-HS-807-094, National Highway Traffic Safety Administration, Department of Transportation.
Mayhew, D.R., D.J. Beirness, and H.M. Simpson (1997), “Indicators of the Alcohol-Crash Problem”. Ottawa, Ontario: Transport Canada, Road Safety and Motor Vehicle Regulation.
Rubin, D.B., Schafer, J.L. and Subramanian, R. (1998). Multiple Imputation of Missing Blood Alcohol Concentration (BAC) Values in FARS. Report DOT-HS 808-816, National Highway Traffic Safety Administration, Department of Transportation.
Road Safety Authority. (2016). Fatal Collisions 2008- 2012. Alcohol as a factor. RSA, Dublin.
Traffic Injury Research Foundation of Canada (2013), Alcohol-crash problem in Canada: 2010. Canadian Council of Motor Transport Administrators, Ottawa, Ontario.
5. CONCLUSIONS AND RECOMMENDATIONS − 43
ALCOHOL-RELATED ROAD CASUALTIES IN OFFICIAL CRASH STATISTICS — © OECD/ITF 2017
Chapter 5. Conclusions and recommendations
This chapter summarises the results of this study, highlighting the number of alcohol-related road casualties and the influence of underreporting on these numbers. This study was conducted to get further and improved insight in reporting procedures and to develop a basis for well-founded proposals on how to arrive at high quality estimates of alcohol-related fatalities and serious injuries.

44 − 5. CONCLUSIONS AND RECOMMENDATIONS
ALCOHOL-RELATED ROAD CASUALTIES IN OFFICIAL CRASH STATISTICS — © OECD/ITF 2017
Conclusions
Drink driving is widely recognised as an important factor of the 1.25 million people dying in road crashes worldwide every year. Drink driving increases the risk of road traffic crashes, as well as the risk of (fatal) injured. Due to underreporting, the real numbers of alcohol-related road casualties are higher than those in the official statistics. This study was conducted to get further and improved insight in reporting procedures and to develop a basis for well-founded proposals on how to arrive at high quality estimates of alcohol-related road casualties (fatalities and serious injuries).
Previous research (e.g. WHO, 2013) found that the proportion of alcohol-related road fatalities varies greatly (between 2% and 38%) among countries. This is confirmed in this study with a proportion of officially reported alcohol-related fatalities ranging from 5% to 35%.
Based on official statistics of countries that responded to our survey, more than 20% of all fatalities (weighted average 21.8%) are alcohol-related. This proportion remains constant over the years 2000-2010. If we accept this proportion as a good estimate for all countries in the world and we keep in mind the 1.25 million road fatalities worldwide, the alcohol-related road toll among fatally injured road users is around 273 000 people every year. However, this study concludes that this official number is an underestimate because numbers in official statistics are affected by underreporting of alcohol-related crashes and casualties. Moreover, the proportion of 21.8% is only drivers/riders related and does not include pedestrian- and cyclist fatalities that were alcohol-related and above the legal limit because those are not recorded due to lack of legal limits on BAC for these groups. If we assume that the estimate of 25% on alcohol-related road fatalities assessed in European countries (COWI et al., 2014) is a good estimate for the world, the alcohol-related road toll should be higher and closer to 313 000 deaths every year.
However, good estimates of the real number of alcohol-related fatalities per country are often not available in official statistics and moreover, it is expected that underreporting on this specific item will differ between countries. As a consequence, the difference between the reported official numbers and the estimated real numbers of alcohol-related fatalities per country are still unknown, which complicates meaningful international comparisons.
To gain good insight into the real number of alcohol-related casualties and to understand the (big) differences between countries, as reflected in official statistics, we reviewed prevailing legislations and definitions on alcohol-related road casualties and we studied the methods of recording the actual numbers of fatalities and serious road injuries. We also reviewed the quality of the data in relation to the issue of underreporting.
Similar to previous studies (COWI et al., 2014; ITF, 2011; Assum and Sørensen, 2010; ETSC, 2010; Derriks and Mak, 2007) the present study also identified underreporting as a major problem in determining the correct number of alcohol-related road casualties. The majority of countries make use of recording methods based on police registration only. This study revealed that the police do not carry out alcohol tests at every road crash. Therefore not all alcohol-related road casualties are recorded and official statistics publish underreported figures, which means that in reality more people are killed and injured in alcohol-related crashes. Our results indicate that lack of suspicion and assumed clarity on crash causation and guilt, as expressed by individual police officers, are the main reasons for police not to perform blood tests on the road users involved in the crash. Furthermore, previous studies (ITF, 2011; Derriks and Mak, 2007) already suggested that the determination of the “real” number of casualties will be more reliable if more than one data source is used, and records from different (independent) data sources are combined and tested against each other. Unfortunately, in this study, only a rather small

5. CONCLUSIONS AND RECOMMENDATIONS − 45
ALCOHOL-RELATED ROAD CASUALTIES IN OFFICIAL CRASH STATISTICS — © OECD/ITF 2017
number of countries use more than one data source for the recording of alcohol-related serious road injuries and fatalities. The vast majority of countries base their official data upon one data source only (police records), for which this study found evident shortcomings. These findings imply a negative influence on the reliability and the accuracy of the official data regarding alcohol-related road casualties and leads to an underestimation of this number.
Nearly all countries introduced legal BAC limits for the general driving population; these limits range from 0.0 g/l to 0.8 g/l. Furthermore, one can observe a tendency towards stricter legislation (not so much in lowering general limits but more often in setting specific lower legal limits for novice drivers and professional drivers). It was not the aim of this study to assess the safety impacts of these changes in legal limits.
The definitions used by countries regarding alcohol-related casualties differ substantially. This implies that the ways the official numbers of alcohol-related road casualties are determined differ between countries and therefore complicate the comparability between countries.
Nearly all countries (96%) legally allow post-mortem testing on alcohol. However, it is not always the case that post-mortem tests are actually performed when countries have made this legally possible. Several reasons are given: in some countries permission of the relatives is necessary or post-mortem tests can only be carried out upon request of the prosecution.
The results of this study show a couple of inadequacies in reporting systems on alcohol-related road crashes and, consequently, in the official data on alcohol-related serious road injuries and fatalities. Due to a lack of common legislation on drinking and driving and of a common definition on an alcohol-related road fatality or serious injury, a meaningful comparison between countries is very challenging. Furthermore, the shortcomings in police reporting on alcohol involvement in road crashes (and the failure to use more than one data source) suggest that the current official data on alcohol-related road casualties are an underestimate of the real numbers. It is not possible to make a reliable estimate of these “real numbers” of alcohol-related casualties with the findings of this research in hand. However, the figure of 21.8% of alcohol-related fatalities found in this study is surely too low. This is in line with earlier research on this topic. In other words, it is reasonable to estimate that more than 273 000 are killed every year in the world in an alcohol-related crash.
Recommendations
Underreporting of road crashes in general and of alcohol-related crashes in particular is an important issue. In order to get more reliable and comparable data on alcohol-related serious road injuries and fatalities the following elements are of great importance.
Firstly, underreporting must be identified, recognised and limited as much as possible Therefore the registration rate for alcohol-related fatalities and serious road injuries should be maximised. To achieve this, we recommend that the police force carry out systematic and 100% alcohol testing of all road users actively involved in serious road crashes. Procedures and methods to check for drinking and driving requires knowledge, training and good technical devices, but these are not considered to be a main hurdle for achieving improvements.
We recommend that the police report on all serious road crashes (all fatal crashes and all crashes with serious injuries) and systematically include results of alcohol consumption tests. Furthermore, we recommend conducting additional investigation to assess underreporting and, when necessary, to apply corrections factors to estimate “real numbers”. If this is not a realistic option, it is recommended to

46 − 5. CONCLUSIONS AND RECOMMENDATIONS
ALCOHOL-RELATED ROAD CASUALTIES IN OFFICIAL CRASH STATISTICS — © OECD/ITF 2017
estimate the number of alcohol-related road fatalities by using additional statistical analysis methods. This study presents several examples from different countries on how this could be done. We do not recommend applying a “harmonised” method worldwide, because there are several good methods and the chosen methods should fit with the prevailing legal systems and data collection systems.
To improve the comparability of official statistics on alcohol-related crashes, we recommend harmonising the definitions of alcohol-related road casualties. It is recommended to define a road alcohol fatality as follows: any death occurring within 30 days as a result of a fatal road crash in which any active participant is found with a blood alcohol level above the legal limit.
Regarding serious injuries, and based on previous IRTAD work, we recommend using the MAIS3+ (Maximum Abbreviated Injury Scale) for the definition of a serious injury and therefore to define an alcohol-related serious road injury as follows: any serious injury defined as MAIS3+ as a result of a road crash in which any active participant was found with a blood alcohol level above the legal limit.
In order to make sure the recommended definitions apply for all road users involved in alcohol-related road crashes, (i.e. ‘any active participant with a blood alcohol level above the legal limit’) it is recommended to study how to measure alcohol-related road crashes involving pedestrians and cyclists. If not, these vulnerable road user groups will not be recorded as an alcohol-related road casualty because of the lack of a legal limit, contributing (highly) to the issue of underreporting. Future research should include practical issues such as enforcement. Future work should also study which legal limits on blood alcohol concentration should be applied for these groups. Finally, the effects of a more integral and social approach on alcohol-abuse and for example attractive alternate travel modes such as affordable public transport is to be included in these studies.
We recommend applying adequate conversion factors (or algorithms) in case of different BAC legal limits that would allow meaningful international comparisons. This should be carried out in any case: if countries introduce legal limits for pedestrians and cyclists, but also when countries do not (yet) comply with the recommended above definitions.

5. CONCLUSIONS AND RECOMMENDATIONS − 47
ALCOHOL-RELATED ROAD CASUALTIES IN OFFICIAL CRASH STATISTICS — © OECD/ITF 2017
References
Assum, T. and Sørensen, M. (2010), “Safety Performance Indicator for alcohol in road accidents—International comparison, validity and data quality”. Accident Analysis & Prevention, Vol. 42/2, pp. 595-603.
COWI, SWOV and ADV consultancy and research (2014), “Study on the prevention of drink driving by the use of alcohol interlock devices”. Rotterdam. Ecorys.
Derriks, H. and P. Mak (2007), Underreporting of Road Traffic Casualties. Organisation for Economic Cooperation and Development. IRTAD. International Transport Forum, Paris. http://www.who.int/roadsafety/publications/irtad_underreporting.pdf.
ETSC (2012), “A challenging start towards the EU 2020 road safety target; 6th road safety PIN report”. ETSC, Brussels.
ETSC (2010), “Road safety target in sight: making up for lost time; 4th road safety PIN report”. ETSC, Brussels.
ITF (2012), Road Safety Annual Report 2011, OECD Publishing, Paris. DOI: http://dx.doi.org/10.1787/irtad-2011-en
ITF (2011). Reporting on Serious Road Traffic Casualties. Combining and using different data sources to improve understanding of non-fatal road traffic crashes. Accessible at: http://www.itf-oecd.org/sites/default/files/docs/road-casualties-web.pdf
World Health Organization (2013), Global Status Report on Road Safety 2013, World Health Organization, Geneva.

48 − ANNEX A CHANGES IN LEGISLATION ON BLOOD ALCOHOL CONCENTRATION
ALCOHOL-RELATED ROAD CASUALTIES IN OFFICIAL CRASH STATISTICS — © OECD/ITF 2017
Annex A. Changes in legislation on blood alcohol concentration

ANNEX A. CHANGES IN LEGISLATION ON BLOOD ALCOHOL CONCENTRATION − 49
ALCOHOL-RELATED ROAD CASUALITIES IN OFFICIAL CRASH STATISTICS — © OECD/ITF 2016
Table A1. Changes in legislation on blood alcohol concentration specified per country; survey responded by country
Country Change in legislation
Argentina Legal limit on BAC changed.
Australia Varies by jurisdiction
Belgium From 0.5 to 0.2 g/l for professional drivers
Bolivia 2012: 0.5 g/l
Canada Changes in the criminal code: increased fines, limited evidence to the contrary defences, Drug Recognition Evaluators for the police demand for blood sample mandatory. BC, Alberta and Ontario have strengthened their administrative programs; vehicle impound, higher fines, interlock for repeat offenders.
Chile 2012: 0.5 to 0.3 g/l. BAC between 0.3 and 0.8 g/l is illegal. Longer suspension of driving license when above 0.8 g/l.
Colombia
2012: 0.4 g/l to 0.2 g/l. Penalties were increased, including suspension of the driver’s license and higher fines.
2013: New law for driving under the influence of alcohol or other psychoactive substances: 1. Punitive aggravation for manslaughter 2. Increased penalties for drunk drivers:
• between 0.2 g/l and 0.39 g/l: 1 year suspension of the license, fine (USD 943.6), 20 hours of community service and vehicle immobilization for one day
• > 1.5 g/l): seizure driving license, 90 hours of community service, fine (USD 15 140), vehicle immobilization for 20 business days.
Costa Rica 2008: New limits of 0.75 g/l. 2012: 0.5 g/l for professional and novice drivers
Ecuador Law of Land Transport, Traffic and Road Safety was reformed, with more stringent controls.
France 2003: 6 points between 0.5 and 0.8g/l 2004: 0.2g/l for bus and coach drivers
Germany 2007: 0.0 g/l for novice drivers
Guatemala 2001: Reform of Article 157 of the penal code numeral 1 prescribed an offense against traffic safety, driving under influence of alcohol, drugs and other psychotropic medication. 2006: Municipal Agreement COM-016-06 Guatemala City where in drivers of urban and suburban public transport are banned from passing in the metropolitan jurisdiction.
Ireland Since 2010, the maximum authorised BAC level is 0.5 g/l (0.2 g/l for young or novice drivers and professional drivers). It was 0.8 g/l until 2009. Israel Zero tolerance for young drivers and professional drivers.

50 − ANNEX A - CHANGES IN LEGISLATION ON BLOOD ALCOHOL CONCENTRATION
ALCOHOL-RELATED ROAD CASUALTIES IN OFFICIAL CRASH STATISTICS — © OECD/ITF 2017
Country Change in legislation
Italy
2001: Ban on the sale of spirits at the counter in the service areas on motorways from 10 p.m. to 6 a.m. 2002: Redefinition of BAC limits in the establishment of driving under the influence (0.5 g / l). 2005: Revocation of license for those who drive with a BAC above 0.3 g/l causing a fatal crash. Changes article. 186 in the area of driving under the influence of alcohol. 2009: The period of suspension of the driving license is doubled for drivers found with a BAC above 1.5 g/l. 2010: Driving with a BAC of up to 0.8 g/l, for any driver, it is no more a crime but an administrative offense. 2010: 0.0 g/l for novice drivers and professional drivers.
Japan Road traffic law was revised between 2000 and 2010, which contains tighter regulations and stricter penalties targeting drunk driving.
2002: Legal BAC limit was reduced from 0.5 g/l to 0.3g/l. Lithuania Lower BAC limit for professional and novice drivers.
Luxembourg 2007: BAC limit was reduced from 0.8 g/l to 0.5 g/l.
Netherlands 1-1-2006: 0.2 g/l for novice drivers (was 0.5 g/l).1-10-2008 LEMA education for alcohol offenders. 1-12-2010 introduction of Alcolock for repeated offenders.
New Zealand 2011: 0.3 g/l for young drivers.2012: 0.0 g/l for repeated offenders.
Nicaragua
Qualify alcohol concentration levels in the blood: Light drunkenness: Between 0.5 g/l and 1g/l. Drunkenness: Between 1 g/l and 2 g/l. Extreme drunkenness: More than 2 g/l.
Norway 2001: BAC limit was reduced from 0.5 g/l to 0.2 g/l.
Peru
Article 36, paragraphs 4), 6) and 7): imprisonment: > 4 years and < 8 years. if people die by using a motor vehicle or firearm, or people die because of the influence of synthetic drugs, narcotics, psychotropic substances, or presence of proportion alcohol in blood.
The limit is 0.5 g/l for the general population, 0.25 g/l private transport, public transport or cargo.
Portugal 2013: 0.2 g/l for novice drivers and professional drivers.
Serbia 2009: New traffic safety law: BAC limit was reduced from 0.50 mg/ml to 0.30 mg/ml.
Russia 2007-2010 – 0.15 mg/l of exhaled air or 0.3 g/l of blood.2010-2013 – 0 mg/l. July 2013, - 0.16 mg /l of exhaled air or 0.35 g/l of blood.
Switzerland 2005: BAC limit was reduced from 0.8 g/l to 0.5 g/l.
2014: 0.1 g/l for young and professional drivers.

ANNEX B - QUESTIONNAIRE − 51
ALCOHOL-RELATED ROAD CASUALITIES IN OFFICIAL CRASH STATISTICS — © OECD/ITF 2016
Annex B. Questionnaire
The detection and recording of road fatalities and serious injuries related to drink driving. Country:
Respondent’s information
Name:
Position:
Institution:
E-mail address:
Q1 In which international organization on road safety does your country take part?
o International Traffic Safety Data and Analysis Group / IRTAD o Ibero-American Road Safety Observatory (OISEVI) o Other (please specify) …………………………………………………………………………… o None
Part 1: Definitions and numbers Q2 What is the unit of measurement used for the legal limit on BAC?
o g/dl o g/L o g/kg o Other (please specify) ……………………………………………………………………………
Q3 What is the legal limit on maximum Blood Alcohol Concentration (BAC) for the following groups of
drivers? General driving population: …………………………… Young or novice drivers: ……………………….……… Professional or commercial drivers: …………………… Other (please specify): …………………… ………………………………………..……………
Q4 How are young or novice drivers defined? ................................................................................................................................................ ................................................................................................................................................ ................................................................................................................................................

52 − ANNEX B - QUESTIONNAIRE
ALCOHOL-RELATED ROAD CASUALTIES IN OFFICIAL CRASH STATISTICS — © OECD/ITF 2017
Q5 Which of the drivers below are defined as professional drivers?
o Truck drivers o Van drivers o Bus drivers o Taxi drivers o All of the above o Other (please specify) ……………………………………………………………………………
Q6: Did any change occur in the legislation regarding the legal BAC limit(s) since the year 2000?
o Yes (please specify) ………………………………………………………………………………. o No
Q7 What is the definition used in the official recording of road fatalities attributable to drink driving
(above the legal limit)? o SafetyNet definition (Any death occurring within 30 days as a result of a fatal road crash in
which any active participant was found with a blood alcohol level above the legal limit)
o Other (please specify) ................................................................................................................................................ ................................................................................................................................................ ................................................................................................................................................ Q8 What is the official number of road fatalities attributable to alcohol in your country for the years
2000, 2005 and 2010? 2000 2005 2010 No data available O O O Number of deaths in alcohol crashes (N) ……………………………… …………………………… …………………………… Proportion of total road traffic deaths (%)
………………………… ………………………… …………………………
Source of data ……………………………………………………
…………………………………………………
………………………………………………
……………………………… …………………………… …………………………… Q9 On which data source(s) is the most recent number on alcohol-related road fatalities based on?
o Police records o Hospital records o Forensic records

ANNEX B - QUESTIONNAIRE − 53
ALCOHOL-RELATED ROAD CASUALITIES IN OFFICIAL CRASH STATISTICS — © OECD/ITF 2016
o Specific research (please specify) ……………………………………………………………….. o Other (please specify) …………………………………………………………………………….
If answered ‘specific research’ on question 9: Q10 Which methodology was used in this study and what was the sample size of it? ................................................................................................................................................ ................................................................................................................................................ ................................................................................................................................................ Q11 Do you have an official number of serious injuries attributable to drink driving in your country?
o Yes o No
Q12 What is the definition used of serious injuries attributable to drink driving (above the legal limit) in
your country? ................................................................................................................................................ ................................................................................................................................................ ................................................................................................................................................
(if answered ‘No’ on question 11 please pursue at question 14) Q13 What is the official number of serious injuries attributable to alcohol in your country for the year
2000, 2005 and 2010?
Q14 On which data source(s) is this number based on?
o Police records o Hospital records o Forensic records o Specific research (please specify) ……………………………..……………………………… o Other (please specify) …………………………………………………………………………
If answered ‘specific research’ on question 14: Q15 Which methodology was used in this study and what was the sample size of it? ................................................................................................................................................ ................................................................................................................................................ ................................................................................................................................................
2000 2005 2010 No data available O O O Number of serious injuries in alcohol crashes (N) ………………………… …………………… ………………………… Proportion of total traffic serious injuries % ………………………… …………………… …………………………
Source of data …………………………… ……………………… …………………………
………………………… …………………… ……………………………

54 − ANNEX B - QUESTIONNAIRE
ALCOHOL-RELATED ROAD CASUALTIES IN OFFICIAL CRASH STATISTICS — © OECD/ITF 2017
Part 2: Recording
Note 1: Question 16 to question 21 do not have to be answered by IRTAD countries
Note 2: For question 16 to question 21 more answers can be given Q16 Does the police set up an official police report of each of the road crashes they attend?
o Yes (Please go to Q20) o No, only in road crashes with certain severities of injury (Please go to Q17) o No, only in road crashes with certain types of vehicles (Please go to Q18) o No, only in road crashes with certain types of roads (Please go to Q19) o Other (please specify) (Please go to Q20)
................................................................................................................................................
Q17 In which severities of injury do the police report the road crash? o Minor injuries o Severe injuries o Other (please specify)…………………………………………………………………………………
Q18 On what types of vehicles do the police report the road crash?
o Person cars o Vans o Motorcycles o Mopeds o Lorries / trucks/ busses o Other (please specify) …………………………………………………………….………………...
Q19 On what types of roads do the police report the road crash?
o Urban roads o Rural roads o Motorways o Other (please specify) ……………………………………………………………………………..
Q20 In which condition(s) will the police carry out an alcohol test when they attend a road crash?
o In all road crashes o In all road crashes with two or more vehicles o In road crashes with serious injuries and fatalities o Other (please specify) ………………………………………………………………………………..
Q21 What is / are reason(s) for the police not to carry out an alcohol test?
o When there is no suspicion of alcohol use on the involved drivers o When guilt is already evident o When cause is already evident o All of the above o Other (please specify) ………………………………………………………………………………..
Q22 If the alcohol test is not carried out by the police at the scene of the road crash, will it then be carried
out later? (If yes, by whom and where?) Performed by: Performed at (place):
o Yes ……………………………… ……………………………… o No o Other (please specify) …………………………………………………………………………..……
If answered ‘Hospital records’ on Q9 or Q14 the following question(s) have to be answered

ANNEX B - QUESTIONNAIRE − 55
ALCOHOL-RELATED ROAD CASUALITIES IN OFFICIAL CRASH STATISTICS — © OECD/ITF 2016
Q23 Are serious injured standardly tested on alcohol when they arrive at the hospital? o Yes o No, they are only tested when the use of alcohol entails complications during surgery o Other (specify) ………………………………………………………………………………………
Q24 In case patients are tested for alcohol is the value then filed (also when Alcohol=No) ?
o Yes o No
If ‘yes’ Q24 Q25 In which database are these patient values on alcohol use filed?
o Police record database o Hospital record database o Other (please specify) …………………………………………………………………………….........
Q26 Does the indicator Alcohol=Yes imply alcohol use above the legal limit?
o Yes o No (please specify) ……………………………………………………………………………………...
Q27 If other than a (medical) police officer has performed the alcohol test, is it then allowed to share the
results with the police? o Yes, at patient level o Yes, but annual percentage only o No, unless there is permission from the medical-ethics committee o Other (please specify)…………………………………………………………………………………...
Part 3: Quality
If answered both ‘Police records’ and ‘Hospital records’ on Q9 and / or Q14 questions Q28 and Q29 have to be answered: Q28 Are the data on serious injuries related to drink driving which are collected by the police force and
the data collected by the hospital linked to each other? o Yes o No
If ‘yes’ Q28 Q29 Are these both types of data on serious injuries combined to correct for underreporting of alcohol
use? o Yes o No
Q30 Is it legally allowed to perform a post-mortem alcohol test on road fatalities? o Yes o Yes, but only with permission of the relatives of the deceased person o No o Other (please specify……………………………………………………………………………………

56 − ANNEX B - QUESTIONNAIRE
ALCOHOL-RELATED ROAD CASUALTIES IN OFFICIAL CRASH STATISTICS — © OECD/ITF 2017
If ‘yes, but... ’ Q30 Q31 Is this permission often refused by the relatives?
o Yes o No
Q32 What is in your view the best estimate of the proportion of road traffic deaths and serious injured
attributable to drink driving? Proportion of road traffic deaths attributable to drink driving (%): …………………………………….…
Proportion of serious injured attributable to drink driving (%): ……………………………………...…… Q33 Can you please indicate why this is the best estimate of the proportion of road fatalities and serious
injuries attributable to drink driving? …………………………………………………………………………………………………………….
……………………………………………………………………………………………………………. ……………………………………………………………………………………………………………. ……………………………………………………………………………………………………………. Q34 On what kind of source(s) (relevant reports and/ or studies) are your estimates based? Fatalities:………………………………………………………………………………………………..….. …………………………………………………………………………………………………………….. …………………………………………………………………………………………………………….. Serious injuries:…………………………………………………………………………………………. …………………………………………………………………………………………………………….. ……………………………………………………………………………………………..……………… Q35 What is the most recent official number of road fatalities attributed to drugs in your country?
(Please distinguish the number for illicit and prescribed drugs)
Illicit drugs Prescribed drugs No data available O O Year …………………………... …………………………... Number of deaths in drug crashes (N) …………………………... …………………………... Proportion of total road traffic deaths (%) …………………………... …………………………... Source of data …………………………... …………………………...
Further remarks: …………………………………………………………………………………………………………….
……………………………………………………………………………………………………………. ……………………………………………………………………………………………………………. ……………………………………………………………………………………………………………. ……………………………………………………………………………………………………………. …………………………………………………………………………………………………………….
……………………………………………………………………………………………………………. This is the end, thank you for completing this questionnaire.

International Transport Forum 2 rue André Pascal 75775 Paris Cedex 16 France T +33 (0)1 45 24 97 10 F +33 (0)1 45 24 13 22 Email : [email protected] Web: www.internationaltransportforum.org
Alcohol-Related Road Casualties in Official Crash Statistics
This study examines how improving insights regarding the real number of alcohol-related road casualties worldwide can help to save lives. Every year 1.25 million people die in road crashes according to the World Health Organization. It is widely recognised that drink driving is an important risk-increasing factor and contributes to many road deaths. With great certainty, the real number of alcohol-related road casualties is higher than reported in the official statistics. Better insights into reporting procedures is of the utmost relevance to arrive at comparable and reliable data.For this study, a total of 45 countries were surveyed with the help of an online questionnaire. The survey was facilitated through the members of the International Transport Forum’s permanent working group on road safety, known as the International Traffic Safety Data and Analysis Group (IRTAD), the Ibero-American Road Safety Observatory (OISEVI) and the International Center for Alcohol Policies (IARD, formerly ICAP), London
International Traffic SafetyData and Analysis Group
Research Report
Alcohol-Related Road Casualties in Official Crash Statistics
Why Does Road Safety Im
prove When Econom
ic Times Are Hard?
Research Report
2015


