Page 1
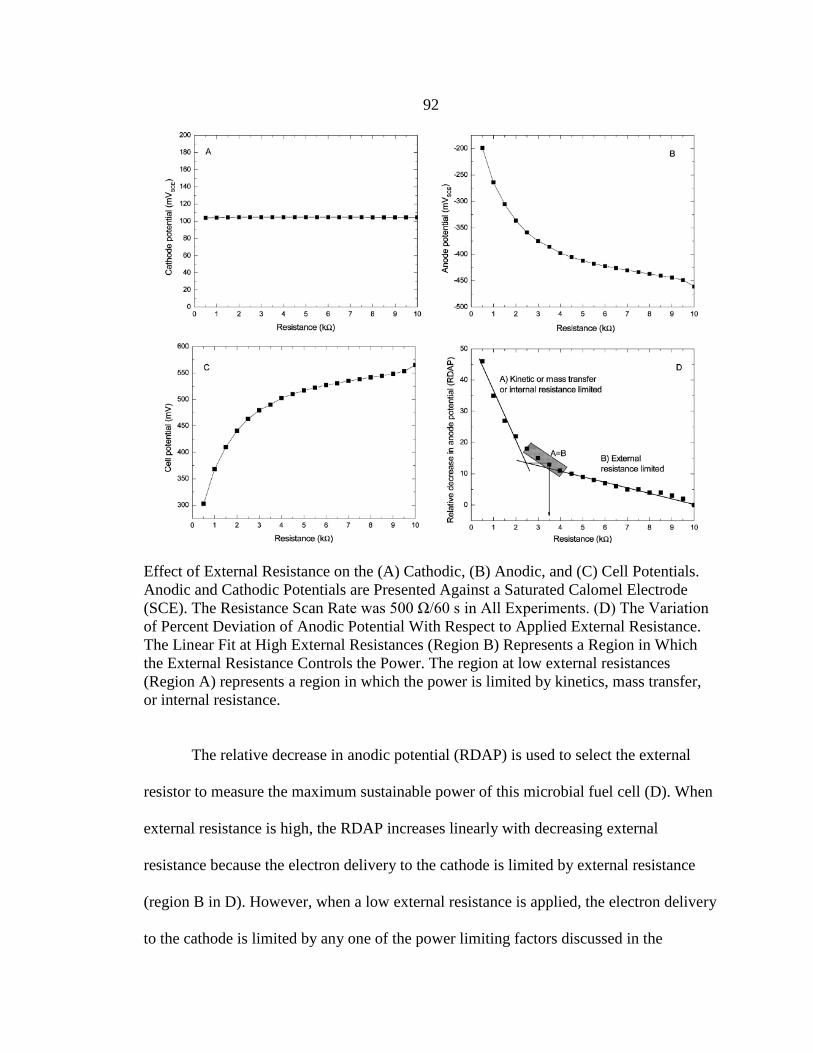
ALGAL BIOFILMS, MICROBIAL FUEL CELLS, AND IMPLEMENTATION OF
STATE-OF-THE ART RESEARCH INTO CHEMICAL AND BIOLOGICAL
ENGINEERING LABORATORIES
by
Joseph Anthony Menicucci, Jr.
A dissertation submitted in partial fulfillment
of the requirements for the degree
of
Doctor of Philosophy
in
Engineering
MONTANA STATE UNIVERSITY
Bozeman, Montana
April, 2010
Page 2
©COPYRIGHT
by
Joseph Anthony Menicucci, Jr.
2010
All Rights Reserved
Page 3
ii
APPROVAL
of a dissertation submitted by
Joseph Anthony Menicucci, Jr.
This dissertation has been read by each member of the dissertation committee and
has been found to be satisfactory regarding content, English usage, format, citation,
bibliographic style, and consistency and is ready for submission to the Division of
Graduate Education.
Dr. Ronald Larsen
Approved for the Department of Chemical and Biological Engineering
Dr. Ronald Larsen
Approved for the Division of Graduate Education
Dr. Carl A. Fox
Page 4
iii
STATEMENT OF PERMISSION TO USE
In presenting this dissertation in partial fulfillment of the requirements for a
doctoral degree at Montana State University, I agree that the Library shall make it
available to borrowers under rules of the Library. I further agree that copying of this
dissertation is allowable only for scholarly purposes, consistent with “fair use” as
prescribed in the U.S. Copyright Law. Requests for extensive copying or reproduction of
this dissertation should be referred to ProQuest Information and Learning, 300 North
Zeeb Road, Ann Arbor, Michigan 48106, to whom I have granted “the exclusive right to
reproduce and distribute my dissertation in and from microform along with the non-
exclusive right to reproduce and distribute my abstract in any format in whole or in part.”
Joseph Anthony Menicucci, Jr.
April, 2010
Page 5
iv
ACKNOWLEDGEMENTS
I'd like to thank all of those people who helped me along the way: Dr. John Sears,
Dr. Greg Bala, Mr. Pete Pryfogle, Dr. Stephen Hunt, Dr. Zbigniew Lewindowski, Dr.
Haluk Beyenal, Dr. Goksel Demir, Dr. Enrico Marsili, Dr. Vildan Caner, Mr. Raaja
Raajan Angathevar Veluchamy, Mr. Avinash Shantaram, Dr. James Duffy, Dr. Betsey
Palmer, Dr. Joseph Seymour, Dr. Ronald Larsen, Dr. Jeffrey Heys, Dr. Ross Carlson, Dr.
Brent Peyton, Dr. Paul Gannon, Dr. Abigail Richards, Dr. Lee Richards, Mr. Pancasatya
Agastra, Ms Ginny Heimann and Ms Shelley Thomas.
Thanks to Dr. Kevin Dahm at Rowan University and all of the dedicated
educators I've met through ASEE. The conversations I've had and presentations I've
heard inspired me to teach, to innovate, and to change.
I'd also like to thank all of those people at CTW Energy who helped me through
this process: Mr. Gary Chilcott, Ms Elizabeth Aisenbrey, Ms Collette Kennedy, Mr.
Matthew Lewis, Mr. Everett Eustance, and Mr. Bryan Vadheim.
I'd like to thank my many friends who have seen evenings cut short or phone calls
left unfinished. I especially want to acknowledge Mr. Ryan Welsh, who provided support
whenever I needed it. I most especially would like to thank my family for their support,
love, and patience. Penny, you've been my rock. Thank you. I love you.
Page 6
v
TABLE OF CONTENTS
1. INTRODUCTION ...................................................................................................1
Biological Energy Conversion .................................................................................1
Algal Biofilms ..........................................................................................................2
Power Measurements in Microbial Fuel Cells .........................................................4
Microbial Fuel Cells in Chemical and Biological Engineering Laboratories ..........5
2. ALGAE AS BIOFILMS ..........................................................................................7
Introduction to Algal Biofilms .................................................................................7
Materials and Methods .............................................................................................8
Organisms ...........................................................................................................8
Media ..................................................................................................................9
Stock Culture Preparation and Wet Slide Analysis ..........................................10
Flow Cell and Reactor System ..........................................................................11
Image Acquisition and Staining ........................................................................14
Results ....................................................................................................................16
Wet Slide Analysis and Observations ...............................................................16
B. braunii on Aluminum ...................................................................................19
B. braunii on Teflon ..........................................................................................20
Image Analysis with Stain ................................................................................21
Discussion of Algae as Biofilms ............................................................................23
3. CHARACTERIZATION OF A MICROBIAL FUEL CELL ................................26
Introduction to Microbial Fuel Cells......................................................................26
Materials and Methods ...........................................................................................33
Microbial Fuel Cell Components ......................................................................33
Anodic Compartment .................................................................................34
Cathodic Compartment ..............................................................................35
Fuel Cell Startup and Operating Conditions .....................................................36
Preparation of Inoculum ............................................................................36
MFC Preparation ........................................................................................36
Measurement of Anodic and Cathodic
Potentials and Current in a Microbial Fuel Cell ...............................................36
Page 7
vi
TABLE OF CONTENTS – CONTINUED
Sustainable Power in Microbial Fuel Cells ............................................................38
Evaluating Sustainable Power...........................................................................44
Example Measurements and Computations ...............................................44
Effect of the External Resistance
Scan Rate on the Sustainable Power .................................................................47
Experimental Verification of the
Computed Maximum Sustainable Power.....................................................47
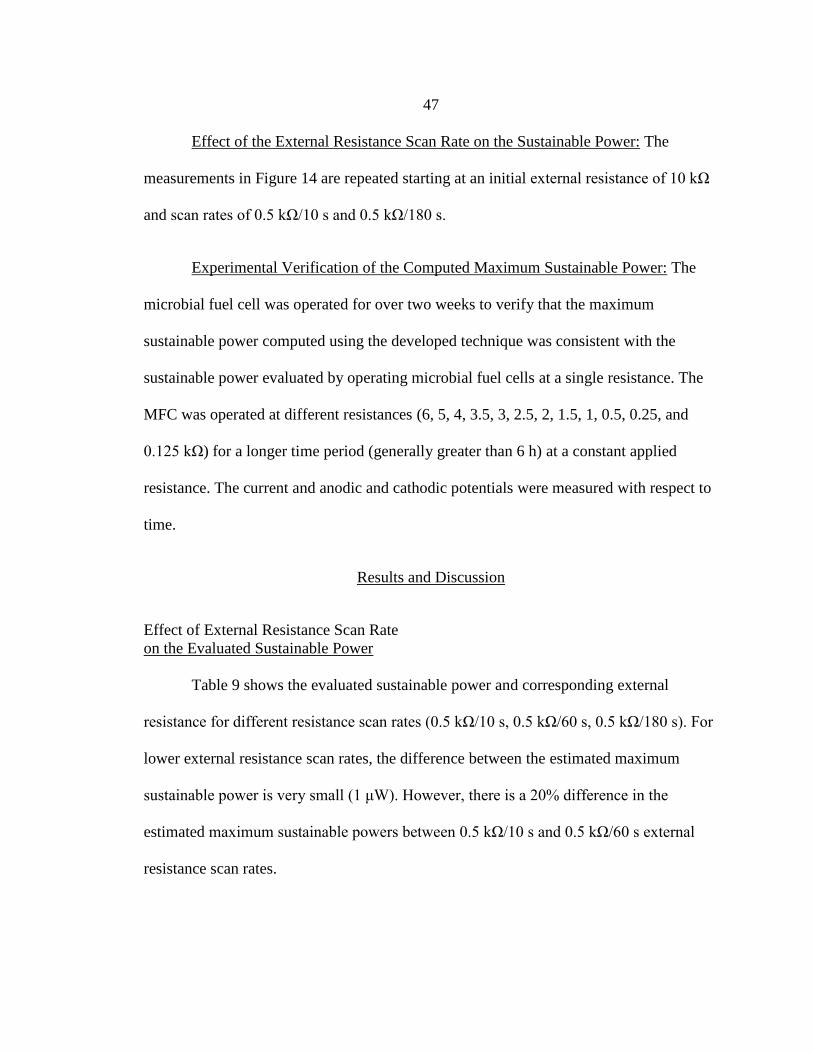
Results and Discussion ..........................................................................................47
Effect of External Resistance Scan
Rate on the Evaluated Sustainable Power .........................................................47
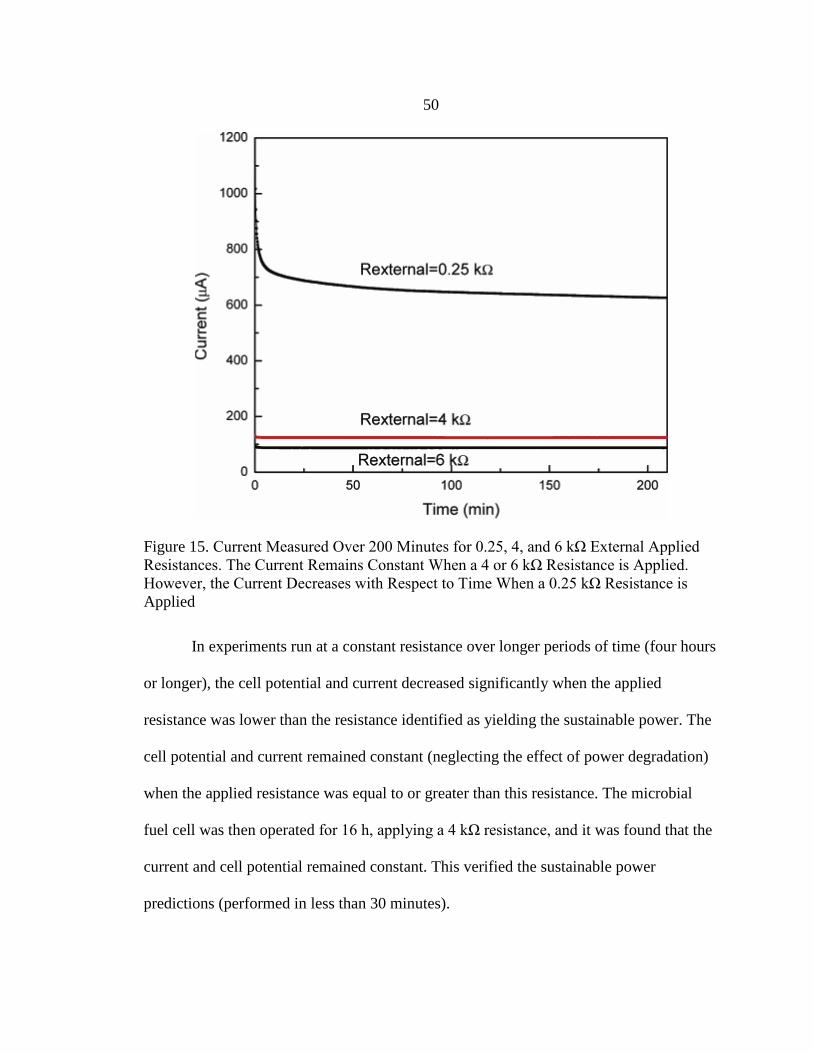
Experimental Verification of Sustainable Power ..............................................49
Comparing the Maximum
Sustainable Power to the Maximum Power ......................................................51
4. THE COURSE BEFORE AND AFTER THE CURRICULUM CHANGE .........56
Introduction to CHBE 100 .....................................................................................56
Hands-on Engineering Education ..........................................................................57
Course Format ........................................................................................................59
Student-Designed Experiments ..............................................................................61
Assessment Model .................................................................................................62
Data Collection ......................................................................................................63
Assessment Results ................................................................................................64
5. MICROBIAL FUEL CELLS IN CHBE 100 .........................................................71
The Experiment ......................................................................................................71
Learning Objectives ...............................................................................................72
Microbial Fuel Cell Laboratory Evaluation ...........................................................72
6. AN UPDATED MICROBIAL FUEL CELL EXPERIMENT ..............................75
Introduction to the New Experiment......................................................................75
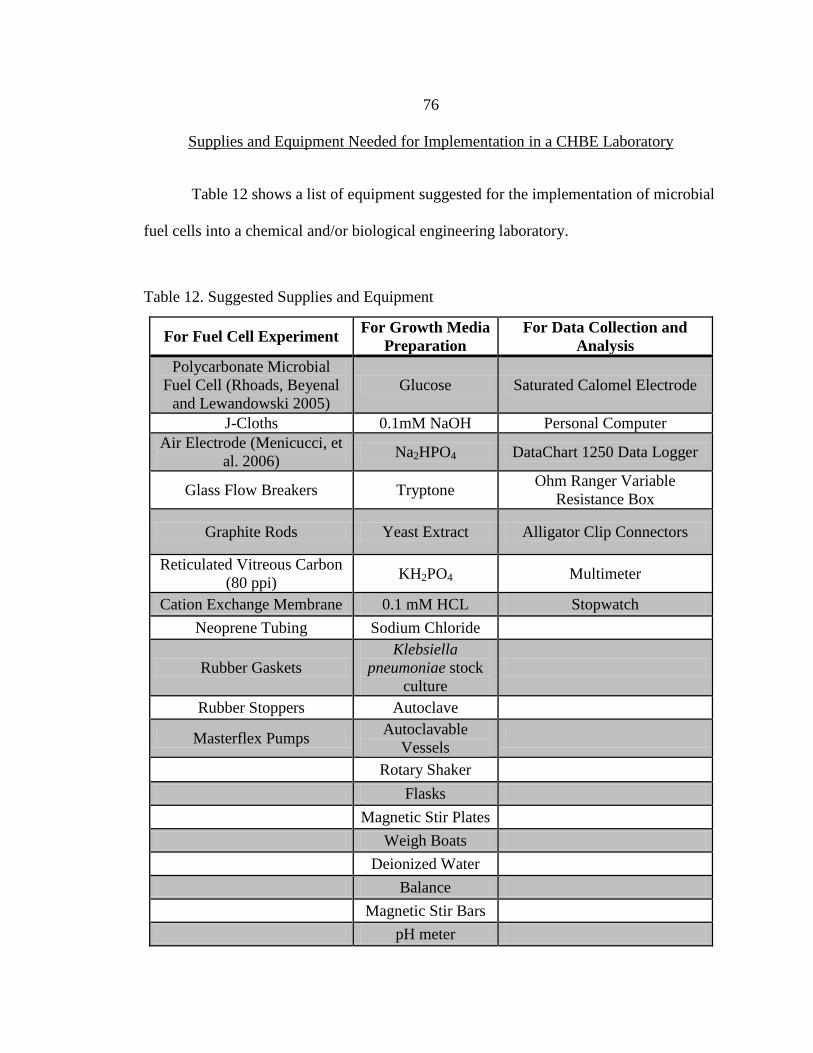
Supplies and Equipment Needed for Implementation in a CHBE Laboratory ......76
Learning Objectives ...............................................................................................77
Pre-Experiment Activity ........................................................................................78
Page 8
vii
TABLE OF CONTENTS – CONTINUED
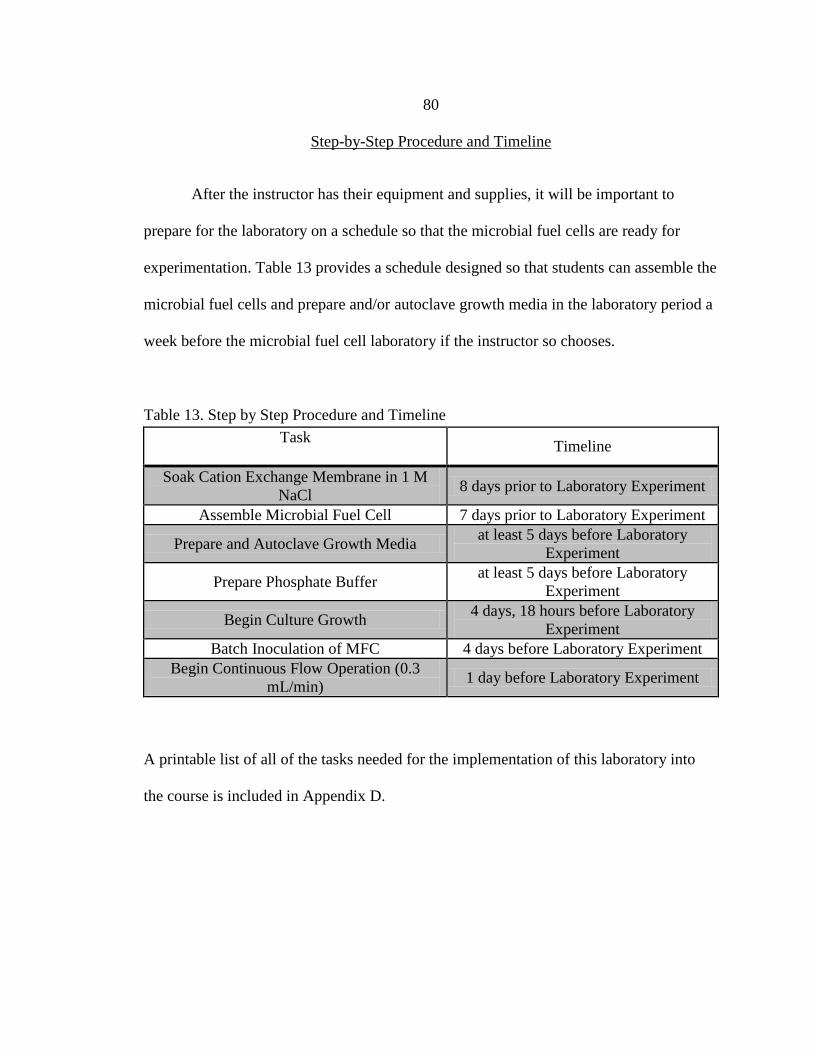
Step-by-Step Procedure and Timeline ...................................................................80
Post-Experiment Activity.......................................................................................81
Significance of the Updated Microbial Fuel Cell Experiment ...............................81
Suggested Assessment ...........................................................................................83
7. CONCLUSIONS....................................................................................................85
APPENDICES .............................................................................................................89
APPENDIX A: A Graphical Estimation of
Sustainable Conditions.................................................................90
APPENDIX B: Microbial Fuel Cell Lab:
Introduction to Microbial Fuel Cells ...........................................94
APPENDIX C: Implementation of Learning Objectives ....................................101
APPENDIX D: Step-By-Step Procedure for the Implementation
of a Microbial Fuel Cell Experiment Into an
Introductory Chemical and Biological
Engineering Course ....................................................................103
REFERENCES CITED ..............................................................................................106
Page 9
viii
LIST OF TABLES
Table Page
1. ASM-1 Media Composition ...............................................................................9
2. Macro-Nutrient Solution (10X) .........................................................................9
3. Micro-Nutrient Solution (10X) ........................................................................10
4. Soil Water Extract ............................................................................................10
5. Hydrodynamic Characteristics of Flow
Channels (Jayawickramarajah 2003) ...............................................................12
6. Dimension of Coupons and Flow Channels
(Jayawickramarajah 2003) ...............................................................................12
7. GC/Mass Spec Analysis of Botryococcus braunii Hydrocarbons ................31
8. Applied Resistor and Measured Current Values
Found in Contemporary MFC Literature ........................................................40
9. Effect of the Rate of Change of External Resistance
on the Change in Sustainable Power ................................................................47
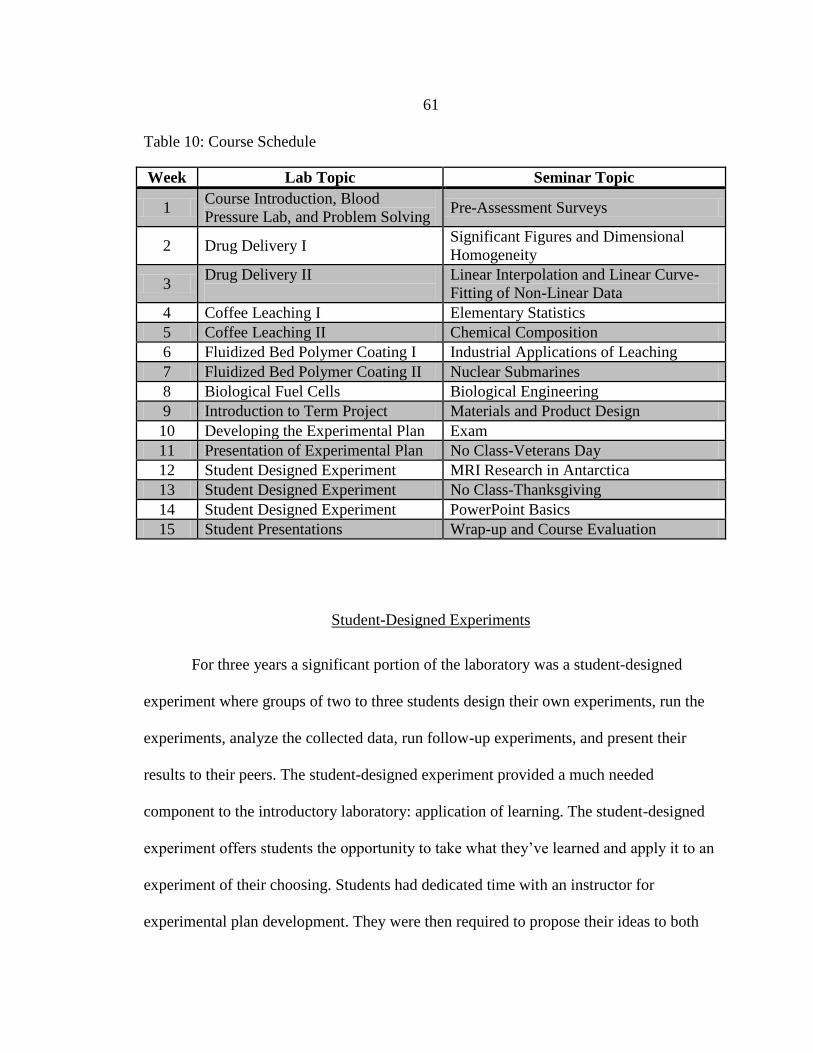
10. Course Schedule...............................................................................................60
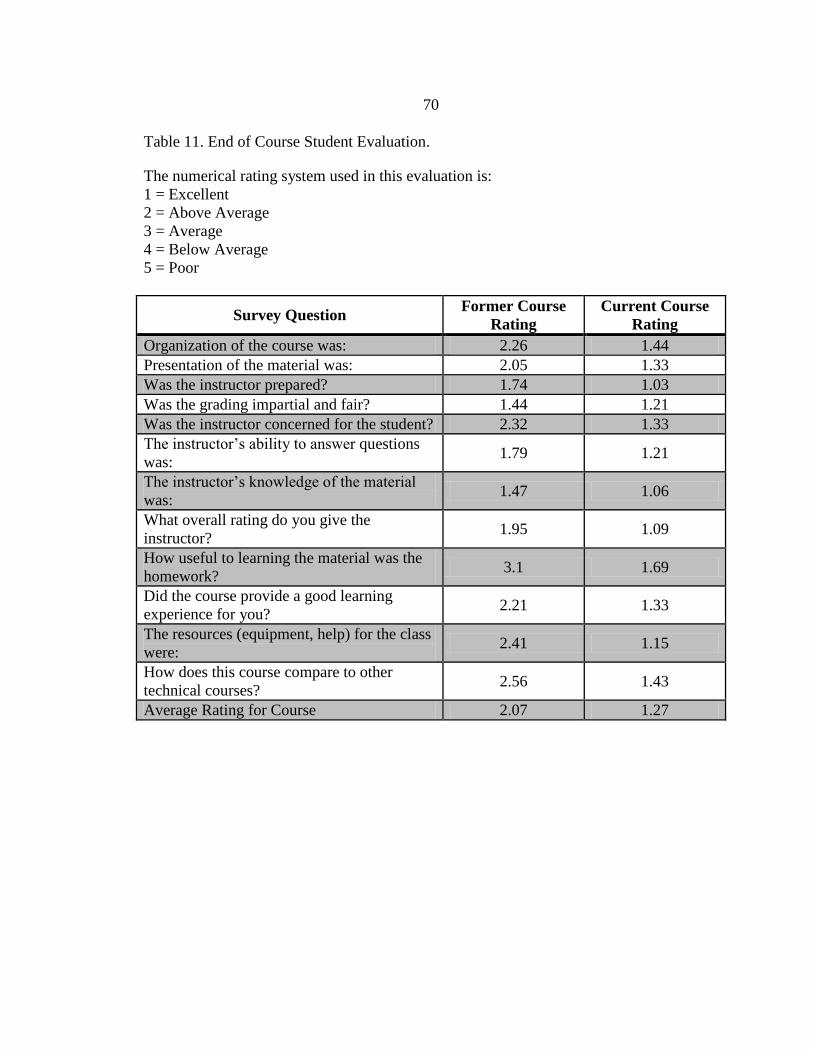
11. End of Course Student Evaluation ...................................................................69
12. Suggested Supplies and Equipment ................................................................75
13. Step by Step Procedure and Timeline .............................................................80
Page 10
ix
LIST OF FIGURES
Figure Page
1. Parallel Plate Flow Cell with Coupon (Jayawickramarajah 2003) ..................12
2. Autoflorescence of Botryococcus braunii in Loosely Connected
Colonies (UTEX isolates, 600X) .....................................................................17
3. (A) Surface (Glass) Attached Colonies of Botryococcus braunii and (B) a
Free-Floating Botryococcus braunii Colony (Czarnecki Isolates) ..................17
4. Botryococcus braunii (A) With External Pressure Causing
Hydrocarbon Excretion and (B) After Rehydration of the
Same Cells (Czarnecki Isolates) ......................................................................18
5. GC/Mass Spec Analysis of Botryococcus
braunii Hydrocarbons ......................................................................................18
6. Colony of Botryococcus braunii on an Aluminum Coupon Under Flow
Conditions at (A) Time 0 Hours (No Flow) (B) 24 Hours (C) 48 Hours
and (D) 72 Hours (UTEX isolates, 100X) .......................................................20
7. (A) Autoflorescent View of Botryococcus braunii on Aluminum and (B)
Botryococcus braunii and Associated Organisms Stained with DAPI on
Aluminum (UTEX Isolates, 600X) ..................................................................22
8. Botryococcus braunii and Associated Organisms on Aluminum
Stained With DAPI (UTEX isolates, 100X) ....................................................22
9. Voltage Losses in Fuel Cells (EG & G Services 2004) ...................................28
10. Voltage Losses in a Microbial Fuel Cell ..........................................................29
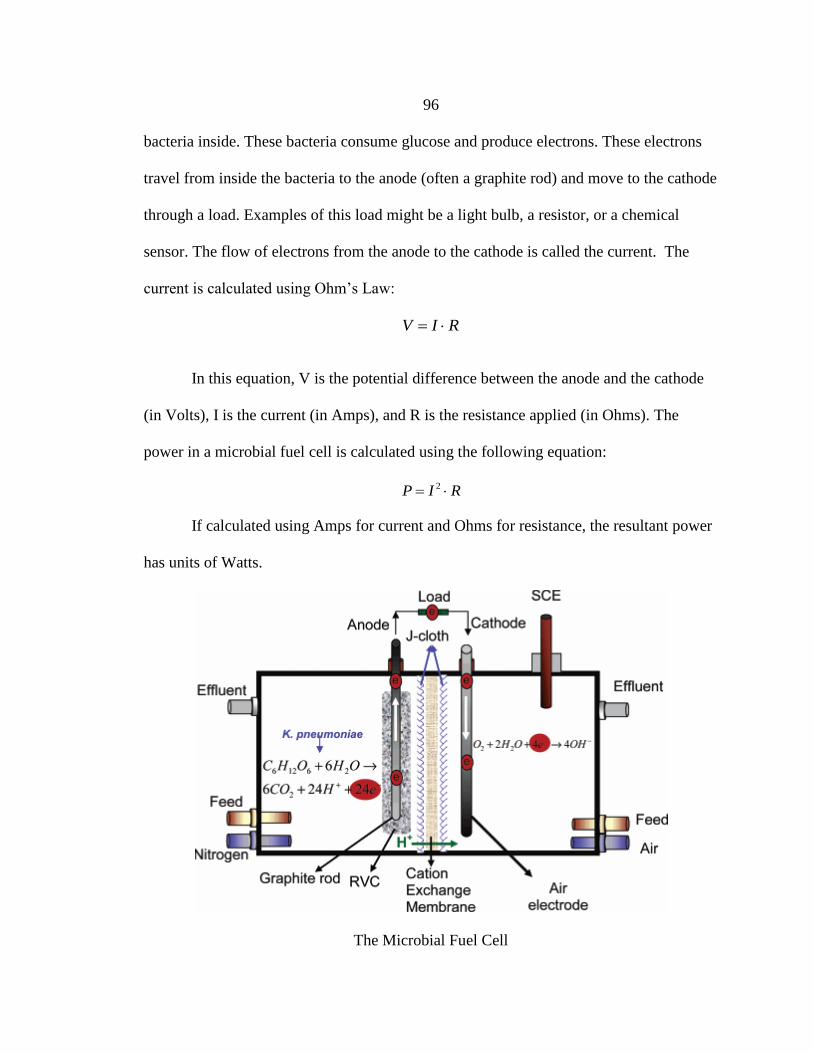
11. The Microbial Fuel Cell Used in the Experiments
(Rhoads, Beyenal and Lewandowski 2005) ....................................................34
12. Setup Used for Logging the Current and
the Anodic and Cathodic Potentials ................................................................38
Page 11
x
LIST OF FIGURES – CONTINUED
Figure Page
13. Simplified Charge Transfer in an MFC Depicting Factors
Affecting the External and Internal Resistances .............................................43
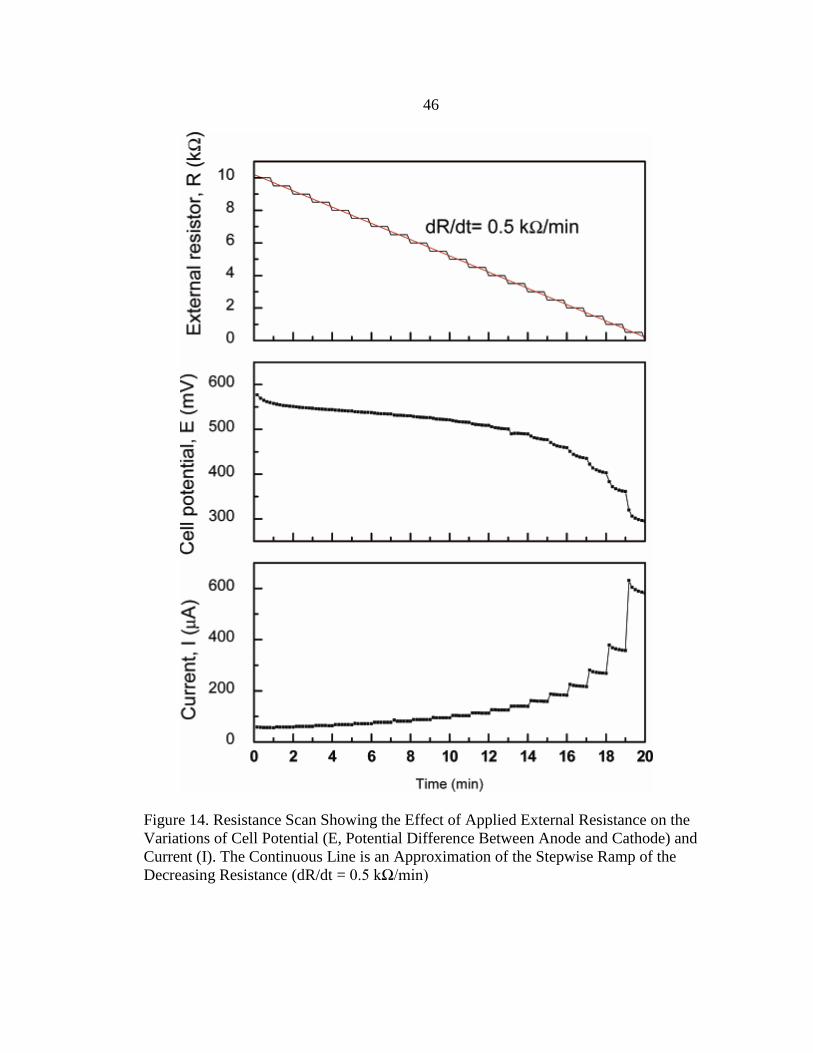
14. Resistance Scan Showing the Effect of Applied
External Resistance on the Variations of Cell
Potential and Current ......................................................................................46
15. Current Measured Over 200 Minutes for 0.25, 4, and
6 kΩ External Applied Resistances .................................................................50
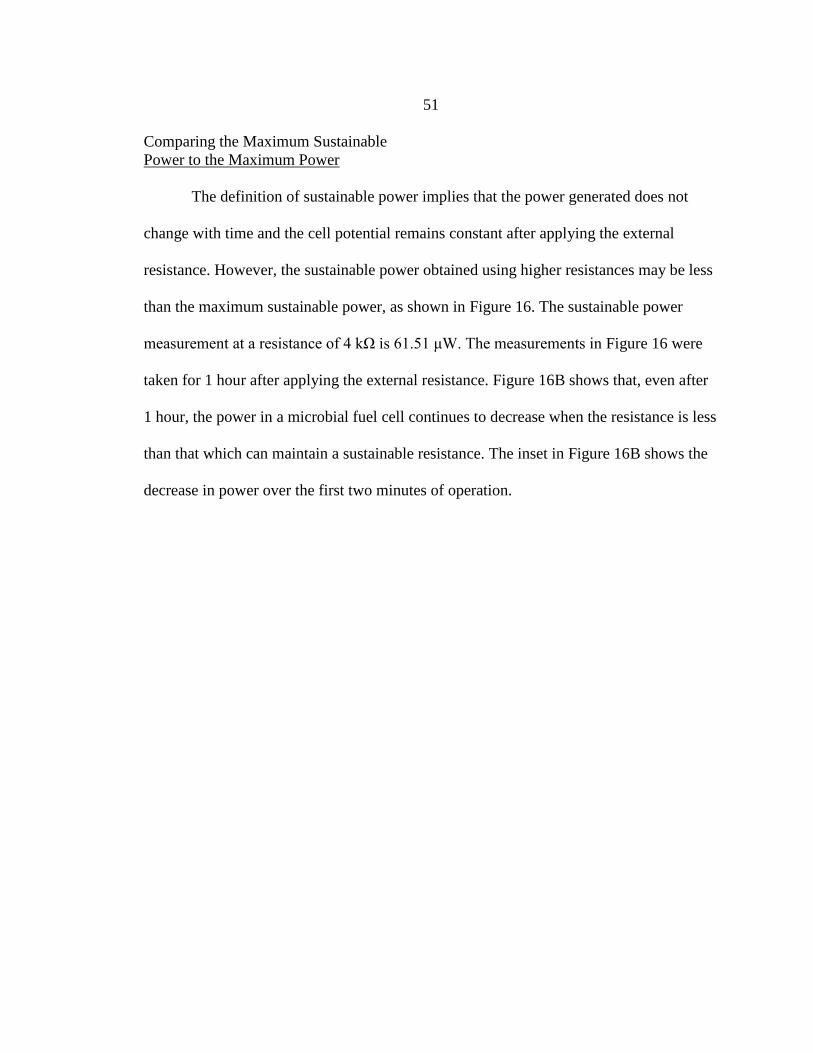
16. (A) Current, Cell Potential, and Power Measurements in a
Microbial Fuel Cell (measured at t = 1 h). (B) Power
Measurements in a Microbial Fuel Cell with an Applied
External Resistance of 1 kΩ .............................................................................52
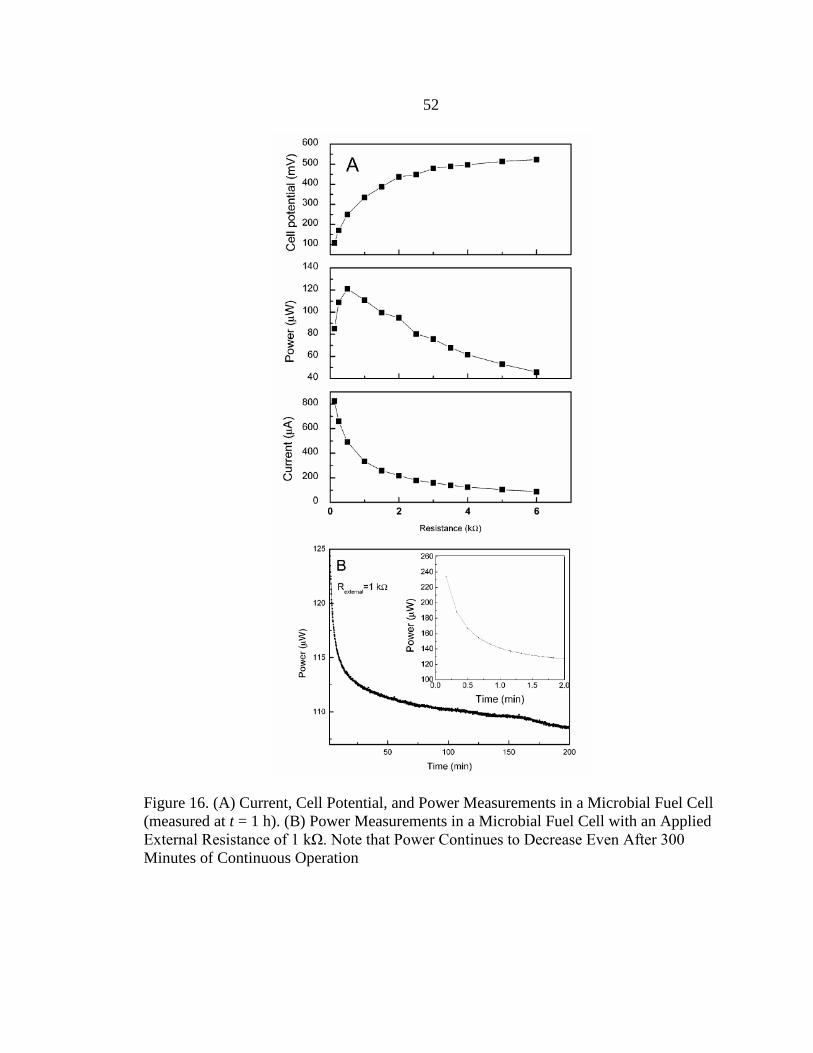
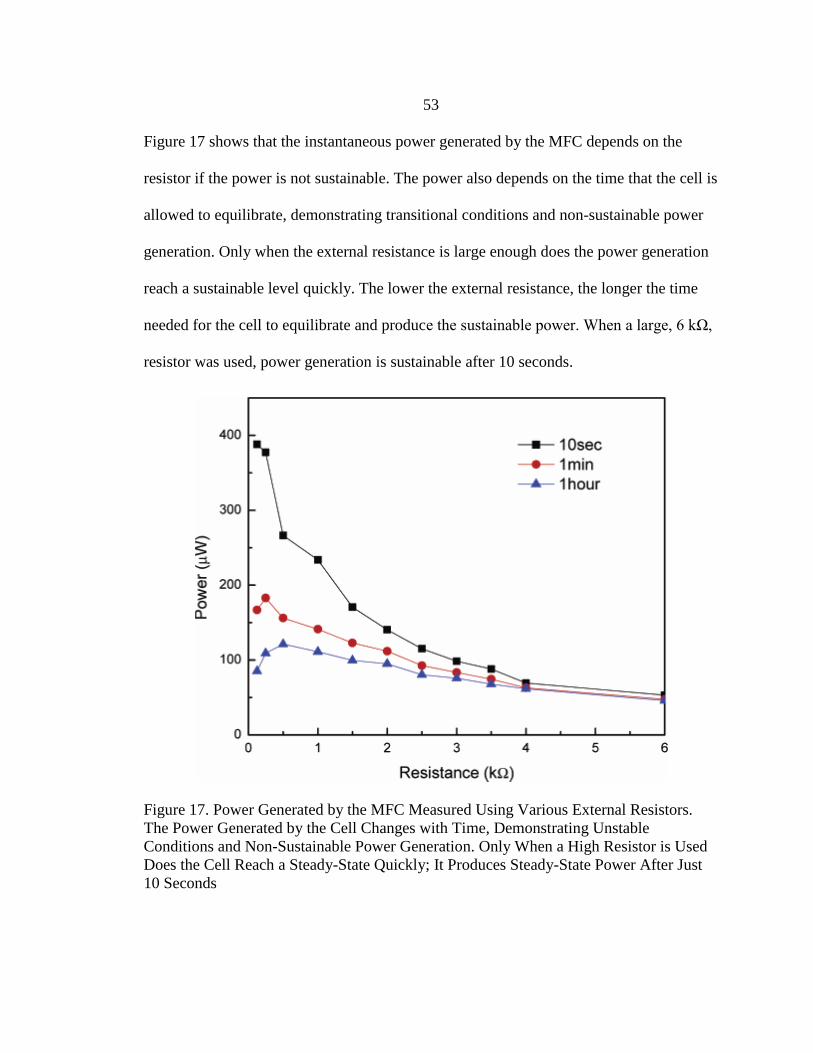
17. Power Generated by the MFC Measured
Using Various External Resistors ....................................................................53
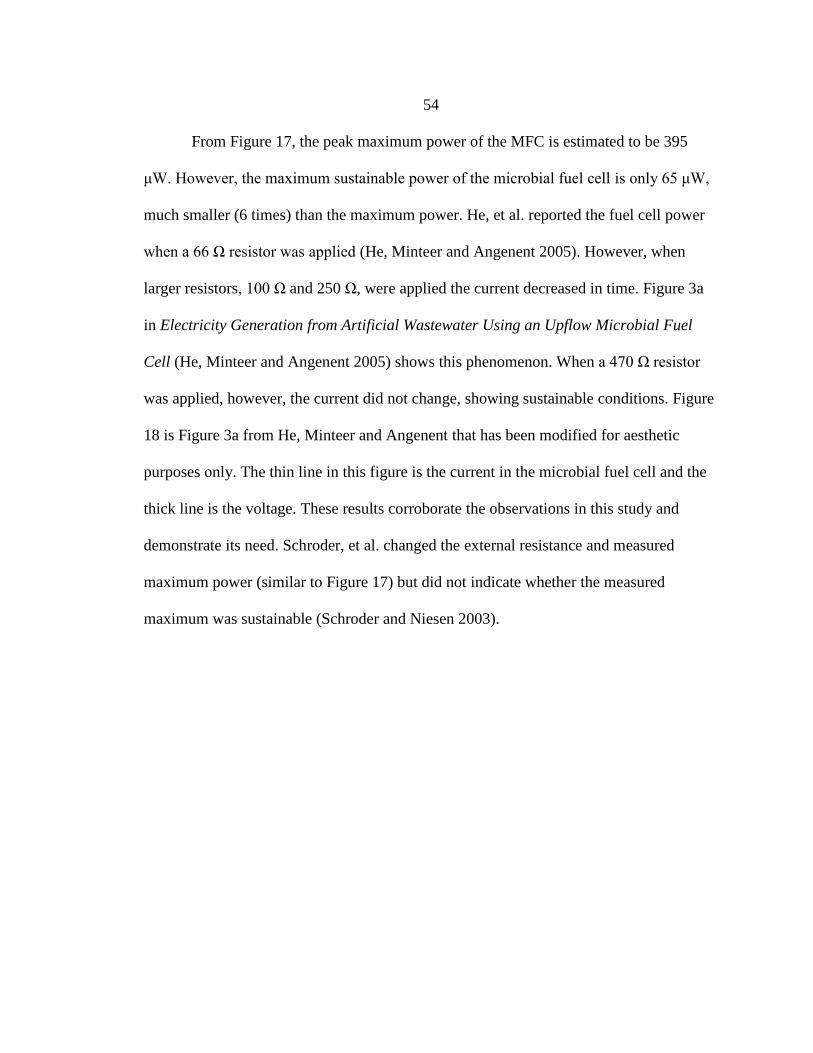
18. Current and Voltage in an Upflow Microbial
Fuel Cell (He, Minteer and Angenent 2005) ...................................................55
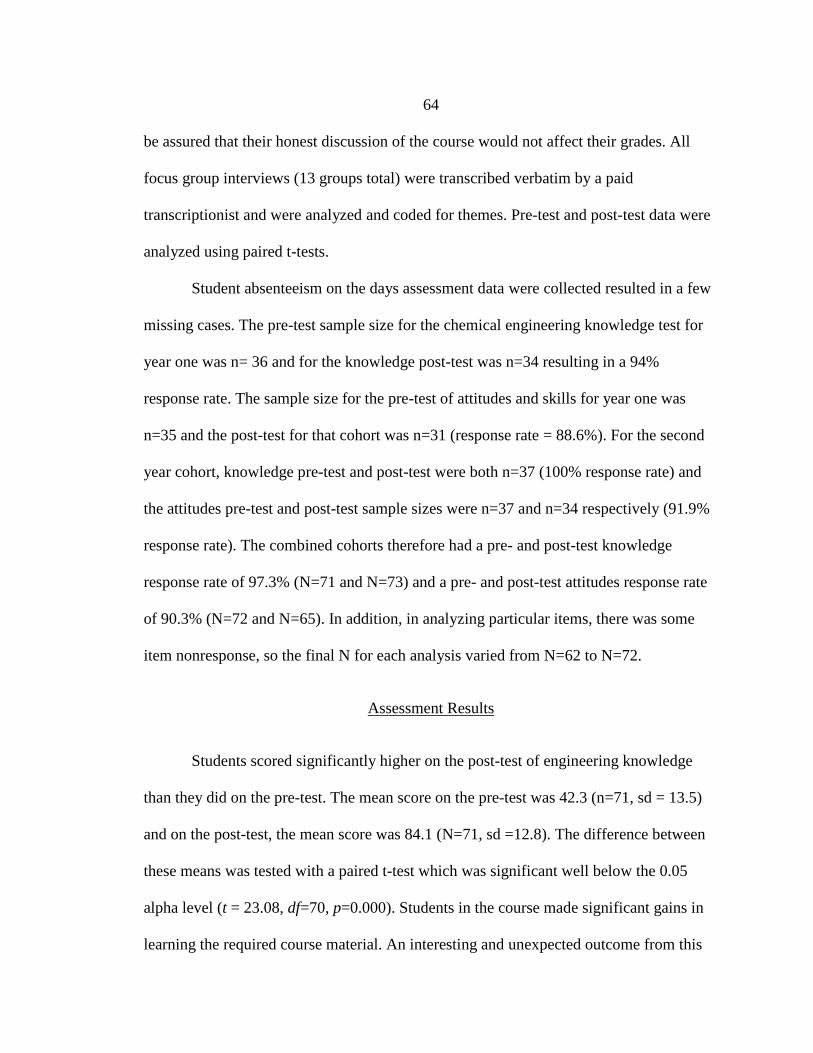
19. Student Assessment: Pre- and Post-Course Rating of Skills ...........................66
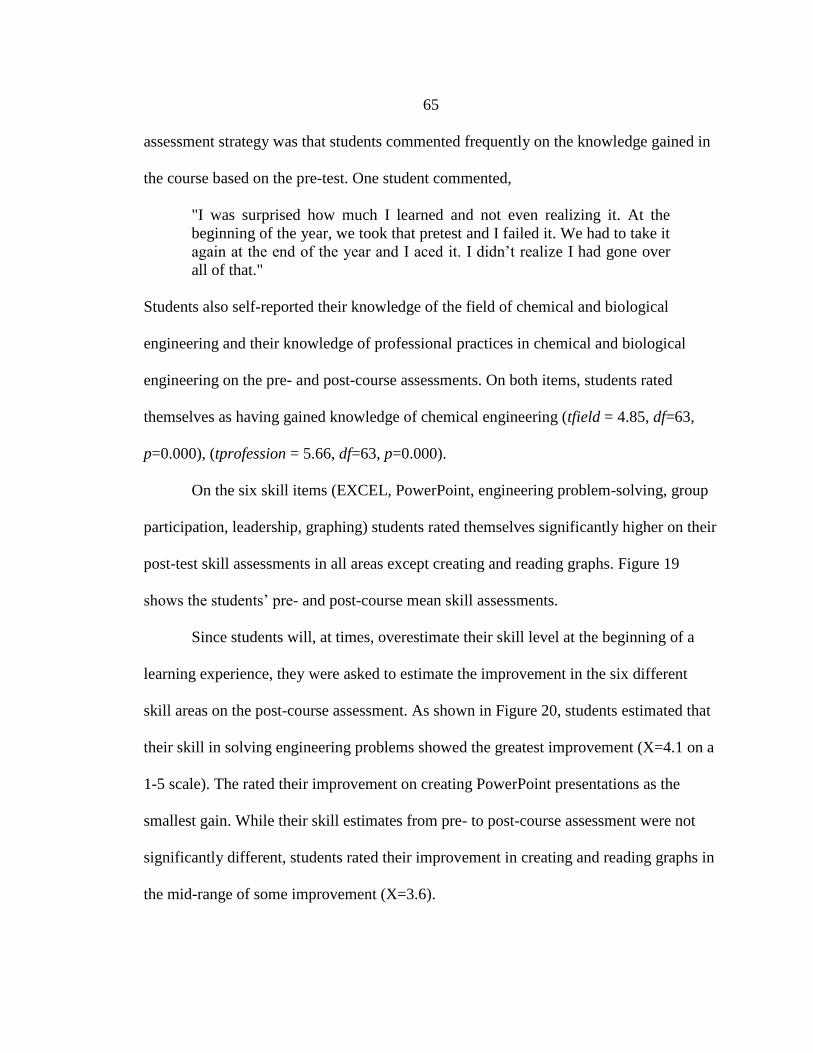
20. Student Assessment of Improvement in Skill Level ........................................66
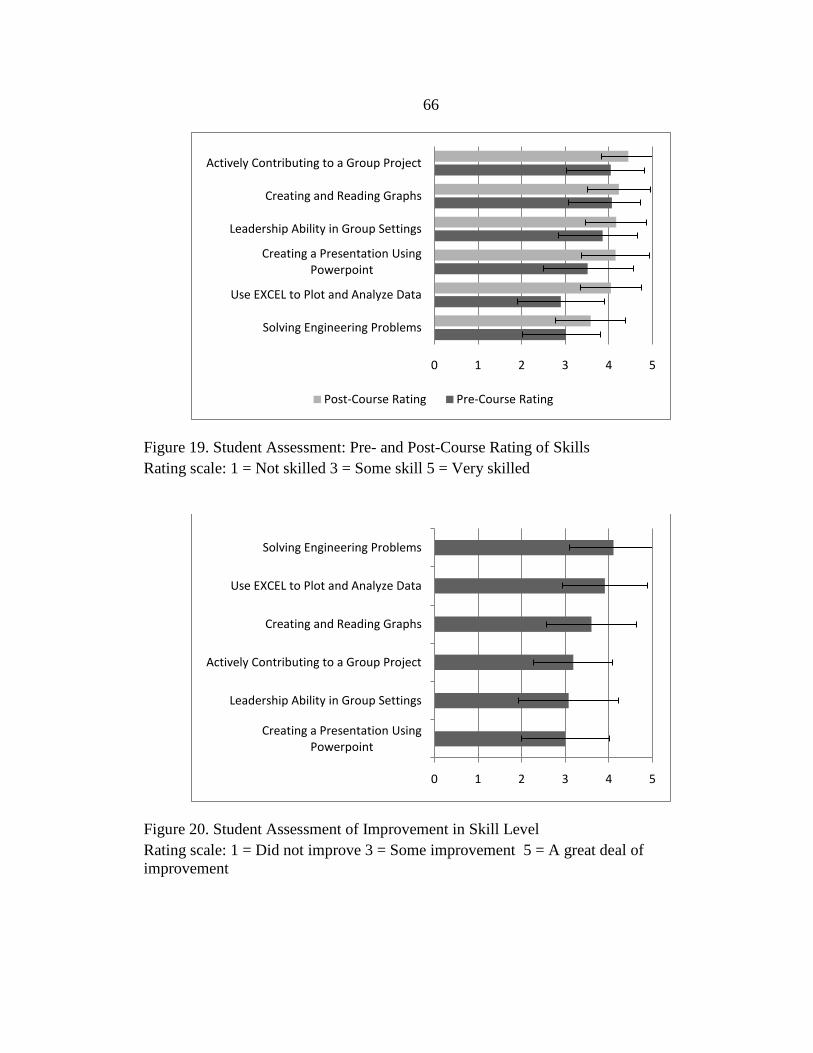
21. Student Assessment: General Impressions ......................................................67
22. Student Assessment of Learning in Labs .........................................................68
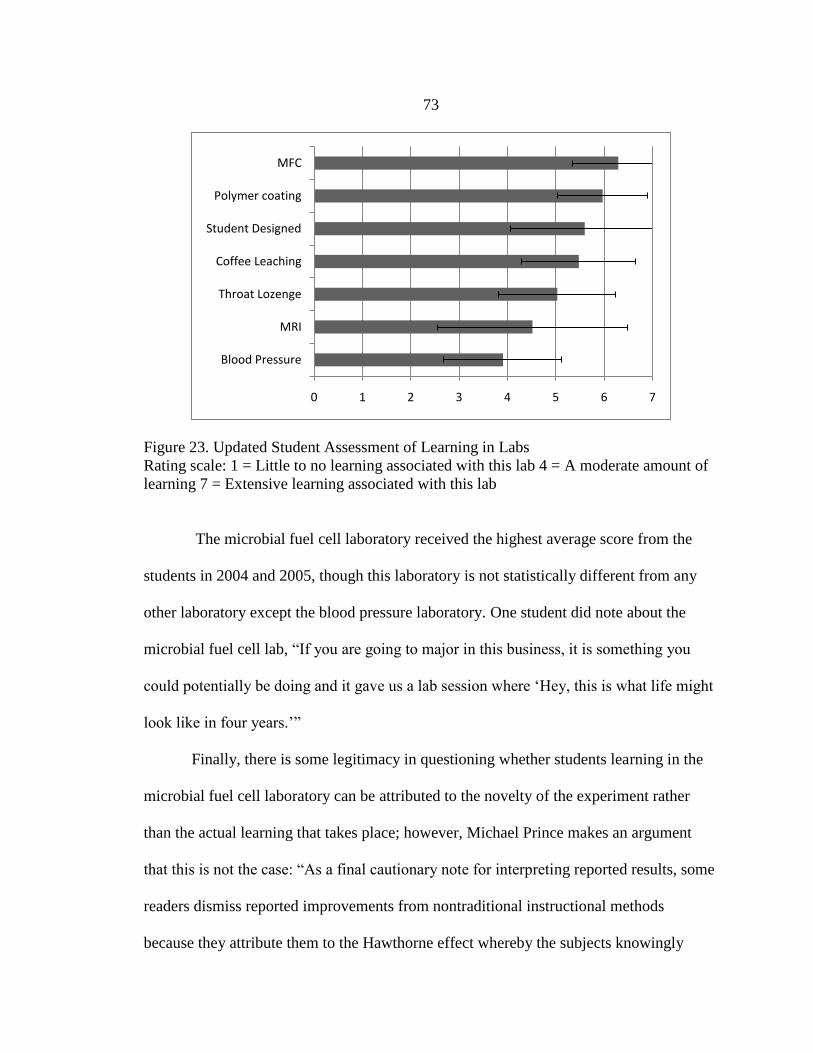
23. Updated Student Assessment of Learning in Labs ..........................................73
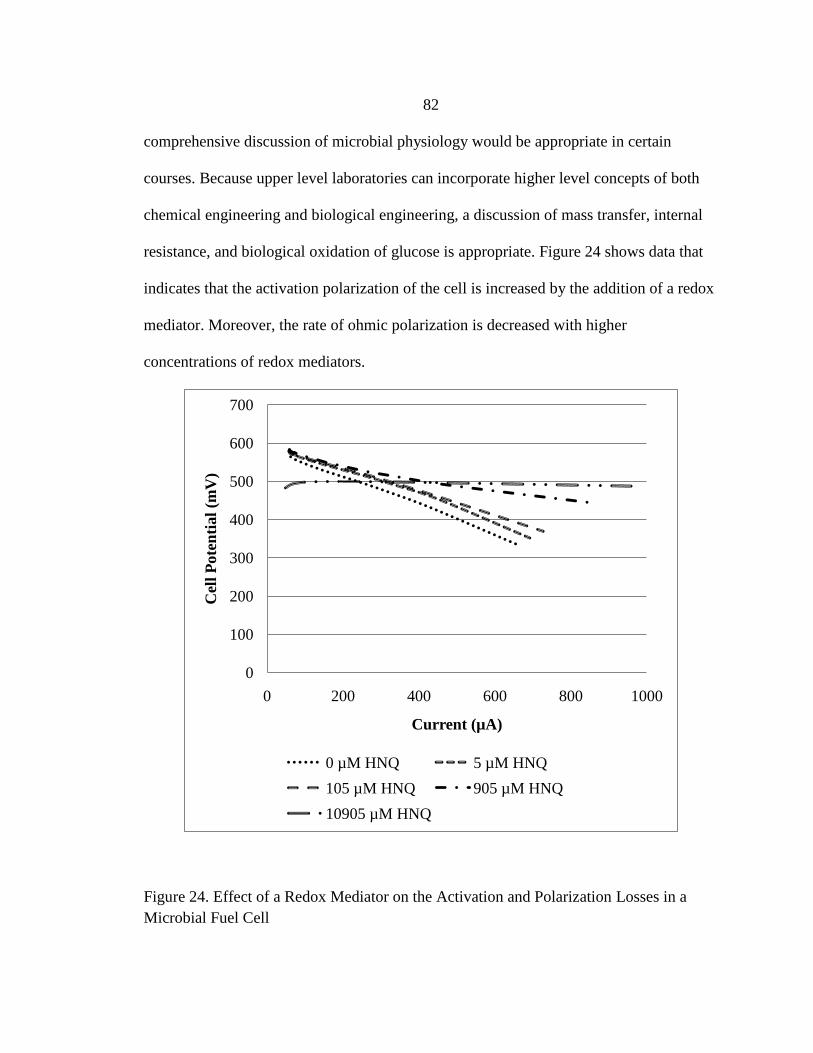
24. Effect of a Redox Mediator on the Activation and
Polarization Losses in a Microbial Fuel Cell ...................................................82
Page 12
xi
ABSTRACT
Alternative energy technologies become more attractive as the price of energy
from fossil fuels becomes more expensive and the environmental concerns from their use
mount. While a number of biological alternative energy technologies currently exist, a
complete understanding of these technologies has yet to be developed. This dissertation
characterizes an aspect of biological alternative energy technologies: the production of
algal biofuels and energy conversion in microbial fuel cells. Specifically, this dissertation
addresses the characterization of microalgae as a biofilm and the characterization of the
power limitations of microbial fuel cells.
The attachment and detachment of algae were observed using temporal
microscopic imaging in a flow-cell with autofluorescence and staining techniques as part
of a collaborative Montana State University and Idaho National Laboratory project.
Colonies of algae exhibit many characteristics seen in bacterial biofilms: adherence;
detachment and sloughing; difference in structure of an attached colony; varying strength
of attachment on different surfaces; association of other organisms in an EPS matrix; and
the heterogeneous nature of attached colonies.
The characterization of a microbial fuel cell was completed in less than 30
minutes using an empirical procedure to predict the maximum sustainable power that can
be generated by a microbial fuel cell over a short period of time. In this procedure, the
external resistance was changed incrementally, in steps of 500 Ω every 60 seconds, and
the anode potential, the cathode potential, and the cell current were measured. This
procedure highlights the inherent limitations of energy conversion in a microbial fuel
cell. A voltage/current characterization of the microbial fuel was also completed from the
data collected.
This dissertation also includes the evaluation of A Hands-On Introduction to
Microbial Fuel Cells, a laboratory developed for an introductory chemical and biological
engineering course. The experiment has been updated to include a voltage/current
characterization of the microbial fuel cell. Learning objectives have been identified and
pre- and post-laboratory activities have been developed for further implementation into a
chemical and biological engineering curriculum.
Page 13
1
INTRODUCTION
Biological Energy Conversion
Energy conversion facilitated by biological sources has traditionally been limited
by the significant expense as compared to traditional fossil fuel sources. As these fossil
fuels become scarce and energy becomes more expensive, alternative energy
technologies become more attractive. While a number of biological alternative energy
technologies currently exist, a complete understanding of these technologies has yet to be
developed. They are limited by the relatively few optimization processes that have been
employed thus far. Many of these technologies are relatively new and unproven at full-
scale production (Dresselhaus and Thomas 2001).
Moreover, the conversion of energy from biological sources is complex in that
one not only needs to collect and process the energy source, but also needs to cultivate
the organism and optimize the biological system for the maximum energy conversion
possible (Schenk, et al. 2008). This is the case both in the production of biofuels from
microalgae or the production of electricity in a microbial fuel cell (MFC).
The following sections of the introduction summarize the dissertation, which has
two major sections. The first two sections outline experimental work on algal biofilm
formation and characterization of microbial fuel cells, and the final two sections describe
the restructuring of a freshman level Introduction to Chemical and Biological engineering
course and the implementation of a microbial experiment into this course.
Page 14
2
Algal Biofilms
Chapter 2 examines Botryococcus braunii cell colony clusters as the basic
structure of a biofilm, not as an addition to a bacterial biofilm. B. braunii is a green
microalga which generally exists as a colony of individual cells supported by a colonial
matrix. B. braunii generally forms a colony unit by forming adhering “cups” and the units
vary in size from a few cells to thousands (Largeau, et al. 1980). A colony usually
consists of densely-packed conical cells radiating and branching from the center of a
roughly spherical unit. The increasing cost of traditional petroleum based fuels and the
worldwide interest in renewable energy sources has recently pushed the production of
algal biofuels into the forefront of biological energy conversion processes. Algal biofuels,
unlike some other biofuels, do not require current food sources for feedstock for
production. B. braunii is noted for the production of hydrocarbons that are readily
crackable into gasoline fractions (Hillen, et al. 1982); hydrocarbons are produced at a
high yield relative to the mass of the microalga (Casadevall, et al. 1985). It should be
noted that previous studies have indicated that hydrocarbon synthesis is not affected by
cell immobilization (Banerjee, et al. 2002). The hydrocarbons are generally located in a
cellular structure between an inner lamellar membrane and an outer membrane, but
hydrocarbons are also found in the extracellular region which also contains extracellular
polysaccharide in a trimellar region between cells (Largeau, et al. 1980). These
hydrocarbons, generally with 30+ carbon atoms per molecule and termed
“botryococcenes”, provide the colony with buoyancy (Metzger, et al. 1985) and may help
to take the algal cells to the air-water interface in an aqueous environment so the cells
Page 15
3
preferentially are able to absorb more light from the sun. The movement of
botryococcene out of the colony, shown in Figure 5, is consistent with hydrocarbon
formation between the cells. For many years, B. braunii has been examined at as a
commercial biofuels producing microalgae due to high hydrocarbon yields and carbon
dioxide biofixation (Akin, et al. 1993). The ease of removal of botryococcenes from the
colony, while maintaining cell viability, may have commercial potential. The findings in
this chapter help characterize these algal communities in a new way so that further
exploration might lead to a change in their carbon sequestration capacity and/or biofuels
production ability.
It is important to note that the laboratory research in Chapter 2 was completed by
multiple researchers. Specifically, any research relating to the surface attachment of
microalgae was performed by Narendren Jayawickramarajah. These results, included
here for context, were also included in Mr. Jayawickramarajah‟s thesis as well as in
Enhanced Conversion of CO2 by Structured Microorganisms, a technical report written
by research collaborators at Montana State University-Bozeman and the Idaho National
Laboratory. The information in Chapter 2 was, in part, researched, collected, assembled,
and often written by the author as part of this collaborative MSU/INL effort made up of
Greg Bala, Pete Pryfogle, Dr. John Sears, Narendren Jayawickramarajah and myself. It is
not the author‟s claim that he is solely responsible for these works, but that he was an
active part of this research process and that the authorship of this chapter was, in part, his.
Page 16
4
Power Measurements in Microbial Fuel Cells
Chapter 3 presents "Procedure for Determining Maximum Sustainable Power
Generated by Microbial Fuel Cells”. When this paper was published in Environmental
Science and Technology (ES&T), it was intended to offer a standardized method for
microbial fuel cell power generation that was simple and would provide a realistic view
as to the potential uses of microbial fuel cells outside of the laboratory. Although the
method for the determination of the maximum sustainable power has not been widely
adapted in the microbial fuel cell community, the message it presented was well received.
The microbial fuel cell community recognized that the power potential of microbial fuel
cells is limited and that the ultimate value of a microbial fuel cell will be tied to the
device it can power.
For the purposes of this dissertation, sustainable power can be interpreted to be
power that can be sustained at a relatively constant level for short periods of time (on the
order of 10 minutes or less). It is important to note that power degradation is still
observed over this time period (see Table 10).
In addition to the paper published in ES&T, Chapter 3 will also include a
discussion of the factors that influence microbial performance, a basic comparison to
other power producing devices (including traditional fuel cells and batteries), and
suggested changes to the terminology and data presentation of microbial fuel cell
research.
Page 17
5
Microbial Fuel Cells in Chemical and
Biological Engineering Laboratories
Also explored in this dissertation is the implementation of a state-of-the art
technology into an undergraduate chemical engineering curriculum. This advancement
requires not only knowledge of the technology itself, but also an understanding of what
will be taught, how it will be taught, and what effect the implementation of this
technology will have on the overall learning of the students.
The implementation of microbial fuel cells into a freshman-level hands-on
introduction to chemical engineering course is described and a complete description of
the resources needed to do so is documented. Chapter 4 gives a description of the state of
the course prior to implementing this curricular improvement. It also describes the
methods used to determine whether the curriculum change had an effect on student
learning. In Chapter 5, the microbial fuel cell experiment that was designed and included
in the course is presented and the impact of this fuel cell experiment on the course and on
student learning is measured.
Since it is not standard protocol that an instructor would evaluate the impact of a
curricular change in his/her course, some of the results presented here necessarily
represent the work of others. Dr. Betsy Palmer collected data and conducted interviews
for this evaluation of Chemical and Biological Engineering 100 (CHBE 100).
The author did, however, collect data and conduct interviews for the evaluation of
the CHBE 100 course in the fall of 2008 as he was not otherwise involved in the
instruction of the course that semester. He was solely responsible for the design of the
Page 18
6
microbial fuel cell laboratory and helped in the development and instruction of individual
laboratories in this course and in the departmental unit operations laboratory. He is
responsible for the initial design, implementation, and instruction of a student-designed
laboratory in CHBE 100.
Chapter 6 offers an updated microbial fuel cell experiment for laboratories in the
Chemical and Biological Engineering curriculum. This chapter also extends the microbial
fuel cell experiment to include characterization of the microbial fuel cell using the
traditional voltage/current (V-I) characteristic and proposes evaluation metrics for the
implementation of this experiment into the curriculum.
Page 19
7
ALGAE AS BIOFILMS
Introduction to Algal Biofilms
Characklis and Marshall define a biofilm (Characklis and Marshall 1990) as:
“cells immobilized at a substratum and frequently embedded in an organic polymer
matrix of microbial origin.” Biofilms represent a natural way of immobilizing cells and
developing a community response to their environment to gain an ecological advantage
(Hall-Stoodley and Stoodley 2002). Conversely, algae communities have generally been
described as “mats” or “colonies” (Wimpenny 2000), although the word “biofilm” has
occasionally been used (Jarvie, et al. 2002, Romani and Sabater 2000, Gilbert, McBain
and Rickard 2003, Crispim, Gaylarde and Gaylarde 2003, Jahnke and Priefer 2002, Paje,
et al. 2002). It has usually been assumed that biofilms are bacterial and the bacterial
extracellular polymeric substances (EPS) support structures act as the matrix, and algae
and yeasts are opportunistic additions to a biofilm. Wimpenny defines a biofilm as a
heterogeneous community of organisms that forms at a phase boundary and produces
EPS for adhesion, protection, and to facilitate community interactions; an algal mat, on
the other hand, is defined as a system of organisms with biology driven by photosynthesis
(Wimpenny 2000). Stoodley, et al. come to the conclusion: “Possibly we should not
restrict a biofilm model to certain structural constraints, but instead look for common
features or basic building blocks of biofilms which could be readily incorporated into
different structural models in a modular fashion (Stoodley, Boyle, et al. 1997).” Using the
approach of describing a biofilm based upon common features, these features might
Page 20
8
include attachment to a surface and development of sessile cell colonies in close
proximity, including the existence of an EPS matrix; association of other materials or
cells in a biofilm matrix; growth, detachment and attachment of a biofilm in a dynamic,
heterogeneous manner; and cell-cell communication and gene changes as the cells change
from a planktonic to a sessile state (Davies and Greensberg 1998). The microalgae B.
braunii has been extensively examined as a possible species to form hydrocarbon
biofuels photosynthetically (Akin, et al. 1993). It is interesting to determine if changes in
colony structure and associations occur in sessile algae cells, as in bacterial cells, and if
the resulting colonies can be called biofilms.
Materials and Methods
Organisms
B. braunii is found abundantly in fresh and brackish water (Wehr and Sheath
2003), so three different B. braunii isolates collected from freshwater lakes in Minnesota
and Iowa were used, courtesy of the late Dr. David Czarnecki from the Loras College
Freshwater Diatom Culture Collection. B. braunii (572 Kutz culture) from the Culture
Collection of Algae at the University of Texas at Austin was also used in
experimentation. Note that LB strains have associated bacterial contamination as the L
indentifies the culture as liquid, and the B identifies the culture as xenic.
Page 21
9
Media
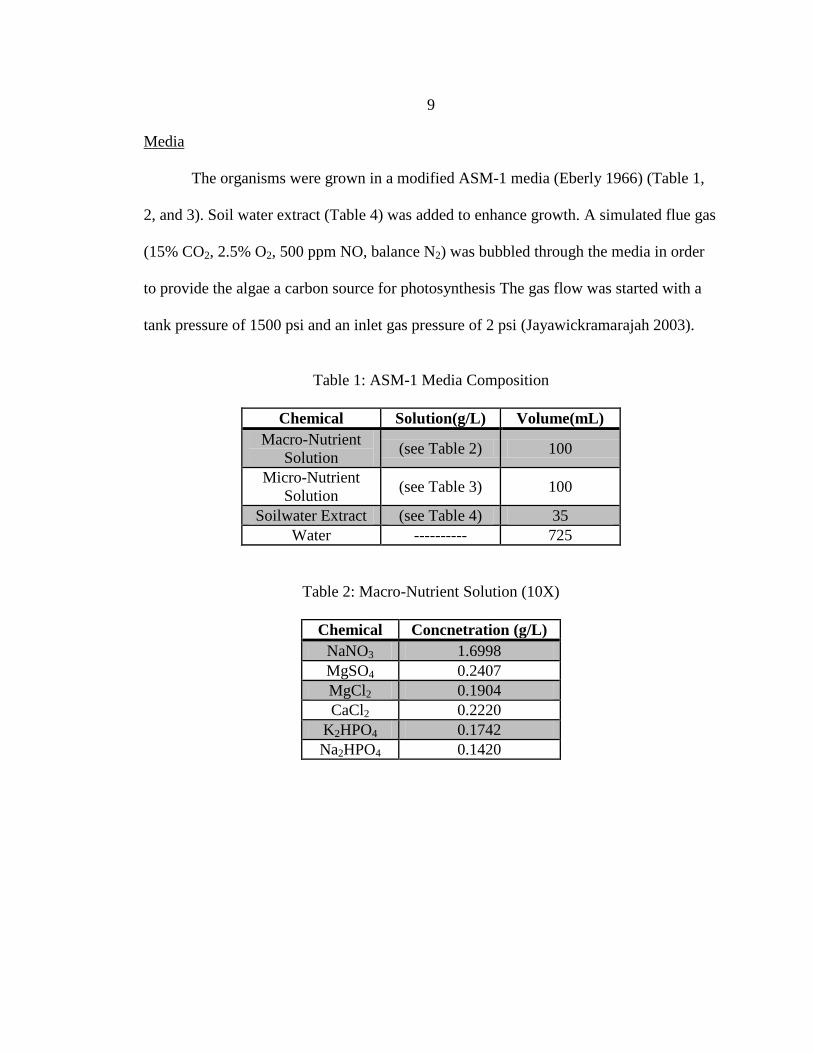
The organisms were grown in a modified ASM-1 media (Eberly 1966) (Table 1,
2, and 3). Soil water extract (Table 4) was added to enhance growth. A simulated flue gas
(15% CO2, 2.5% O2, 500 ppm NO, balance N2) was bubbled through the media in order
to provide the algae a carbon source for photosynthesis The gas flow was started with a
tank pressure of 1500 psi and an inlet gas pressure of 2 psi (Jayawickramarajah 2003).
Table 1: ASM-1 Media Composition
Chemical Solution(g/L) Volume(mL)
Macro-Nutrient
Solution (see Table 2) 100
Micro-Nutrient
Solution (see Table 3) 100
Soilwater Extract (see Table 4) 35
Water ---------- 725
Table 2: Macro-Nutrient Solution (10X)
Chemical Concnetration (g/L)
NaNO3 1.6998
MgSO4 0.2407
MgCl2 0.1904
CaCl2 0.2220
K2HPO4 0.1742
Na2HPO4 0.1420
Page 22
10
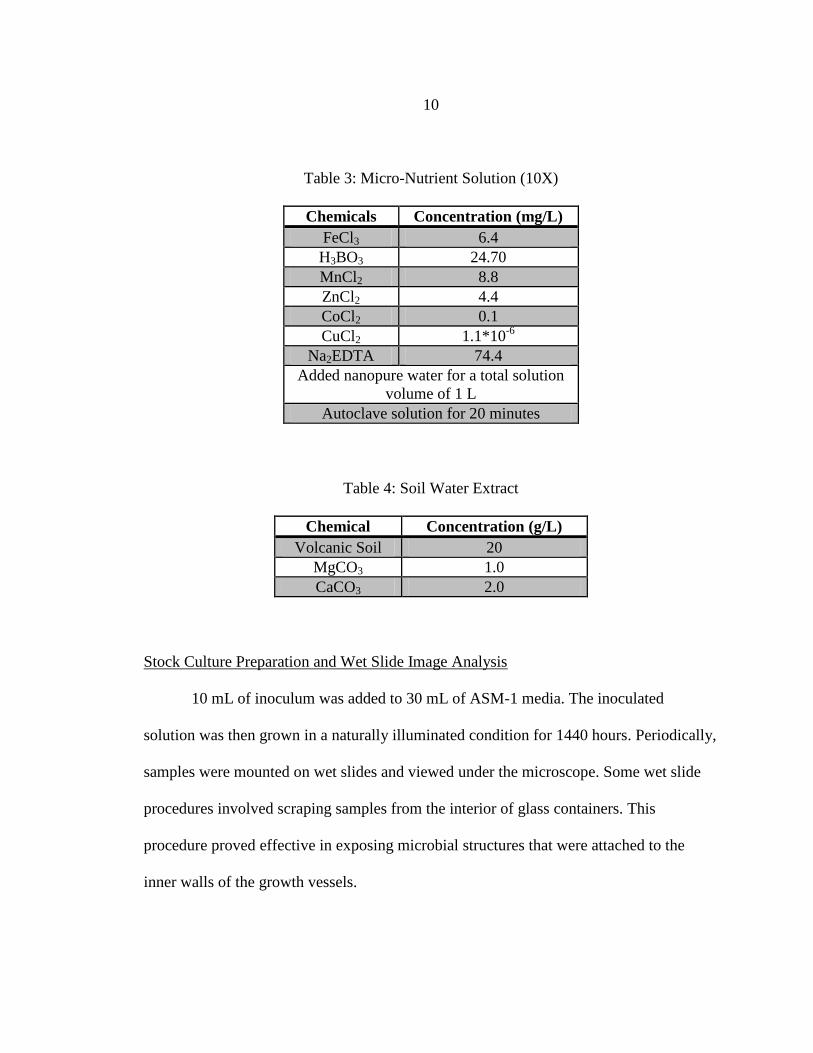
Table 3: Micro-Nutrient Solution (10X)
Chemicals Concentration (mg/L)
FeCl3 6.4
H3BO3 24.70
MnCl2 8.8
ZnCl2 4.4
CoCl2 0.1
CuCl2 1.1*10-6
Na2EDTA 74.4
Added nanopure water for a total solution
volume of 1 L
Autoclave solution for 20 minutes
Table 4: Soil Water Extract
Chemical Concentration (g/L)
Volcanic Soil 20
MgCO3 1.0
CaCO3 2.0
Stock Culture Preparation and Wet Slide Image Analysis
10 mL of inoculum was added to 30 mL of ASM-1 media. The inoculated
solution was then grown in a naturally illuminated condition for 1440 hours. Periodically,
samples were mounted on wet slides and viewed under the microscope. Some wet slide
procedures involved scraping samples from the interior of glass containers. This
procedure proved effective in exposing microbial structures that were attached to the
inner walls of the growth vessels.
Page 23
11
Flow Cell and Reactor System
The system consisted of the simulated flue gas (Air Liquide Specialty Gases),
growth tank, illumination bulb, stir plate, recycle/mixing tank, bubble trap, inoculation
port, parallel-plate flow cell, peristaltic pumps, tubing, and connectors. A bubble trap was
used to prevent air bubbles from disrupting biofilm formation. The entire system was
placed on a mobile setting so that it could be moved to and from a Nikon Eclipses 800
microscope equipped with an Hg bulb. The parallel-plate flow cell was used to study the
attachment and detachment phenomena of B. braunii and associated organisms. The
parallel-plate flow cell used in this study was similar to the flow cell used by Rice, et al.
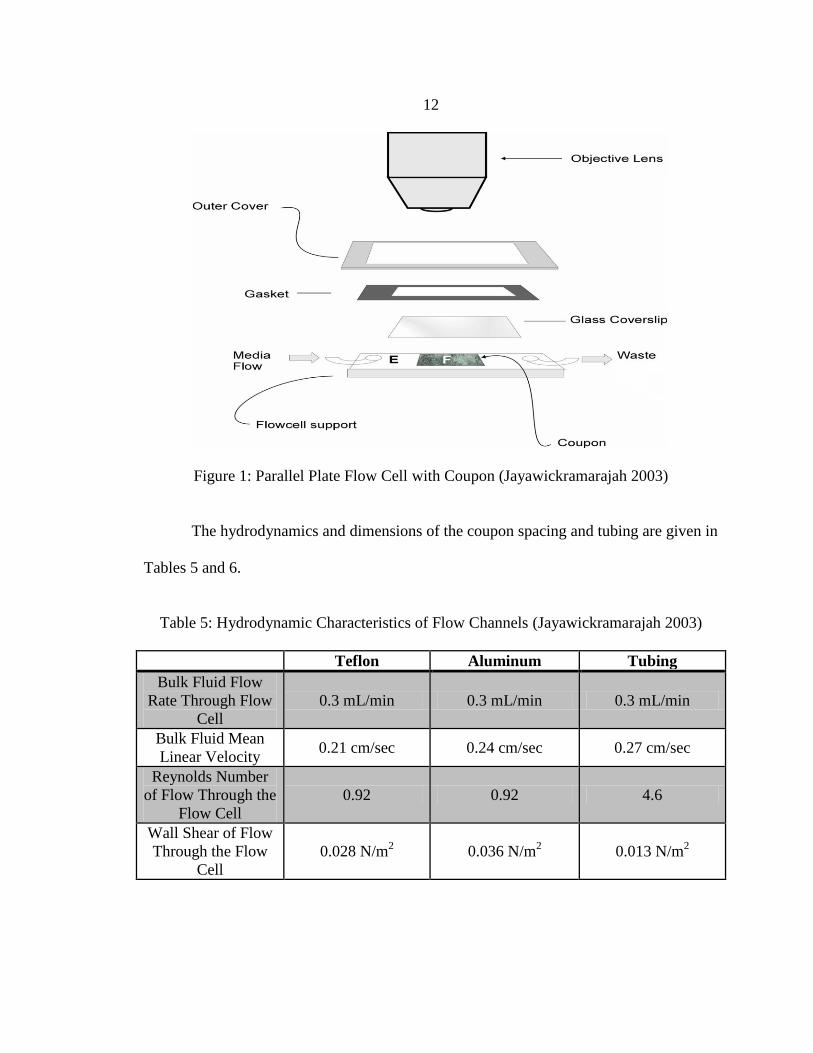
(Rice, Hamilton and Camper 2000). Figure 1 shows the basic components of the parallel
plate flow cell. The bottom plate contains a sunken well where a coupon can be inserted.
Different coupons (aluminum and Teflon) were placed in the bottom of the cell to
examine adherence of cells to different surfaces. The top plate of the rectangular flow
conduit was a glass cover slip (43 X 61 mm). The glass cover slip serves as an
observation window and also allows light to penetrate to the photosynthetic cells attached
to the coupon surface.
Page 24
12
Figure 1: Parallel Plate Flow Cell with Coupon (Jayawickramarajah 2003)
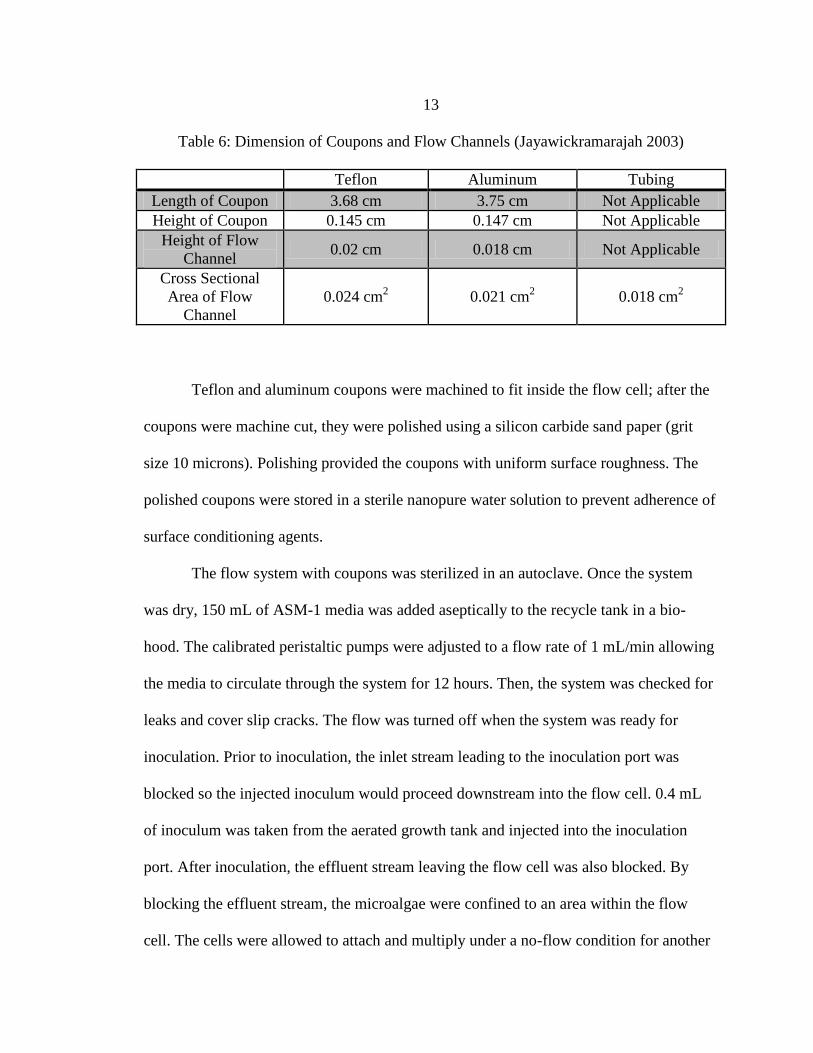
The hydrodynamics and dimensions of the coupon spacing and tubing are given in
Tables 5 and 6.
Table 5: Hydrodynamic Characteristics of Flow Channels (Jayawickramarajah 2003)
Teflon Aluminum Tubing
Bulk Fluid Flow
Rate Through Flow
Cell
0.3 mL/min 0.3 mL/min 0.3 mL/min
Bulk Fluid Mean
Linear Velocity 0.21 cm/sec 0.24 cm/sec 0.27 cm/sec
Reynolds Number
of Flow Through the
Flow Cell
0.92 0.92 4.6
Wall Shear of Flow
Through the Flow
Cell
0.028 N/m2 0.036 N/m
2 0.013 N/m
2
Page 25
13
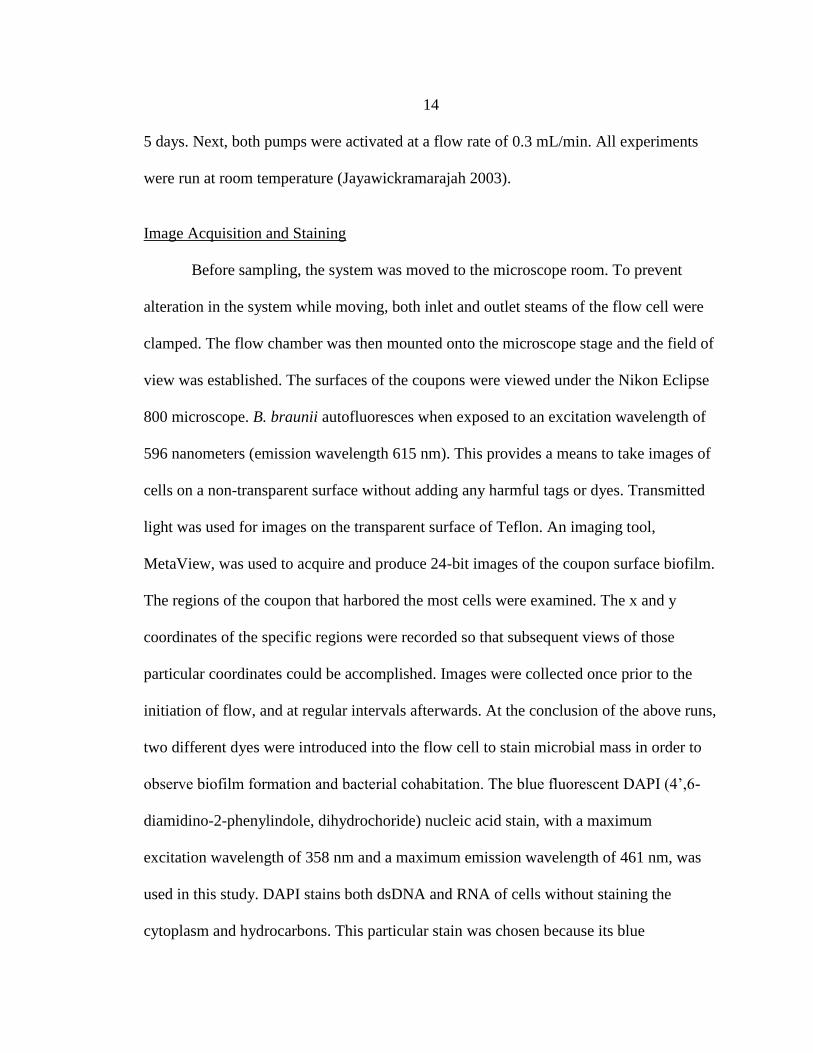
Table 6: Dimension of Coupons and Flow Channels (Jayawickramarajah 2003)
Teflon Aluminum Tubing
Length of Coupon 3.68 cm 3.75 cm Not Applicable
Height of Coupon 0.145 cm 0.147 cm Not Applicable
Height of Flow
Channel 0.02 cm 0.018 cm Not Applicable
Cross Sectional
Area of Flow
Channel
0.024 cm2
0.021 cm2 0.018 cm
2
Teflon and aluminum coupons were machined to fit inside the flow cell; after the
coupons were machine cut, they were polished using a silicon carbide sand paper (grit
size 10 microns). Polishing provided the coupons with uniform surface roughness. The
polished coupons were stored in a sterile nanopure water solution to prevent adherence of
surface conditioning agents.
The flow system with coupons was sterilized in an autoclave. Once the system
was dry, 150 mL of ASM-1 media was added aseptically to the recycle tank in a bio-
hood. The calibrated peristaltic pumps were adjusted to a flow rate of 1 mL/min allowing
the media to circulate through the system for 12 hours. Then, the system was checked for
leaks and cover slip cracks. The flow was turned off when the system was ready for
inoculation. Prior to inoculation, the inlet stream leading to the inoculation port was
blocked so the injected inoculum would proceed downstream into the flow cell. 0.4 mL
of inoculum was taken from the aerated growth tank and injected into the inoculation
port. After inoculation, the effluent stream leaving the flow cell was also blocked. By
blocking the effluent stream, the microalgae were confined to an area within the flow
cell. The cells were allowed to attach and multiply under a no-flow condition for another
Page 26
14
5 days. Next, both pumps were activated at a flow rate of 0.3 mL/min. All experiments
were run at room temperature (Jayawickramarajah 2003).
Image Acquisition and Staining
Before sampling, the system was moved to the microscope room. To prevent
alteration in the system while moving, both inlet and outlet steams of the flow cell were
clamped. The flow chamber was then mounted onto the microscope stage and the field of
view was established. The surfaces of the coupons were viewed under the Nikon Eclipse
800 microscope. B. braunii autofluoresces when exposed to an excitation wavelength of
596 nanometers (emission wavelength 615 nm). This provides a means to take images of
cells on a non-transparent surface without adding any harmful tags or dyes. Transmitted
light was used for images on the transparent surface of Teflon. An imaging tool,
MetaView, was used to acquire and produce 24-bit images of the coupon surface biofilm.
The regions of the coupon that harbored the most cells were examined. The x and y
coordinates of the specific regions were recorded so that subsequent views of those
particular coordinates could be accomplished. Images were collected once prior to the
initiation of flow, and at regular intervals afterwards. At the conclusion of the above runs,
two different dyes were introduced into the flow cell to stain microbial mass in order to
observe biofilm formation and bacterial cohabitation. The blue fluorescent DAPI (4‟,6-
diamidino-2-phenylindole, dihydrochoride) nucleic acid stain, with a maximum
excitation wavelength of 358 nm and a maximum emission wavelength of 461 nm, was
used in this study. DAPI stains both dsDNA and RNA of cells without staining the
cytoplasm and hydrocarbons. This particular stain was chosen because its blue
Page 27
15
fluorescence stands out in contrast to the red auto-fluorescence of the algal cells. In
certain flow-cell runs, the dye rhodamine B was also used to identify matrix formation.
To introduce the dyes, the tubing directly upstream of the inoculation port and
directly downsteam of the flow-cell were clamped shut. Then the clamped section,
including both the inoculation port and the flow-cell, were disconnected from the system.
The stream leading away from the flow cell was unclamped so that any solution injected
through the inoculation port would proceed through the flow channel. DAPI solution (0.8
mL) was then injected (5 mg/mL) into the flow cell. The open end was closed and the
stain was allowed to fixate for 15 minutes. After fixation, the stream was reopened and 3
mL of fresh media was injected through the inoculation port. The media was used to
washout unbound DAPI particles and unattached cells that would otherwise produce
blurred images. The staining procedure for rhodamine B was almost identical to the
procedure used for DAPI, but 10 times as much fresh media was used in the washout
step.
The DAPI-stained flow cell was viewed under a mercury-arc lamp. By using the
wavelengths between 596-615 nm for autoflorescence and wavelengths of 358-461 nm
for DAPI, two distinct images of the same surface were obtained. The two images could
be combined using the color-combine function built in to the MetaView soft-ware. The
rhodamine B dye was prevalent when viewed at wavelengths between of 500-600 nm,
and again color-combined images could be built (Jayawickramarajah 2003).
Page 28
16
Results
Wet Slide Analysis and Observations
Images of B. braunii did not show much variation from a young culture to an aged
culture. B. braunii is slow growing (exponential phase doubling times were found to be
as fast as 1 day and regularly at 3-4 days), and sufficient sampling volumes were not
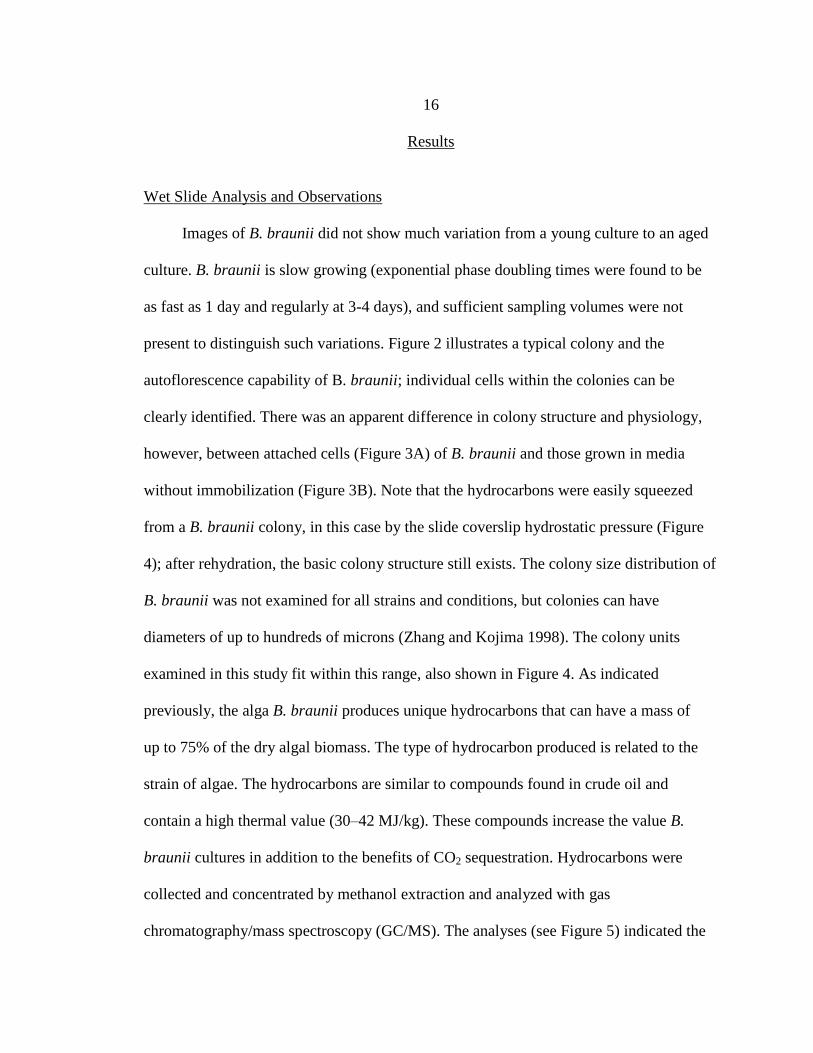
present to distinguish such variations. Figure 2 illustrates a typical colony and the
autoflorescence capability of B. braunii; individual cells within the colonies can be
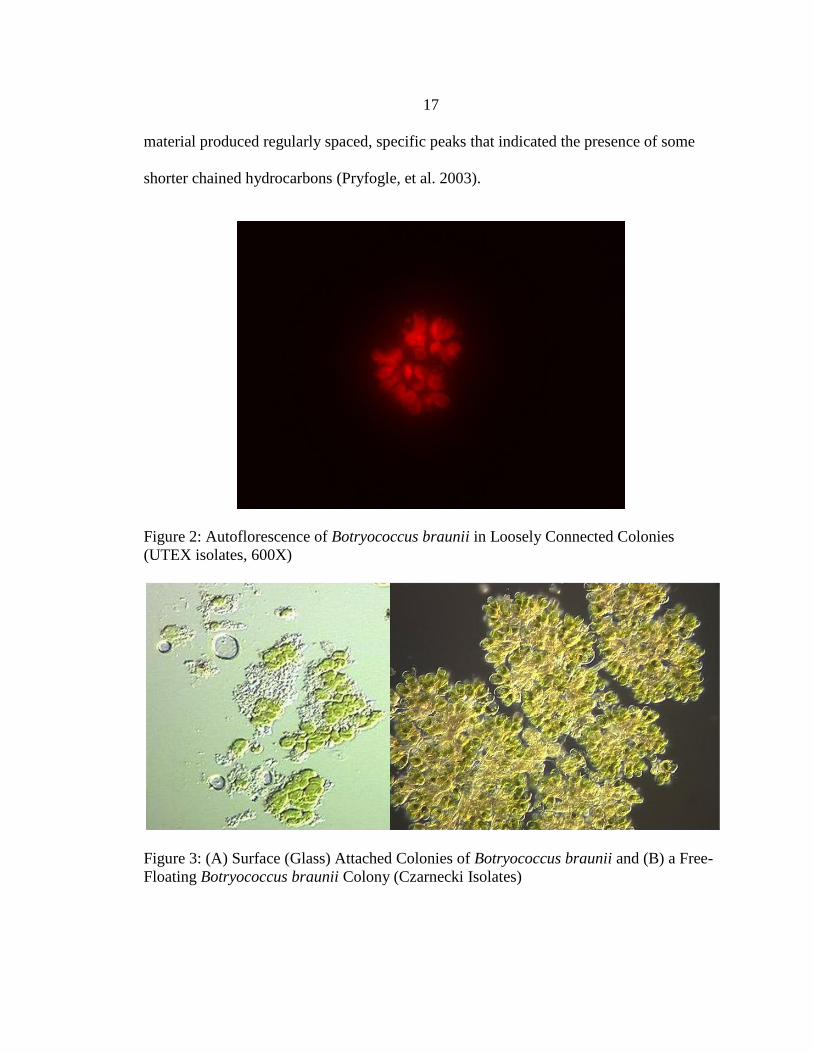
clearly identified. There was an apparent difference in colony structure and physiology,
however, between attached cells (Figure 3A) of B. braunii and those grown in media
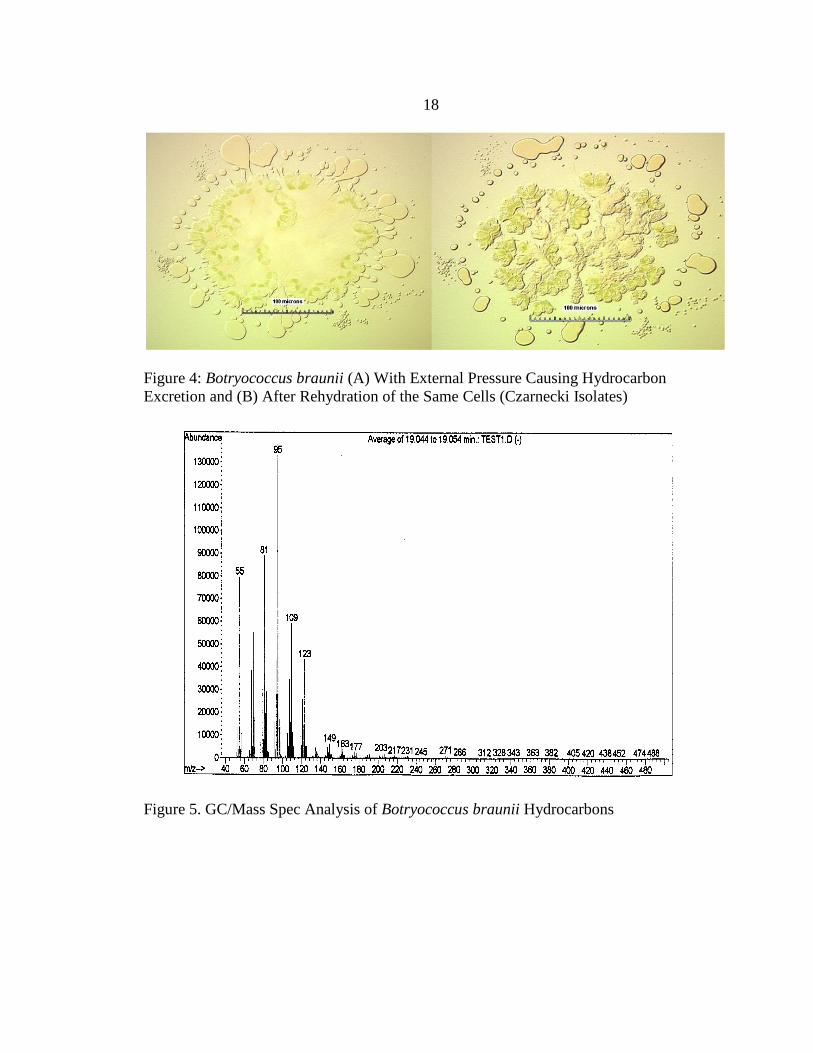
without immobilization (Figure 3B). Note that the hydrocarbons were easily squeezed
from a B. braunii colony, in this case by the slide coverslip hydrostatic pressure (Figure
4); after rehydration, the basic colony structure still exists. The colony size distribution of
B. braunii was not examined for all strains and conditions, but colonies can have
diameters of up to hundreds of microns (Zhang and Kojima 1998). The colony units
examined in this study fit within this range, also shown in Figure 4. As indicated
previously, the alga B. braunii produces unique hydrocarbons that can have a mass of
up to 75% of the dry algal biomass. The type of hydrocarbon produced is related to the
strain of algae. The hydrocarbons are similar to compounds found in crude oil and
contain a high thermal value (30–42 MJ/kg). These compounds increase the value B.
braunii cultures in addition to the benefits of CO2 sequestration. Hydrocarbons were
collected and concentrated by methanol extraction and analyzed with gas
chromatography/mass spectroscopy (GC/MS). The analyses (see Figure 5) indicated the
Page 29
17
material produced regularly spaced, specific peaks that indicated the presence of some
shorter chained hydrocarbons (Pryfogle, et al. 2003).
Figure 2: Autoflorescence of Botryococcus braunii in Loosely Connected Colonies
(UTEX isolates, 600X)
Figure 3: (A) Surface (Glass) Attached Colonies of Botryococcus braunii and (B) a Free-
Floating Botryococcus braunii Colony (Czarnecki Isolates)
Page 30
18
Figure 4: Botryococcus braunii (A) With External Pressure Causing Hydrocarbon
Excretion and (B) After Rehydration of the Same Cells (Czarnecki Isolates)
Figure 5. GC/Mass Spec Analysis of Botryococcus braunii Hydrocarbons
Page 31
19
B. braunii on Aluminum
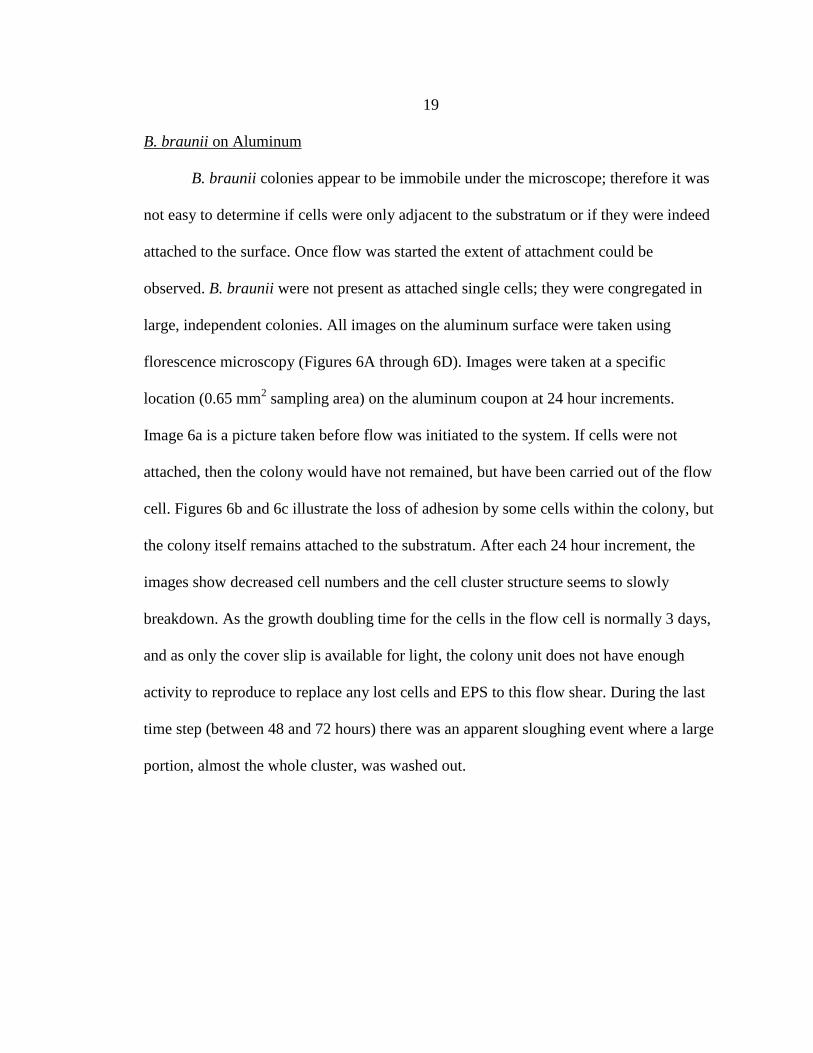
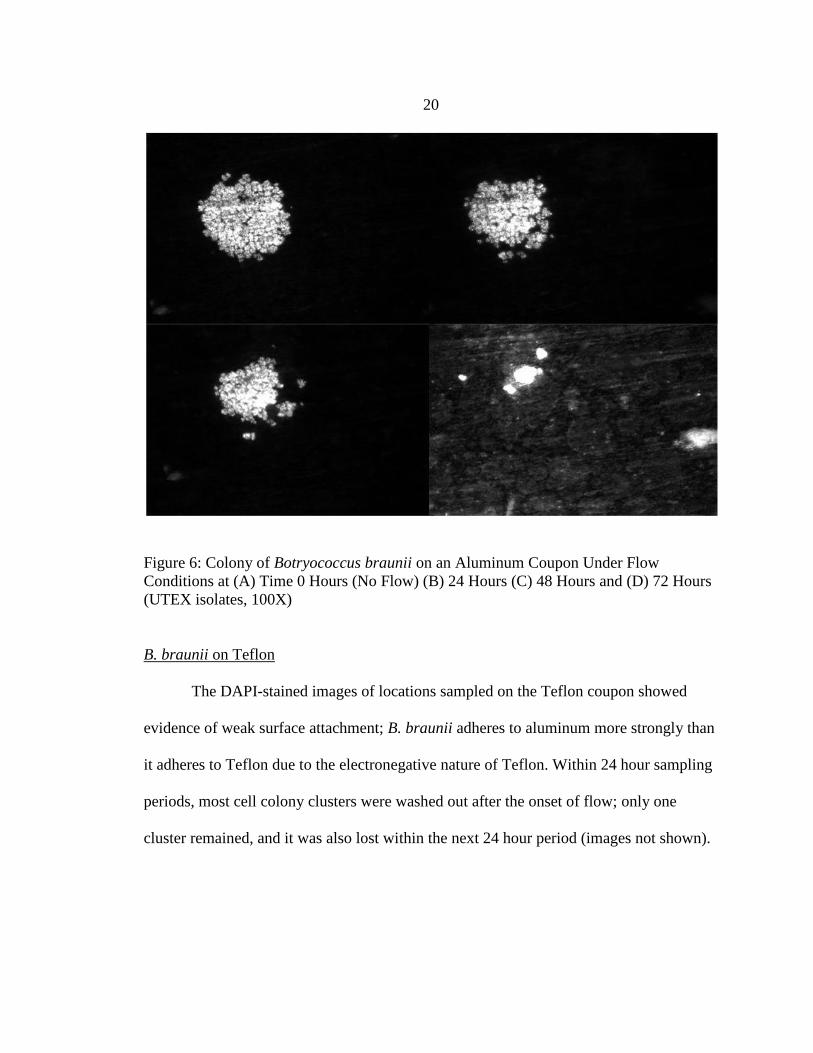
B. braunii colonies appear to be immobile under the microscope; therefore it was
not easy to determine if cells were only adjacent to the substratum or if they were indeed
attached to the surface. Once flow was started the extent of attachment could be
observed. B. braunii were not present as attached single cells; they were congregated in
large, independent colonies. All images on the aluminum surface were taken using
florescence microscopy (Figures 6A through 6D). Images were taken at a specific
location (0.65 mm2 sampling area) on the aluminum coupon at 24 hour increments.
Image 6a is a picture taken before flow was initiated to the system. If cells were not
attached, then the colony would have not remained, but have been carried out of the flow
cell. Figures 6b and 6c illustrate the loss of adhesion by some cells within the colony, but
the colony itself remains attached to the substratum. After each 24 hour increment, the
images show decreased cell numbers and the cell cluster structure seems to slowly
breakdown. As the growth doubling time for the cells in the flow cell is normally 3 days,
and as only the cover slip is available for light, the colony unit does not have enough
activity to reproduce to replace any lost cells and EPS to this flow shear. During the last
time step (between 48 and 72 hours) there was an apparent sloughing event where a large
portion, almost the whole cluster, was washed out.
Page 32
20
Figure 6: Colony of Botryococcus braunii on an Aluminum Coupon Under Flow
Conditions at (A) Time 0 Hours (No Flow) (B) 24 Hours (C) 48 Hours and (D) 72 Hours
(UTEX isolates, 100X)
B. braunii on Teflon
The DAPI-stained images of locations sampled on the Teflon coupon showed
evidence of weak surface attachment; B. braunii adheres to aluminum more strongly than
it adheres to Teflon due to the electronegative nature of Teflon. Within 24 hour sampling
periods, most cell colony clusters were washed out after the onset of flow; only one
cluster remained, and it was also lost within the next 24 hour period (images not shown).
Page 33
21
Image Analysis with Stain
After completion of the time-dependent experiments, the flow channel was
stained with either DAPI or rhodamine B dye to observe biofilm formation and bacterial
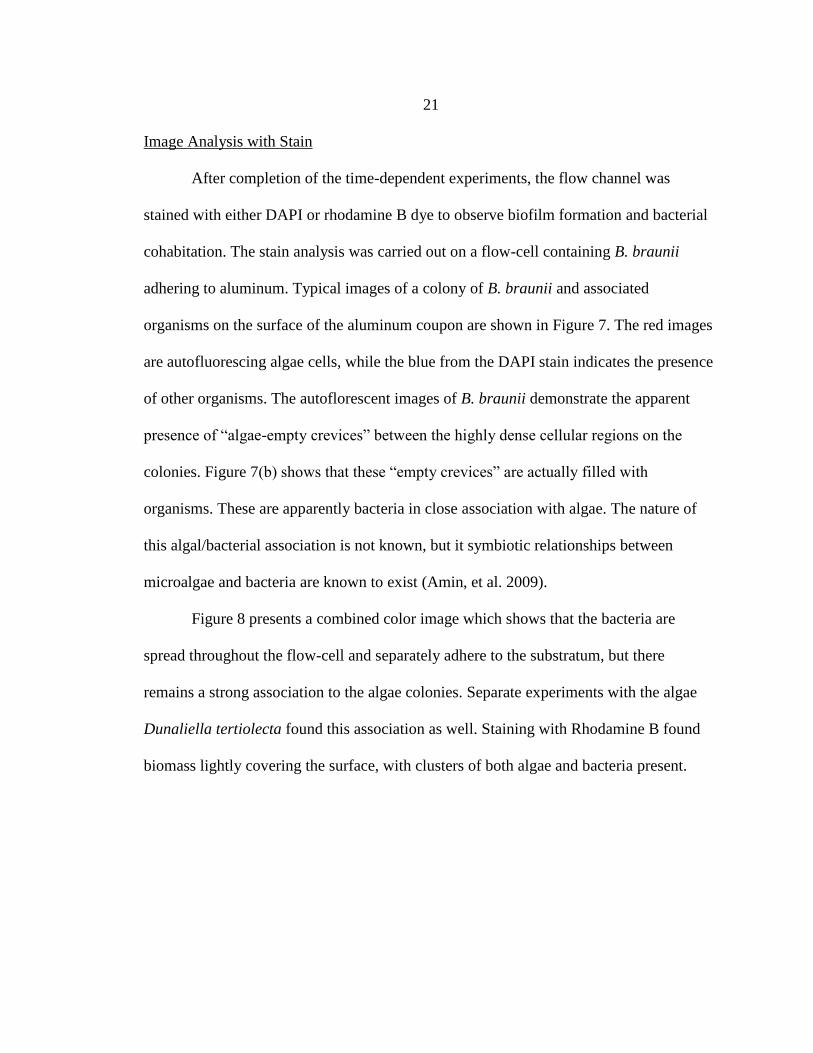
cohabitation. The stain analysis was carried out on a flow-cell containing B. braunii
adhering to aluminum. Typical images of a colony of B. braunii and associated
organisms on the surface of the aluminum coupon are shown in Figure 7. The red images
are autofluorescing algae cells, while the blue from the DAPI stain indicates the presence
of other organisms. The autoflorescent images of B. braunii demonstrate the apparent
presence of “algae-empty crevices” between the highly dense cellular regions on the
colonies. Figure 7(b) shows that these “empty crevices” are actually filled with
organisms. These are apparently bacteria in close association with algae. The nature of
this algal/bacterial association is not known, but it symbiotic relationships between
microalgae and bacteria are known to exist (Amin, et al. 2009).
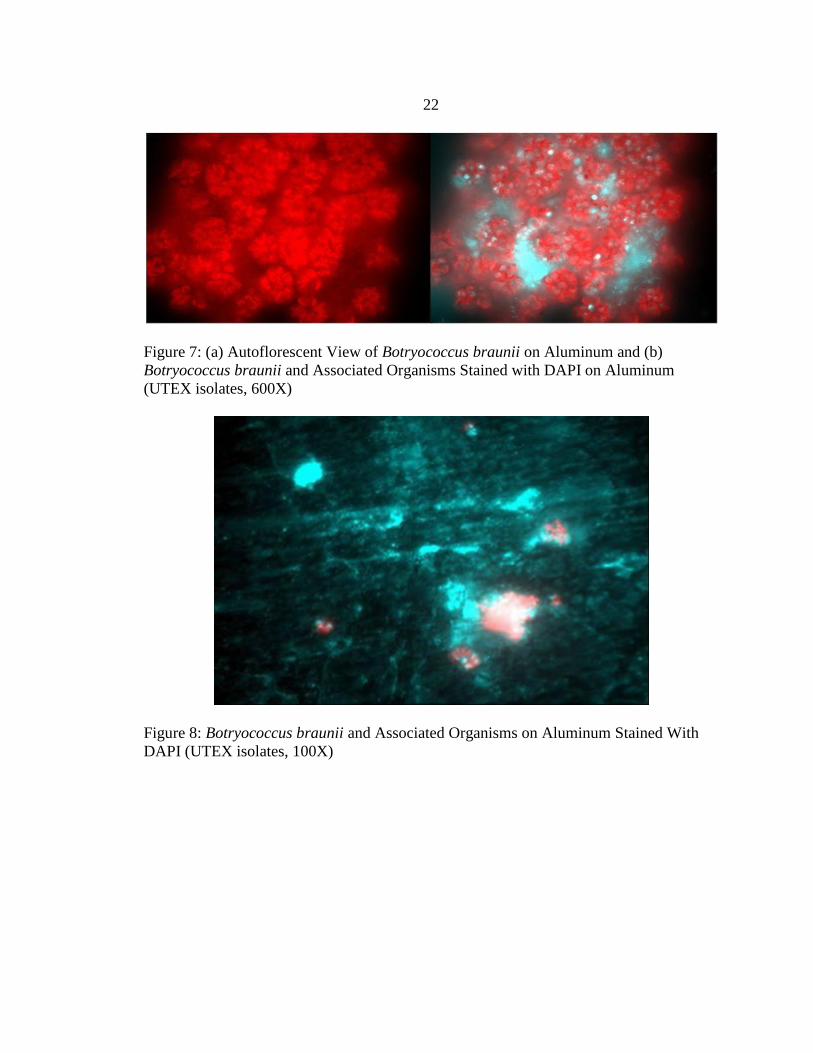
Figure 8 presents a combined color image which shows that the bacteria are
spread throughout the flow-cell and separately adhere to the substratum, but there
remains a strong association to the algae colonies. Separate experiments with the algae
Dunaliella tertiolecta found this association as well. Staining with Rhodamine B found
biomass lightly covering the surface, with clusters of both algae and bacteria present.
Page 34
22
Figure 7: (a) Autoflorescent View of Botryococcus braunii on Aluminum and (b)
Botryococcus braunii and Associated Organisms Stained with DAPI on Aluminum
(UTEX isolates, 600X)
Figure 8: Botryococcus braunii and Associated Organisms on Aluminum Stained With
DAPI (UTEX isolates, 100X)
Page 35
23
Discussion of Algae as Biofilms
The apparent detachment and sloughing events shown in Figure 6 were the first
images explicitly demonstrating this phenomenon in microalgae. The sloughing event is
reminiscent of the sloughing of an entire section of bacteria observed by Stoodley, et al.
(Stoodley, Wilson, et al. 2001). The detachment trend in Figure 6 is observed in most of
the sampled locations, in that there was gradual erosion of cells from the periphery of the
colony, followed by detachment of the colony itself. As time passes, there is likely a
threshold where shear force breaks the bonds attaching the remaining colony to the
substratum. Future work should include identification of the variables that cause algal
communities to detach. This visual erosion and sloughing event is strikingly similar to
that found in bacterial biofilms. These images present the characteristic features of a
biofilm of attachment, detachment, and sloughing. The weak adherence on Teflon, a
smooth, hydrophobic surface is similar to weak bacterial biofilm adherence to smooth
surfaces (Mueller, et al. 1992, Scheuerman, Camper and Hamilton 1998). Figure 7
identifies bacterial association, which is to be expected as bacteria are often associated
with algae and the utilized isolates also contained bacteria. The nature of this association,
however, is not known at this time.
Casadevall, et al. showed that the cells of B. braunii are capable of both
hydrocarbon production and active cell division early in the exponential growth stage
(Casadevall, et al. 1985). The botyrococcene hydrocarbons are usually concentrated
within the outer walls (sometimes outside) of B. braunii cells (Largeau, et al. 1980). As
the media included no organic carbon, the primary carbon substrate for the bacteria must
Page 36
24
come from algal photosynthesis, which would explain a close association. Some of the
bacteria generally associated with B. braunii are species of Pseudomonas,
Flavobacterium, and Alcaligenes. The Pseudomonas and Flavobacterium species that are
known to be present in these algal cultures are capable of growing on hydrocarbons as
their sole organic carbon source (Chirac, et al. 1985). It is also possible that these
seemingly empty areas contain the extracellular products from algae. These products
would include the algal hydrocarbon botryococcene and polysaccharides (hydrocarbons
and polysaccharides will not appear in autoflorescent images). Polysaccharidic fibrils
were previously shown to be attached to B. braunii cells (Fernandes, et al. 1991). The
images from Figure 7 support the contention that the colony of B. braunii is the main
structure, and the bacteria are associated with the biofilm structure and not providing the
structure. In the absence of associated microorganisms, however, B. braunii has been
reported to lose aspects of its colonial habitat (Murray & Thomson, 1977). Since
associated organisms might affect the cell-cell adhesion within the algal colony, the idea
that bacteria could also be involved in the adhesion of the algae to the substratum must be
retained, although the present results indicate that bacteria are not necessarily needed in
adhesion.
These results indicate that these algae exhibit many characteristics of biofilms:
adherence; detachment and sloughing; difference in structure of an attached colony;
varying strength of attachment on different surfaces; association of other organisms in an
EPS matrix; and the heterogeneous nature of attached colonies. The examination of gene
change upon attachment was beyond the scope of the present study, but this should be
Page 37
25
examined, as such results have been reported in bacterial biofilms (Xu, et al. 2001).
Although there is not indisputable evidence that microalgae form a biofilm with all
characteristics normally associated with bacterial biofilms, there is enough evidence to
further examine the behavior of microalgae with special attention to events related to
biofilm development. Insight into behavior of B. braunii as a biofilm may lead to
advances that will compliment contemporary research, as well as stand alone as an early
study of biofilm development by microalgae.
Page 38
26
CHARACTERIZATION OF A MICROBIAL FUEL CELL
Introduction to Microbial Fuel Cells
The microbial (or biological) fuel cell was described in 1969 as an
“electrochemical energy converter” (Bockris and Srinivasan 1969). In the 1990‟s, Allen
and Bennetto described a microbial fuel cell as able to withdraw electrons from the
oxidation of a carbohydrate (glucose) as electrical energy (Allen and Bennetto 1993). A
microbial fuel cell, like other electrochemical cells, has both an anode and a cathode,
separated by a semi-permeable ion conducting electrolyte membrane. Bacteria in the
anodic compartment facilitate the liberation of electrons through a microbial oxidation
reaction. These electrons are consumed in the cathodic compartment for the reduction of
another chemical species, often oxygen. The flow of electrons occurs through an external
load in order to produce electric power. This flow of electrons is balanced with a flow of
cations through the semi-permeable electrolyte membrane.
In a microbial fuel cell, the electrical power produced is generally low when
compared to other conventional fuel cells. This is because of the inherent limitation on
current in a microbial fuel cell. Because there is a limit to the electrons that can be
liberated, the maximum possible current can be calculated. This calculation assumes that
every mol of glucose in the growth media is used for the generation of electrons. For
every mol of glucose oxidized, 24 mols of electrons are produced. This relationship is
given as Figure 1 and can be found in the discussion of the anodic compartment of the
microbial fuel cell later in this chapter. Because there are 6.023*1023
electrons in a mol of
Page 39
27
electrons, there are 1.46*1025
electrons for every mol of glucose oxidized. A growth
media that has 1 g/L (or 0.00555 mol/L) glucose will have 8.024*1022
available electrons
in every liter. If the flow rate of growth media into the microbial fuel cell is 0.3
mL/minute, there will be 2.41*1019
electrons/minute (4.012*1017
electrons/second)
available. Again, this assumes that all of the glucose in the growth media is used for
current generation. One ampere of electricity is equivalent to 6.242*1018
electrons
passing through a point every second. Therefore, the maximum possible current that this
microbial fuel cell could possibly produce is 64.3 mA. Though it is unreasonable to think
that the microorganism uses all of the glucose in the growth media for the production of
electrons, it does provide an upper bound by which one can compare the current
produced to the maximum current available. In the case of this study, the maximum
current that could be sustained over a short time period is approximately 125 µA.
Therefore, only 0.19% of the electrons available in the growth media were actually used
in current generation.
Finally, the ceiling on the current available in any microbial fuel cell is dependent
on the glucose concentration in the growth media. This assumes that the concentration of
glucose in a growth media should be no greater than 60 g/L in order to avoid toxicity to
the microorganism. The theoretical limit of current corresponding to this maximum
glucose concentration is 3.86 A. There is a possibility of stacking microbial fuel cells to
increase the total voltage, but charge reversal did occur in one study, causing one cell to
reverse polarity (Oh and Logan 2007). A capacitor was successfully used to store energy
Page 40
28
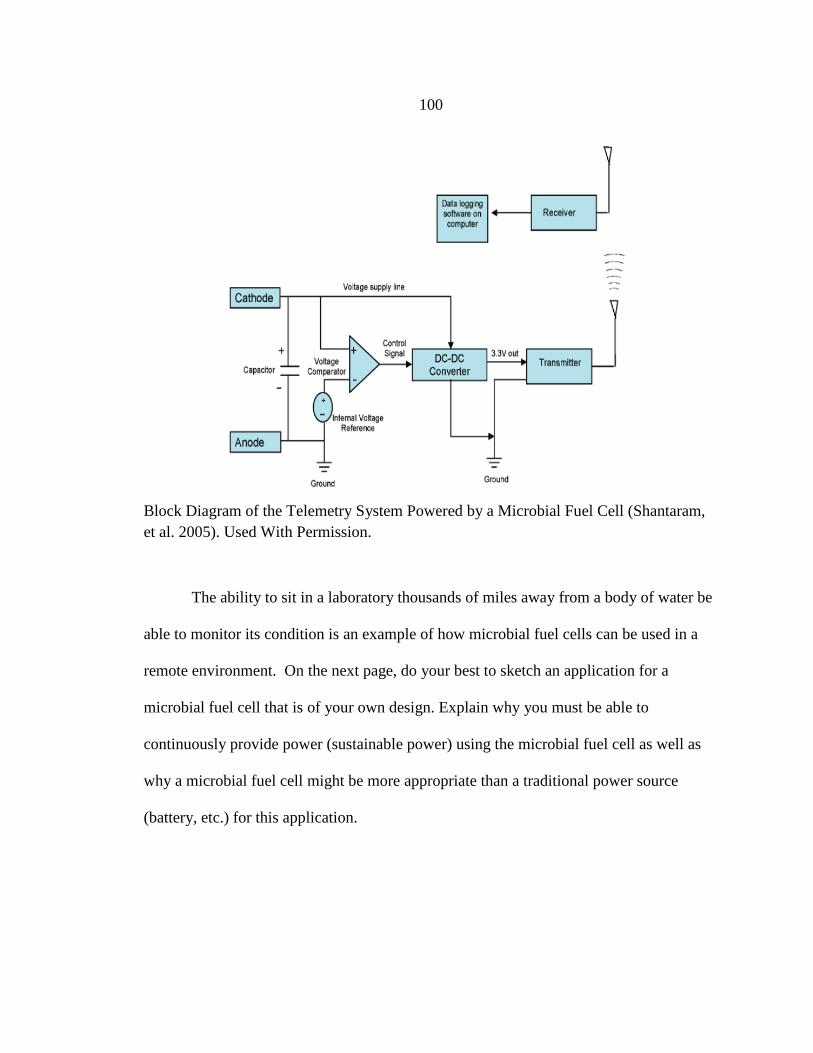
in the powering of a wireless sensor (Shantaram, et al. 2005). This allows for a greater
load to be powered by a microbial fuel cell, if only for a short period of time.
There are some comparisons that can be drawn between microbial fuel cells and
other similar power sources, (e.g. fuel cells, batteries). For instance, the power derived
from the cell is limited by the cell potential. Like all fuel cells, the performance of a
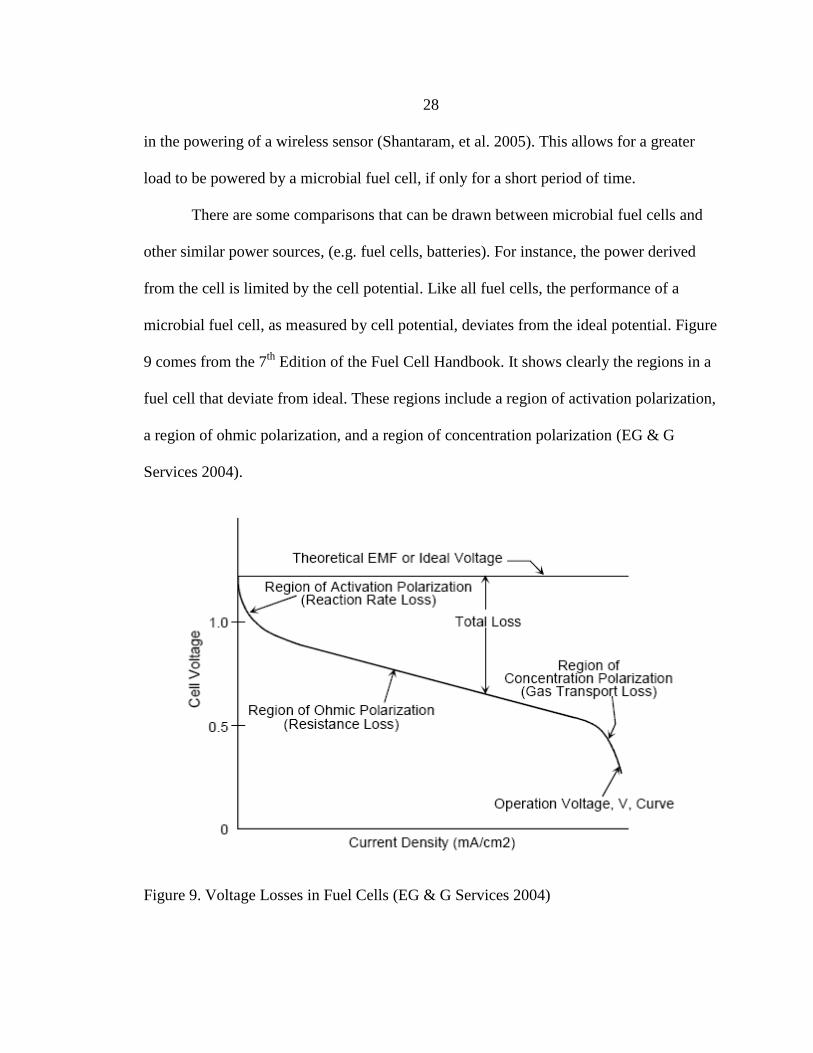
microbial fuel cell, as measured by cell potential, deviates from the ideal potential. Figure
9 comes from the 7th
Edition of the Fuel Cell Handbook. It shows clearly the regions in a
fuel cell that deviate from ideal. These regions include a region of activation polarization,
a region of ohmic polarization, and a region of concentration polarization (EG & G
Services 2004).
Figure 9. Voltage Losses in Fuel Cells (EG & G Services 2004)
Page 41
29
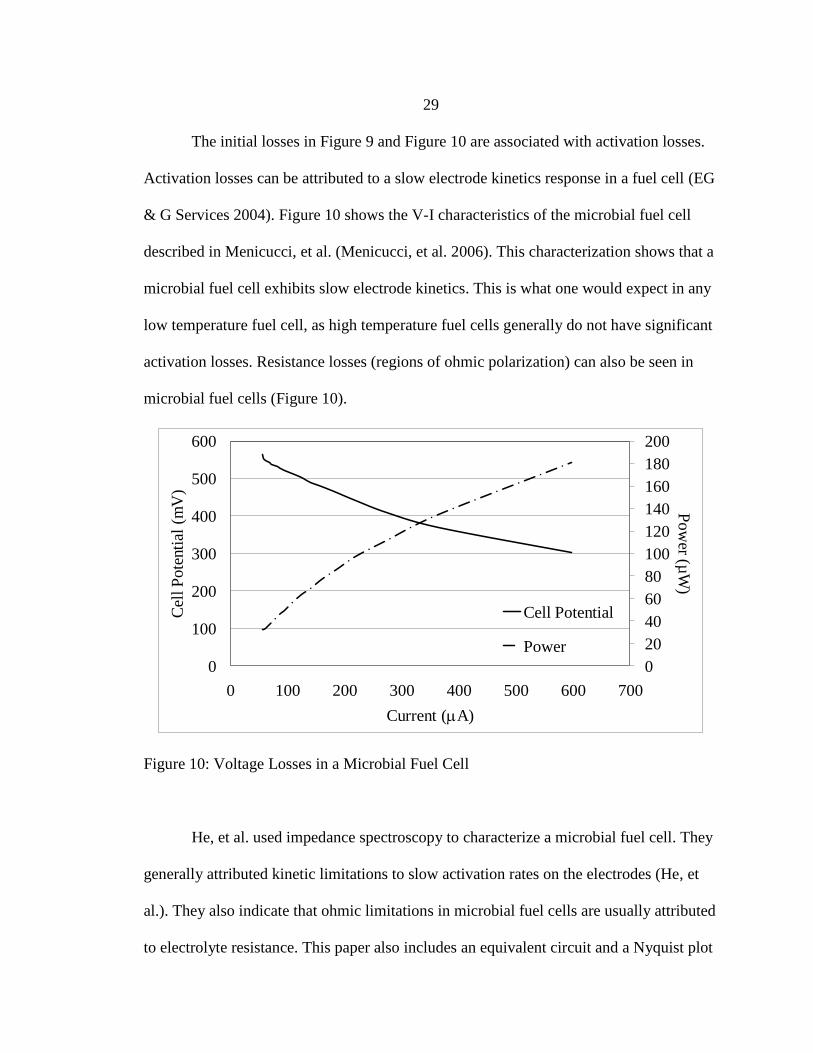
The initial losses in Figure 9 and Figure 10 are associated with activation losses.
Activation losses can be attributed to a slow electrode kinetics response in a fuel cell (EG
& G Services 2004). Figure 10 shows the V-I characteristics of the microbial fuel cell
described in Menicucci, et al. (Menicucci, et al. 2006). This characterization shows that a
microbial fuel cell exhibits slow electrode kinetics. This is what one would expect in any
low temperature fuel cell, as high temperature fuel cells generally do not have significant
activation losses. Resistance losses (regions of ohmic polarization) can also be seen in
microbial fuel cells (Figure 10).
0
20
40
60
80
100
120
140
160
180
200
0
100
200
300
400
500
600
0 100 200 300 400 500 600 700
Po
wer (µ
W)
Cel
l P
ote
nti
al (
mV
)
Current (A)
Cell Potential
Power
Figure 10: Voltage Losses in a Microbial Fuel Cell
He, et al. used impedance spectroscopy to characterize a microbial fuel cell. They
generally attributed kinetic limitations to slow activation rates on the electrodes (He, et
al.). They also indicate that ohmic limitations in microbial fuel cells are usually attributed
to electrolyte resistance. This paper also includes an equivalent circuit and a Nyquist plot
Page 42
30
of the microbial fuel cell (He, Wagner, et al. 2006). Finally, the resistance scan in this
chapter did not explore the region of concentration polarization. Had this region been
explored, it is expected that a significant voltage loss (and a corresponding loss in power)
would have been seen.
Like a traditional fuel cell (and differing from a battery), the supply of energy in
a microbial fuel cell needs to be constantly replenished. In the case of a microbial fuel
cell, that energy source is the carbon source in the growth media. Unlike a battery, the
conversion of the fuel source is not direct. Instead, the microorganism facilitates the
conversion of chemical energy to electrical energy through the anaerobic oxidation of
glucose and liberation of electrons.
It should be noted that the microbial fuel cell literature does not address concerns
at the triple phase boundary because, unlike other power sources, the triple phase
boundary does not play a significant role in limiting power generation in a microbial fuel
cell.
A discussion of the source of possible power limitations of the microbial fuel cell
can be made by looking at the biological system as well as the underlying chemical
engineering principles involved. The power production in a microbial fuel cell might be
limited by the metabolic activity of the microorganism. In a different microbial fuel cell
the rate of electron transfer might be power limiting. In yet another microbial fuel cell,
the rate of diffusion of the nutrient source through the biofilm might be power limiting.
The microbial fuel cell design also has the potential to limit the power it is able to
produce. This is the case if the distance between the anode and cathode is significant such
Page 43
31
that the mass transfer of the cations from the anodic compartment to the cathodic
compartment is rate limiting.
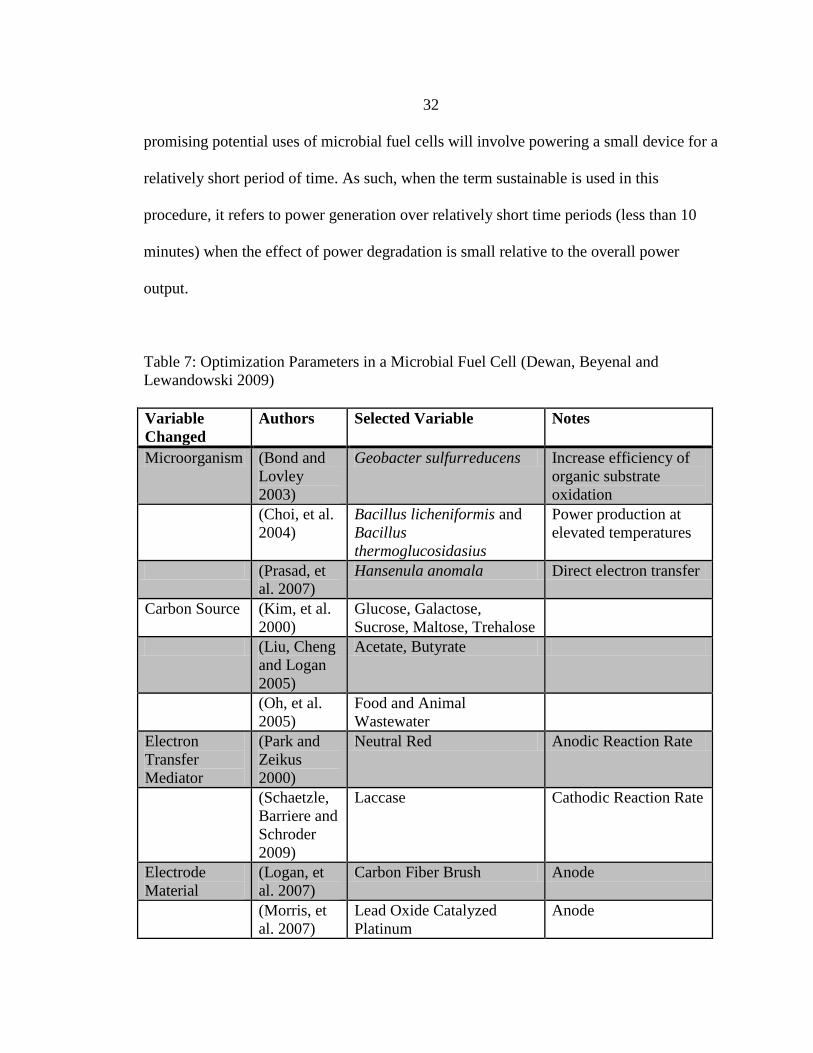
Dewan, et al. explore a number of factors that can limit the power productivity of
a continuously-operating microbial fuel cell. The type of microbial fuel cell, electrode
type, redox mediator used (if any), microorganism used, and carbon source can all play a
role in the maximum power a microbial fuel cell can produce (Dewan, Beyenal and
Lewandowski 2009). Table 7 offers examples (with the authors‟ research goals, when
available) of the parameters tested. This table is a summary of information found in
Dewan, et al. and is used with permission. This information, found in Table 7, gives
representative view of the present state of microbial fuel cell research.
Finally, it is important to note that no fuel cell or battery is truly sustainable; all
are subject to power degradation. This phenomenon is observed in microbial fuel cells.
When the procedure to determine sustainable power was published there was no
standardized method for the simple characterization of a microbial fuel cell. Since the
publication of this procedure, more conventional fuel cell characterizations have become
commonplace in the microbial fuel cell community. To some extent, however, the
publication of this procedure and the explanation of its necessity was a driving force for
standardization within the field. The maximum sustainable power (as defined below) is a
metric by which different fuel cells can be compared. The power of a microbial fuel cell
can be found by applying an external load (generally an external resistor), measuring the
voltage and the current, and calculated as the product of the current (I) and voltage (V);
P=IV. For the purposes of this procedure then, it is important to recognize that the most
Page 44
32
promising potential uses of microbial fuel cells will involve powering a small device for a
relatively short period of time. As such, when the term sustainable is used in this
procedure, it refers to power generation over relatively short time periods (less than 10
minutes) when the effect of power degradation is small relative to the overall power
output.
Table 7: Optimization Parameters in a Microbial Fuel Cell (Dewan, Beyenal and
Lewandowski 2009)
Variable
Changed
Authors Selected Variable Notes
Microorganism (Bond and
Lovley
2003)
Geobacter sulfurreducens Increase efficiency of
organic substrate
oxidation
(Choi, et al.
2004)
Bacillus licheniformis and
Bacillus
thermoglucosidasius
Power production at
elevated temperatures
(Prasad, et
al. 2007)
Hansenula anomala Direct electron transfer
Carbon Source (Kim, et al.
2000)
Glucose, Galactose,
Sucrose, Maltose, Trehalose
(Liu, Cheng
and Logan
2005)
Acetate, Butyrate
(Oh, et al.
2005)
Food and Animal
Wastewater
Electron
Transfer
Mediator
(Park and
Zeikus
2000)
Neutral Red Anodic Reaction Rate
(Schaetzle,
Barriere and
Schroder
2009)
Laccase Cathodic Reaction Rate
Electrode
Material
(Logan, et
al. 2007)
Carbon Fiber Brush Anode
(Morris, et
al. 2007)
Lead Oxide Catalyzed
Platinum
Anode
Page 45
33
(Rhoads,
Beyenal and
Lewandows
ki 2005)
Biomineralized Manganese
Deposited on Stainless Steel
Cathode
(Pham, et al.
2004)
Platinum-Coated Graphite Anode/Cathode
Reactor Design (Liu, Cheng
and Logan
2005)
Single-Chambered Decrease Internal
Resistance Caused by
Membrane
(Rabaey,
Clauwaert,
et al. 2005)
Tubular Increase Power
Generation
(Reimers, et
al. 2001)
Membrane-Less Generate Power from
Marine Sediment
Materials and Methods
Microbial Fuel Cell Components
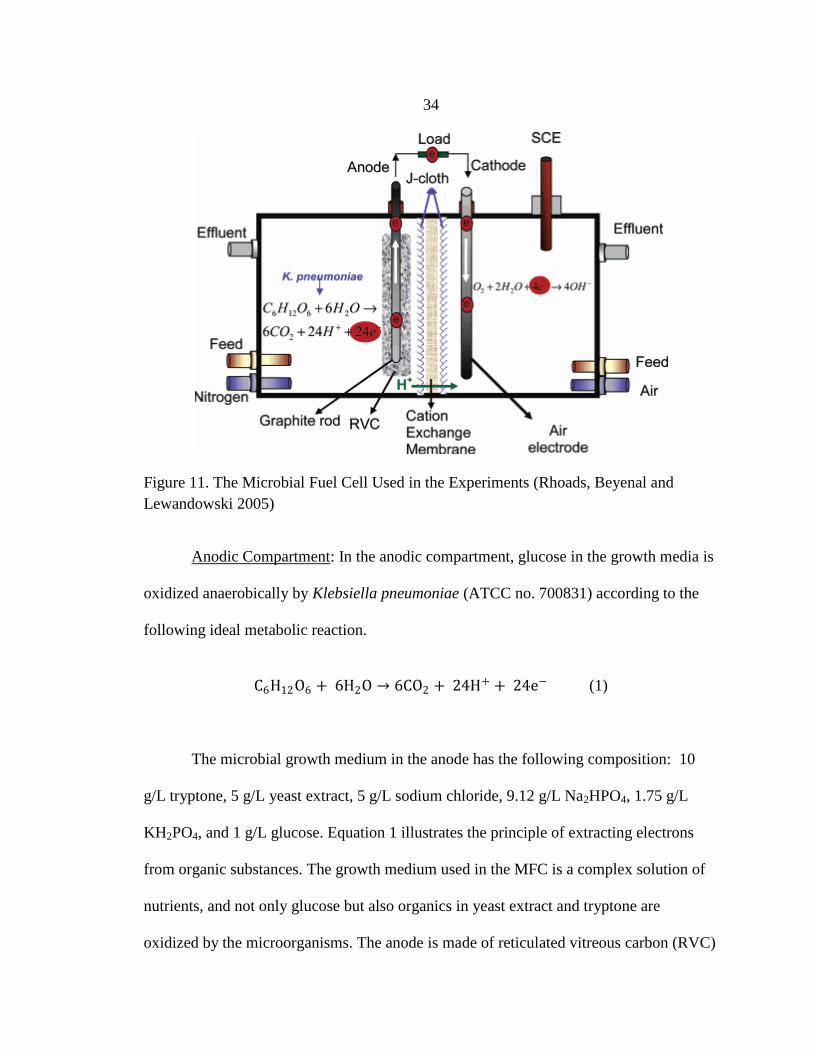
The microbial fuel cell used in the experiments is shown in Figure 11. The cell
casing is made out of polycarbonate and had anodic and cathodic compartments separated
by a cation exchange membrane ESC-7000 (Electrolytica Corporation, 770-410-9166).
Each chamber had a working volume of 250 mL. A saturated calomel electrode (SCE) is
used as a reference electrode (Fisher, catalog no. 13-620-51) and is located in the
cathodic chamber of the MFC. J-cloths with thicknesses of 0.1 mm (First Brands
Corporation), located in front of the cation exchange membrane, are used to protect the
cation exchange membrane from direct contact with the electrodes and to minimize
microbial growth on the cation exchange membrane (Bennetto and Delaney 1983,
Rhoads, Beyenal and Lewandowski 2005). Feed and effluent tubing is made of Neoprene
(Cole-Parmer, catalog no. 148441). Glass flow breakers located in feed lines were used to
prevent carboy contamination.
Page 46
34
Figure 11. The Microbial Fuel Cell Used in the Experiments (Rhoads, Beyenal and
Lewandowski 2005)
Anodic Compartment: In the anodic compartment, glucose in the growth media is
oxidized anaerobically by Klebsiella pneumoniae (ATCC no. 700831) according to the
following ideal metabolic reaction.
C6H12O6 + 6H2O → 6CO2 + 24H+ + 24e− (1)
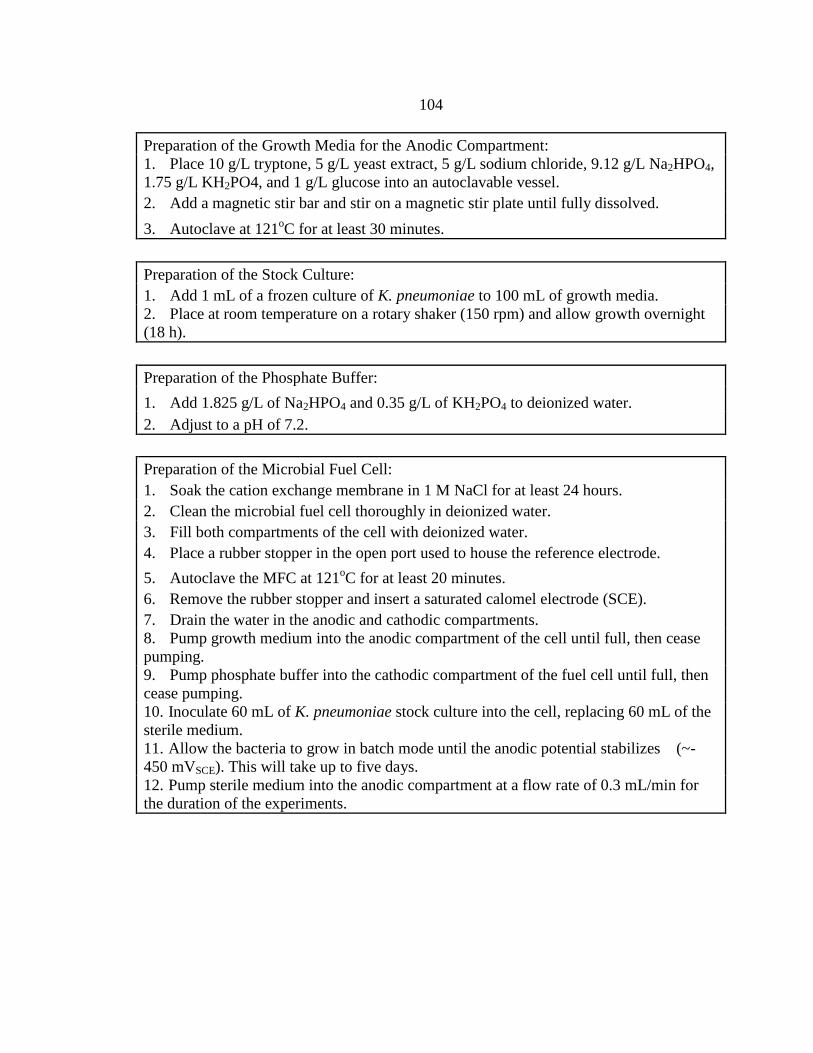
The microbial growth medium in the anode has the following composition: 10
g/L tryptone, 5 g/L yeast extract, 5 g/L sodium chloride, 9.12 g/L Na2HPO4, 1.75 g/L
KH2PO4, and 1 g/L glucose. Equation 1 illustrates the principle of extracting electrons
from organic substances. The growth medium used in the MFC is a complex solution of
nutrients, and not only glucose but also organics in yeast extract and tryptone are
oxidized by the microorganisms. The anode is made of reticulated vitreous carbon (RVC)
Page 47
35
connected to graphite rods (Sigma-Aldrich, CAS no. 7782-42-5). The anodic surface area
for the 80-ppi RVC is approximately 0.4 m2, calculated from the specifications given by
the vendor.
Cathodic Compartment: The cathodic reaction is the reduction of oxygen:
O2 + 4H+ + 4e− → 2H2O (2)
The full cell reaction is then:
C6H12O6 + 3O2 → 6CO2 + 12H+ + 12e− (3)
An air electrode, provided courtesy of Dr. Neal Naimer of the Electric Fuel
Corporation of the Arotech Corporation (Putt, Naimer and Koretz 2000), is used as the
cathode. The electrode is composed of two active layers of carbon bonded to each side of
a current-collecting screen made of nickel mesh (Hamlen and Atwater 2001). Oxygen is
reduced on the electrode surface.
To prevent the pH from changing in the cathodic compartment due to diffusion of
H+ through the cation exchange membrane, a phosphate buffer (1.825 g/L of Na2HPO4
and 0.35 g of KH2PO4) is used at a pH of 7.2. The surface area of the cathode is 79 cm2
(measured).
Page 48
36
Fuel Cell Startup and Operating Conditions
Preparation of Inoculum: 1 mL of a frozen stock culture of K. pneumoniae is
added to 100 mL of medium and is allowed to grow overnight (18 h) at room temperature
on a rotary shaker (150 rpm).
MFC Preparation: The microbial fuel cell is cleaned thoroughly in deionized
water. The cation exchange membrane is soaked in 1 M NaCl for at least 24 h before
installing in the cell. The cell is assembled as shown in Figure 11. Both compartments are
filled with deionized water (to avoid dry autoclaving). A rubber stopper is used to protect
the open port (to house the reference electrode). The MFC is autoclaved at 121 °C for at
least 20 min. The rubber stopper is removed, and a saturated calomel electrode is
inserted. The water in the anodic and cathodic compartments is then drained, and the
growth medium is pumped into the anodic compartment of the cell while phosphate
buffer is pumped into the cathodic compartment of the fuel cell.
60 mL of the K. pneumoniae stock culture is then inoculated into the cell,
replacing 60 mL of the sterile medium. The bacteria are allowed to grow in batch mode
until the anodic potential stabilized (−450 mVSCE). Sterile medium is then pumped into
the anodic compartment at a flow rate of 0.3 mL/min (D = 0.0012/h) for the duration of
the experiments.
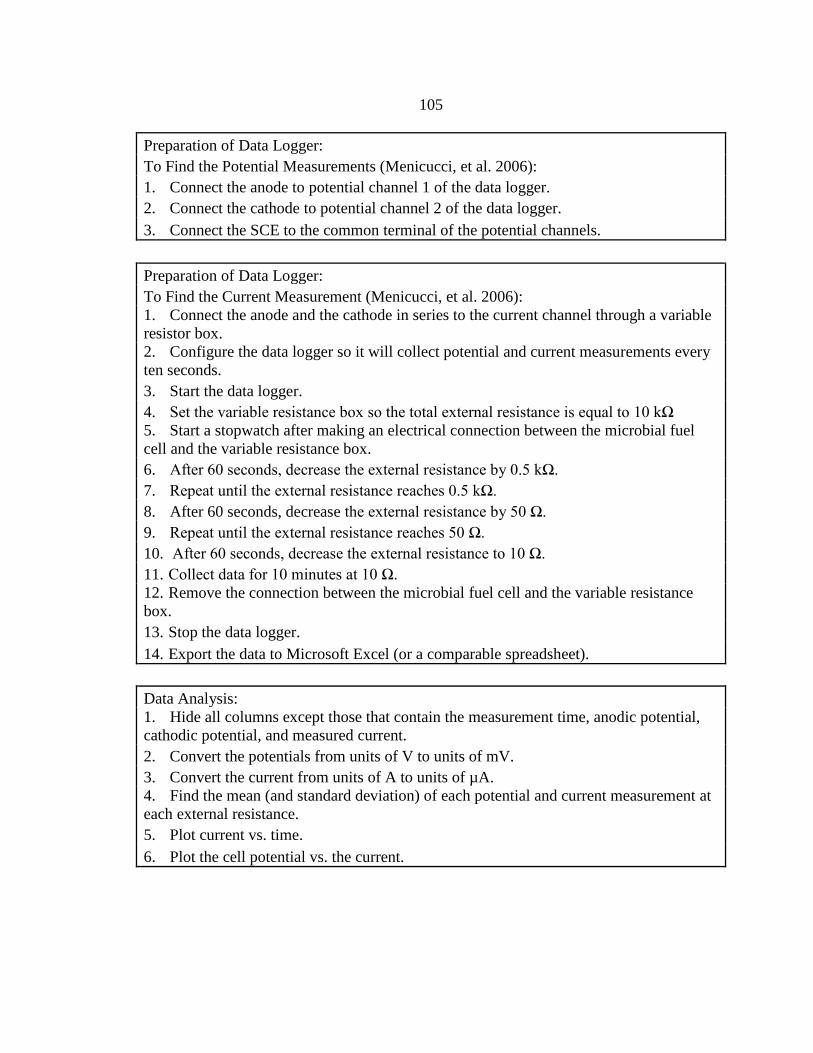
Measurement of Anodic and Cathodic
Potentials and Current in a Microbial Fuel Cell
The anodic and cathodic potentials of the microbial fuel cell are measured against
a saturated calomel electrode (Fisher, catalog no. 13-620-51) using a data logger (HP
Page 49
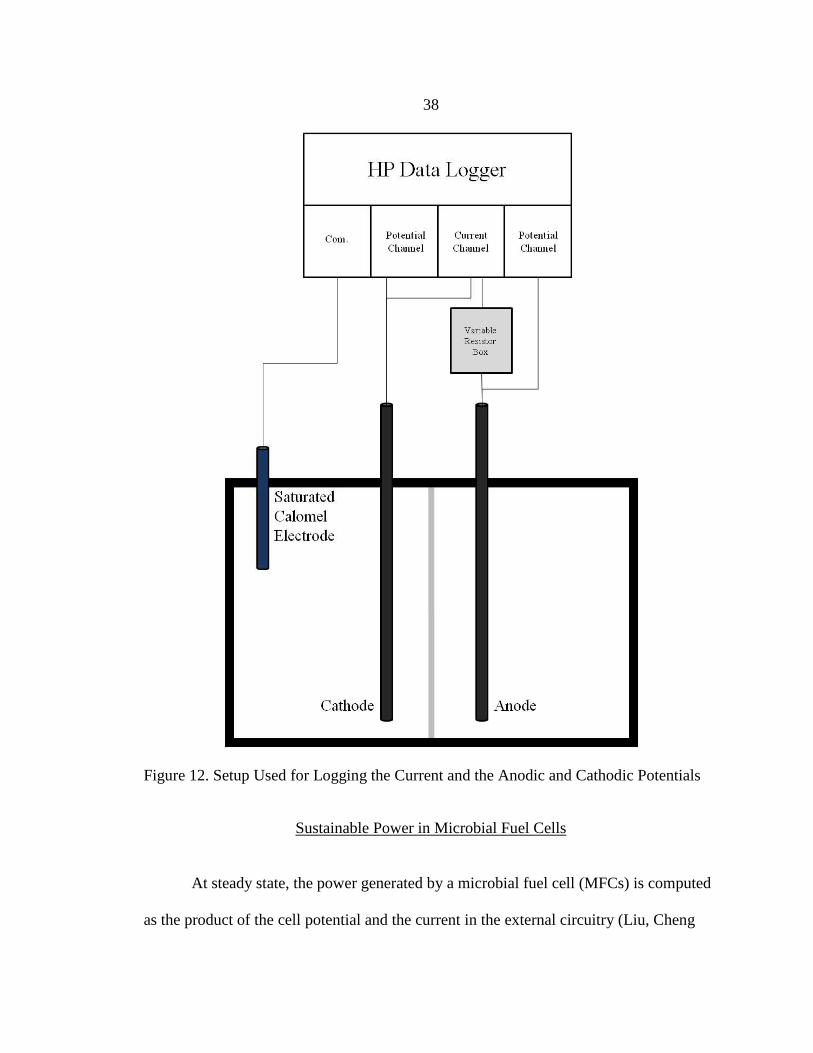
37
model no. 34970A) to store the measured values regularly (every 10 s). A variable
resistance box (Ohm-Ranger, Ohmite Manufacturing Co.) is used to select an applied
external resistance for current measurement. Figure 12 shows the experimental setup used
for logging the current and the anodic and cathodic potentials. The circuit consists of two
different wiring sections: one for the potential measurement and one for the current
measurement. For the current measurement, the anode and the cathode are connected to
the current ct6hannel through a variable resistor box in series. For potential measurement,
the anode and cathode are connected to potential channels 1 and 2 of the data logger,
respectively, with the SCE connected to the common terminal of the potential channels.
Page 50
38
Figure 12. Setup Used for Logging the Current and the Anodic and Cathodic Potentials
Sustainable Power in Microbial Fuel Cells
At steady state, the power generated by a microbial fuel cell (MFCs) is computed
as the product of the cell potential and the current in the external circuitry (Liu, Cheng
Page 51
39
and Logan 2005). At this time, the power generated by the MFC equals the power
consumption and the power production is sustainable for a short period of time. It is
important to define the condition at which the sustainable current reaches a maximum
and to compute the maximum sustainable power that can be generated by a microbial fuel
cell as it indicates the type of device that can be powered by a microbial fuel.
Current flows when the anode and the cathode of a fuel cell are connected through
a resistor (Bennetto and Delaney 1983, Allen and Bennetto 1993). The current is affected
by the potential of the cell and by the electrical resistance. The electrical resistance has
two components: external, the circuitry powered by the fuel cell; and internal, the fuel
cell itself (Gzebyk and Pozniak 2005). Initially, before the external circuit is connected to
the cell, the open circuit voltage of the cell reflects the thermodynamic equilibria of the
anodic and cathodic reactions. If the external circuitry has a relatively low electrical
resistance, then the equilibrium potential of the cell initially generates a high
instantaneous electric current, higher than the short-term maximum sustainable rate of
charge transfer to/from the current-limiting electrode. As a result, the potential across the
cell decreases quickly and adjusts to the rate of charge transfer to the current-limiting
electrode, effectively decreasing the current in the external circuitry. However, if the
external circuitry has a relatively high electrical resistance, then the equilibrium potential
of the cell generates an electric current lower than the maximum sustainable rate of
charge transfer to/from the current-limiting electrode. The potential of the cell adjusts to
the external resistance. In the latter case, the power generation is sustainable but lower
than it could be if the load were optimized.
Page 52
40
Each factor involved in the computation of power generated by a MFC-the cell
potential and the current- depends on many other factors, such as the chemistry,
concentrations of the reactants, and microbial activity. Some of these factors cannot be
controlled by the operator (Man, Cheng and Logan 2005, Rabaey and Verstraete 2005,
Zhang and Halme 1995). The cell can generate maximum power for a specific
combination of external and internal resistances only. The external resistance can be
controlled by the operator, but the internal resistance is an inherent feature of the fuel
cell, and the operator cannot control it. Predicting the lowest external resistance at which
the MFC yields the maximum sustainable power (MSP) from the circuit analysis is
difficult because many factors affecting the internal resistance are difficult to quantify.
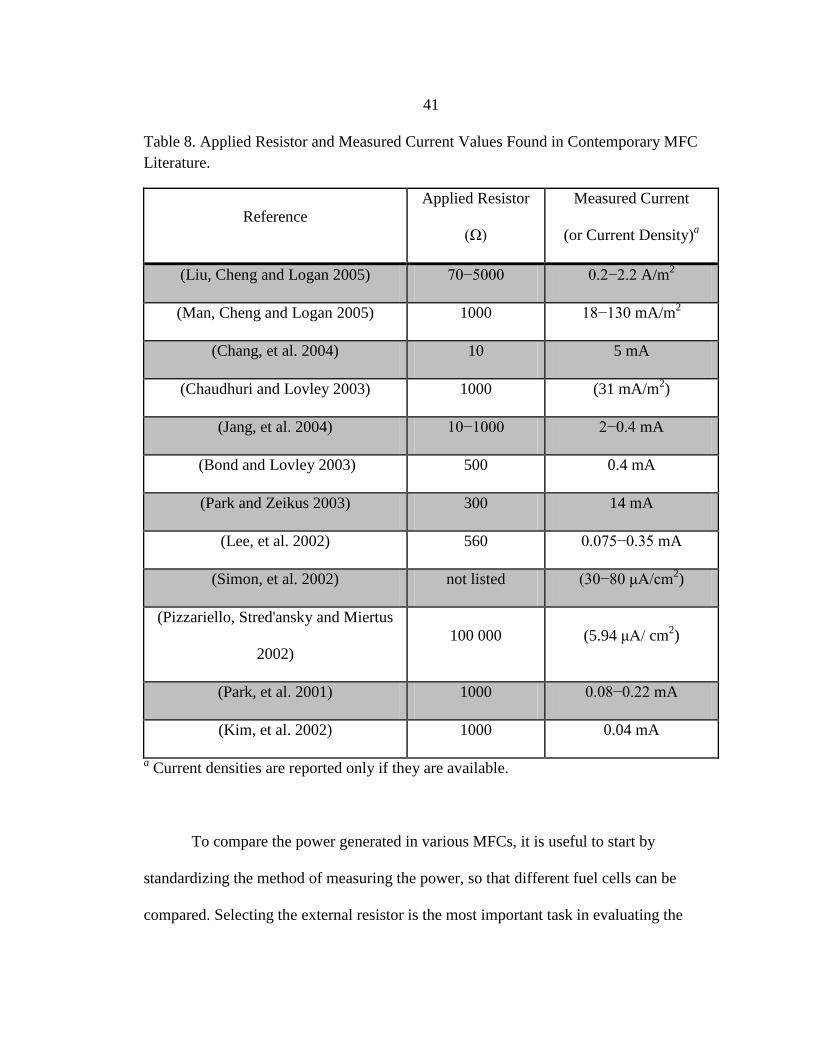
Most researchers studying MFCs make a point of estimating the power generated
by these devices; some just measure the current by applying an arbitrarily selected
external resistance and measuring instantaneous current and potential difference. Such
instantaneous measurements estimate the power generated at the time of the
measurement, but such data cannot be used to determine the maximum sustainable
power. Also, this approach does not allow for the comparison of various devices and
various operational procedures because the choice of the external resistor is arbitrary, and
the power generated by the fuel cell is dependent upon that choice. Table 8 shows a
selection of such measurements extracted from the available literature.
Page 53
41
Table 8. Applied Resistor and Measured Current Values Found in Contemporary MFC
Literature.
Reference
Applied Resistor
(Ω)
Measured Current
(or Current Density)a
(Liu, Cheng and Logan 2005) 70−5000 0.2−2.2 A/m2
(Man, Cheng and Logan 2005) 1000 18−130 mA/m2
(Chang, et al. 2004) 10 5 mA
(Chaudhuri and Lovley 2003) 1000 (31 mA/m2)
(Jang, et al. 2004) 10−1000 2−0.4 mA
(Bond and Lovley 2003) 500 0.4 mA
(Park and Zeikus 2003) 300 14 mA
(Lee, et al. 2002) 560 0.075−0.35 mA
(Simon, et al. 2002) not listed (30−80 μA/cm2)
(Pizzariello, Stred'ansky and Miertus
2002)
100 000 (5.94 μA/ cm2)
(Park, et al. 2001) 1000 0.08−0.22 mA
(Kim, et al. 2002) 1000 0.04 mA
a Current densities are reported only if they are available.
To compare the power generated in various MFCs, it is useful to start by
standardizing the method of measuring the power, so that different fuel cells can be
compared. Selecting the external resistor is the most important task in evaluating the
Page 54
42
power generated by a MFC, and it is the key to determining the sustainable power
generated by the MFC (Rabaey, Ossieur, et al. 2005). Once the electrodes are connected
through an external resistor, the cell potential decreases because of the limitations
imposed on the electrode reaction kinetics, on mass transfer, and on charge-transfer
processes at the current-limiting electrode (the one of the two electrodes that exhibits the
slower charge-transfer kinetics). The decreasing cell potential results in a decrease in the
current flowing through the external circuit, following Ohm's Law, I = V/R. Figure 13
illustrates a few of the factors that have the potential to affect the power generated by
MFCs. Very important is the work completed by Anderl, et al. indicating that there none
of the glucose in the bulk fluid phase will penetrate a K. pneumoniae biofilm (Anderl, et
al. 2003). This indicates that the electrons are produced at the surface of the biofilm and
are transferred to the anode via bacterial electron shuttling (Rabaey, Boon, et al. 2004) or
through electrical conduction through nanowires in the extracellular polymeric
substances in the biofilm (Gorby, et al. 2006, Reguera, et al. 2006).
Page 55
43
Figure 13. Simplified Charge Transfer in an MFC Depicting Factors Affecting the
External and Internal Resistances
The power generated by the MFC can be limited by the charge-transfer resistance
to the electrode or the external resistance. The effect of the internal mass transfer
resistance on power limitation can be demonstrated by stirring the solution of
electroactive species. This will increase convection and the therefore, the power. The
effect of the external resistance on the power generated by the MFC is more complex and
Page 56
44
can be visualized by short-circuiting the electrodes, which forces the cell to generate high
power for a very short time. Such elevated power generation is not sustainable in the
short term, and it decreases rapidly in time regardless of the effect of power degradation.
This effect highlights the need for a procedure to select the correct resistance for
determining the maximum sustainable power generated by microbial fuel cells.
The goal, then, is to develop a procedure for selecting the external resistance for
microbial fuel cells that ensures generation of the MSP and allows for a voltage/current
characterization of the MFC. To demonstrate the utility of this procedure, a microbial
fuel cell is operated with Klebsiella pneumoniae oxidizing glucose in the anodic
compartment. Oxygen is abiotically reduced in the cathodic compartment. The resistor in
which the cell generates maximum sustainable power is selected empirically by changing
the resistances at a predefined rate (Ohms per unit time) and measuring potentials and
currents.
Evaluating Sustainable Power
To evaluate the sustainable power, a decreasing resistance is applied at a
predefined scan rate and the current and cell potentials are measured for each resistance.
The applied resistor, cell potential, and current are later used to calculate power and the
sustainable power is evaluated from these measurements.
Example Measurements and Computations: An example measurement showing
how current and cell potential change with the external resistance is shown in Figure 14.
The external resistance is changed stepwise in equal time intervals. For practical reasons,
this step-like variation is approximated as as a continuous change of resistance with
Page 57
45
respect to time (dR/dt = 0.5 kΩ/min, shown by a dashed line). This data is seen in a
traditional fuel cell V-I curve in Figure 10.
The data used to predict sustainable power is produced after the MFC reached a
stable cell potential (550 mV). The different resistances are applied using an external
resistor-ranger (Ohm-Ranger, Ohmite Manufacturing Co.). The initial external resistance
is 10 kΩ, and the resistance is decreased by 0.5 kΩ every minute (hereafter referred to as
the resistance scan rate) until 0.5 kΩ is reached. The average current value at each
external resistance (over one minute) is used in the calculation of power.
Page 58
46
Figure 14. Resistance Scan Showing the Effect of Applied External Resistance on the
Variations of Cell Potential (E, Potential Difference Between Anode and Cathode) and
Current (I). The Continuous Line is an Approximation of the Stepwise Ramp of the
Decreasing Resistance (dR/dt = 0.5 kΩ/min)
Page 59
47
Effect of the External Resistance Scan Rate on the Sustainable Power: The
measurements in Figure 14 are repeated starting at an initial external resistance of 10 kΩ
and scan rates of 0.5 kΩ/10 s and 0.5 kΩ/180 s.
Experimental Verification of the Computed Maximum Sustainable Power: The
microbial fuel cell was operated for over two weeks to verify that the maximum
sustainable power computed using the developed technique was consistent with the
sustainable power evaluated by operating microbial fuel cells at a single resistance. The
MFC was operated at different resistances (6, 5, 4, 3.5, 3, 2.5, 2, 1.5, 1, 0.5, 0.25, and
0.125 kΩ) for a longer time period (generally greater than 6 h) at a constant applied
resistance. The current and anodic and cathodic potentials were measured with respect to
time.
Results and Discussion
Effect of External Resistance Scan Rate
on the Evaluated Sustainable Power
Table 9 shows the evaluated sustainable power and corresponding external
resistance for different resistance scan rates (0.5 kΩ/10 s, 0.5 kΩ/60 s, 0.5 kΩ/180 s). For
lower external resistance scan rates, the difference between the estimated maximum
sustainable power is very small (1 μW). However, there is a 20% difference in the
estimated maximum sustainable powers between 0.5 kΩ/10 s and 0.5 kΩ/60 s external
resistance scan rates.
Page 60
48
Table 9. Effect of the Rate of Change of External Resistance on the Change in
Sustainable Power
Rate of Change
of Resistance (kΩ/time)
Evaluated Maximum
Sustainable Power (μW)
Corresponding Resistor
(kΩ)
0.5 kΩ/10 s 86 3 kΩ
0.5 kΩ/60 s 68 3.5 kΩ
0.5 kΩ/180 s 69 3.5 kΩ
From the given graphical procedure, an applied external resistance of 3−3.5 kΩ
corresponds to a sustainable power. A slightly higher external resistor (4 kΩ) was used
experimentally to be sure that the power is sustainable over the defined time period.
Page 61
49
Experimental Verification of
the Evaluated Sustainable Power
The maximum sustainable power of our microbial fuel cell was estimated from a
30 min experiment. This sustainable power is 65.51 μW, which was measured using a 4
kΩ resistor. If this prediction is correct, then a resistance value less than 4 kΩ should
cause a drop in cell current with time. However, any resistance greater than 4 kΩ should
not change the cell current. Figure 15 shows the temporal variation of cell current for
three applied external resistors: (1) an external resistance less than the resistance able to
maintain a corresponding sustainable power (0.25 kΩ), (2) an external resistance able to
maintain a corresponding sustainable power (4 kΩ), and (3) an external resistance that
consumes less power than the cell is capable of producing (6 kΩ). When a 0.25 kΩ
resistor was used, there was a significant, immediate, and continuous drop in current and
cell potential, while current and potential remained constant over many hours when a 4
kΩ resistor was used. When a 6 kΩ resistor was used, the power was below the maximum
sustainable power.
Page 62
50
Figure 15. Current Measured Over 200 Minutes for 0.25, 4, and 6 kΩ External Applied
Resistances. The Current Remains Constant When a 4 or 6 kΩ Resistance is Applied.
However, the Current Decreases with Respect to Time When a 0.25 kΩ Resistance is
Applied
In experiments run at a constant resistance over longer periods of time (four hours
or longer), the cell potential and current decreased significantly when the applied
resistance was lower than the resistance identified as yielding the sustainable power. The
cell potential and current remained constant (neglecting the effect of power degradation)
when the applied resistance was equal to or greater than this resistance. The microbial
fuel cell was then operated for 16 h, applying a 4 kΩ resistance, and it was found that the
current and cell potential remained constant. This verified the sustainable power
predictions (performed in less than 30 minutes).
Page 63
51
Comparing the Maximum Sustainable
Power to the Maximum Power
The definition of sustainable power implies that the power generated does not
change with time and the cell potential remains constant after applying the external
resistance. However, the sustainable power obtained using higher resistances may be less
than the maximum sustainable power, as shown in Figure 16. The sustainable power
measurement at a resistance of 4 kΩ is 61.51 μW. The measurements in Figure 16 were
taken for 1 hour after applying the external resistance. Figure 16B shows that, even after
1 hour, the power in a microbial fuel cell continues to decrease when the resistance is less
than that which can maintain a sustainable resistance. The inset in Figure 16B shows the
decrease in power over the first two minutes of operation.
Page 64
52
Figure 16. (A) Current, Cell Potential, and Power Measurements in a Microbial Fuel Cell
(measured at t = 1 h). (B) Power Measurements in a Microbial Fuel Cell with an Applied
External Resistance of 1 kΩ. Note that Power Continues to Decrease Even After 300
Minutes of Continuous Operation
Page 65
53
Figure 17 shows that the instantaneous power generated by the MFC depends on the
resistor if the power is not sustainable. The power also depends on the time that the cell is
allowed to equilibrate, demonstrating transitional conditions and non-sustainable power
generation. Only when the external resistance is large enough does the power generation
reach a sustainable level quickly. The lower the external resistance, the longer the time
needed for the cell to equilibrate and produce the sustainable power. When a large, 6 kΩ,
resistor was used, power generation is sustainable after 10 seconds.
Figure 17. Power Generated by the MFC Measured Using Various External Resistors.
The Power Generated by the Cell Changes with Time, Demonstrating Unstable
Conditions and Non-Sustainable Power Generation. Only When a High Resistor is Used
Does the Cell Reach a Steady-State Quickly; It Produces Steady-State Power After Just
10 Seconds
Page 66
54
From Figure 17, the peak maximum power of the MFC is estimated to be 395
μW. However, the maximum sustainable power of the microbial fuel cell is only 65 μW,
much smaller (6 times) than the maximum power. He, et al. reported the fuel cell power
when a 66 Ω resistor was applied (He, Minteer and Angenent 2005). However, when
larger resistors, 100 Ω and 250 Ω, were applied the current decreased in time. Figure 3a
in Electricity Generation from Artificial Wastewater Using an Upflow Microbial Fuel
Cell (He, Minteer and Angenent 2005) shows this phenomenon. When a 470 Ω resistor
was applied, however, the current did not change, showing sustainable conditions. Figure
18 is Figure 3a from He, Minteer and Angenent that has been modified for aesthetic
purposes only. The thin line in this figure is the current in the microbial fuel cell and the
thick line is the voltage. These results corroborate the observations in this study and
demonstrate its need. Schroder, et al. changed the external resistance and measured
maximum power (similar to Figure 17) but did not indicate whether the measured
maximum was sustainable (Schroder and Niesen 2003).
Page 67
55
Figure 18. Current and Voltage in an Upflow Microbial Fuel Cell (He, Minteer and
Angenent 2005)
Note that the resistance corresponding to the sustainable power can be roughly
estimated from Figure 17. More importantly, a voltage/current characterization of the
microbial fuel can be completed from the data collected using this procedure. A graphical
procedure to find the sustainable power was described in Menicucci, et al. (Menicucci, et
al. 2006). This description can be found in Appendix A.
The procedure for evaluating the sustainable power generated by microbial fuel
cells can be executed in a short time (less than 1 h), and the results have been verified in
long-term experiments (lasting more than 2 weeks). Future experimentation is needed to
characterize power degradation in this microbial fuel cell.
Page 68
56
THE COURSE BEFORE AND AFTER THE CURRICULUM CHANGE
Introduction to CHBE 100
Prior to 2003, the Montana State University course, CHBE 100: Introduction to
Chemical and Biological Engineering was traditionally taught in a seminar style. The
implementation of a hands-on style course was initiated in 2003 with the hope that it
would better meet the needs of the students by improving their learning in the course.
Previous research has indicated that students felt that a hands-on education gave them a
deep commitment to an engineering career (Aglan 1996). In a review of the Rowan
Clinic, it was determined that the program--which emphasizes an interdisciplinary
industrial/academic "clinic", hands-on laboratory work, and teamwork--does a better job
with retention and satisfaction of women in their program than do traditional engineering
programs.
Also worth noting is that these pedagogical methods are actually "student-
friendly" rather than just "female-friendly" (Hartman and Hartman 2006). Also
interesting was the revelation that the active implementation of social issues into the
Rowan curriculum led to no noticeable difference in the rate of female attrition due to an
evaluation of an engineering degree as socially unsatisfying (Hartman and Hartman
2006); this is contrary to previous results for a traditional engineering programs
(Seymour and Hewitt 1997).
The implementation of state-of-the-art research into an undergraduate engineering
education program not only provides the instructor with another hands-on experiment
Page 69
57
which they can choose to use in their course, but also offers the students a different
perspective regarding the possibilities available to them upon completing their degree.
According to the American Institute of Chemical Engineers, 16% of graduating chemical
engineers go on to receive another degree in chemical engineering (Cobb, et al. 2008).
The implementation of academic research technologies into an academic curriculum is
not without precedent (Dahm and Hesketh 2007, Dahm, Hesketh and Savelski 2005,
Lefebvre, Connell and Dahm 2009). In fact, a laboratory of this type was developed for
CHBE 100 within the Department of Chemical and Biological Engineering at Montana
State University-Bozeman. The Magnetic Resonance Imaging (MRI) Laboratory was
developed for the course in 2004 and incorporated an introduction to MRI and a data
analysis section (Seymour, et al. 2005).
Hands-on Engineering Education
Starting in 2003, in a manner similar to Rowan University‟s Freshman
Engineering Clinic I, students in CHBE 100 were introduced during their first semester in
the program to fundamental engineering concepts using a hands-on laboratory approach.
Innovative laboratory modules were designed and/or adapted from published materials.
These laboratories utilize common activities (such as brewing coffee, taking blood
pressure, and delivery of medication) to teach fundamental engineering principles,
techniques for experimental measurement, data representation and analysis, and group
problem solving skills (Farrell and Hesketh 2002, Hesketh 1996, Hesketh, Slater, et al.
2002). Many of these laboratories are designed to build upon the student‟s current base of
knowledge and experience. Through hands-on laboratories and follow-up seminars, the
Page 70
58
students were also introduced to the breadth of traditional and non-traditional careers
available to graduates in chemical engineering. A unique aspect of this laboratory based
course is that most concepts are taught in an inductive learning format. Students were
asked to predict experimental outcomes, perform the experiments, plot and analyze the
data, and compare results to their predictions before being exposed to the underlying
theory and predictive calculations. By incorporating the concepts within
innovative/hands-on activities, it was expected that the students would personalize the
learning, thereby leading to improved mastery, retention, and transferability (Bransford
and Brown 2000). The course change was initiated fall semester of 2003 by incorporating
selected laboratory modules into the existing one credit seminar-based course. In fall
2004, the course was expanded to two credits with the addition of several more
laboratory units. The resulting course was formatted as a one credit seminar which meets
one hour per week and a one credit laboratory which meets two hours per week.
The revised freshman seminar course that was developed is based on the findings
of research on learners and learning as presented in How People Learn: Brain, Mind,
Experience, and School, a National Research Council publication. The three key findings
of research on learners and learning outlined in the NRC publication are (Bransford and
Brown 2000):
1. Students come to the classroom with preconceptions about how the world works.
If their initial understanding is not engaged, they may fail to grasp the new
concepts and information that are taught, or they may learn them for purposes of a
test but revert to their preconceptions outside of the classroom.
Page 71
59
2. To develop competence in an area of inquiry, students must:
a. have a deep foundation of factual knowledge,
b. understand facts and ideas in a conceptual framework, and
c. organize knowledge in ways that facilitate retrieval and application.
3. A metacognitive approach to instruction can help students learn to take control of
their own learning by defining learning goals and monitoring their progress in
achieving them.
Course Format
Lab/recitation sections met for two hours each week on Wednesday or Thursday
and the seminar section met for one hour each week on Friday. Lab sections were limited
to 9 students in order to provide the students with an opportunity to readily interact with
their instructor(s). Lab groups were limited to 3 students as it was found that in groups
with 4 or more students, one or more students may not fully participate in the exercise.
There were typically 4-6 lab sections each semester. Prior to the lab session, each group
met to discuss the lab and assign team responsibilities which consisted of a team leader,
data recorder, and worker. At the beginning of most experiments, the group was asked to
predict a particular outcome of the experiment and explain their prediction. The group
then performed the experiment, plotted and/or analyzed the data, and compared the
outcome to their initial prediction. If the outcome differed from their prediction, they
were then asked to explain why the outcome differed and to formulate a new explanation.
Only after the students spent time working with data and attempting to explain any trends
were they exposed to the underlying theory. After discussing the theory, the groups were
Page 72
60
asked to make predictive calculations based on the theoretical relationships and compare
the predictions to the data obtained in the experiment. This format of inductive teaching
is fully supported by educational research as described in How Students Learn:
"A critical feature of effective teaching is that it elicits from students their
preexisting understanding of the subject matter to be taught and provides
opportunities to build on –or challenge – the initial understanding…
Numerous research experiments demonstrate the persistence of preexisting
understandings among older students even after a new model has been
taught that contradicts the naïve understanding… For the scientific
understanding to replace the naïve understanding, students must reveal the
latter and have the opportunity to see where it falls short (Bransford and
Brown 2000).”
Moreover, active learning techniques, group problem solving, and scientific
investigations involving real-world contexts seem to be particularly advantageous for
retaining all students, including women and minority students, in the engineering
curriculum (NSF 2003).
The lab units have been sequenced such that the skills and concepts learned each
week form a foundation for concepts developed in subsequent weeks. The order of
teaching concepts in this course is modeled after that presented in the early chapters of
the text Elementary Principles of Chemical Processes (Felder and Rosseau 2000). This is
a required text for this course and is also used in the sophomore level material balance
course. A schedule for the Fall 2005 course offering is shown in Table 10.
Page 73
61
Table 10: Course Schedule
Week Lab Topic Seminar Topic
1 Course Introduction, Blood
Pressure Lab, and Problem Solving Pre-Assessment Surveys
2 Drug Delivery I Significant Figures and Dimensional
Homogeneity
3 Drug Delivery II
Linear Interpolation and Linear Curve-
Fitting of Non-Linear Data
4 Coffee Leaching I Elementary Statistics
5 Coffee Leaching II Chemical Composition
6 Fluidized Bed Polymer Coating I Industrial Applications of Leaching
7 Fluidized Bed Polymer Coating II Nuclear Submarines
8 Biological Fuel Cells Biological Engineering
9 Introduction to Term Project Materials and Product Design
10 Developing the Experimental Plan Exam
11 Presentation of Experimental Plan No Class-Veterans Day
12 Student Designed Experiment MRI Research in Antarctica
13 Student Designed Experiment No Class-Thanksgiving
14 Student Designed Experiment PowerPoint Basics
15 Student Presentations Wrap-up and Course Evaluation
Student-Designed Experiments
For three years a significant portion of the laboratory was a student-designed
experiment where groups of two to three students design their own experiments, run the
experiments, analyze the collected data, run follow-up experiments, and present their
results to their peers. The student-designed experiment provided a much needed
component to the introductory laboratory: application of learning. The student-designed
experiment offers students the opportunity to take what they‟ve learned and apply it to an
experiment of their choosing. Students had dedicated time with an instructor for
experimental plan development. They were then required to propose their ideas to both
Page 74
62
instructors and other lab groups prior to experimentation. Each lab group had up to six
hours in the laboratory to complete their experiments. Finally, students gave a formal
presentation about their experimental design and results. Students design their
experiments as they choose, including identifying the experimental parameters and data
collection methods. Projects ranged from adaptations of in-class experiments (leaching of
tea, dissolving aspirin) to experiments identical to an in-class experiment but using
different parameters (polymer coating with longer coat times, higher washer
temperatures, etc.) or completely novel experiments (design and testing of a
thermocouple, measurement of the flight of a basketball filled with various gases, etc.).
Assessment Model
An assessment model was developed for the CHBE 100 which included both
quantitative and qualitative data collection (Menicucci, Duffy and Palmer 2007). For the
first two years of the project, students were informed of the research procedures used to
assess the curriculum changes and were asked to sign informed consent forms prior to
participating in data collection. Students who participated in the first year of the course
were also asked to participate in a focus group one year after their experience. In
addition, the results were supported with field observations in the lab and by conducting a
focus group with senior chemical engineering students who were completing their degree
requirements and who had not experienced the hands-on introductory course during their
first year curriculum. The selection of senior chemical engineering students as a focus
group and not transfer students was made because the number of transfer students
Page 75
63
entering the chemical engineering curriculum at this time would not provide statistically
significant data for comparison.
Data Collection
Students completed a pre-test of chemical engineering knowledge and a pre-test
survey of attitudes and self-reported skills in the first week of the course. The same test
of knowledge was administered as a post-test and final exam during a regular class period
just prior to the beginning of the student-designed labs. The post-test of attitudes and self-
reported skills included the pre-test items and some additional items measuring student
engagement in the various lab exercises and was administered in the final class meeting.
These instruments were designed specifically to assess the objectives of this course. As a
final assessment of the course, the student evaluations for the new course were compared
with those of the previous iteration of the introductory course (without the hands-on lab
component). The instructor and evaluation form for this course were the same, although a
more comprehensive evaluation was completed on the hands-on laboratory after its
implementation.
In addition to completing the knowledge, skills and attitudes assessment
measures, students in the first two cohort years were also asked to participate in a focus
group during the last class period. At the end of the fall semester in the second year of
teaching the hands-on laboratory, two one-year follow-up focus groups were conducted
with the first cohort of students and a focus group with seniors who had not taken a
hands-on introductory course. All focus groups were conducted by Dr. Betsey Palmer or
her designated assistants in the role of independent evaluator(s). This way, students could
Page 76
64
be assured that their honest discussion of the course would not affect their grades. All
focus group interviews (13 groups total) were transcribed verbatim by a paid
transcriptionist and were analyzed and coded for themes. Pre-test and post-test data were
analyzed using paired t-tests.
Student absenteeism on the days assessment data were collected resulted in a few
missing cases. The pre-test sample size for the chemical engineering knowledge test for
year one was n= 36 and for the knowledge post-test was n=34 resulting in a 94%
response rate. The sample size for the pre-test of attitudes and skills for year one was
n=35 and the post-test for that cohort was n=31 (response rate = 88.6%). For the second
year cohort, knowledge pre-test and post-test were both n=37 (100% response rate) and
the attitudes pre-test and post-test sample sizes were n=37 and n=34 respectively (91.9%
response rate). The combined cohorts therefore had a pre- and post-test knowledge
response rate of 97.3% (N=71 and N=73) and a pre- and post-test attitudes response rate
of 90.3% (N=72 and N=65). In addition, in analyzing particular items, there was some
item nonresponse, so the final N for each analysis varied from N=62 to N=72.
Assessment Results
Students scored significantly higher on the post-test of engineering knowledge
than they did on the pre-test. The mean score on the pre-test was 42.3 (n=71, sd = 13.5)
and on the post-test, the mean score was 84.1 (N=71, sd =12.8). The difference between
these means was tested with a paired t-test which was significant well below the 0.05
alpha level (t = 23.08, df=70, p=0.000). Students in the course made significant gains in
learning the required course material. An interesting and unexpected outcome from this
Page 77
65
assessment strategy was that students commented frequently on the knowledge gained in
the course based on the pre-test. One student commented,
"I was surprised how much I learned and not even realizing it. At the
beginning of the year, we took that pretest and I failed it. We had to take it
again at the end of the year and I aced it. I didn‟t realize I had gone over
all of that."
Students also self-reported their knowledge of the field of chemical and biological
engineering and their knowledge of professional practices in chemical and biological
engineering on the pre- and post-course assessments. On both items, students rated
themselves as having gained knowledge of chemical engineering (tfield = 4.85, df=63,
p=0.000), (tprofession = 5.66, df=63, p=0.000).
On the six skill items (EXCEL, PowerPoint, engineering problem-solving, group
participation, leadership, graphing) students rated themselves significantly higher on their
post-test skill assessments in all areas except creating and reading graphs. Figure 19
shows the students‟ pre- and post-course mean skill assessments.
Since students will, at times, overestimate their skill level at the beginning of a
learning experience, they were asked to estimate the improvement in the six different
skill areas on the post-course assessment. As shown in Figure 20, students estimated that
their skill in solving engineering problems showed the greatest improvement (X=4.1 on a
1-5 scale). The rated their improvement on creating PowerPoint presentations as the
smallest gain. While their skill estimates from pre- to post-course assessment were not
significantly different, students rated their improvement in creating and reading graphs in
the mid-range of some improvement (X=3.6).
Page 78
66
Figure 19. Student Assessment: Pre- and Post-Course Rating of Skills
Rating scale: 1 = Not skilled 3 = Some skill 5 = Very skilled
Figure 20. Student Assessment of Improvement in Skill Level
Rating scale: 1 = Did not improve 3 = Some improvement 5 = A great deal of
improvement
0 1 2 3 4 5
Solving Engineering Problems
Use EXCEL to Plot and Analyze Data
Creating a Presentation Using Powerpoint
Leadership Ability in Group Settings
Creating and Reading Graphs
Actively Contributing to a Group Project
Post-Course Rating Pre-Course Rating
0 1 2 3 4 5
Creating a Presentation Using Powerpoint
Leadership Ability in Group Settings
Actively Contributing to a Group Project
Creating and Reading Graphs
Use EXCEL to Plot and Analyze Data
Solving Engineering Problems
Page 79
67
On the post-course assessment students were asked to respond to some general
attitude items which were created to correspond with overall course re-design objectives.
The goal of these questions was to see if the course as a whole was having a positive
effect on students. As shown in Figure 21, students showed very positive attitudes toward
active learning (X=6.0 on 1-7 scale) and learning to analyze data (X=5.9). The students
also responded well above neutral to items asking their comfort level in the department,
the application of chemical engineering to everyday life, and learning to work effectively
in groups. In essence, students responded positively to the items corresponding to overall
objectives of the course.
Figure 21. Student Assessment: General Impressions
Rating scale: 1 = Disagree strongly 4 = Neutral 7 = Agree strongly
Figure 22 presents the student ratings of learning in each of the main laboratory
modules. Students reported learning a moderate to an extensive amount of learning in all
0 1 2 3 4 5 6 7 8
I Learned Very Little in This Class
This Course Was Challenging
I Learned How to Work Effectively in a Group
I See How Engineering Principles Apply to My Daily Life
I Feel Comfortable in the CHBE Department
I Learned New Techniques for Analyzing Data
This Course Actively Engaged Me in Learning
Page 80
68
lab modules but rated the fluidized polymer bed lab the highest of the regular
laboratories.
Figure 22. Student Assessment of Learning in Labs
Rating scale: 1 = Little to no learning associated with this lab 4 = A moderate amount of
learning 7 = Extensive learning associated with this lab
Students rated the student-designed experiment as contributing to their learning,
although for this particular lab, students responded on the full range of the scale, with
some students rating the lab at a 1 and others at a 7. The average rating was 5.6. In the
focus groups, students also disagreed on the value of this lab with one student
commenting, “[The Student designed labs] took a little bit of extra effort. I think you got
more back from it, as well, having put so much of ourselves into it. It combined all those
skills we gathered throughout the semester.” Other students remarked that the nature of
this lab mimicked potential future experiences, both in required senior capstone projects
0 1 2 3 4 5 6 7 8
Blood Pressure
MRI
Throat Lozenge
Coffee Leaching
Student Designed
Polymer coating
Page 81
69
and in real-world work situations. They believed their experiences would be beneficial in
preparing them for these future challenges.
The data in Table 11 is from the standard “end of course” student evaluation of
the instructor. A comparison is made to the former “Freshman Seminar” course that
consisted primarily of faculty led seminars about various aspects of chemical and
biological engineering. In every category, the newly-designed course was evaluated in a
more positive light than the previous, seminar-style course. One student had this
observation:
“I went to a high school with a buddy I played hockey with. He was three years
older than I am. He came to MSU and he was in the chemical engineering degree
as well. He said he didn‟t have this class or the class was a lot smaller than it is
now. He really regrets not having this opportunity. I think it is a great way to start
you into chemical engineering or any degree, no matter what it is. Just kind of
ease you into it and give you a background of where we are going and what
chemical engineers actually do instead of just throwing it all at you your
sophomore year.”
This anecdote corroborates the students‟ general impression that the course helped them
feel comfortable in the department (seen in Figure 21).
Page 82
70
Table 11. End of Course Student Evaluation.
The numerical rating system used in this evaluation is:
1 = Excellent
2 = Above Average
3 = Average
4 = Below Average
5 = Poor
Survey Question Former Course
Rating
Current Course
Rating
Organization of the course was: 2.26 1.44
Presentation of the material was: 2.05 1.33
Was the instructor prepared? 1.74 1.03
Was the grading impartial and fair? 1.44 1.21
Was the instructor concerned for the student? 2.32 1.33
The instructor‟s ability to answer questions
was: 1.79 1.21
The instructor‟s knowledge of the material
was: 1.47 1.06
What overall rating do you give the
instructor? 1.95 1.09
How useful to learning the material was the
homework? 3.1 1.69
Did the course provide a good learning
experience for you? 2.21 1.33
The resources (equipment, help) for the class
were: 2.41 1.15
How does this course compare to other
technical courses? 2.56 1.43
Average Rating for Course 2.07 1.27
Page 83
71
MICROBIAL FUEL CELLS IN CHBE 100
The Experiment
A microbial fuel cell experiment was designed for CHBE 100 and was
implemented in 2005. In the development of the initial microbial fuel cell module, it was
determined that the fundamental principles to be taught would engage a student‟s
understanding of current, resistance, power, and voltage. These concepts are generally
discussed in a typical high school physics course and would later be readdressed in an
introductory university level physics course.
A laboratory handout was given to students to help guide them through four
workstations that highlighted different attributes and limitations of microbial fuel cells.
The first station asked the students to assemble and disassemble the microbial fuel cell
shown in Figure 11 (Rhoads, Beyenal and Lewandowski 2005, Menicucci, et al. 2006).
The second station allowed the students to observe the operational microbial fuel cell.
They identified any activity (bubbling, pumping, etc.) and used a multimeter to find the
potential difference across the microbial fuel cell. Next, they found the current of the
microbial fuel cell across a 10 ohm resistor. Finally, they repeated these measurements
using a “D-sized” battery instead of the MFC. The third station showed a second type of
microbial fuel cell being developed in the laboratory. Although this particular style of
microbial fuel cell was not ultimately involved in generating any published data, the
general principle of the microbial fuel cell design mimicked the multiple-anode design
found in Wireless Sensors Powered by Microbial Fuel Cells (Shantaram, et al. 2005). The
Page 84
72
final work station showed how voltage relates to power by lighting a small bulb using
one, two, three, or four 1.5 Volt D-sized batteries connected in series. The handout for
this laboratory is found in Appendix B.
Learning Objectives
The microbial fuel cell experiment was designed specifically to introduce students
to a novel technology (microbial fuel cells) in a hands-on fashion. The learning objectives
in this laboratory were to:
1. Demonstrate how potential, resistance, and current are related.
2. Explain how a microbial fuel cell works.
3. Explore the value and limitations of the microbial fuel cell technology.
Microbial Fuel Cell Laboratory Evaluation
The microbial fuel cell laboratory was evaluated by Dr. Betsey Palmer using the
same methods as the other CHBE 100 laboratories. The microbial fuel cell laboratory is
part of the 2005 evaluation cohort only, the MRI laboratory the 2004 evaluation cohort
only, and all other laboratories as a combined 2004/2005 evaluation cohort.
Normalization of laboratory evaluations by year and/or a comparison of the 2004 and
2005 cohort evaluations were not included in this analysis. Figure 23 shows the
evaluation of all CHBE 100 laboratories in 2004-2005, including the microbial fuel cell
laboratory.
Page 85
73
Figure 23. Updated Student Assessment of Learning in Labs
Rating scale: 1 = Little to no learning associated with this lab 4 = A moderate amount of
learning 7 = Extensive learning associated with this lab
The microbial fuel cell laboratory received the highest average score from the
students in 2004 and 2005, though this laboratory is not statistically different from any
other laboratory except the blood pressure laboratory. One student did note about the
microbial fuel cell lab, “If you are going to major in this business, it is something you
could potentially be doing and it gave us a lab session where „Hey, this is what life might
look like in four years.‟”
Finally, there is some legitimacy in questioning whether students learning in the
microbial fuel cell laboratory can be attributed to the novelty of the experiment rather
than the actual learning that takes place; however, Michael Prince makes an argument
that this is not the case: “As a final cautionary note for interpreting reported results, some
readers dismiss reported improvements from nontraditional instructional methods
because they attribute them to the Hawthorne effect whereby the subjects knowingly
0 1 2 3 4 5 6 7
Blood Pressure
MRI
Throat Lozenge
Coffee Leaching
Student Designed
Polymer coating
MFC
Page 86
74
react positively to any novel intervention regardless of its merit. The Hawthorne effect is
generally discredited, although it retains a strong hold on popular imagination (Prince
2004)”.
Since 2005, three new laboratories have been developed and/or implemented for
CHBE 100 by the new instructor and the student designed laboratory has seen significant
changes. The new laboratories include a comparison of the viscosity of common
household liquids, adding cream to coffee to observe Newton‟s Law of Cooling, and a
laboratory allowing the students to produce biodiesel. The student designed laboratory
has been more focused with students given specific tasks (design a vehicle and make it
move using only a chemical reaction) or using only specific resources.
Page 87
75
AN UPDATED MICROBIAL FUEL CELL EXPERIMENT
Introduction to the New Experiment
The purpose of this new laboratory is to afford the instructor the opportunity to
easily implement microbial fuel cells and techniques to characterize them into an upper
level hands-on chemical or biological engineering course.
The experiment described in the previous chapter offered an introduction to
microbial fuel cells through demonstration in a research laboratory and work stations
designed to provide a hands-on experience. This was adequate for the purpose of
exposing students to new and novel research, but the next step is the design of a stand-
alone microbial fuel cell experiment built into the course so that the students can truly
experiment with a microbial fuel cell, and not just observe how it works.
The design of this new experiment gives students an opportunity to use state-of-
the-art equipment as a motivating factor for learning and provides exposure to current
research in their field. Moreover, this new experiment offers students the opportunity to
characterize microbial fuel cells using traditional fuel cell metrics.
The layout of this chapter is such that the instructor can choose selections that fit
with their desired experiment and can incorporate them as they see fit. As appropriate,
suggestions for instruction pertaining to either chemical or biological engineering will be
included. A complete description of the microbial fuel cell can be found in the research
literature (Rhoads, Beyenal and Lewandowski 2005).
Page 88
76
Supplies and Equipment Needed for Implementation in a CHBE Laboratory
Table 12 shows a list of equipment suggested for the implementation of microbial
fuel cells into a chemical and/or biological engineering laboratory.
Table 12. Suggested Supplies and Equipment
For Fuel Cell Experiment For Growth Media
Preparation
For Data Collection and
Analysis
Polycarbonate Microbial
Fuel Cell (Rhoads, Beyenal
and Lewandowski 2005)
Glucose Saturated Calomel Electrode
J-Cloths 0.1mM NaOH Personal Computer
Air Electrode (Menicucci, et
al. 2006) Na2HPO4 DataChart 1250 Data Logger
Glass Flow Breakers Tryptone Ohm Ranger Variable
Resistance Box
Graphite Rods Yeast Extract Alligator Clip Connectors
Reticulated Vitreous Carbon
(80 ppi) KH2PO4 Multimeter
Cation Exchange Membrane 0.1 mM HCL Stopwatch
Neoprene Tubing Sodium Chloride
Rubber Gaskets
Klebsiella
pneumoniae stock
culture
Rubber Stoppers Autoclave
Masterflex Pumps Autoclavable
Vessels
Rotary Shaker
Flasks
Magnetic Stir Plates
Weigh Boats
Deionized Water
Balance
Magnetic Stir Bars
pH meter
Page 89
77
Learning Objectives
The suggested learning objectives are provided for the convenience of those
instructors implementing this experiment in a hands-on chemical and/or biological
engineering laboratory. They are not all-inclusive, but they do give an instructor a
starting point from which to work. The specific learning objectives for students
performing this experiment might include:
1. Demonstrate how potential, resistance, and current are related.
2. Explain the concept of power degradation.
3. Analyze data using a spreadsheet.
4. Perform a simple statistical analysis of data (calculate a mean and standard
deviation).
5. Produce a voltage/current characterization of a microbial fuel cell.
6. Interpret analyzed data in order to "develop competence in an area of inquiry
(Bransford and Brown 2000)".
7. Explain and calculate power limitation factors of a microbial fuel cell.
The implementation of this experiment not only provides a mechanism by which
an instructor can address, at a minimum, seven learning objectives, but also introduces
students to state-of-the-art research related to sustainable energy production.
For the sake of simplicity, the learning objectives and the suggested mechanisms
by which an instructor can address them are found in Appendix C.
Page 90
78
Pre-Experiment Activity
In order to "elicit from students their preexisting understanding of the subject
matter to be taught (Bransford and Brown 2000)", a pre-experimental activity has been
developed that will engage the student's understanding of resistance, voltage, and current.
This exercise uses the students' knowledge of a common household device, the coffee
maker, as a coffee leaching laboratory has been part of the CHBE 100 curriculum since
the inception of the hands-on learning approach to the instruction of this course.
This exercise should take the students five to ten minutes to complete, but will
allow a student to meet Learning Objectives 1 and 2, and will provide the framework of
understanding that will later allow them to meet Learning Objective 5. The questions
below should be given to the students to complete before they perform the experiment.
Students will be asked to complete a post-experiment activity that will explore the
difference between their expected results and the actual results. Below are the questions
to be asked:
1. A coffee maker with a resistance of 10 ohms is plugged into a standard 110 V
wall outlet. Calculate the current flowing through the coffee maker (remember
that V=I·R).
2. The same coffee maker has a switch that stops current from flowing (turning off
the heating element). This is caused by the expansion of the metals as the
temperature increases; by design the switch opens when the temperature reaches a
certain point. When the temperature drops below that certain point, the metal
again makes contact and current flows (this keeps your coffee warm!). Assume
Page 91
79
that it takes 10 minutes to brew a full batch of coffee and that the switch opens
immediately after the cycle has been completed. If the switch remains open for 15
minutes before turning closing for 5 minutes, plot the current used with respect to
passing time for the brewing cycle and three off/on warming cycles.
3. A microbial fuel cell that has reached a steady-state cell potential of 0.5 V is to be
used to power a coffee maker with a resistance of 10 ohms. Predict the current
that will flow through the coffee maker immediately after you connect it to the
microbial fuel cell.
4. Predict the current produced by this microbial fuel cell with respect to time if you
were to attach the coffee maker and let it operate for 70 minutes (make a plot of
the current with respect to time).
Page 92
80
Step-by-Step Procedure and Timeline
After the instructor has their equipment and supplies, it will be important to
prepare for the laboratory on a schedule so that the microbial fuel cells are ready for
experimentation. Table 13 provides a schedule designed so that students can assemble the
microbial fuel cells and prepare and/or autoclave growth media in the laboratory period a
week before the microbial fuel cell laboratory if the instructor so chooses.
Table 13. Step by Step Procedure and Timeline
Task Timeline
Soak Cation Exchange Membrane in 1 M
NaCl 8 days prior to Laboratory Experiment
Assemble Microbial Fuel Cell 7 days prior to Laboratory Experiment
Prepare and Autoclave Growth Media at least 5 days before Laboratory
Experiment
Prepare Phosphate Buffer at least 5 days before Laboratory
Experiment
Begin Culture Growth 4 days, 18 hours before Laboratory
Experiment
Batch Inoculation of MFC 4 days before Laboratory Experiment
Begin Continuous Flow Operation (0.3
mL/min) 1 day before Laboratory Experiment
A printable list of all of the tasks needed for the implementation of this laboratory into
the course is included in Appendix D.
Page 93
81
Post-Experiment Activity
The post-experiment activity is developed to help students meet the learning
objectives. To that end, the following questions are suggested as a post-experiment
activity or take-home assignment. The purpose of this activity is to "provide opportunities
to build on –or challenge – the initial understanding (Bransford and Brown 2000)." The
suggested questions directly address the students' initial understanding while engaging
the students in a hands-on-activity representative of state-of-the-art research:
1. Look at the plot of current with respect to time at an external resistance of 10 Ω
and compare it to your prediction for powering a coffee maker using a microbial
fuel cell.
2. How does your prediction differ from your actual results? What is a possible
explanation for this difference (Hint: look closely at your experimental data and
evaluate any assumptions you made in your predictions)?
Significance of the Updated Microbial Fuel Cell Experiment
The significance of this new laboratory is found in its great teaching opportunities
in both chemical engineering and biological engineering. In-class discussions following
the experiment could specifically emphasize the chemical engineering aspects and/or the
biological engineering aspects of operation of the microbial fuel cell. For example, a
chemical engineer might indicate that mass transfer or internal resistance of the microbial
fuel cell limits the current produced. A biological engineer might instead indicate that the
rate of the biological oxidation of glucose is, in fact, limiting. Moreover, a
Page 94
82
comprehensive discussion of microbial physiology would be appropriate in certain
courses. Because upper level laboratories can incorporate higher level concepts of both
chemical engineering and biological engineering, a discussion of mass transfer, internal
resistance, and biological oxidation of glucose is appropriate. Figure 24 shows data that
indicates that the activation polarization of the cell is increased by the addition of a redox
mediator. Moreover, the rate of ohmic polarization is decreased with higher
concentrations of redox mediators.
Figure 24. Effect of a Redox Mediator on the Activation and Polarization Losses in a
Microbial Fuel Cell
0
100
200
300
400
500
600
700
0 200 400 600 800 1000
Cel
l P
ote
nti
al
(mV
)
Current (µA)
0 µM HNQ 5 µM HNQ
105 µM HNQ 905 µM HNQ
10905 µM HNQ
Page 95
83
Suggested Assessment
To assess the effectiveness of the implementation of microbial fuel cells into the
chemical and biological engineering curriculum, one needs to implement an assessment
mechanism by which the change can be judged. Fundamentally, the simplest evaluation
mechanism would be the implementation of an examination question that addresses a
fundamental principle associated with the microbial fuel cell experiment (mass transfer,
transport phenomena, biological transport, etc.) that corresponds to the principle taught in
the course.
To properly evaluate the change, some sort of control mechanism should be in
place. For example, the instructor could choose write two different exam questions
addressing the same principle; one question would be asked with regard to a microbial
fuel cell and the other would not. The instructor could then distribute two versions of the
exam and evaluate and compare the student performance on each individual exam
questions. A statistically significant difference between student performance on the
microbial fuel cell question and its counterpart question as compared to the performance
of each cohort of students on the rest of the (same) exam, could indicate that the
implementation of the hands-on experiment leads to different (and assumedly better)
student learning, comprehension, and/or retention of materials.
Alternatively, the instructor could choose to offer pre- and post- tests for the
evaluation of the hands-on experiment. Again, the evaluation of student learning due to
the hands-on approach would need to be compared to student learning attributed to the
course in general. As such, for the instructor to state that the implementation of the
Page 96
84
hands-on experiment had a positive effect on student learning, the learning on this
particular problem (as evaluated by graded pre- and post- exam problems) would have to
be significantly (statistically) greater than on the other problems.
Moreover, for a complete assessment, an instructor might choose to collaborate
with an instructor of a similar course at a different institution that has not yet
implemented the hands-on experiment or collect data from a different cohort that has not
had exposure to the hands-on experiment. Both cohorts would be given identical
examination questions addressing the concepts related to or directly addressing the
microbial fuel cell. An evaluation of the student performance on these questions
normalized to their overall performance would give a clear indication of their learning
due to their exposure to the hands-on experiment.
Page 97
85
CONCLUSIONS
This dissertation is unique because it investigates two different aspects related to
advancements associated with biological energy conversion: algal biofilm development
and quantification of microbial fuel cell power generation. It also evaluates the
implementation of a hands-on freshman laboratory in CHBE 100 at Montana State
University and the evaluation of the implementation of a microbial fuel laboratory in this
course. Finally, it presents a newly-designed microbial fuel cell laboratory appropriate for
an upper-level chemical and/or biological engineering course.
The work done at Montana State and the Idaho National Laboratory laid a
framework for a new vision of algal colonies: the biofilm. The scientific observation of
algal surface attachment, detachment, and sloughing events are significant steps in
classifying algal communities as biofilms. These phenomena were used, in part, to
initially characterize bacterial biofilms.
There are parallels between the behavior of algal communities and bacterial
biofilms. For instance, the observed algal sloughing event is reminiscent of the sloughing
of an entire section of bacteria from a biofilm. The weak adherence on Teflon, a smooth,
hydrophobic surface, is similar to weak bacterial biofilm adherence to smooth surfaces.
Further research into the structure, function, and phenotypic changes of the algae
is needed for a complete characterization and classification, but these findings are a
significant step in defining algal communities as biofilms.
Next, a simple technique was identified to identify the maximum sustainable
power generated by microbial fuel cells. This technique can easily be used to report the
Page 98
86
cell performance under a defined set of operational conditions. Moreover, experiments
run at a constant resistance over longer periods of time (four hours or longer) verified the
results of the technique. In these experiments, the cell potential and current decreased
significantly when the applied resistance was lower than the resistance identified as
yielding the sustainable power. The cell potential and current remained constant
(neglecting the effect of power degradation) when the applied resistance was equal to or
greater than this resistance.
This procedure was important in the microbial fuel cell community for a number
of reasons. First, it addressed the inherent power limitations in the microbial fuel cells.
Prior to this paper, most researchers studying MFCs make a point of estimating the power
generated by these devices; some just measured the current by applying an arbitrarily
selected external resistance and measuring instantaneous current and potential difference.
Such instantaneous measurements estimate the power generated at the time of the
measurement, but such data could not be used to determine the maximum sustainable
power. Also, these previously-used approaches did not allow for the comparison of
various devices and various operational procedures because the choice of the external
resistor is arbitrary, and the power generated by the fuel cell is dependent upon that
choice. Microbial fuel cells characterized by maximum sustainable power can be directly
compared to each other.
The discussion of this procedure and its impact in the microbial fuel cell
community now includes a more traditional voltage/current characterization of the
microbial fuel as well as a discussion of the power limiting factors in a microbial fuel
Page 99
87
cell. Specifically, the maximum theoretical number of electrons that could be liberated in
a specific microbial fuel cell was calculated so the actual generated power could be
compared to the maximum theoretical power.
The implementation of a hands-on style of teaching CHBE 100: Introduction to
Chemical and Biological Engineering was initiated in 2003 with the hope that it would
better meet the needs of the students by improving their learning in the course. Through
hands-on laboratories and follow-up seminars, the students were also introduced to the
breadth of traditional and non-traditional careers available to graduates in chemical
engineering. A unique aspect of this laboratory based course is that most concepts are
taught in an inductive learning format. Students were asked to predict experimental
outcomes, perform the experiments, plot and analyze the data, and compare results to
their predictions before being exposed to the underlying theory and predictive
calculations.
The evaluation of the students‟ post-test of attitudes and self-reported skills
indicates that the new course format has better prepared students for their education in
chemical engineering than did the previous seminar style course. Students report that they
feel actively engaged in the learning and feel comfortable in the department. Students
also felt that their problem solving skills had improved over the course of the semester.
A hands-on microbial fuel cell laboratory experiment was designed and
implemented in CHBE 100. Students identified this microbial fuel cell laboratory as
providing significant learning. This experiment was updated to include both the assembly
of a microbial fuel cell as well as the characterization of a microbial fuel cell. This
Page 100
88
experiment has the potential to engage students in both chemical engineering and
biological engineering. The experiment is designed with specific learning objectives and
supporting activities that will engage a student's initial understanding of the material.
This facilitates learning in a manner outlined in How People Learn: Brain, Mind,
Experience, and School (Bransford and Brown 2000).
The experiment was also designed to allow an instructor to emphasize the area(s)
of chemical and biological engineering of his/her choosing while introducing students to
a novel research topic in a hands-on fashion.
Page 102
90
APPENDIX A
A GRAPHICAL ESTIMATION OF SUSTAINABLE CONDITIONS
Page 103
91
Using the initial anodic potential (Eo,anodic) and anodic potentials at each applied external
resistance, the relative decrease in anodic potential is defined by the authors as:
relative decrease in anodic potential (%) = 𝐸0,𝑎𝑛𝑜𝑑𝑖𝑐 − 𝐸𝑎𝑛𝑜𝑑𝑖𝑐
𝐸0,𝑎𝑛𝑜𝑑𝑖𝑐 𝑋 100
The relative decrease in anode potential (RDAP) is used to estimate the maximum
sustainable power graphically, as seen in the figure below. From the data in the figure,
the potentials of the cathode (A), anode (B), and cell (C) and the relative decrease in
anode potential (D) are plotted against the external resistance. The cathodic potential is
constant (A) at each external resistance, showing that the current is limited by the anode
(Sawyer, Heineman and Beebe 1984). The cell potential decreased significantly when a
resistance less than 3 kΩ is applied (B and 15C). The standard deviations of the data
points are very small relative to the cell potential. They ranged from a minimum of
0.11% of the cell potential at 7.5 kΩ to a maximum of 3% of the cell potential at 0.5 kΩ.
Page 104
92
Effect of External Resistance on the (A) Cathodic, (B) Anodic, and (C) Cell Potentials.
Anodic and Cathodic Potentials are Presented Against a Saturated Calomel Electrode
(SCE). The Resistance Scan Rate was 500 Ω/60 s in All Experiments. (D) The Variation
of Percent Deviation of Anodic Potential With Respect to Applied External Resistance.
The Linear Fit at High External Resistances (Region B) Represents a Region in Which
the External Resistance Controls the Power. The region at low external resistances
(Region A) represents a region in which the power is limited by kinetics, mass transfer,
or internal resistance.
The relative decrease in anodic potential (RDAP) is used to select the external
resistor to measure the maximum sustainable power of this microbial fuel cell (D). When
external resistance is high, the RDAP increases linearly with decreasing external
resistance because the electron delivery to the cathode is limited by external resistance
(region B in D). However, when a low external resistance is applied, the electron delivery
to the cathode is limited by any one of the power limiting factors discussed in the
Page 105
93
introduction (region A in D), and the RDAP increases with decreasing external
resistance. However, the RDAP increases with decreased external resistance, with
different slopes, for external resistance limited or internal resistance limited conditions.
The conditions where external and internal resistance limitations are equal is somewhere
between these two lines, which is presented as a shaded area (resistances between 2.5 and
4 kΩ). When line A and line B intersect, a horizontal line is drawn from the intersection
to estimate the external resistor that allows for the measurement of sustainable power.
Experiments showed that any external resistance between 2.5 and 4 kΩ provides very
close power values (less than 20% difference between them, so that the selection of an
external resistor between 2.5 and 4 kΩ does not produce a significant error in the
estimation of sustainable power). However, the power remained constant for long period
of time only when a 4 kΩ or larger resistor was used. Although this graphical procedure
indicated that a 3.5 kΩ resistor should be used to obtain sustainable power, there is less
than a 10% difference in the power generated when a 3.5 or 4 kΩ resistor was used.
Therefore, a 4 kΩ resistor was used to measure power of this microbial fuel cell.
Page 106
94
APPENDIX B
MICROBIAL FUEL CELL LAB: INTRODUCTION TO MICROBIAL FUEL CELLS
Page 107
95
Today‟s laboratory is intended to serve as a hands-on introduction to microbial fuel cells.
The biological fuel cell was described in 1969 as an “electrochemical energy converter”
(Bockris & Srinivasan, 1969). In the 1990‟s, Allen and Bennetto described a microbial
fuel cell as able to withdraw electrons from the oxidation of a carbohydrate (glucose) as
electrical energy (Allen & Bennetto, 1996). A microbial fuel cell, like other
electrochemical cells, has both an anode and a cathode, separated by a semi-permeable
cation exchange membrane. Bacteria in the anodic compartment produce electrons
through a microbial oxidation reaction. These electrons are consumed in the cathodic
compartment for the reduction of another chemical species, often oxygen. The flow of
electrons occurs through an external load in order to produce power. The flow of
electrons is balanced with a flow of cations through the semi-permeable membrane. A
microbial fuel cell is different from other fuel cells because the produced power is low
compared to other conventional fuel cells. Either microbial or chemical, the power of the
fuel cell is the most important parameter since it is used 1) to determine efficiency of the
fuel cells, 2) to compare efficiency of the cells and, 3) used to compare different fuel
cells.
The power of a microbial fuel can be measured by applying an external load
(generally an external resistor) and measuring the potentials and the current.
The figure below shows a typical set-up of a microbial fuel cell. The cathodic side
of the microbial fuel cell includes a saturated calomel electrode. This electrode is used to
compare the potential in the microbial fuel cell to a known potential. The cathode itself is
often a carbon (graphite) rod. The anodic side of the microbial fuel cell has living
Page 108
96
bacteria inside. These bacteria consume glucose and produce electrons. These electrons
travel from inside the bacteria to the anode (often a graphite rod) and move to the cathode
through a load. Examples of this load might be a light bulb, a resistor, or a chemical
sensor. The flow of electrons from the anode to the cathode is called the current. The
current is calculated using Ohm‟s Law:
RIV
In this equation, V is the potential difference between the anode and the cathode
(in Volts), I is the current (in Amps), and R is the resistance applied (in Ohms). The
power in a microbial fuel cell is calculated using the following equation:
RIP 2
If calculated using Amps for current and Ohms for resistance, the resultant power
has units of Watts.
The Microbial Fuel Cell
Page 109
97
Station 1: Assembly and Disassembly Station
The idea behind this station is to be able to look at the components of a microbial
fuel cell. Look closely at the assembled microbial fuel cell and the disassembled
components of the microbial fuel cells. Take some time to assemble a microbial fuel cell
using the already assembled cell as your guide.
Make a sketch of a microbial fuel cell and all of its components. Label all of the
components. Include in your diagram a description of how the electrons flow in a
microbial fuel cell.
Station 2: The Operational Microbial Fuel Cell
Look at the operational microbial fuel cell. Briefly identify any activity (bubbling,
pumping, etc.) and when you have completed Station 1, include this information on your
overall microbial fuel cell diagram. Use a multimeter to find the potential difference
across the microbial fuel cell and use a 10 ohm resistor to find the current of the
microbial fuel cell. Repeat these measurements using a “D-sized” battery.
Compare the potential of the microbial fuel cell to the potential of the battery.
Explain the differences in terms of the maximum power that can be produced.
Compare the current produced by the microbial fuel cell to that produced by the battery
when the 10 ohm resistor is included in the circuit. Why does the current from the
microbial fuel cell decrease with respect to time?
Calculate the current expected for the fuel cell and the battery using Ohm‟s Law.
Use the potentials found in question 1 and the given resistor value. Compare these results
to those found in question 2.
Page 110
98
Station 3: Application of Microbial Fuel Cells I
These stations introduce a number of ways that microbial fuel cells may be further
optimized in order to maximize their power. You will be asked a number of questions
regarding these methods of optimization.
Carefully look at the column-type microbial fuel cell. Make a quick sketch and
label each of the major components (anode, cathode, etc.).
Each stainless steel ball is an anode in the column type microbial fuel cell. There is only
one cathode, at the top of the cell. Will there be differences in the current produced
between each anode and the cathode? Why?
Station 4: Application of Microbial Fuel Cells II
Four “D-cell” batteries are connected in series in order to provide power to light a
small bulb. Each switch increases the number of batteries involved in the powering of the
light bulb. Switch 1 has only one battery, Switch 2 includes two batteries, and so on.
Diagram the system and relate the number of batteries used to the brightness of the bulb.
What is causing the change in brightness in the bulb?
The resistance of the light bulb is 0.7 ohm. Calculate the current passing through the light
bulb and calculate the power used by the bulb for each of the four battery configurations.
Explain how a series of microbial fuels might be different from a single microbial fuel
cell.
Putting It All Together: What Have You Learned?
A microbial fuel cell is different from other fuel cells because the produced power
is low compared to other conventional fuel cells. However, an optimized microbial fuel
Page 111
99
cell has been shown to be able to power a chemical sensor in order to monitor the
concentration of heavy metals in natural bodies of water. How would you “optimize” a
microbial fuel cell? What parameters can you control? What can‟t you control?
The ability of microbial fuel cells to operate for very long periods of time makes them
ideal for applications where power needs to be provided in small quantities but
continuously. List five or six applications that you can think of that require very little
power but have a practical use.
Microbial fuel cells also are thought to have greatest use when used in remote
environments. List five or six remote environments that we, as scientists and engineers,
have interest in.
A microbial fuel cell using the natural bacteria in a river was able to power a
chemical sensor. The data collected was transmitted via satellite to a receiver and was
accessible on the internet. A diagram of this process is shown in Shantaram, et al.
(Shantaram, et al. 2005).
Page 112
100
The ability to sit in a laboratory thousands of miles away from a body of water be
able to monitor its condition is an example of how microbial fuel cells can be used in a
remote environment. On the next page, do your best to sketch an application for a
microbial fuel cell that is of your own design. Explain why you must be able to
continuously provide power (sustainable power) using the microbial fuel cell as well as
why a microbial fuel cell might be more appropriate than a traditional power source
(battery, etc.) for this application.
Block Diagram of the Telemetry System Powered by a Microbial Fuel Cell (Shantaram,
et al. 2005). Used With Permission.
Page 113
101
APPENDIX C
IMPLEMENTATION OF LEARNING OBJECTIVES
Page 115
103
APPENDIX D
STEP-BY-STEP PROCEDURE FOR THE IMPLEMENTATION OF A MICROBIAL
FUEL CELL EXPERIMENT INTO AN INTRODUCTORY CHEMICAL AND
BIOLOGICAL ENGINEERING COURSE
Page 116
104
Preparation of the Growth Media for the Anodic Compartment:
1. Place 10 g/L tryptone, 5 g/L yeast extract, 5 g/L sodium chloride, 9.12 g/L Na2HPO4,
1.75 g/L KH2PO4, and 1 g/L glucose into an autoclavable vessel.
2. Add a magnetic stir bar and stir on a magnetic stir plate until fully dissolved.
3. Autoclave at 121oC for at least 30 minutes.
Preparation of the Stock Culture:
1. Add 1 mL of a frozen culture of K. pneumoniae to 100 mL of growth media.
2. Place at room temperature on a rotary shaker (150 rpm) and allow growth overnight
(18 h).
Preparation of the Phosphate Buffer:
1. Add 1.825 g/L of Na2HPO4 and 0.35 g/L of KH2PO4 to deionized water.
2. Adjust to a pH of 7.2.
Preparation of the Microbial Fuel Cell:
1. Soak the cation exchange membrane in 1 M NaCl for at least 24 hours.
2. Clean the microbial fuel cell thoroughly in deionized water.
3. Fill both compartments of the cell with deionized water.
4. Place a rubber stopper in the open port used to house the reference electrode.
5. Autoclave the MFC at 121oC for at least 20 minutes.
6. Remove the rubber stopper and insert a saturated calomel electrode (SCE).
7. Drain the water in the anodic and cathodic compartments.
8. Pump growth medium into the anodic compartment of the cell until full, then cease
pumping.
9. Pump phosphate buffer into the cathodic compartment of the fuel cell until full, then
cease pumping.
10. Inoculate 60 mL of K. pneumoniae stock culture into the cell, replacing 60 mL of the
sterile medium.
11. Allow the bacteria to grow in batch mode until the anodic potential stabilizes (~-
450 mVSCE). This will take up to five days.
12. Pump sterile medium into the anodic compartment at a flow rate of 0.3 mL/min for
the duration of the experiments.
Page 117
105
Preparation of Data Logger:
To Find the Potential Measurements (Menicucci, et al. 2006):
1. Connect the anode to potential channel 1 of the data logger.
2. Connect the cathode to potential channel 2 of the data logger.
3. Connect the SCE to the common terminal of the potential channels.
Preparation of Data Logger:
To Find the Current Measurement (Menicucci, et al. 2006):
1. Connect the anode and the cathode in series to the current channel through a variable
resistor box.
2. Configure the data logger so it will collect potential and current measurements every
ten seconds.
3. Start the data logger.
4. Set the variable resistance box so the total external resistance is equal to 10 kΩ
5. Start a stopwatch after making an electrical connection between the microbial fuel
cell and the variable resistance box.
6. After 60 seconds, decrease the external resistance by 0.5 kΩ.
7. Repeat until the external resistance reaches 0.5 kΩ.
8. After 60 seconds, decrease the external resistance by 50 Ω.
9. Repeat until the external resistance reaches 50 Ω.
10. After 60 seconds, decrease the external resistance to 10 Ω.
11. Collect data for 10 minutes at 10 Ω.
12. Remove the connection between the microbial fuel cell and the variable resistance
box.
13. Stop the data logger.
14. Export the data to Microsoft Excel (or a comparable spreadsheet).
Data Analysis:
1. Hide all columns except those that contain the measurement time, anodic potential,
cathodic potential, and measured current.
2. Convert the potentials from units of V to units of mV.
3. Convert the current from units of A to units of µA.
4. Find the mean (and standard deviation) of each potential and current measurement at
each external resistance.
5. Plot current vs. time.
6. Plot the cell potential vs. the current.
Page 118
106
REFERENCES CITED
Page 119
107
Aglan, H.A. and S.F. Ali. "Hands-On Experiences: An Integral Part of Engineering
Curriculum Reform." Journal of Engineering Education, 1996: 327-330.
Akin, C., A. Maka, S. Patel, J. Conrad, and J. Benemann. Removal of CO2 from Flue
Gases by Algae. Chicago, IL: Institute of Gas Technology, 1993.
Allen, R.M., and H.P. Bennetto. "Microbial Fuel-Cells: Electricity Production from
Carbohydrates." Applied Biochemistry and Biotechnology 39, no. 1 (1993): 27-40.
Amin, S.A., D.H. Green, M.C. Hart, F.C. Kupper, W.G. Sunda, and C.J. Carrano.
"Photolysis of Iron–Siderophore Chelates Promotes Bacterial–Algal Mutualism."
Proceedings of the National Academy of Sciences of the United States of America 106
(2009): 17071-17076.
Anderl, J.N, J. Zahller, F. Roe, and P.S. Stewart. "Role of Nutrient Limitation and
Stationary-Phase Existence in Klebsiella pneumoniae Biofilm Resistance to Ampicillin
and Ciprofloxacin." Antimicrobial Agents and Chemotherapy 47 (2003): 1251-1256.
Banerjee, A., R. Sharma, Y. Chisti, and U.C. Banerjee. "Botryococcus braunii : A
Renewable Source of Hydrocarbons and Other Chemicals." Critical Reviews in
Biotechnology, 2002: 245-279.
Bennetto, H.P., and G. Delaney. "Microbial Fuel-Cells." Process Biochemistry 18, no. 4
(1983): R17.
Bockris, John O'M, and Supramaniam Srinivasan. Fuel Cells: Their Electrochemistry. 1st
Edition. New York: McGraw-Hill Book Company, 1969.
Bond, D.R., and D.R. Lovley. "Electricity Production by Geobacter sulfurreducens
Attached to Electrodes." Applied and Environmental Microbiology 69, no. 3 (2003):
1548-1555.
Bransford, J.D., and A.L. Brown. How People Learn: Brain, Mind, Experience, and
School. Washington, D.C.: National Academy Press, 2000.
Casadevall, E., D. Dif, C. Largeau, C. Gudin, D. Chaumont, and O. Dasanti. "Studies on
Batch and Continuous Cultures of Botryococcus braunii: Hydrocarbon Production in
Relation to Physiological State, Cell Ultrastructure, and Phosphate Nutrition."
Biotechnology and Bioengineering 27 (1985): 286-295.
Chang, I. S., et al. "Continuous Determination of Biochemical Oxygen Demand Using
Microbial Fuel Cell Type Biosensor." Biosensors and Bioelectronics 19, no. 6 (2004):
607-613.
Characklis, W.G., and K.C. Marshall. Biofilms. Edited by W.G. Characklis and K.C.
Marshall. New York: John Wiley & Sons, 1990.
Page 120
108
Chaudhuri, S.K., and D.R. Lovley. "Electricity Generation by Direct Oxidation of
Glucose in Mediatorless Microbial Fuel Cells." Nature Biotechnology 19, no. 6 (2003):
1229-1232.
Chirac, C., E. Casadevall, C. Largeau, and P. Metzger. "Bacterial Influence Upon Growth
and Hydrocarbon Production of the Green Alga Botryococcus braunii." Journal of
Phycology 21 (1985): 380-387.
Choi, Y., E. Jung, H. Park, S. R. Paik, S. Jung, and S. Kim. "Construction of Microbial
Fuel Cells Using Thermophilic Microorganisms, Bacillus licheniformis and Bacillus
thermoglucosidasius." Bulletin of the Korean Chemical Society 25 (2004): 813-818.
Cobb, J. T., et al. "How Is the Marketplace Changing for Chemical Engineering?" AIChE
Centennial Book, 2008: Chapter 24.
Crispim, C.A, P.M. Gaylarde, and C. C. Gaylarde. "Algal and Cyanobacterial Biofilms
on Calcareous Historic Buildings." Current Microbiology 46 (2003): 79-82.
Dahm, K., and R.P. Hesketh. "Two Experiments for the Introductory Chemical Reaction
Engineering Course." Education for Chemical Engineers 3, no. 1 (2007): e1-e5.
Dahm, K., R.P. Hesketh, and M.J. Savelski. "Micromixing Experiments in the
Introductory Chemical Reaction Engineering Course." Chemical Engineering Education,
2005: 94-99.
Davies, D.G., Parsek, M.R., Pearson, J.P., Iglewski, B.H., Costerton, J. W., and
Greensberg. "The Involvement of Cell-to-Cell Signals in the Development of a Bacterial
Biofilm." Science 280 (1998): 295-298.
Dewan, A., H. Beyenal, and Z. Lewandowski. "Intermittent Energy Harvesting Improves
the Performance of Microbial Fuel Cells." Environmental Science and Technology 43
(2009): 4600-4605.
Dresselhaus, M.S., and I.L. Thomas. "Alternative Energy Technologies." Nature 414
(November 2001): 332-337.
Eberly, W.R. "Problems in the Laboratory Culture of Planktonic Blue-Green Algae." In
Environmental Requirements of Blue-Green Algae, 7-34. Corvallis, OR: Federal Water
Pollution Control Administration, 1966.
EG & G Services. Fuel Cell Handbook. 7th. Morgantown, WA: U.S. Dept. of Energy,
Office of Fossil Energy, National Energy Technology Laboratory, 2004.
Farrell, S., and R.P. Hesketh. "An Introduction to Drug Delivery for Chemical
Engineers." Chemical Engineering Education 36, no. 3 (2002): 198-215.
Page 121
109
Felder, R.M., and R.W. Rosseau. Elementary Principles of Chemical Processes. New
York: John Wiley and Sons, 2000.
Fernandes, H.L., F. Lupi, M.M. Tome, I. Sa-Correia, and J.M. Novais. "Rheological
Behavior of the Culture Medium During Growth of the Microalga Botryococcus braunii."
Bioresource Technology 38 (1991): 133-136.
Gilbert, P., A.J. McBain, and A.H. Rickard. "Formation of Microbial Biofiilm in
Hygienic Situations: A Problem of Control." International Biodeteriation and
Biodegradation 51 (2003): 245-248.
Gorby, Y.A., et al. "Electrically Conductive Bacterial Nanowires Produced by
Shewanella oneidensis Strain MR-1 and Other Microorganisms." Proceedings of the
National Academy of Sciences of the United States of America 103 (2006): 11358-11363.
Gzebyk, M., and G.P. Pozniak. "Microbial fuel cells (MFCs) with Interpolymer Cation
Exchange Membranes." Separation and Purification Technology 41, no. 3 (2005): 321-
328.
Hall-Stoodley, L., and P. Stoodley. "Developmental Regulation of Microbial Biofilms."
Current Opinion in Biotechnology 13 (2002): 228-233.
Hamlen, R.P., and T.B. Atwater. Handbook of Batteries. New York: McGraw-Hill
Professional, 2001.
Hartman, H., and M. Hartman. "Leaving Engineering: Lessons from Rowan University's
College of Engineering." Journal of Engineering Education, 2006: 49-61.
He, Z., N. Wagner, S.D. Minteer, and L.T. Angenent. "An Upflow Microbial Fuel Cell
with an Interior Cathode: Assessment of the Internal Resistance by Impedance
Spectroscopy." Environmental Science and Technology 40 (2006): 5212-5217.
He, Z., S.D. Minteer, and L.T. Angenent. "Electricity Generation from Artificial
Wastewater Using an Upflow Microbial Fuel Cell." Environmental Science and
Technology 39, no. 14 (2005): 5262-5267.
Hesketh, R.P. "Wake-Up to Engineering." Chemical Engineering Education 30, no. 3
(1996).
Hesketh, R.P., C.S. Slater, S. Farrell, and M. Carney. "Fluidized Bed Polymer Coating
Experiment." Chemical Engineering Education 36, no. 2 (2002): 138-143.
Hillen, L.W., G. Pollard, L.V. Wake, and N White. "Hydrocracking of the Oils of
Botryococcus Braunii to Transport Fuels." Biotechnology and Bioengineering 24 (1982):
193-205.
Page 122
110
Jahnke, J., and U.B. Priefer. "Phototrophic Biofilms of Restored Fields in the Rhenish
Lignite Mining Area: Development of Soil Algal, Bacterial, and Fungal Biomasses." Soil
Biology and Biochemistry 34 (2002): 1157-1165.
Jang, J. K., et al. "Construction and operation of a novel mediator and membrane-less
microbial fuel cell." Process Biochemistry 39, no. 8 (2004): 1007-1012.
Jarvie, H.P., et al. "Phosphorus Uptake Into Algal Biofilms in a Lowland Chalk River."
The Science of the Total Environment 282-283 (2002): 353-373.
Jayawickramarajah, Narendren. "Characterization of Surface Colonization by Microalgae
Using Botryococcus braunii and Dunaliella tertiolecta." Bozeman, MT: Montana State
University-Bozeman, 2003.
Kim, H.J., Park, H.S., H.S. Hyun, I.S. Chang, M. Kim, and B.H. Kim. "A Mediator-Less
Microbial Fuel Cell Using a Metal Reducing Bacterium, Shewanella putrefaciens."
Enzyme and Microbial Technology 30, no. 2 (2002): 145-152.
Kim, N., Y. Choi, S. Jung, and S. Kim. "Effect of Initial Carbon Sources on the
Performance of Microbial Fuel Cells Containing Proteus vulgaris." Biotechnology and
Bioengineering 70 (2000): 109-114.
Largeau, C., E. Casadevall, C. Berkaloff, and P. Dhamelincourt. "Sites of Accumulation
and Composition of Hydrocarbons in Botryococcus braunii." Physiochemistry, 1980:
1043-1051.
Lee, S.A.L., Y. Choi, S. Jung, and S. Kim. "Effect of Inital Carbon Sources on the
Electrochemical Detection of Glucose by Gluconobacter oxydans." Bioelectrochemistry
57, no. 2 (2002): 173-178.
Lefebvre, B.G., L. E. Connell, and K.D. Dahm. "Competition between student groups in
the protein production challenge." Education for Chemical Engineers, 2009.
Liu, H., S. Cheng, and B. E. Logan. "Production of Electricity from Acetate or Butyrate
Using a Single-Chamber Microbial Fuel Cell." Environmental Science and Technology
39 (2005): 658-662.
Liu, H., S. Cheng, and B.E. Logan. "Power Generation in Fed-Batch Microbial Fuel Cells
as a Function of Ionic Strength, Temperature, and Reactor Configuration." Environmental
Science and Technology, 2005: 5488-5493.
Logan, B., S. Cheng, V. Watson, and G. Estadt. "Graphite Fiber Brush Anodes for
Increased Power Production in Air-Cathode Microbial Fuel Cells." Environmental
Science and Technology 41 (2007): 3341–3346.
Page 123
111
Man, B., S. Cheng, and B.E. Logan. "Electricity generation using membrane and salt
bridge microbial fuel cells." Water Research 39 (2005): 1675-1686.
Menicucci, J.A., H. Beyenal, E. Veluchamy, R.R.A. Marsili, G. Demir, and Z.
Lewandowski. "Procedure for Determining Maximum Sustainable Power Generated by
Microbial Fuel Cells." Environmental Science and Technology 40, no. 3 (2006): 1062-
1068.
Menicucci, Joseph, James Duffy, and Betsy Palmer. "Hands-On Introduction to Chemical
and Biological Engineering." American Society for Engineering Education Annual
Conference & Exposition. Honolulu, 2007.
Metzger, P., C. Berkaloff, E. Casadevall, and A. Coute. "Alkadiene- and Botryococcene-
Producing Races of Wild Strains of Botryococcus Braunii." Phytochemistry 24 (1985):
2305-2312.
Morris, J. M., S. Jin, J. Q. Wang, C. Z. Zhu, and M. A. Urynowicz. "Lead Dioxide as an
Alternative Catalyst to Platinum in Microbial Fuel Cells." Electrochemistry
Communications 9 (2007): 1730-1734.
Mueller, R.F., W.G. Characklis, W.L. Jones, and J.T. Sears. "Characterization of Initial
Events in Bacterial Surface Colonization by Two Pseudomonas Species Using Image
Analysis." Biotechnology and Bioengineering 39 (1992): 1161-1170.
NSF. New Formulas for America's Workforce: Girls in Science and Engineering, NSF
03-208. Arlington, VA: NSF, 2003.
Oh, S. E., J. Kim, B. Min, and B. E. Logan. "Electricity Generation from Food and
Animal Wastewaters Using Microbial Fuel Cells." Abstracts of Papers of the American
Chemical Society . Washington D.C., 2005. U1691–U1692.
Paje, M.L.F, Kuhlicke, U., Winkler M., and T.R. Neu. "Inhibition of Iotic Biofilms by
Diclofenac." Applied Microbiology and Biotechnology 59 (2002): 488-492.
Park, D. H., and J. G. Zeikus. "Electricity Generation in Microbial Fuels Using Neutral
Red as an Electronophore." Applied and Environmental Microbiology 66 (2000): 1292-
1297.
Park, D.H., and J.G. Zeikus. "Improved Fuel Cell and Electrode Designs for Producing
Electricity from Microbial Degradation." Biotechnology and Bioengineering 81, no. 3
(2003): 348-355.
Park, H.S., et al. "A Novel Electrochemically Active and Fe(III)-reducing Bacterium
Phylogentically Related to Clostridium butyricum Isolated from a Microbial Fuel Cell."
Anaerobe 7, no. 6 (2001): 297-306.
Page 124
112
Pham, T. H., J. K. Jang, I. S. Chang, and B. H. Kim. "Improvement of Cathode Reaction
of a Mediatorless Microbial Fuel Cell." Journal of Microbiology and Biotechnology 14
(2004): 324-329.
Pizzariello, A., M. Stred'ansky, and S. Miertus. "A Glucose/Hydrogen Peroxide Biofuel
Cell That Uses Oxidase and Peroxidase as Catalysts by Composite Bulk-Modified
Bioelectrodes Based on a Solid Binding Matrix." Bioelectrochemistry 56, no. 1-2 (2002):
99-105.
Prasad, D., et al. "Direct Electron Transfer with Yeast Cells and Construction of a
Mediatorless Microbial Fuel Cell." Biosensors and Bioelectronics 22 (2007): 2604-2610.
Prince, M. "Does Active Learning Work? A Review of the Research." Journal of
Engineering Education 93 (2004): 223-231.
Pryfogle, P.A., J.A. Menicucci, N. Jayawickramarajah, J.T. Sears, and G.A. Bala.
Enhanced Conversion of CO2 by Structured Microorganisms. Idaho Falls, ID: INEEL,
2003.
Putt, R., N. Naimer, and B. Koretz. "Advanced Zinc-Air Primary Batteries." The 39th
Power Sources Conference. Cherry Hill, NJ, 2000.
Rabaey, K, and W Verstraete. "Microbial fuel cells: Novel Biotechnology for Energy
Generation." Trends in Biotechnology, 2005: 291-298.
Rabaey, K, N Boon, S.D. Siciliano, M. Verhaege, and W. Verstraete. "Biofuel Cells
Select for Microbial Consortia That Self-Mediate Electron Transfer." Applied and
Environmental Microbiology 70 (2004): 5373-5382.
Rabaey, K., P. Clauwaert, P. Aelterman, and W. Verstraete. "Tubular Microbial Fuel
Cells for Efficient Electricity Generation." Environmental Science and Technology 39
(2005): 8077–8082.
Rabaey, K., W. Ossieur, M. Verhaege, and W. Verstraete. "Continuous Microbial Fuel
Cells Convert Carbohydrates to Electricity." Water Science and Technology 23, no. 6
(2005): 515-523.
Reguera, G, et al. "Biofilm and Nanowire Production Leads to Increased Current in
Geobacter sulfurreducens Fuel Cells." Applied and Environmental Microbiology 2006
(2006): 7345-7348.
Reimers, C. E., L. M. Tender, S. Fertig, and W. Wang. "Harvesting Energy from the
Marine Sediment-Water Interface." Environmental Science and Technology 35 (2001):
192-195.
Page 125
113
Rhoads, A., H. Beyenal, and Z. Lewandowski. "Microbial Fuel Cell using Anaerobic
Respiration as an Anodic Reaction and Biomineralized Manganese as a Cathodic
Reactant." Environmental Science and Technology 39, no. 12 (2005): 4666-4671.
Rice, A.R., M. A. Hamilton, and A.K. Camper. "Apparent Surface Associated Lag Time
in Growth of Primary Biofilm Cells." Microbial Ecology 41 (2000): 8-15.
Romani, A.M., and S. Sabater. "Influence of Algal Biomass on Extracellular Enzyme
Activity in River Biofilms." Microbial Ecology 41 (2000): 16-24.
Sawyer, D.T., W.R. Heineman, and J.M. Beebe. Chemistry Experiments for Instrumental
Methods. New York: John Wiley and Sons, 1984.
Schaetzle, O., F. Barriere, and U. Schroder. "An Improved Microbial Fuel Cell with
Laccase as the Oxygen Reduction Catalyst." Energy & Environmental Science 2 (2009):
96-99.
Schenk, Peer M., et al. "Second Generation Biofuels: High-Efficiency Algae for
Biodiesel Production." BioEnergy Research 1, no. 1 (March 2008): 20-43.
Scheuerman, T.R., A.K. Camper, and M.A. Hamilton. "Effects of Substratum
Topography on Bacterial Adhesion." Journal of Colloid and Interface Science 208
(1998): 23-33.
Schroder, U., and J. Niesen. "A Generation of Microbial Fuel Cells with Current Outputs
Boosted by More Than One Order of Magnitude." Angewandte Chemie, International
Edition 42, no. 25 (2003): 2880-2883.
Seymour, E.Y., and N.M. Hewitt. Talking About Leaving: Why Undergraduates Leave
the Sciences. Colorado: Westview Press, 1997.
Seymour, J., S. Codd, J. Duffy, and B. Palmer. "Using MRI in an Introductory Chemical
and Biological Engineering Course." American Society for Engineering Education
Annual Conference and Exposition. Portland, Oregon, 2005.
Shantaram, A., H. Beyenal, R.R.A. Veluchamy, and Z. Lewandowski. "Wireless Sensors
Powered by Microbial Fuel Cells." Environomental Science and Technology 39, no. 13
(2005): 5037-5042.
Simon, E., C.M. Halliwell, S.T. Chee, A.E.G Cass, and P.N. Bartlett. "Oxidation of
NADH Produced by a Lactate Dehydrogenase Immobilised on Poly(aniline)-Poly(anion)
Composite Films." Journal of Electroanalytical Chemistry 538-539 (2002): 253-259.
Stoodley, P., J.D. Boyle, I. Dodds, and H.M. Lappin-Scott. "Consensus Model of Biofilm
Structure." In Biofilms: Community Interactions and Control, edited by J.W.T.
Page 126
114
Wimpenney, P.S. Handley, P. Gilbert, H.M. Lappin-Scott and M. Jones, 1-9. Cambridge:
Cambridge University Press, 1997.
Stoodley, P., S. Wilson, L. Hall-Stoodley, J.D. Boyle, H.M. Lappin-Scott, and J.W.
Costerton. "Growth and Detachment of Cell Clusters from Mature Mixed-Species
Biofilms." Applied and Environmental Microbiology 67 (2001): 5608-5613.
Wehr, J.D., and R.G. Sheath. Freshwater Algae of North America. Academic Press, 2003.
Wimpenny, J.W.T. "An Overview of Biofilms as Functional Communities." In
Community Structure and Co-operation in Biofilms, by D.G. Allison, edited by D.G.
Allison, P. Gilbert and H.M. Lappin-Scott, 1-24. Cambridge: Cambridge University
Press, 2000.
Xu, K.D., M.J. Franklin, C. Park, G.A. McFeters, and P.S. Stewart. "Gene Expression
and Protein Levels of the Stationary Phase Sigma Factor, RpoS, in Continuously-Fed
Pseudomonas aeruginosa Biofilms." FEMS Microbiology Letters 199 (2001): 67-71.
Zhang, K., and E. Kojima. "Effect of Light Intensity on Colony Size of Microalga
Botryococcus braunii in Bubble Column Photobioreactors." Journal of Fermentation and
Bioengineering 86 (1998): 573-576.
Zhang, X.-C., and A. Halme. "Modelling of a Microbial Fuel Cell Process."
Biotechnology Letters 17, no. 8 (1995): 809-814.