NREL is a national laboratory of the U.S. Department of Energy, Office of Energy Efficiency and Renewable Energy, operated by the Alliance for Sustainable Energy, LLC. Algal Biofuel Techno-Economic Analysis Algae Peer Review May 22, 2013 Alexandria, VA Ryan Davis National Renewable Energy Laboratory
Transcript
NREL is a national laboratory of the U.S. Department of Energy, Office of Energy Efficiency and Renewable Energy, operated by the Alliance for Sustainable Energy, LLC.
Algal Biofuel Techno-Economic Analysis
Algae Peer Review May 22, 2013 Alexandria, VA Ryan Davis National Renewable Energy Laboratory
NATIONAL RENEWABLE ENERGY LABORATORY
Goals and Objectives
2
• The goal of this task is to develop baseline techno-economic analysis and user models for algal biofuels
• Serves as a benchmark against which process variations can be compared
• This task directly supports the Biomass Program by assisting
in the development of baseline costs and future cost targets
• Nov 2012 MYPP goal: “Assess multiple algae production and processing systems for commercial viability and sustainability”
• Leverages decades of experience in cost-driven R&D for other biomass conversion platforms (biochemical, thermochemical, etc)
• Using techno-economic analysis (TEA) and modeling, NREL
provides direction, focus, and support to the biomass program and algae-related projects, guiding R&D towards program goals
• Algae technologies under development can be incorporated into the models in order to quantify their economic impact
• Experimentally verified data will be used in the models to quantify progress towards program goals
• Sensitivity analysis is used to quantify the impact of key variables on overall economics
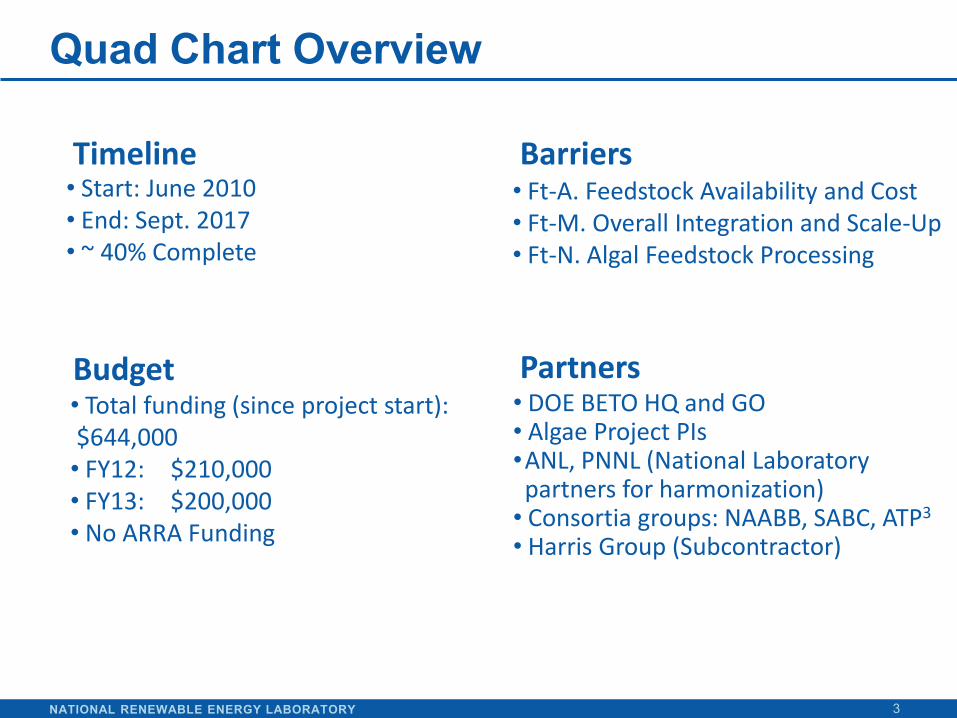
• Ft-A. Feedstock Availability and Cost • Ft-M. Overall Integration and Scale-Up • Ft-N. Algal Feedstock Processing
• Total funding (since project start): $644,000 • FY12: $210,000 • FY13: $200,000 • No ARRA Funding
Timeline
Budget
Barriers
• DOE BETO HQ and GO • Algae Project PIs •ANL, PNNL (National Laboratory partners for harmonization)
• Consortia groups: NAABB, SABC, ATP3
• Harris Group (Subcontractor)
Partners
NATIONAL RENEWABLE ENERGY LABORATORY
$0 $5
$10 $15 $20 $25 $30 $35 $40 $45 $50
Ben
eman
n lo
w
Ben
eman
n hi
gh
NR
EL
low
NR
EL
med
ium
NR
EL
max
imum
NM
SU
low
dem
o
NM
SU
hig
h d
emo
NM
SU
low
com
mer
cial
NM
SU
hig
h c
omm
erci
al
Sol
ix -
curr
ent
Sol
ix -P
hase
I
Sol
ix -
Pha
se II
Sea
mbi
otic
/IEC
, Isr
ael
Bay
er A
G
Gen
eral
Ato
mic
s-C
ase
1
Gen
eral
Ato
mic
s-C
ase
2
Cal
Pol
y W
WT
San
dia
- Rac
eway
San
dia
- PBR
Tapi
e &
Ber
nard
sin
gle …
Tapi
e &
Ber
nard
dou
ble …
US
D/g
al
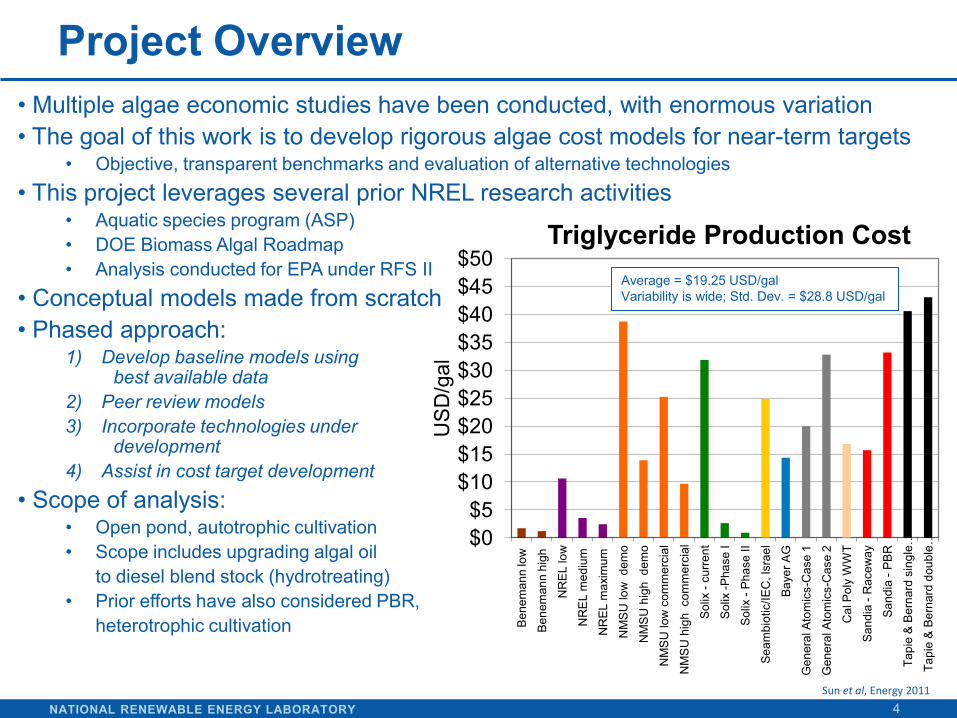
Triglyceride Production Cost Average = $19.25 USD/gal Variability is wide; Std. Dev. = $28.8 USD/gal
Project Overview
4
• Multiple algae economic studies have been conducted, with enormous variation • The goal of this work is to develop rigorous algae cost models for near-term targets
• Objective, transparent benchmarks and evaluation of alternative technologies • This project leverages several prior NREL research activities
• Aquatic species program (ASP) • DOE Biomass Algal Roadmap • Analysis conducted for EPA under RFS II
• Conceptual models made from scratch • Phased approach:
1) Develop baseline models using best available data
2) Peer review models 3) Incorporate technologies under
development 4) Assist in cost target development
• Scope of analysis: • Open pond, autotrophic cultivation • Scope includes upgrading algal oil to diesel blend stock (hydrotreating) • Prior efforts have also considered PBR, heterotrophic cultivation
Sun et al, Energy 2011
NATIONAL RENEWABLE ENERGY LABORATORY
Approach
5
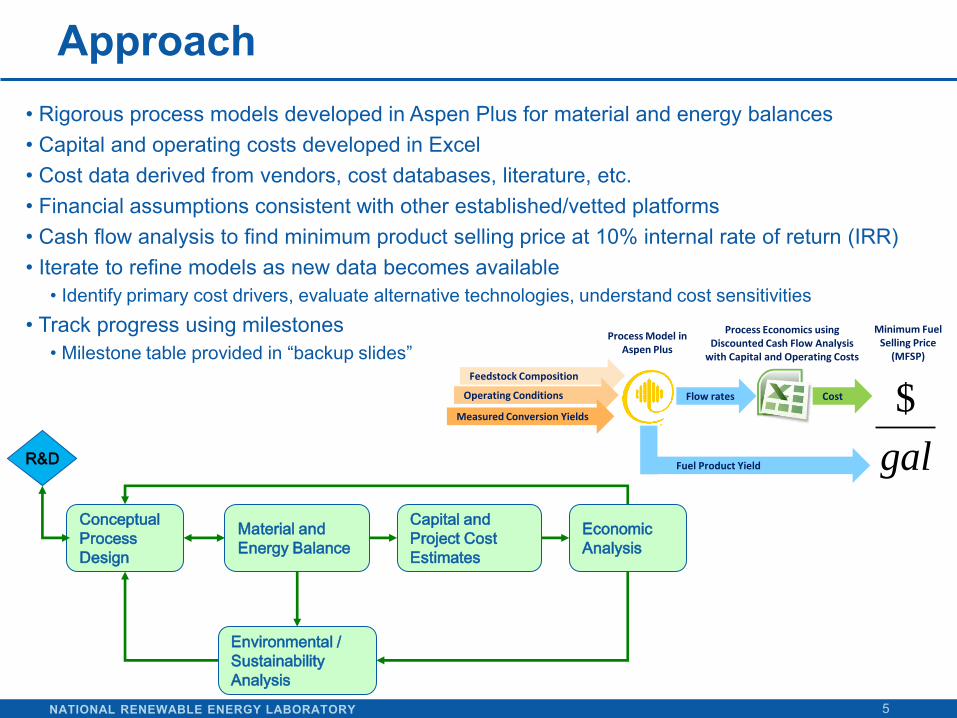
• Rigorous process models developed in Aspen Plus for material and energy balances • Capital and operating costs developed in Excel • Cost data derived from vendors, cost databases, literature, etc. • Financial assumptions consistent with other established/vetted platforms • Cash flow analysis to find minimum product selling price at 10% internal rate of return (IRR) • Iterate to refine models as new data becomes available
• Identify primary cost drivers, evaluate alternative technologies, understand cost sensitivities • Track progress using milestones
• Milestone table provided in “backup slides”
Conceptual
Process
Design
Material and
Energy Balance
Capital and
Project Cost
Estimates
Economic
Analysis
Environmental /
Sustainability
Analysis
R&D
Feedstock Composition
Operating Conditions
Measured Conversion Yields
Process Model in Aspen Plus
Flow rates
Process Economics using Discounted Cash Flow Analysis
with Capital and Operating Costs
Fuel Product Yield
Cost
Minimum Fuel Selling Price
(MFSP)
gal
$
NATIONAL RENEWABLE ENERGY LABORATORY
Accomplishments
6
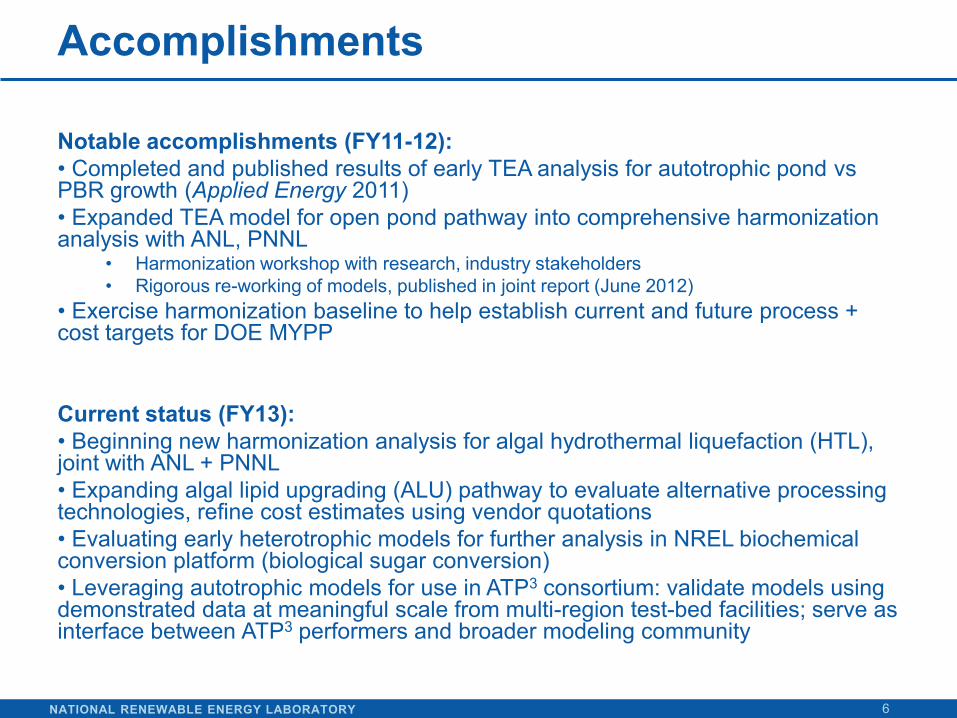
Notable accomplishments (FY11-12): • Completed and published results of early TEA analysis for autotrophic pond vs PBR growth (Applied Energy 2011) • Expanded TEA model for open pond pathway into comprehensive harmonization analysis with ANL, PNNL
• Harmonization workshop with research, industry stakeholders • Rigorous re-working of models, published in joint report (June 2012)
• Exercise harmonization baseline to help establish current and future process + cost targets for DOE MYPP Current status (FY13): • Beginning new harmonization analysis for algal hydrothermal liquefaction (HTL), joint with ANL + PNNL • Expanding algal lipid upgrading (ALU) pathway to evaluate alternative processing technologies, refine cost estimates using vendor quotations • Evaluating early heterotrophic models for further analysis in NREL biochemical conversion platform (biological sugar conversion) • Leveraging autotrophic models for use in ATP3 consortium: validate models using demonstrated data at meaningful scale from multi-region test-bed facilities; serve as interface between ATP3 performers and broader modeling community
NATIONAL RENEWABLE ENERGY LABORATORY
Accomplishments: Algae Harmonization Initiative
7
•Algal biofuel modeling has expanded in recent years, with inconsistent outcomes •Prior TEA, LCA, and resource assessment (RA) modeling conducted by NREL, ANL, and PNNL was done independently (variations in inputs) •Workshop held late 2011
• Stakeholder representatives from industry, research, national labs
• Goal: present algae models on TEA (NREL), LCA (ANL), and RA (PNNL) in order to: 1) Harmonize models to common inputs 2) Identify knowledge gaps 3) Get stakeholder buy-in on assumptions
and benchmark results •Outcomes of workshop
• Identified areas for harmonization, knowledge gaps, modeling uncertainties
• Currently achievable growth rates? • Effects of seasonal variability? • Facility scale? • Requirement for liners? • Nutrient, water, carbon balances
NATIONAL RENEWABLE ENERGY LABORATORY
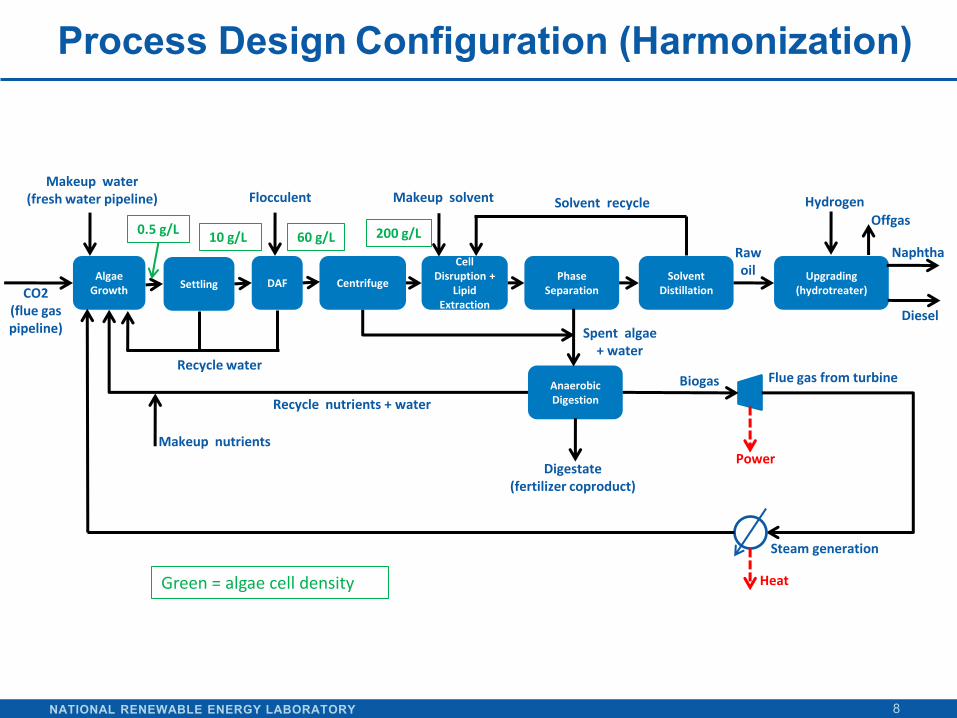
Process Design Configuration (Harmonization)
8
Green = algae cell density
Cell Disruption +
Lipid Extraction
Phase Separation
Solvent Distillation
Upgrading (hydrotreater)
Anaerobic Digestion
Algae Growth CO2
(flue gas pipeline)
Makeup nutrients
Recycle nutrients + water
Makeup solvent Solvent recycle
Spent algae + water
Digestate (fertilizer coproduct)
Biogas Flue gas from turbine
Hydrogen
Offgas
Naphtha
Diesel
Raw oil
Power
Flocculent
Recycle water
Makeup water (fresh water pipeline)
Centrifuge DAF Settling
0.5 g/L 10 g/L 60 g/L 200 g/L
Steam generation
Heat
NATIONAL RENEWABLE ENERGY LABORATORY
Design & Financial Assumptions
9
Design Assumptions (Cultivation) Open pond baseline
Previous Harmonized
Scale of system 10 MM gal/yr oil 10,000 acres (pond area)
Algae productivity [g/m2/day] 25 Per site from RA
Algal cell density [g/L] 0.5 0.5
Lipid content [dry wt%] 25% 25%
Water evaporation rate [cm/day] 0.3 Per site from RA
Pond liners No Yes
CO2 consumed [lb/lb algae] 1.9 2.0
N demand [algae composition, dry wt%] 8.7% 7.7%
P demand [algae composition, dry wt%] 1.3% 0.8%
Operating days/yr 330 330
Financial Assumptions Target internal rate of return (IRR) 10%
•Introducing seasonal variability adds ~$1/gal to cost •High CAPEX dependency, poor utilization of installed capital at low productivity (primarily winter) •Cost reduces as seasonal variability decreases
• Site Group 4 = similar year-average productivity as SG 3 + 5 (higher in summer), but higher cost due to less efficient utilization of installed capital
• SG 8 = $3.50/gal less than SG 4
5 BGY price = $19.60/gal
NATIONAL RENEWABLE ENERGY LABORATORY
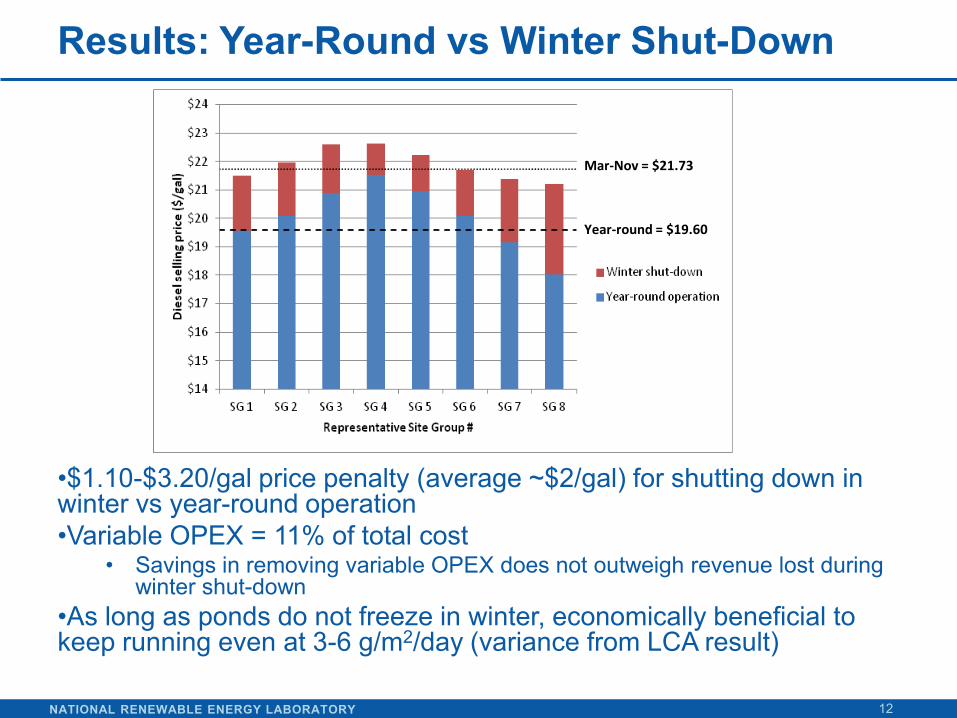
Results: Year-Round vs Winter Shut-Down
12
•$1.10-$3.20/gal price penalty (average ~$2/gal) for shutting down in winter vs year-round operation •Variable OPEX = 11% of total cost
• Savings in removing variable OPEX does not outweigh revenue lost during winter shut-down
•As long as ponds do not freeze in winter, economically beneficial to keep running even at 3-6 g/m2/day (variance from LCA result)
Mar-Nov = $21.73
Year-round = $19.60
NATIONAL RENEWABLE ENERGY LABORATORY
Framing the Analysis
13
-$8 -$6 -$4 -$2 $0 $2 $4 $6 $8 $10
Evaporation rate (0.03 : 0.06 : 0.30 cm/day)
Extraction costs (50% : base : 150%)
Flue gas pipeline distance (0.5 : 1 : 2 miles)
Inoculum costs (50% : base : 150%)
Water blowdown (0% : 25%)
N+P recycle (100% : base : 0%)
Harvesting costs (50% : base : 150%)
Net harvesting efficiency (100% : 95% : 85%)
Operating factor (365 : 330 : 250 days/yr)
Pond liner (no liner : liner : replace liner once)
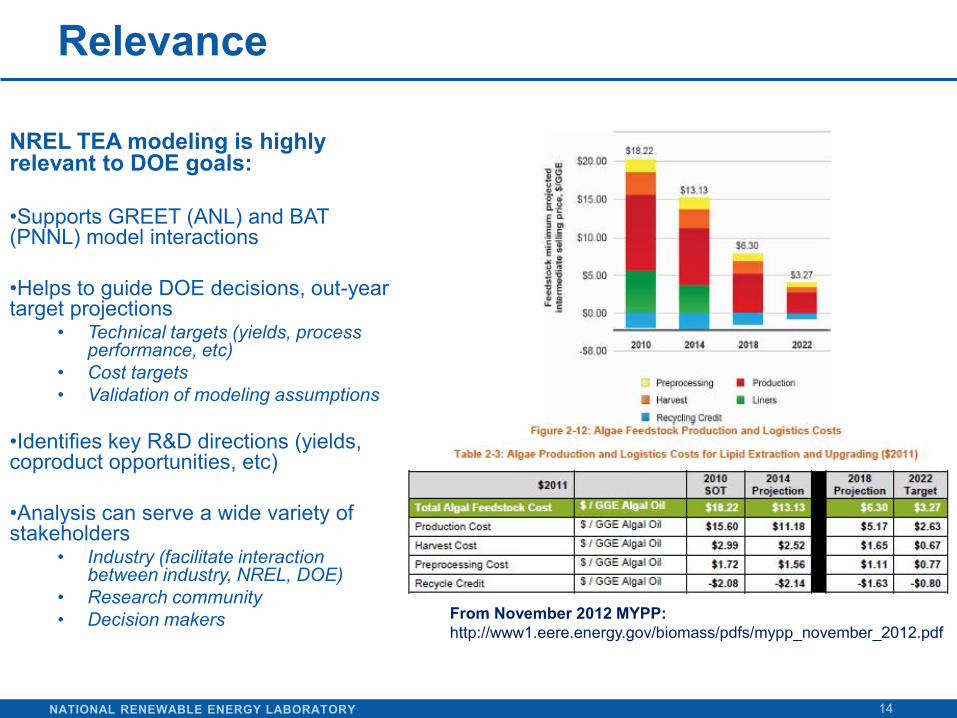
NREL TEA modeling is highly relevant to DOE goals: •Supports GREET (ANL) and BAT (PNNL) model interactions •Helps to guide DOE decisions, out-year target projections
• Technical targets (yields, process performance, etc)
• Cost targets • Validation of modeling assumptions
•Identifies key R&D directions (yields, coproduct opportunities, etc) •Analysis can serve a wide variety of stakeholders
• Industry (facilitate interaction between industry, NREL, DOE)
• Research community • Decision makers From November 2012 MYPP:
Success Factors: • Maintaining close interaction with researchers is crucial • Transparent communication of all assumptions and results to ensure proper
use of data • Buy-in from all stakeholders is critical • Leverage TEA to assist in algae process development and research decisions (not only “analysis for the sake of analysis”)
Challenges:
• Validate algae growth and oil productivity rates based on meaningful, sustained data from large scale demonstrations
• High priority for current and future consortia work (NAABB, SABC, ATP3, FY13 ABY FOA)
• Further evaluate design requirements for pond liners • Critical cost factor in overall TEA results • Will be driven by local regulatory policies, soil/strain characteristics
• Reduce cost and increase efficiency of dewatering/extraction steps • Better characterization of raw oil and upgrading requirements • Further evaluate co-product opportunities *Supporting context provided in: http://www.nrel.gov/docs/fy13osti/58049.pdf
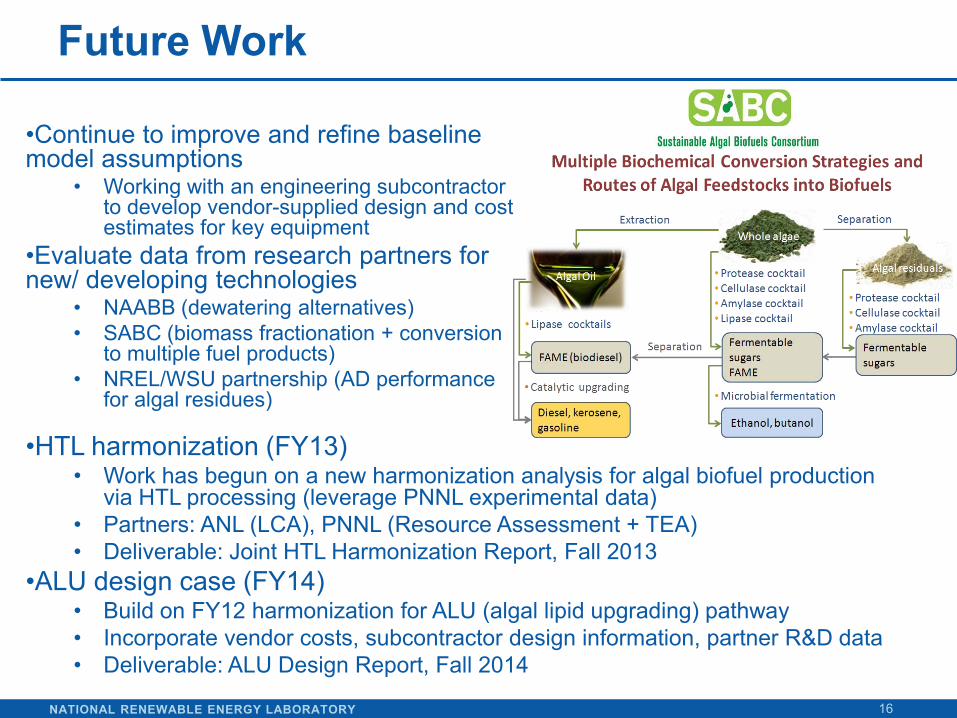
•ALU design case (FY14) • Build on FY12 harmonization for ALU (algal lipid upgrading) pathway • Incorporate vendor costs, subcontractor design information, partner R&D data • Deliverable: ALU Design Report, Fall 2014
NATIONAL RENEWABLE ENERGY LABORATORY
Summary
17
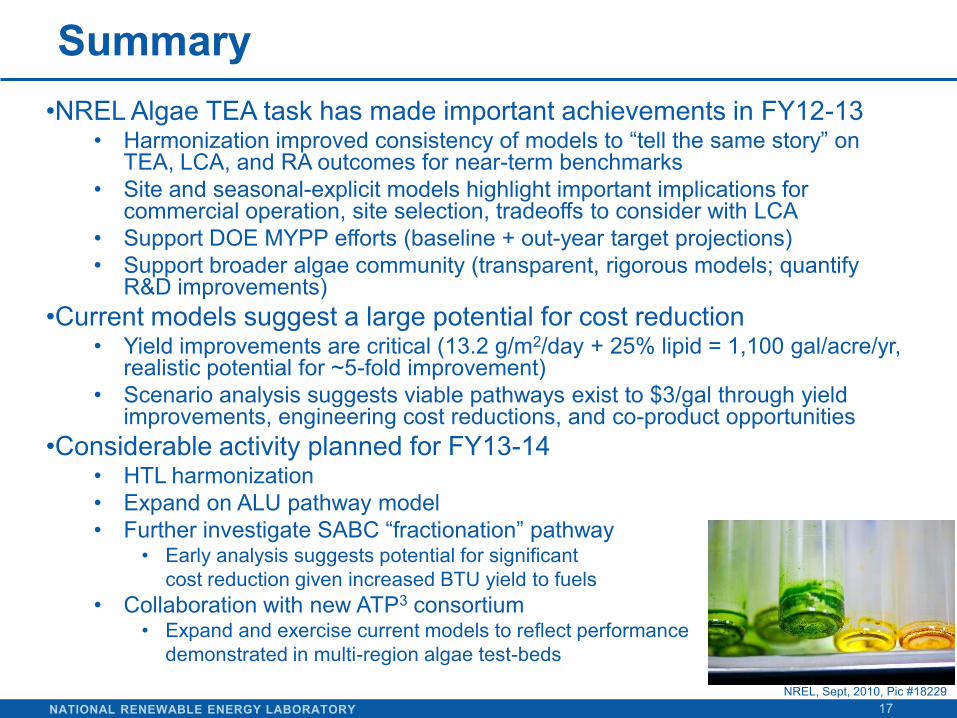
•NREL Algae TEA task has made important achievements in FY12-13 • Harmonization improved consistency of models to “tell the same story” on
TEA, LCA, and RA outcomes for near-term benchmarks • Site and seasonal-explicit models highlight important implications for
commercial operation, site selection, tradeoffs to consider with LCA • Support DOE MYPP efforts (baseline + out-year target projections) • Support broader algae community (transparent, rigorous models; quantify
R&D improvements) •Current models suggest a large potential for cost reduction
• Yield improvements are critical (13.2 g/m2/day + 25% lipid = 1,100 gal/acre/yr, realistic potential for ~5-fold improvement)
• Scenario analysis suggests viable pathways exist to $3/gal through yield improvements, engineering cost reductions, and co-product opportunities
•Considerable activity planned for FY13-14 • HTL harmonization • Expand on ALU pathway model • Further investigate SABC “fractionation” pathway
• Early analysis suggests potential for significant cost reduction given increased BTU yield to fuels
• Collaboration with new ATP3 consortium • Expand and exercise current models to reflect performance demonstrated in multi-region algae test-beds
NREL, Sept, 2010, Pic #18229
NATIONAL RENEWABLE ENERGY LABORATORY
Questions?
18
Acknowledgements •Thank you to…
• Bioenergy Technologies Office Algae Team (Valerie Sarisky-Reed, Daniel Fishman, Christy Sterner, Kristen Johnson, Christine English, Joyce Yang, Zia Haq, Alicia Lindauer)
• NREL researchers: Christopher Kinchin, Mary Biddy, Steve Phillips, Ling Tao, Phil Pienkos, Lieve Laurens, Nick Nagle, Eric Jarvis, Adam Bratis
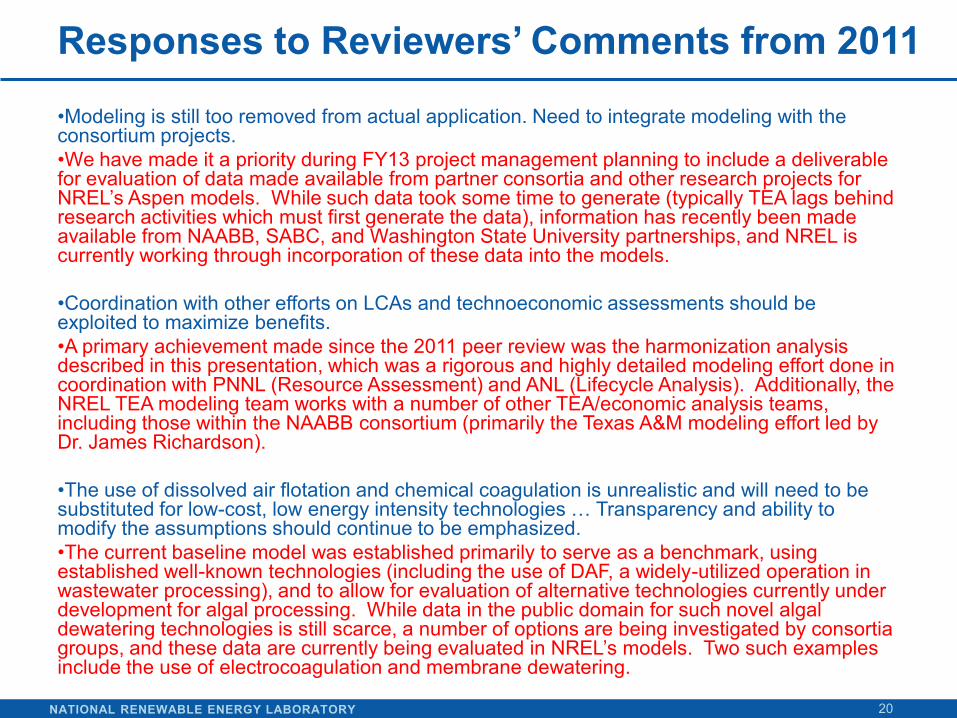
•Modeling is still too removed from actual application. Need to integrate modeling with the consortium projects. •We have made it a priority during FY13 project management planning to include a deliverable for evaluation of data made available from partner consortia and other research projects for NREL’s Aspen models. While such data took some time to generate (typically TEA lags behind research activities which must first generate the data), information has recently been made available from NAABB, SABC, and Washington State University partnerships, and NREL is currently working through incorporation of these data into the models. •Coordination with other efforts on LCAs and technoeconomic assessments should be exploited to maximize benefits. •A primary achievement made since the 2011 peer review was the harmonization analysis described in this presentation, which was a rigorous and highly detailed modeling effort done in coordination with PNNL (Resource Assessment) and ANL (Lifecycle Analysis). Additionally, the NREL TEA modeling team works with a number of other TEA/economic analysis teams, including those within the NAABB consortium (primarily the Texas A&M modeling effort led by Dr. James Richardson). •The use of dissolved air flotation and chemical coagulation is unrealistic and will need to be substituted for low-cost, low energy intensity technologies … Transparency and ability to modify the assumptions should continue to be emphasized. •The current baseline model was established primarily to serve as a benchmark, using established well-known technologies (including the use of DAF, a widely-utilized operation in wastewater processing), and to allow for evaluation of alternative technologies currently under development for algal processing. While data in the public domain for such novel algal dewatering technologies is still scarce, a number of options are being investigated by consortia groups, and these data are currently being evaluated in NREL’s models. Two such examples include the use of electrocoagulation and membrane dewatering.
NATIONAL RENEWABLE ENERGY LABORATORY
Publications and Presentations
21
Publications: •Davis, R.; Aden, A.; Pienkos, P.T. (2011). “Techno-economic analysis of autotrophic microalgae for fuel production.” Applied Energy (88); pp. 3524-3531. •Sun, A.; Davis, R.; Starbuck, M.; Ben-Amotz, A.; Pate, R.; Pienkos, P.T. (2011). “Comparative cost analysis of algal oil production for biofuels.” Energy (36); pp. 5169-5179. •Davis, R.; Fishman, D.; Frank, E.D.; Wigmosta, M.S.; Aden, A.; Coleman, A.A.; Pienkos, P.T.; Skaggs, R.J.; Venteris, E.R.; Wang, M.Q. (2012). “Renewable diesel from algal lipids: An integrated baseline for cost, emissions, and resource potential from a harmonized model.” ANL/ESD/12-4; NREL/TP-5100-55431; PNNL-21437. http://www.nrel.gov/docs/fy12osti/55431.pdf •Davis, R.; Biddy, M.; Jones, S. (2013). “Algal lipid extraction and upgrading to hydrocarbons technology pathway.” NREL/TP-5100-58049; PNNL-22315. http://www.nrel.gov/docs/fy13osti/58049.pdf, http://www.pnl.gov/main/publications/external/technical_reports/PNNL-22315.pdf •Biddy, M.; Davis, R.; Jones, S.; Zhu, Y. (2013). “Whole algae hydrothermal liquefaction technology pathway.” NREL/TP-5100-58051; PNNL-22314. http://www.nrel.gov/docs/fy13osti/58051.pdf, http://www.pnl.gov/main/publications/external/technical_reports/PNNL-22314.pdf Presentations: •Davis, R.; Aden, A. (2011). “Techno-economic analysis of microalgae-derived fuel production.” 33rd Symposium on Biotechnology for Fuels and Chemicals; Seattle, WA •Davis, R.; Aden, A. (2011). “Techno-economic analysis of microalgae-derived fuel production.” 2011 Algae Biomass Summit; Minneapolis, MN •Aden, A.; Davis, R.; Pienkos, P.T. (2011). “Algal biofuel pathway baseline costs.” DOE Algae Harmonization Workshop; Tucson, AZ •Pienkos, P.; Aden, A. (2012). “Forum: Algal biofuels modeling: Planning for a viable industry.” World Renewable Energy Forum; Denver, CO •Davis, R.; Aden, A.; Pienkos, P.T. (2012). “Integrated algal biofuel baseline analysis: Techno-economics from a harmonized model.” 2012 Algae Biomass Summit; Denver, CO
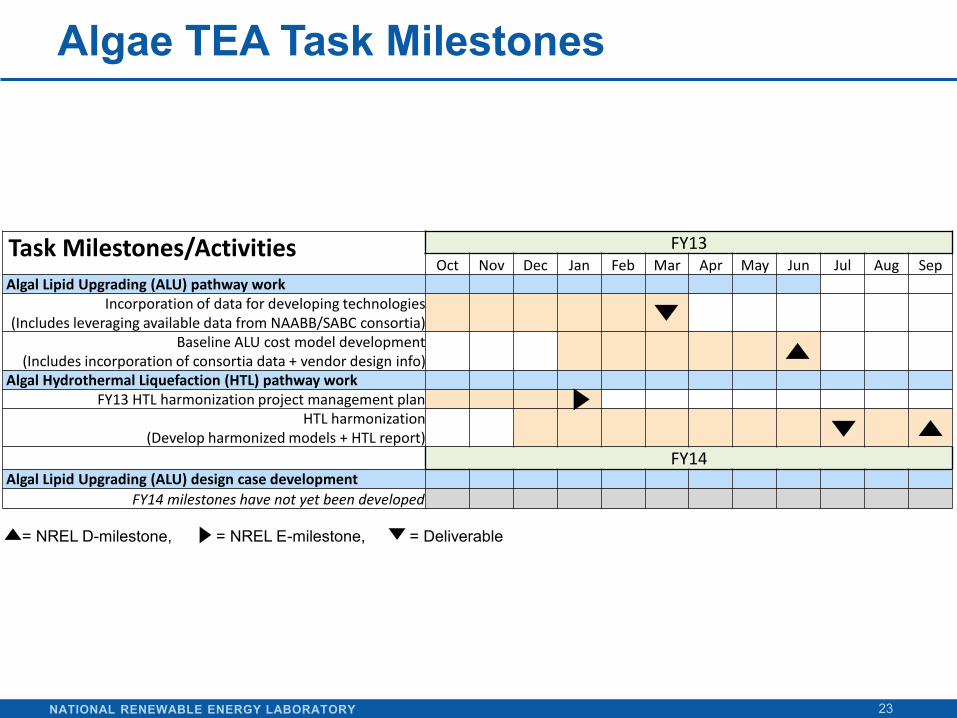
FY14 Algal Lipid Upgrading (ALU) design case development
FY14 milestones have not yet been developed
NATIONAL RENEWABLE ENERGY LABORATORY
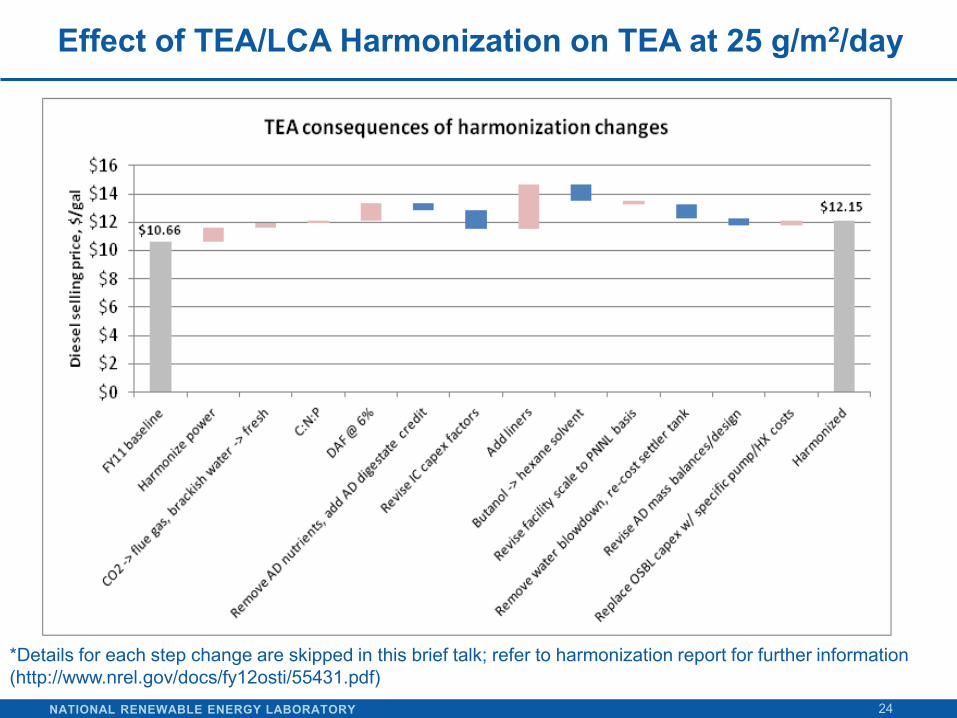
Effect of TEA/LCA Harmonization on TEA at 25 g/m2/day
24
*Details for each step change are skipped in this brief talk; refer to harmonization report for further information (http://www.nrel.gov/docs/fy12osti/55431.pdf)
NATIONAL RENEWABLE ENERGY LABORATORY
Harmonization with RA: Results for 5 BGY Scenario
25
•Consider season and location explicitly in harmonized LCA/TEA •Group 450 sites into representative “site groups” for manageable number of TEA Aspen runs •Set facility scale design capacity based on maximum productivity season for each group
Site Group # of Sites in
Group Productivity, g/m2/day
Net Water Loss (Evaporation-Precipitation), cm/day
Summer Fall Winter Spring Summer Fall Winter Spring
1 27 16.6 14.0 5.5 16.5 0.5 0.16 0.09 0.37
2 11 15.8 13.6 5.1 16.2 0.36 0.12 0.03 0.21
3 60 14.8 13.2 4.3 15.8 0.17 0.05 0.002 0.06
4 49 16.5 12.6 2.8 15.0 0.04 0.01 0.001 0.02
5 16 16.0 12.9 3.4 15.9 0.03 0.004 0.001 0.04
6 77 16.3 13.5 4.5 16.2 0.04 0.01 0.003 0.08
7 82 16.1 14.4 6.5 16.9 0.05 0.01 0.01 0.11
8 124 15.4 15.4 10.0 17.6 0.03 0.01 0.02 0.15
Total weighted average 13.2 0.06
Compute TEA results by grouping individual sites according to location
NATIONAL RENEWABLE ENERGY LABORATORY
Harmonization: Nonlinear Response
26
•Similar to LCA results, TEA exhibits high cost sensitivity to lipid content and productivity at values < 20% or 20 g/m2/d
• Baseline at 13.2 g/m2/d = unstable portion of curve (higher error margin)
•Lipid content exhibits stronger cost impact than productivity • Key result for R&D: more “bang for the buck” increasing lipids
NATIONAL RENEWABLE ENERGY LABORATORY
Alternative scenarios: projecting cost improvements
27
Four alternatives at 12.5 g/m2/day • Combination of all improvements reduces selling price nearly 50% at >25% lipid • Note, LEA @ $350/tonne gives nearly the same coproduct credit as AD Improved scenario at 12.5-50 g/m2/day • Combination of all improvements above